geometry of the midcaps ($MDY)
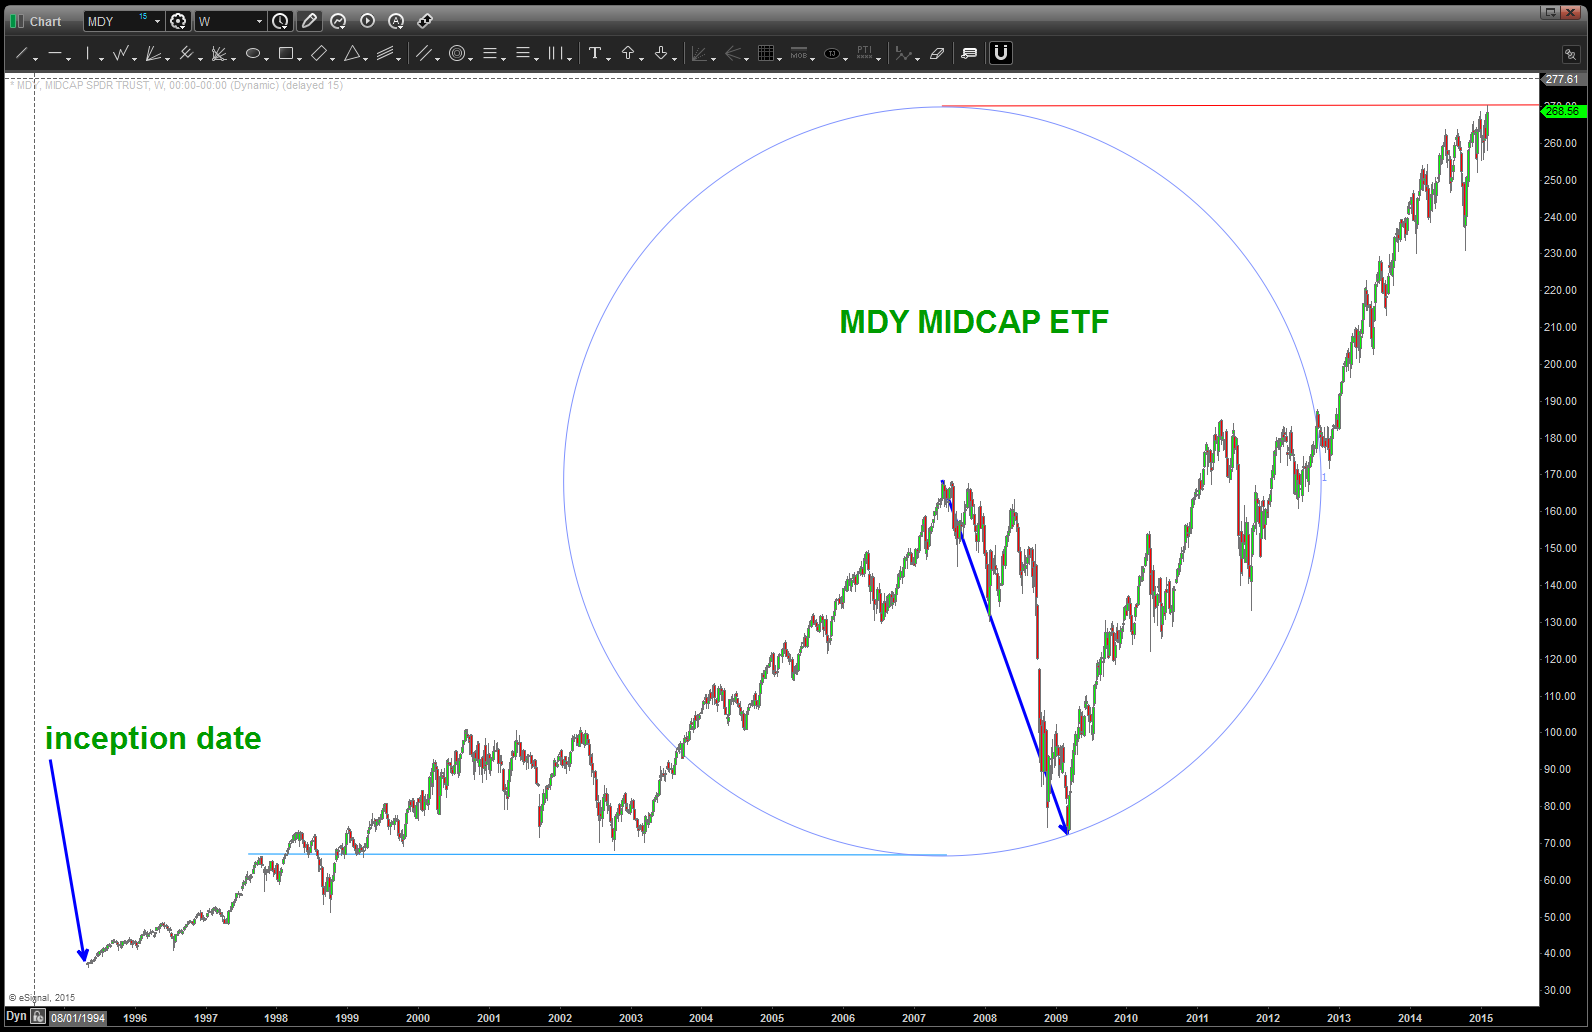
I like the tops and bottoms of circles … they are pretty powerful and not often used in the technical analysis community. the reason they work is another subject for another time. if you would like to know a little bit about their formation and their cyclical (price and time) characteristics hit me on email.
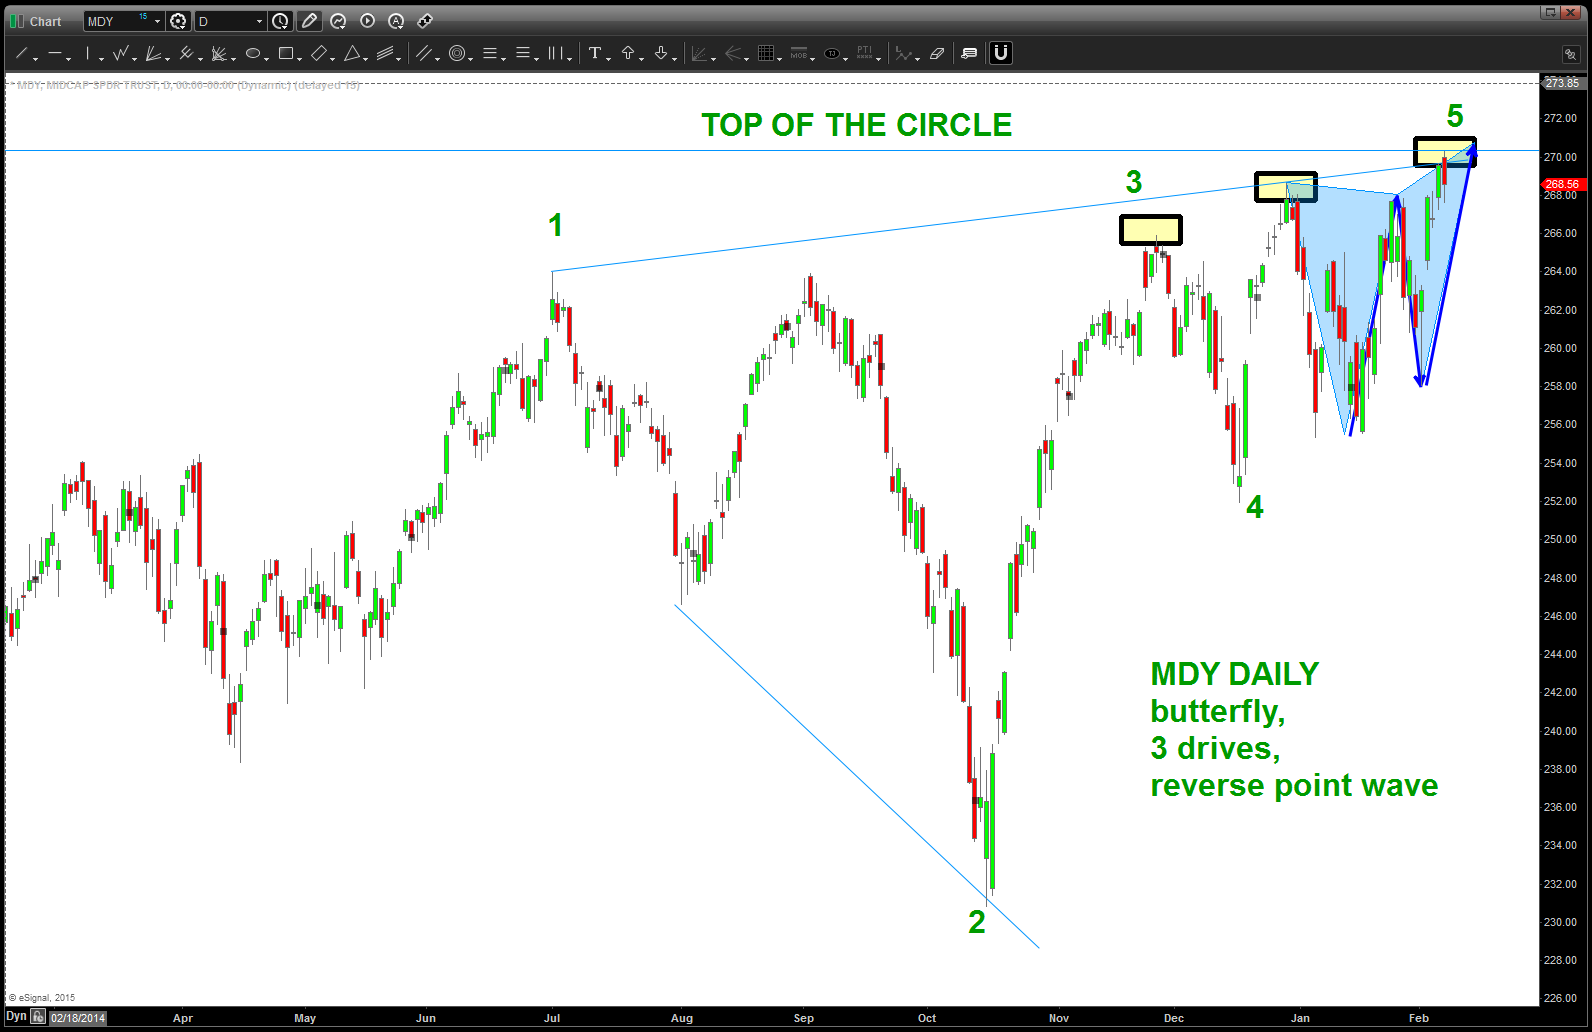
take a look at the mid-caps … perfect hit on Friday of the “top of a circle” and on a daily chart we had 3 very powerful sell patterns hitting at the same time.
watch this for weakness … if it let’s loose and busts thru the to the other side higher then let it breathe for a while and it will come back to 270 for the opportune time to get long.
in the meantime … let’s see if the top of the circle holds, or not.
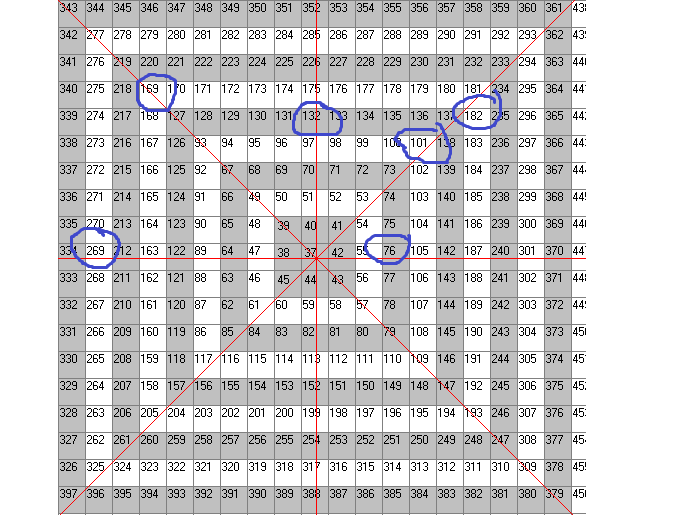
square of 9 targets. note – all on axis for major high and lows

Hi, I would be very interested in learning more about the use of circles. Also, are there any books, articles or videos relating to Gann techniques and the use of square roots that you would recommend please? Many thanks, Barry
Barry, I would start w/ this as a foundation. It’s an amazing book and lays out the numbers and patterns very nicely – http://www.constructingtheuniverse.com
thanks for visiting the site and once your done w/ the above hit me back and I’ll point you to some other works! Cheers!