

German Dax – hit top of circle
XLP/NYA hit a nice buy pattern on Friday and based on the entire days action, there is another “minor” buy pattern appearing. if both of these hold, then the staples should continue to outperform which traditionally causes equity weakness.
if we lose the levels, then we have the .786 ratio a little lower … either way, the ratio should NOT take out the January 20 low, for now, as that was a pretty big target. sure looks like probability favors more upside for the ratio next week.
the last post on the XLP/NYA ration and the very important support which I submit is the “cause” of the recent weakness: https://bartscharts.com/2021/01/24/ratio-analysis-key-level-hit-on-the-xlp-nyse-index/

we have a very KEY level of support on the XLP/NYSE Index ratio.
as you can see below … we have the measured move (dashed red line) equal to the largest correction in the ratio since the low in 2007 and w/ that the lowest level on the RSI in 12+ years. note, a bullish divergence does not appear to be needed for the ratio to find support …sometimes there was some bullish divergence and other times it just hit the support level and reverse higher. I do think it’s necessary to to take this into account.
then, we have a significant amount of math coming into this level w/ the .786 retracement from the last swing low hit last week.
lastly, we have key trend line support a little lower … this is a “good” trend line because you can see that it was respected as resistance when we copy/pasted the lower trend line onto the higher prices to create the blue trend channel … bottom line is to expect support in the ratio.
so now to the IF and THEN statement of using PATTERNS.
IF the ratio does find support THEN the equity market should correspondingly correct/move lower. ELSE, a blow thru to the downside of the ratio will make the market continue higher and, perhaps, w/ force.
we will be in that key decision making process – next week.
the second chart is just showing the NYSE Index overlaid on top of the ratio .. as you can see when the ratio finds support, the market corrects – every time.


If you have gone down the rabbit hole that I have (hint it never stops) then you uncover tidbits of information that you would never think were important but one of those moments of “that’s cool” and move on …
I am eyeing a NICE currency position and then ended up cruising around the charts and was looking at Monthlies on a bunch of stuff. The charts reminded me of some of my early market music stuff and I figured I would go back and check em out …
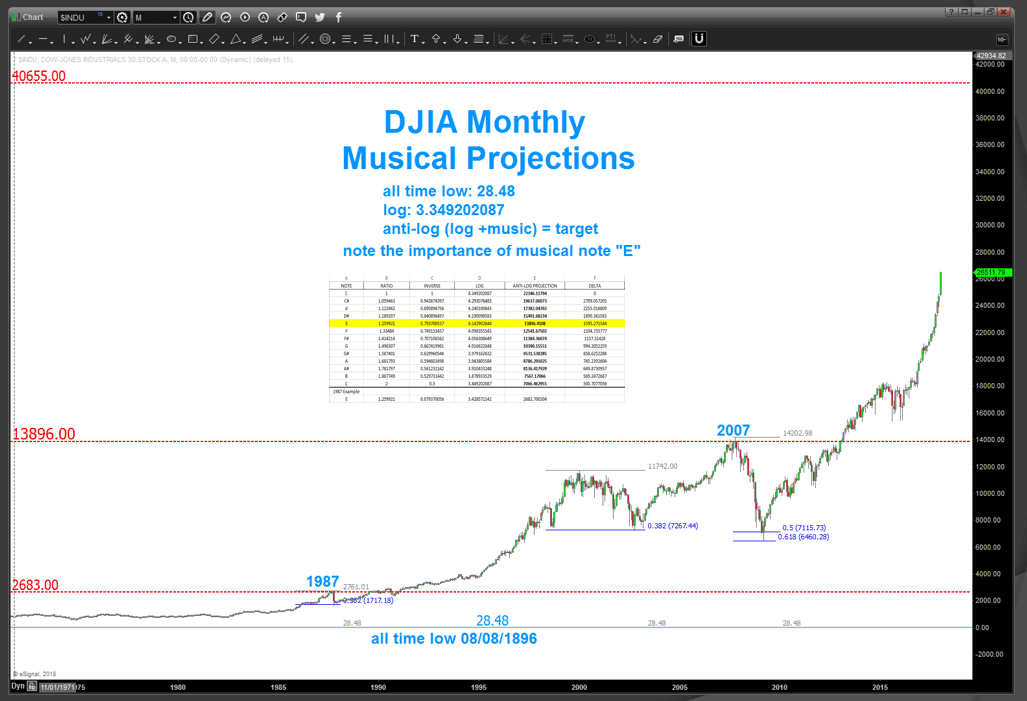
Came across this long term DJIA chart ( I won’t bore you the importance of logs, numerology, blah blah and read the first sentence above. :)) It’s a technique for price projections that I learned from my friend and mentor, Michael Jenkins (www.stockcyclesforecast.com – RECOMMEND), and the results were pretty astounding.
I’ve shown some past blogs around the importance of the number 28.48. It’s a key PRICE NODE that has been at most tops and bottoms. So using it as a projection technique? Why not!
Then, you know I love music so … why not combine them w/ rates of change (logs) and … well the result is below. The use of logs and musical note ratio’s from the all time low on the DOW have been almost exactly the price using the log projection w/ the musical note E ratio.
The next appearance of this PRICE is 40,655 as annotated on the chart. One last, take a note of the blue arrows. the basic AB=CD lands, close enough, right on our target.
At this rate, from a timing perspective, it’s not that far off now is it ….?
Cycles are lining up, just saying.
Bart
below, note the symmetry of the projections and how, at least for now, EVERY MOVE, has been equal to each other and aligned w/ the Golden Mean.

while we came close to our upper targets, we never actually hit them but based on this price action I’m going to assume that we have a near term top in place for a much needed correction to relieve the steam.
this is very preliminary but I’m using the past to project into the future .. using the past “percentage” and “price” corrections (dashed red and orange arrows respectively) I’m projection DOWN into logical support areas simply because that is what worked last time …
additionally, I put a “basic” retracement grid from the ATL to the ATH. some nice synergies appearing.
once all that was done I drew some “basic” trend channels (light blue and red lines) and those can always act as support based on polarity …
plus a couple “two tree” (slang from the Navy) gaps were left on the way up so they will also act as support.
now?
we wait … wait for the form, balance and proportion to signify that this correction is complete. the last one was almost 9 months long.
I’ll be monitoring, closely.

the last time we blogged about the GDOW we saw a pattern and the AB=CD and warned of another possible move down … we got a 36% correction from the AB=CD. what is fascinating, is the correction from 2007-2009 was related to the most recent correction by … yup, 1.618. if you take the correction from 2018-2020 and multiply it by 1.618 you will get the 2007-2009 correction in percentage terms.
anyway, in another 10% or so we are going to have a major test for the Global Dow.

SHEESH …. all I can say.
and, objectively, STRICLY LOOKING AT THE CHARTS, this sure looks/smells like 3rd of a 3rd action so I’m updating my count.
it BLEW THRU the first two targets at 23K and 34K and now I’m eyeing 43-45L and 51K
does this mean the run in bitcoin is over – I DO NOT think so.
as you can see, I believe we have higher to go, much higher.
coming up w/ targets allows one to manage risk and, potentially, pyramid for doubling or tripling of prices in the future.
what should we expect – VERY violent and liquidating corrective moves (operative saying – corrective) to give one an opportunity to ADD their to ones position.

for those w/ an equity only account here’s GBTC the Bitcoin Investment Trust. nice target hit (a 1.27 extension and 3.142 projection) w/ a pullback occurring – BUT look at the size of the candle and the appropriate volume. glad SOMETHING respected a level (LOL) but don’t think it’s the end of this wave – yet.
bitcoin … who’d a thunk it.
good weekend to all of you – Bart
if your a conservative you’ll be happy and if your a liberal you will be angry … (having fun folks) but, either way, a SELL PATTERN is complete on Twitter. For the pattern to be considered it should not go above 62.
at a minimum, expect a potential double digit move lower.

the last time blogged about TBT was here: https://bartscharts.com/2020/03/08/tbt-buy-no-im-not-crazy/
doing an update as we can see the well defined downtrend that has been in place since, pretty much, inception in 2008.
if you followed some of the other Bond work on the site then you would know our thesis is there is a MAJOR HIGH in bonds (TBT is the inverse) so, we could be, perhaps, looking at the very beginning of a BIG run in TBT.
yes, interest rates to rise and, potentially, rise VERY fast …. hang on.
