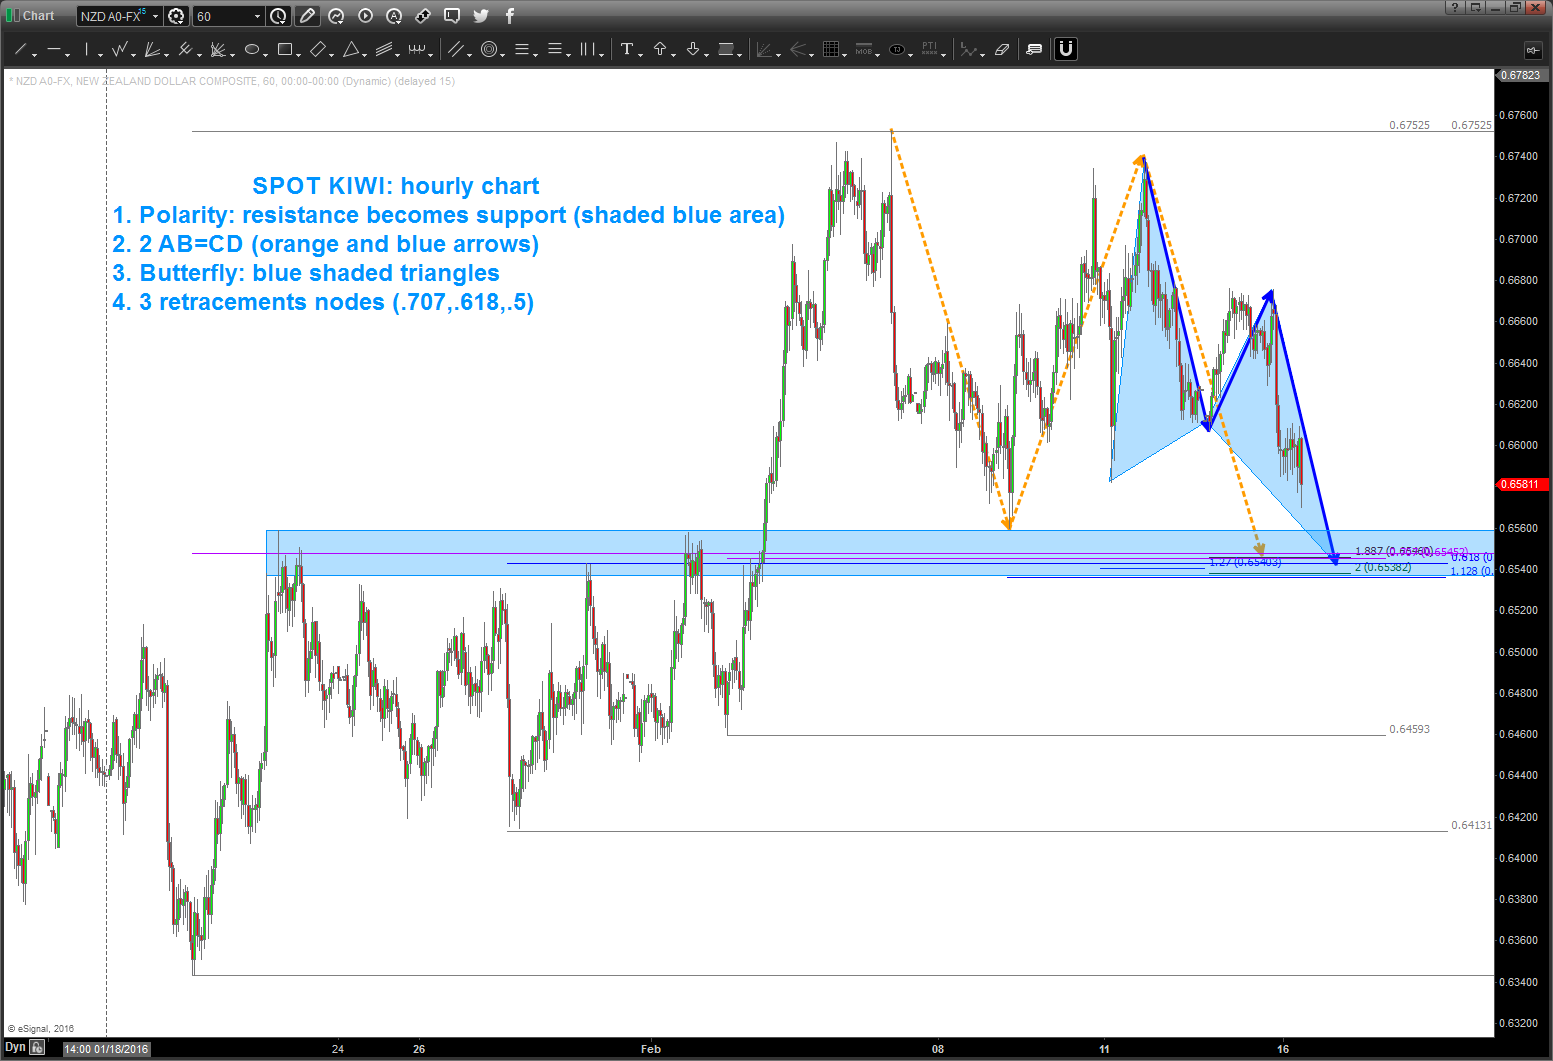
Kiwi and the tale of 6 ratio’s, polarity principle and 2 AB=CD’s
Posted on February 16, 2016 Leave a Comment
yes, please.
the ONLY reason YES is because I know where I’m wrong and can manage risk.
I’m RIGHT 100% of the time because I know where the PATTERN fails ….
NICE …
Bart
PS — could completely fail.
PS — watch Cotton and Milk for intermarket confirmations

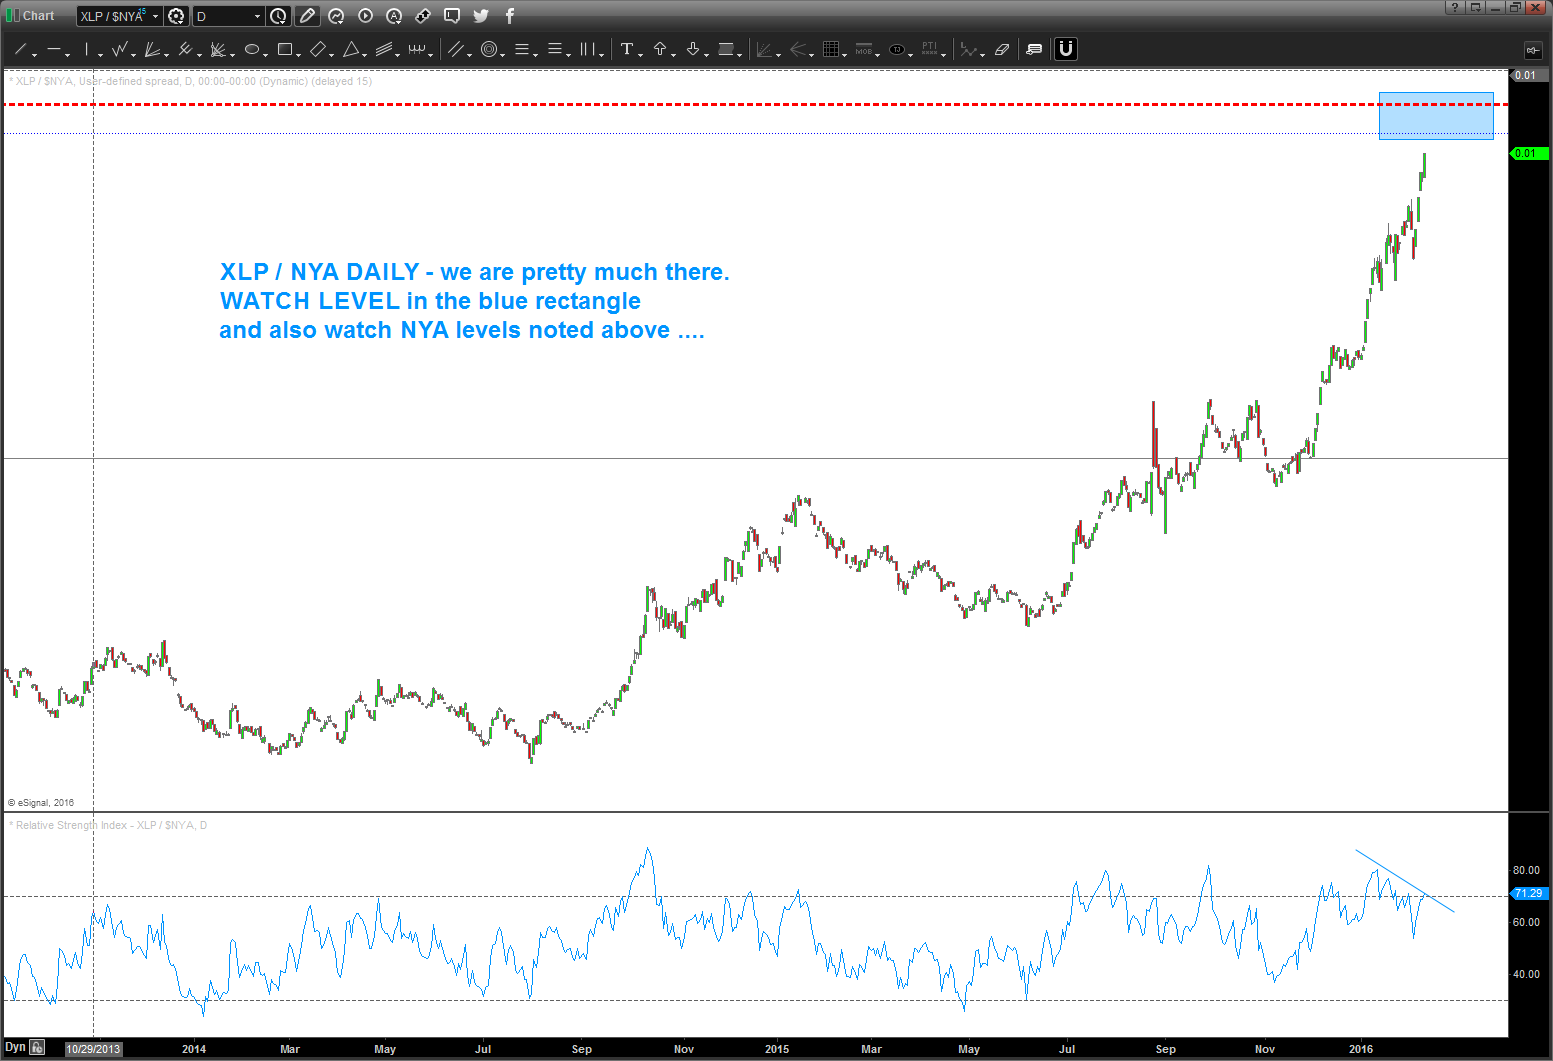
coming into tomorrow we are pretty much there….2/12/2016
Posted on February 11, 2016 2 Comments
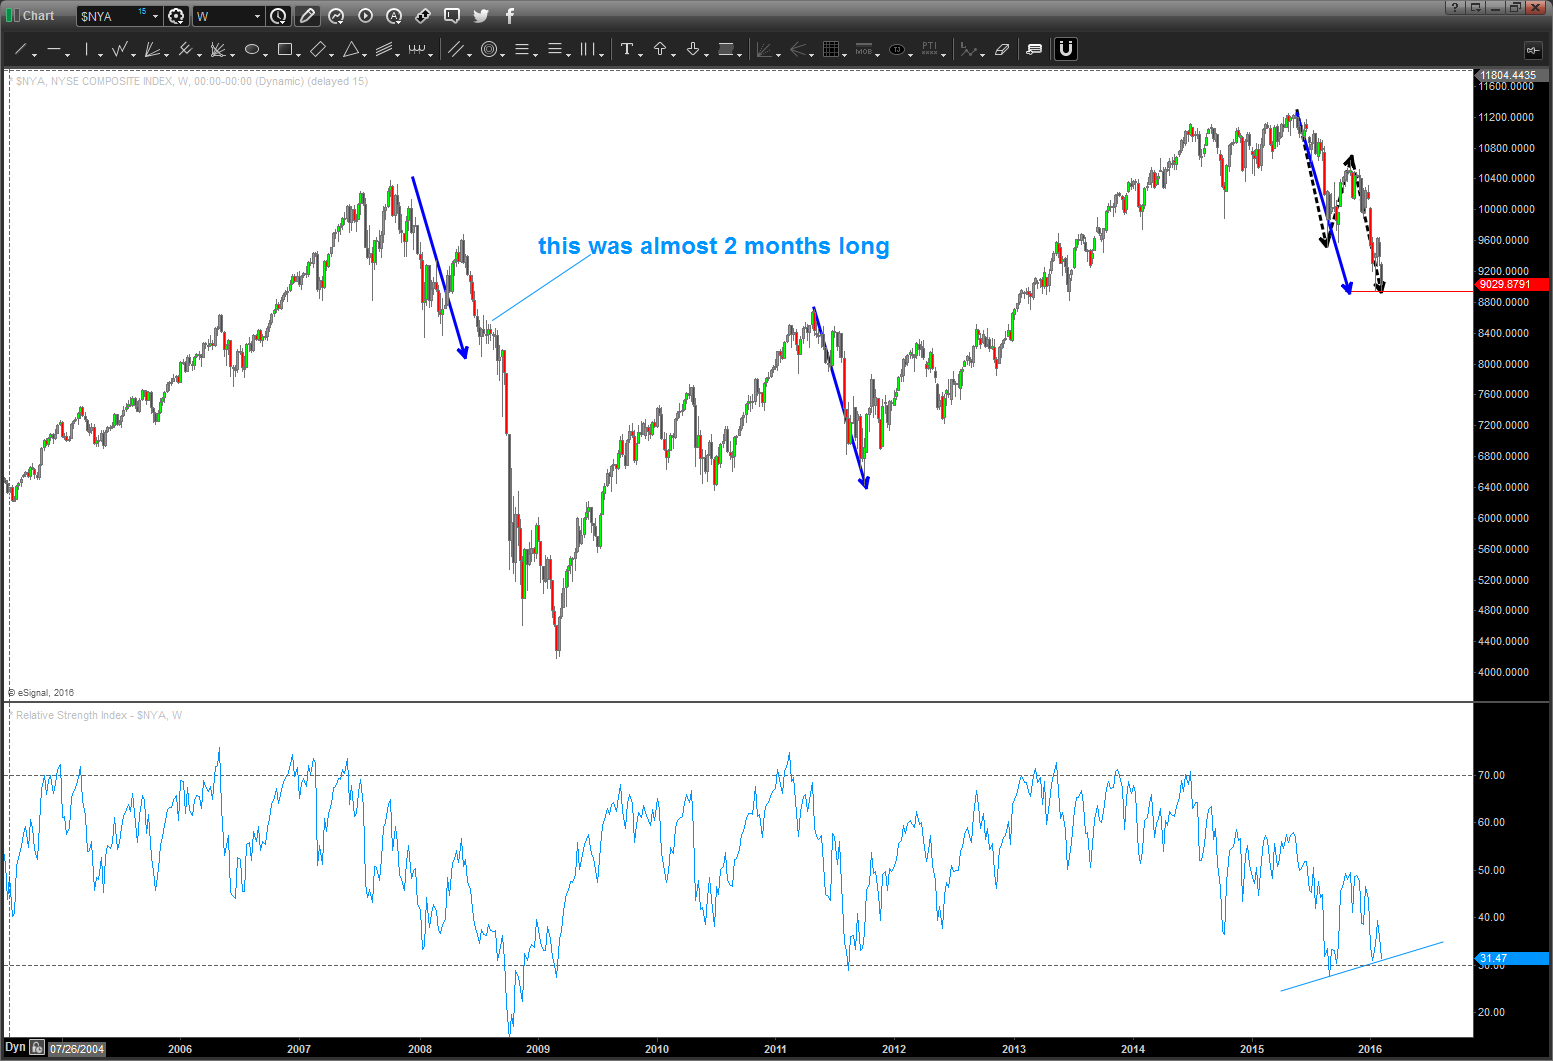
note the $NYA chart below ….
- blue arrows represent the largest corrective move since 2009
- in the 2007-2008 financial panic this measured move held the market at bay for almost two months
- can you imagine the talking head pundits on CNBC BS’ing about that for two months … blah blah blah.
- we also see the dashed black arrows projection to the exact level as the measured move
- we have weekly bullish divergence present on the RSI
- plus, we are a couple ticks shy of the XLP / NYA ratio in an arena of overbought more than 2009.
so, if were going up … sure looks like it’s about time for that to happen.
here we go …
PATTERNS do FAIL ..
Posted on February 11, 2016 Leave a Comment
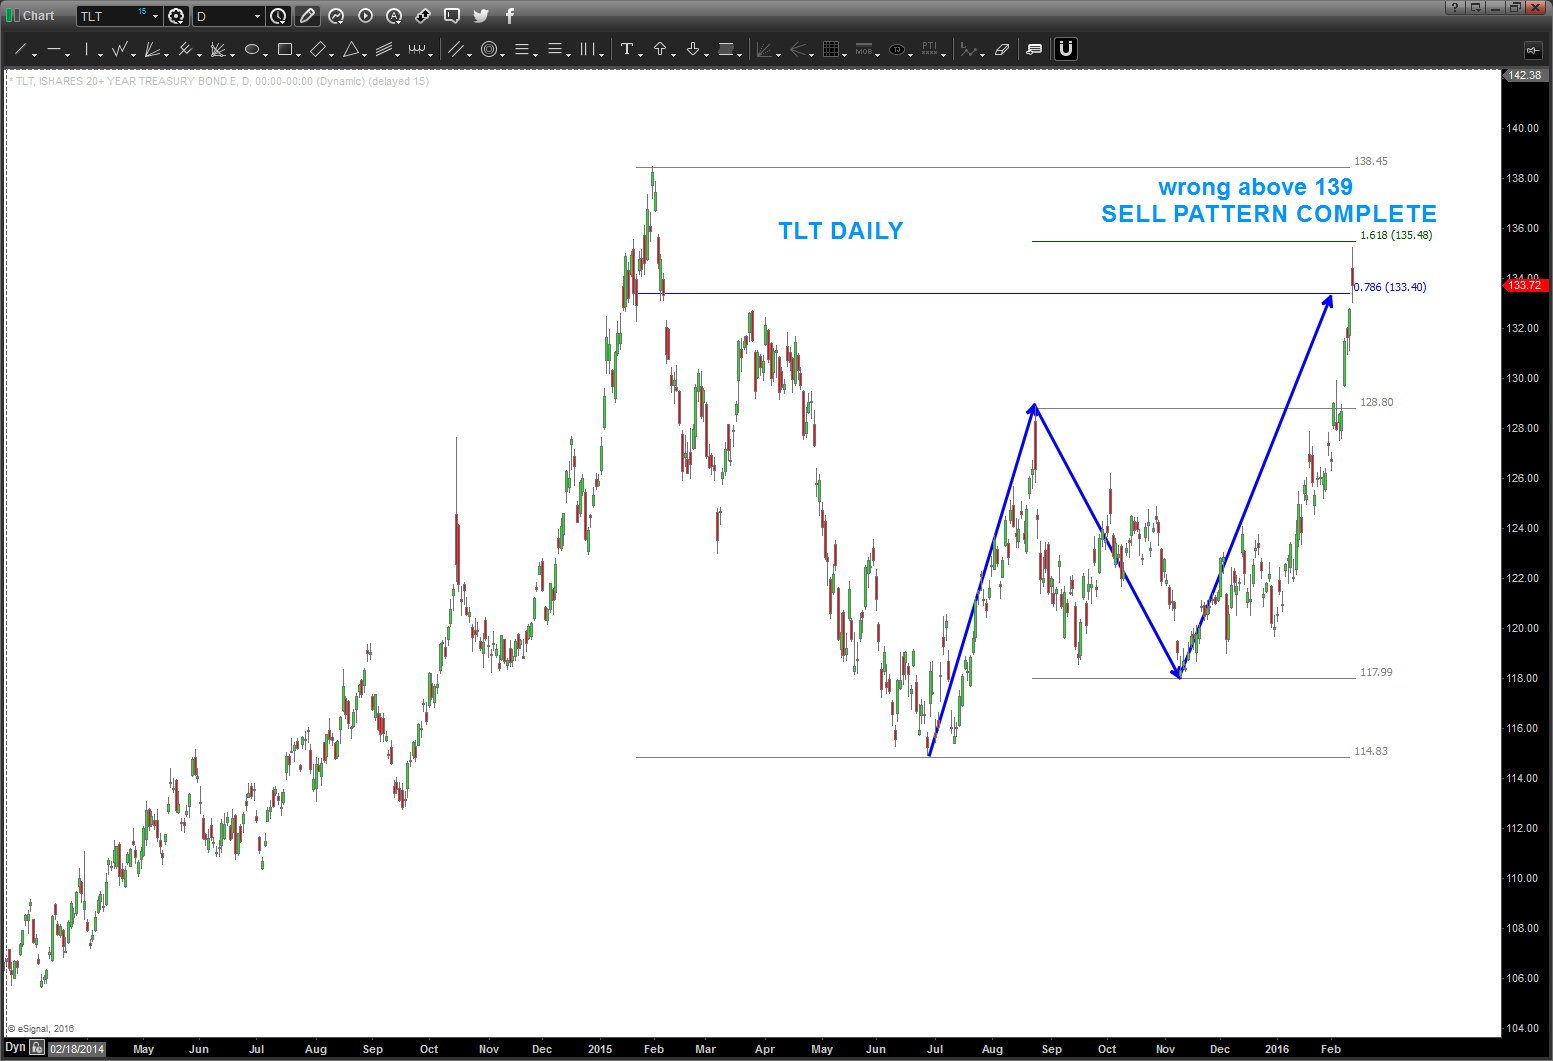
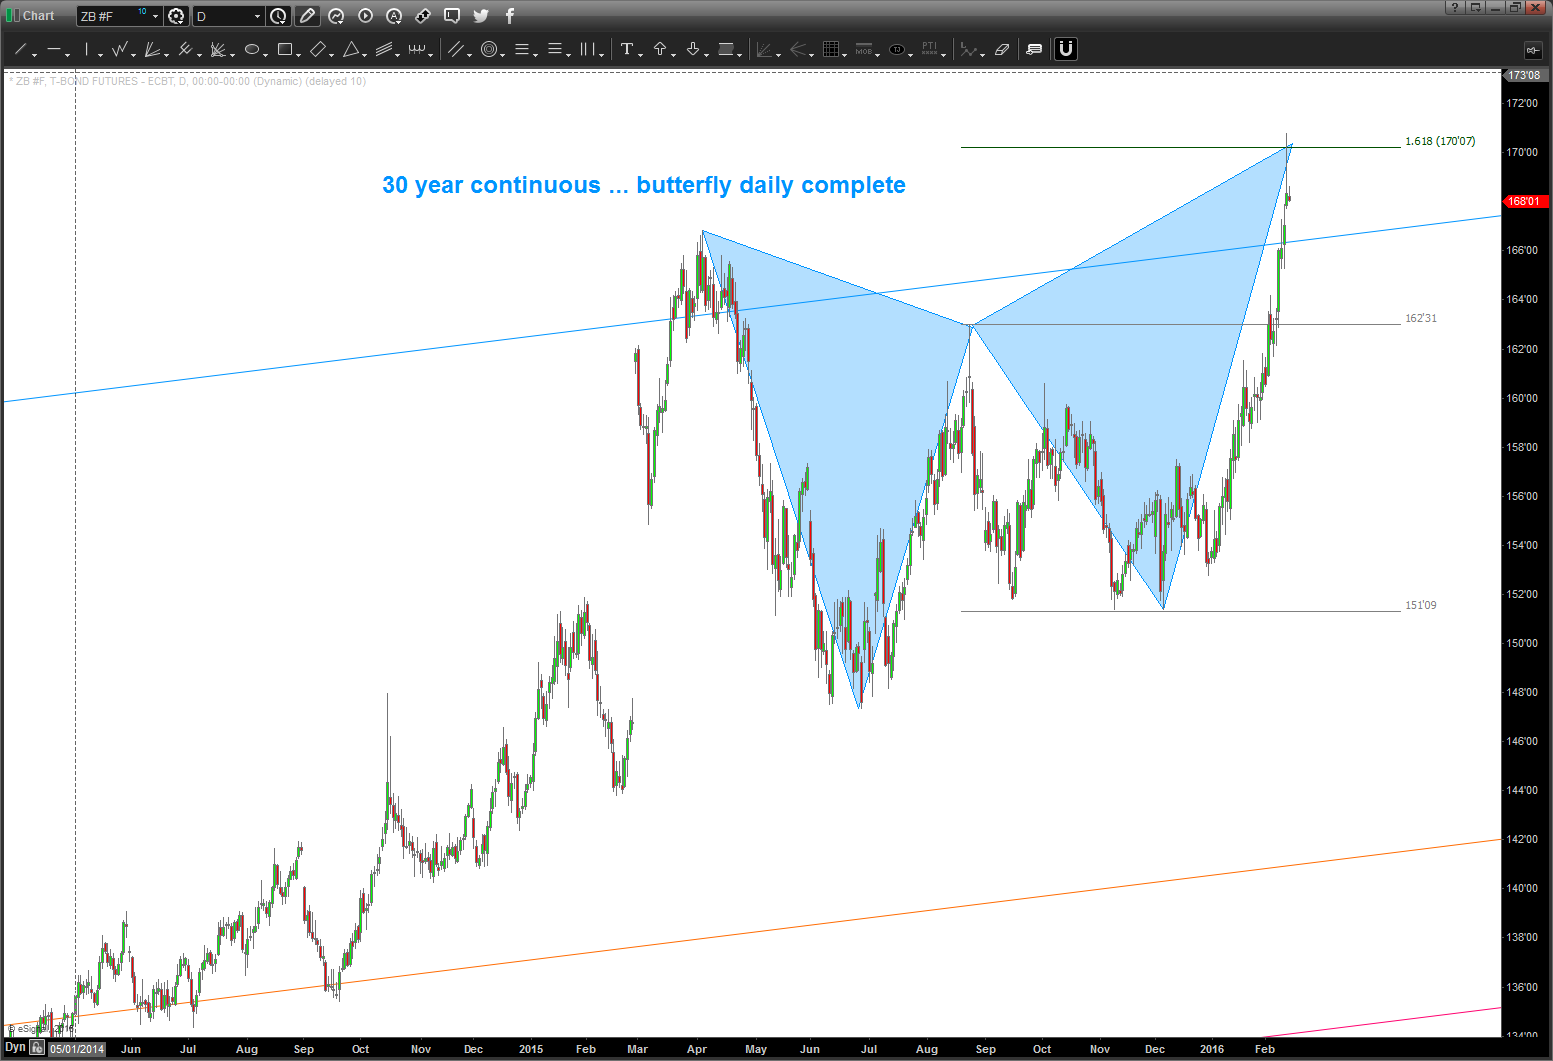
here’s the great thing about pattern recognition … you don’t make “great calls” or “fundamentalize anything” you just simply find a pattern and – sometimes they work and sometimes they don’t.
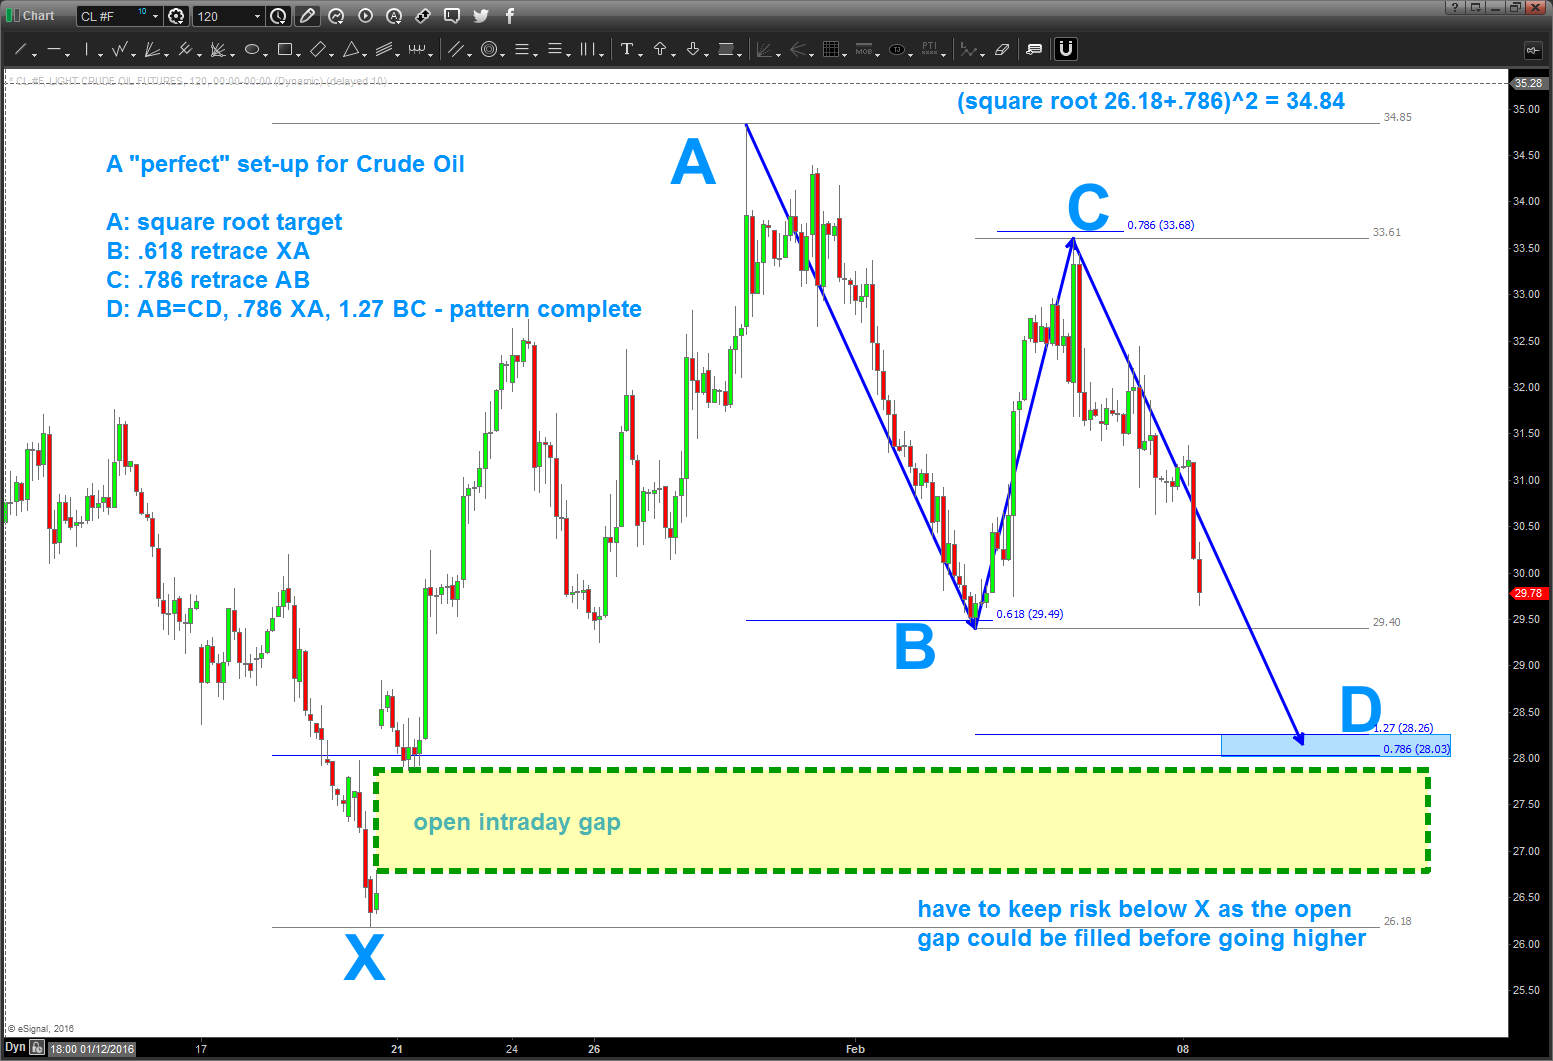
Crude – didn’t but remember, we did have that unopened gap below the pattern .. but it didn’t.
TSLA – didn’t and it took off running.
so as you continue to build your ability w/ in pattern recognmition – use a stop and realize that it is not YOU who failed but the PATTERN.
Keeps you in the game, mentally …something that is always a work in progress for me.
B
Ripley’s Believe it or not …
Posted on February 10, 2016 Leave a Comment
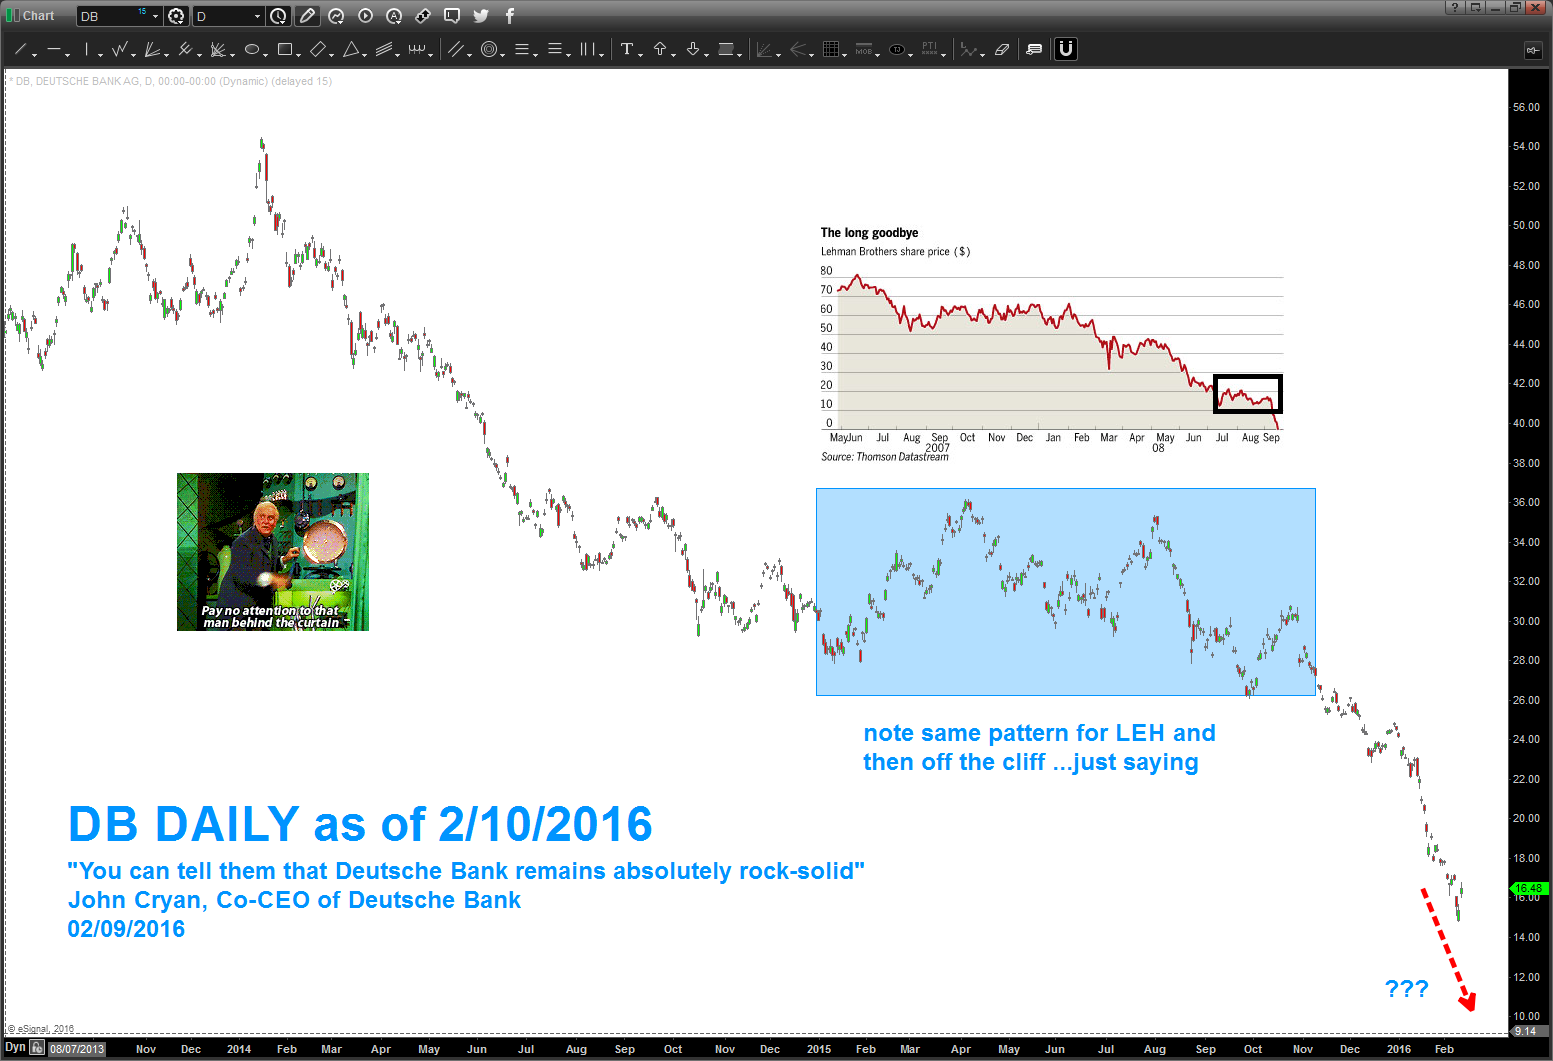
“The third-quarter and nine-months revenues not only illustrate the balance Lehman Brothers has achieved among its equity, fixed income and investment banking businesses, but also show the financial and strategic potential of new businesses the firm has been building, including private equity and high-net-worth activities,” Richard Fuld, former CEO of the former LEH
“You can tell them that Deutsche Bank remains absolutely rock-solid, given our strong capital and risk position. On Monday, we took advantage of this strength to reassure the market of our capacity and commitment to pay coupons to investors who hold our Additional Tier 1 capital. This type of instrument has been the subject of recent market concern.” John Cryan, Co-CEO of Deutsche Bank
just a little higher till pattern completes .. and we surpassed 2009 lows for the RSI
Posted on February 9, 2016 2 Comments
was talking to a money manager at my son’s basketball practice tonight and he was talking all kind of nonsense about some fundamental stuff … I just pulled out my Iphone and showed him @bartscharts and said “here, read this.”
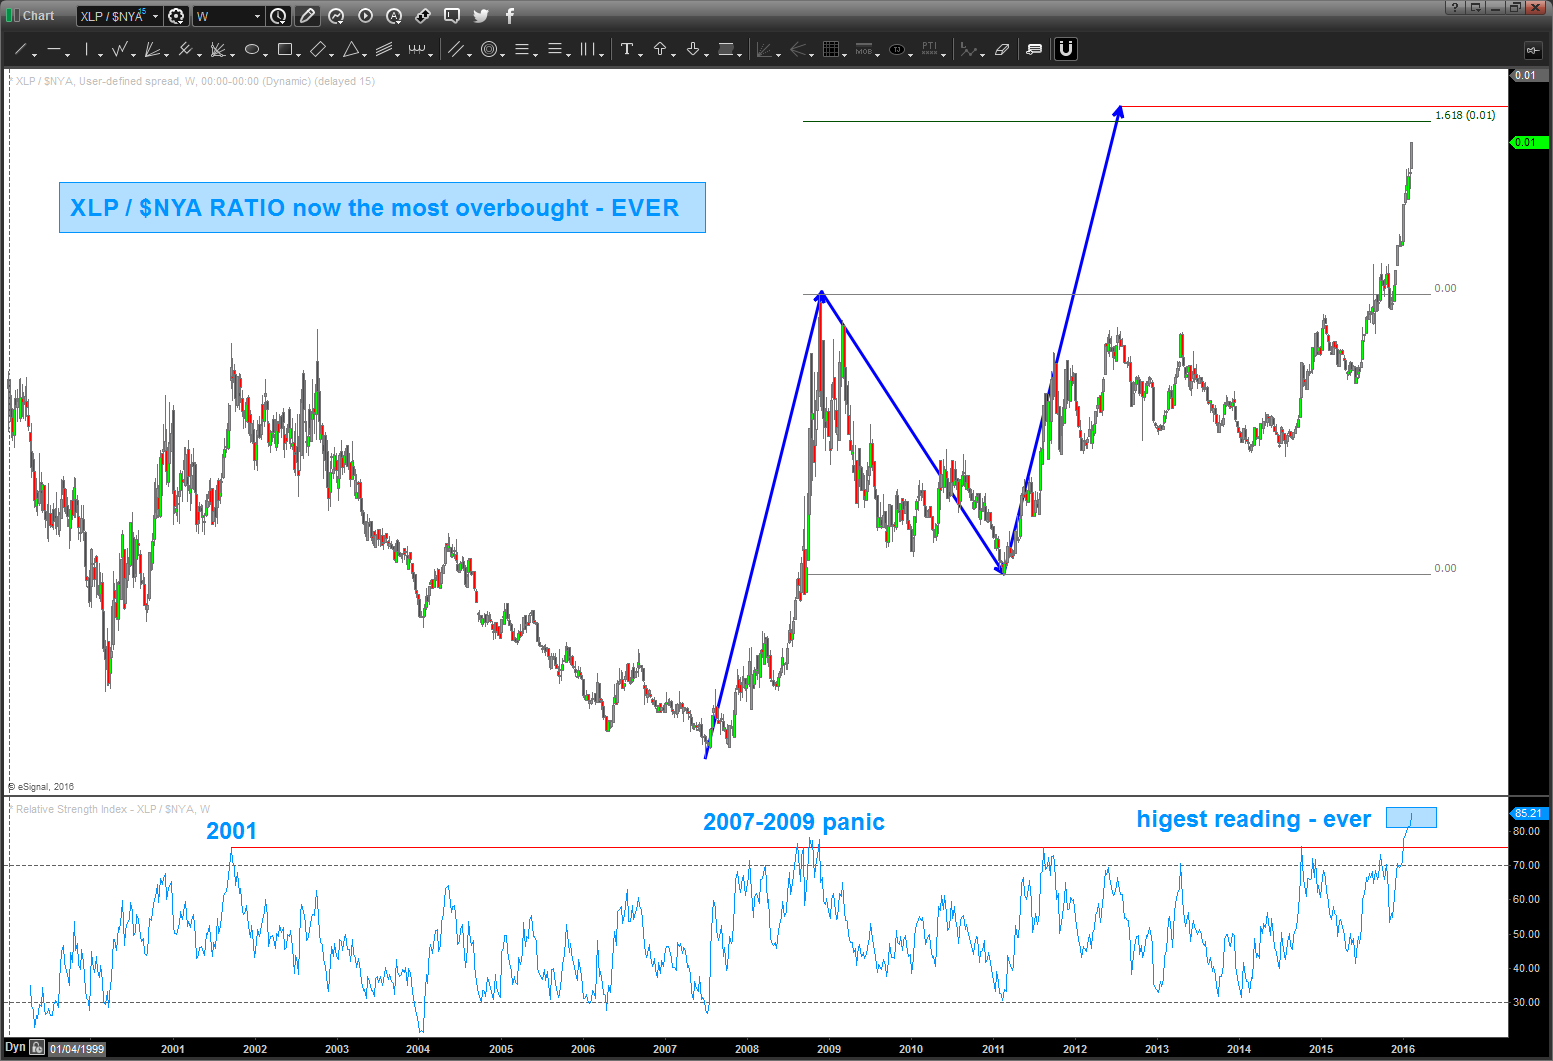
thus far, this ratio has been SPOT ON w/ providing market inflection points … its shows “risk on” and “risk off” flow of funds and in times of risk off the big guys go to shitter paper, toothpaste, canned goods and blah blah blah ….so, on this weekly chart, you’ll see a SELL PATTERN on the ratio which IF IT HOLDS is good for equities. personally, not doing a darn thing till that pattern is hit …
the probability that the ratio sells off (along w/ equities going higher) is increased due to the face that since the XLP came into existence, the RSI has never been this high …so, stay tuned but don’t go long equities till this pattern is hit …
B
ain’t nobody LONG the Aussie vs USD .. perhaps you should think about it?
Posted on February 7, 2016 Leave a Comment
AUSSIE
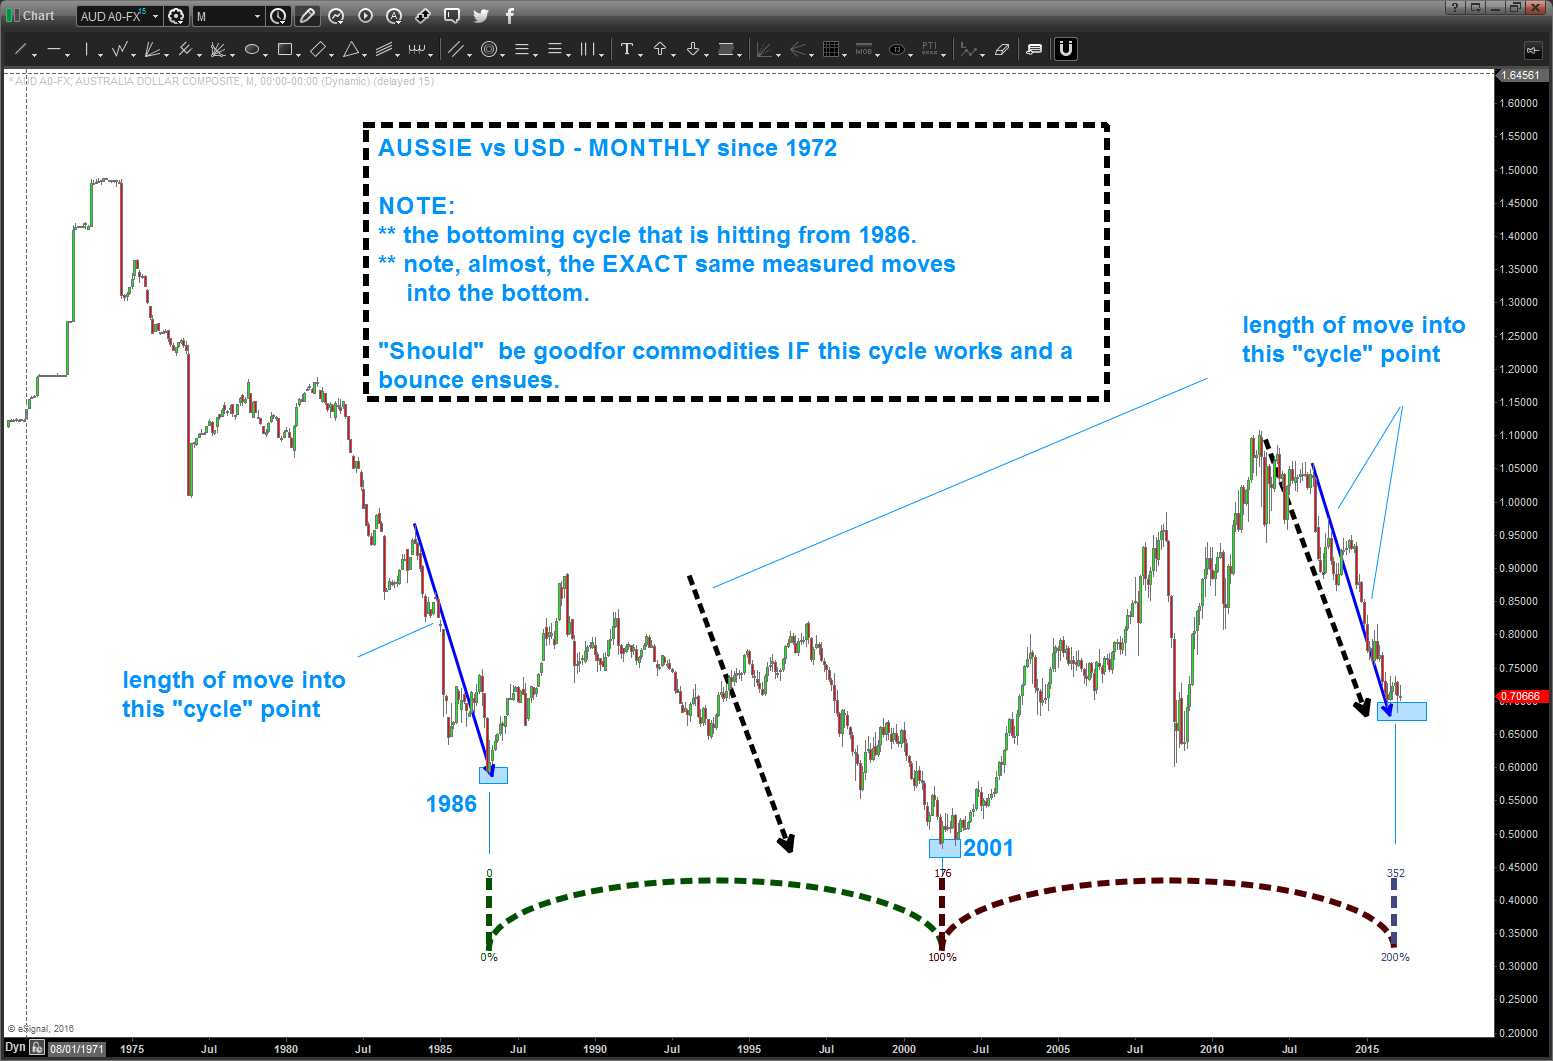
- monster cycle hitting this month from 1986 on Aussie.
- take note of the “measured moves in price” coming tino the 1986 and 2001 low .. they are the same footprint
- very oversold w/ bullish divergence
GASOLINE FUTURES
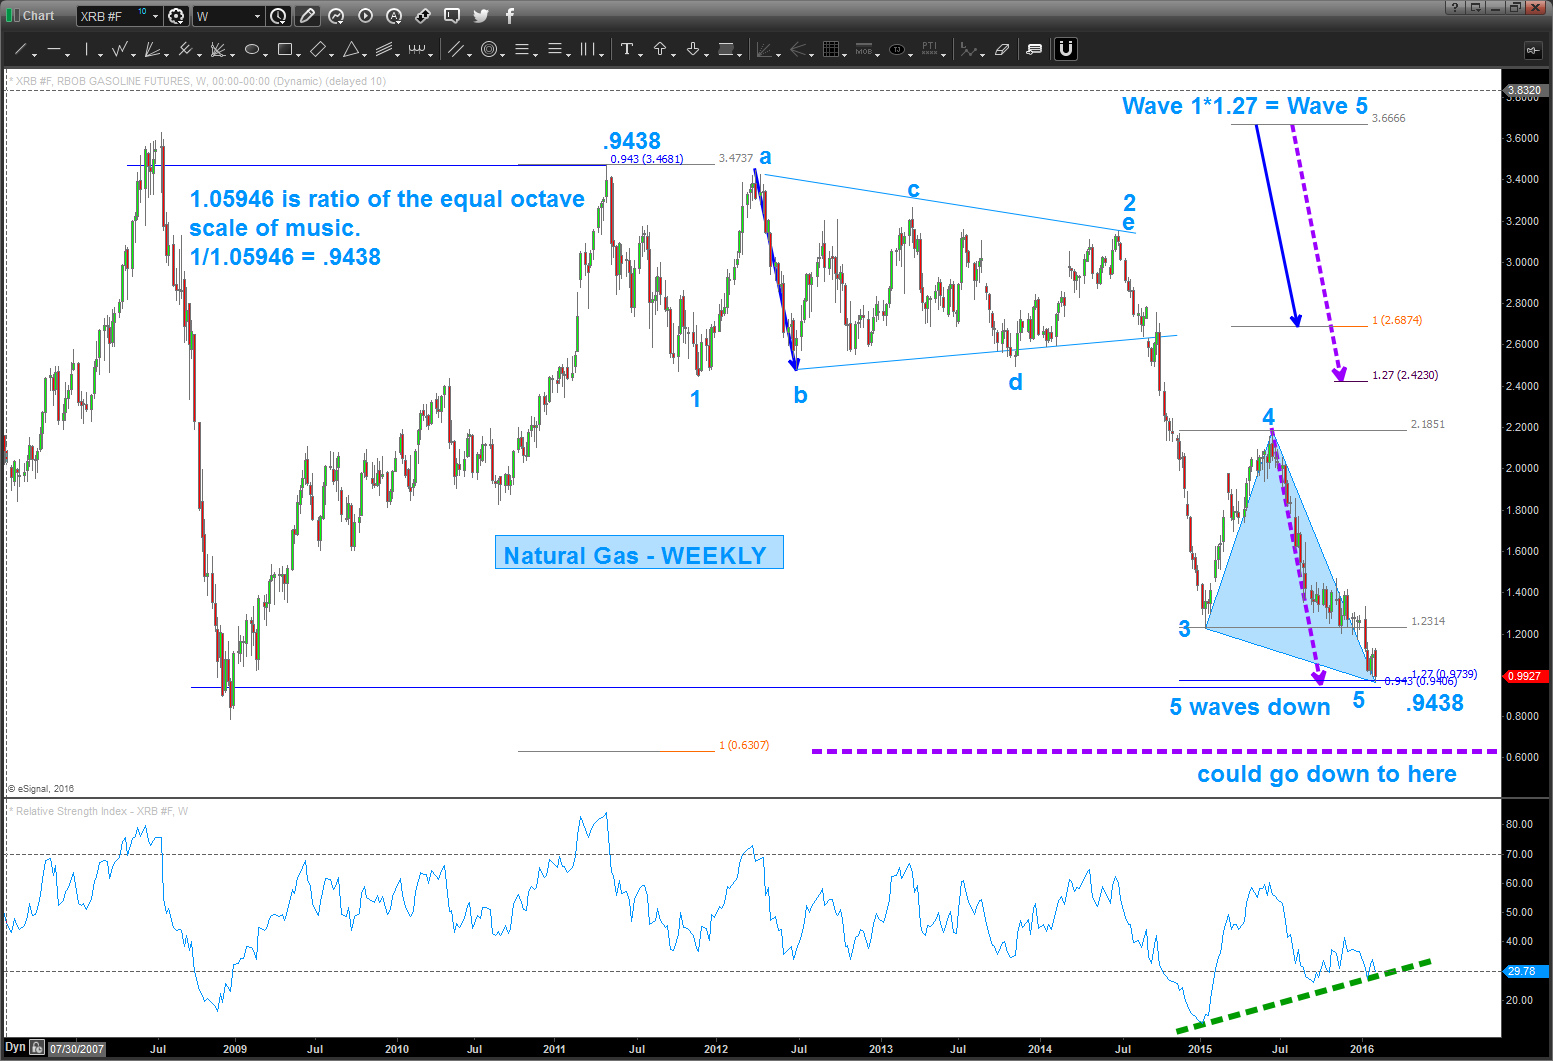
- note, 5 waves down on natural gas
- .9438 symmetry
- 1.27 extension
- 1.27 wave 1 = wave 5
- monster bullish divergence …