the next move in $TLT is “probably” DOWN …
folks, it’s ALL probability and as a pattern recognition trader that’s all you worry about. When a pattern appears it’s simply a probability it’s going to work OR not … that simple.
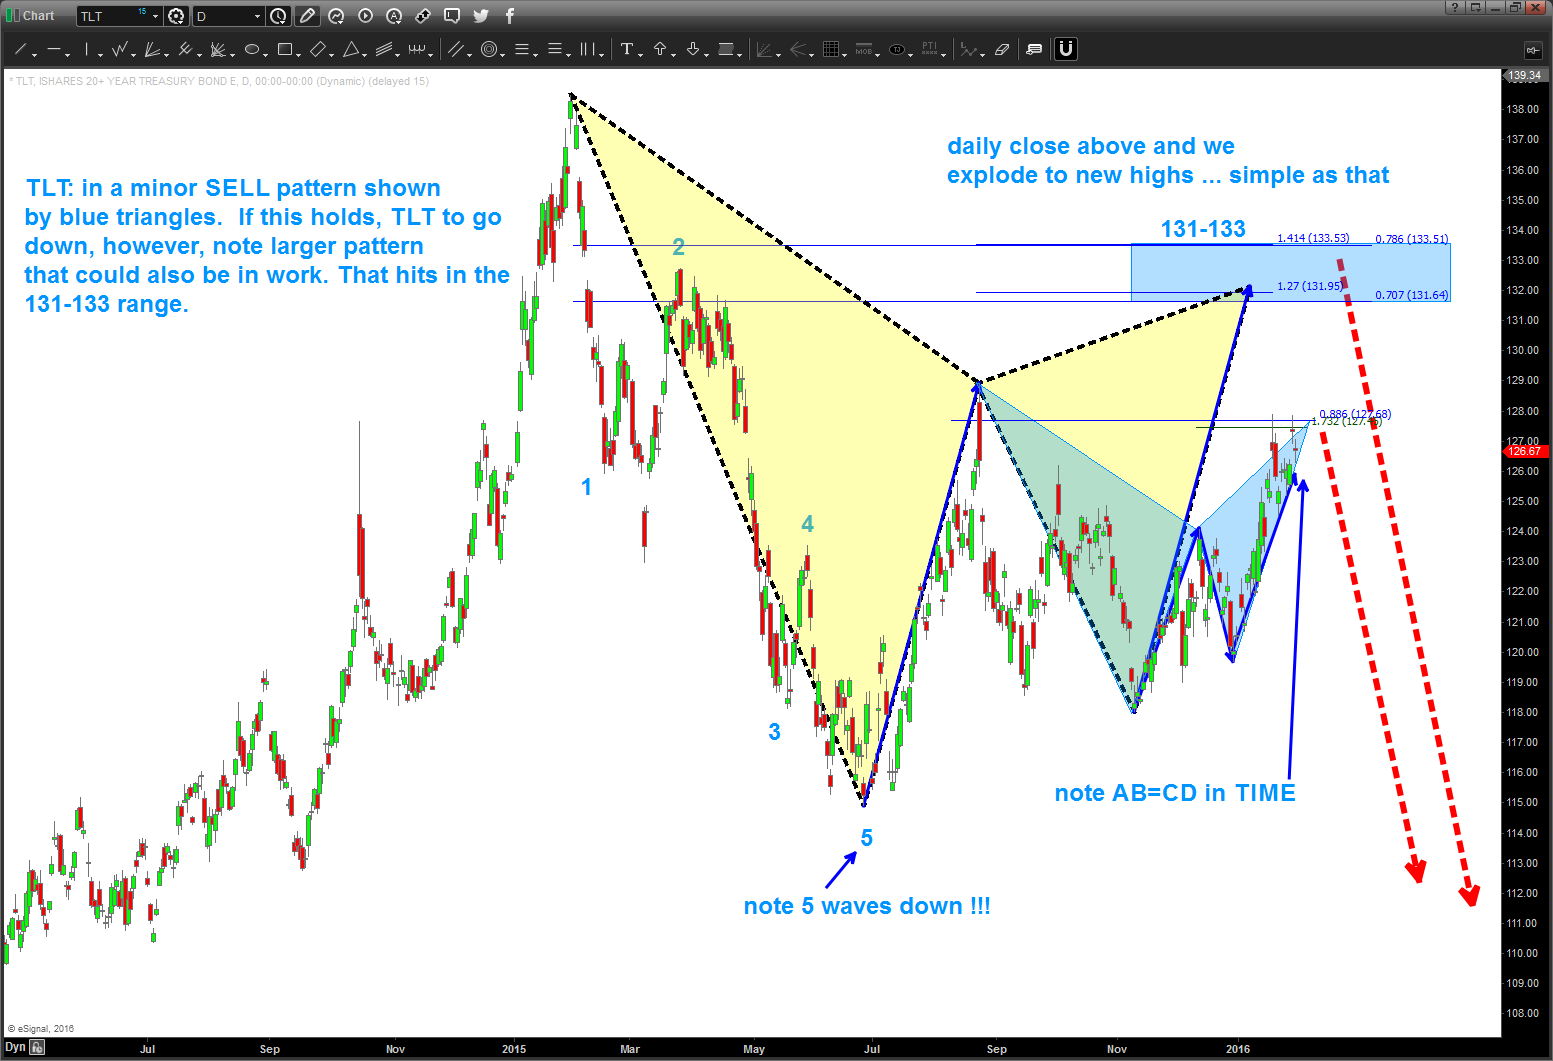
so, take a look at TLT …
- first note – we have a very clear 5 waves down. that’s either the beginning of the a trend OR a heads up that there is going to be at least another 5 wave move down (a C wave so to speak)
- if you do a search on this website you’ll find that we ‘called’ the BUY at 114 and we targeted 126 (while it was at 114) as the next target.
- since then we sold off but have found a pretty nice base at 118-119.
- this formed the blue triangle SELL pattern and it hit a little higher than 126 (by a buck) but is STILL in the realm of valid pattern parameters.
- also note, the TIME we went up AB is also equal to the TIME we went up in BC.
- SOMETHING SHOULD BE HAPPENING IN THE FIXED INCOME WORLD — SOON.
- now, if we blow thru this target then we’ll seek 131-133 and that is where the rubber will meet the road, so to speak….that’s an extremely harmonic (think music and square roots) pattern.
- the red arrows show what the PATTERNS are saying. if we blow thru the 131-133 level THEN it’s off to the races and the PATTERN failed. NOT US …
this has absolutely NOTHING to do w/ ANYTHING FUNDAMENTAL so please don’t email me telling me what it’s about or anything like that .. it’s a pattern folks, nothing more than that.
enjoy ….
B