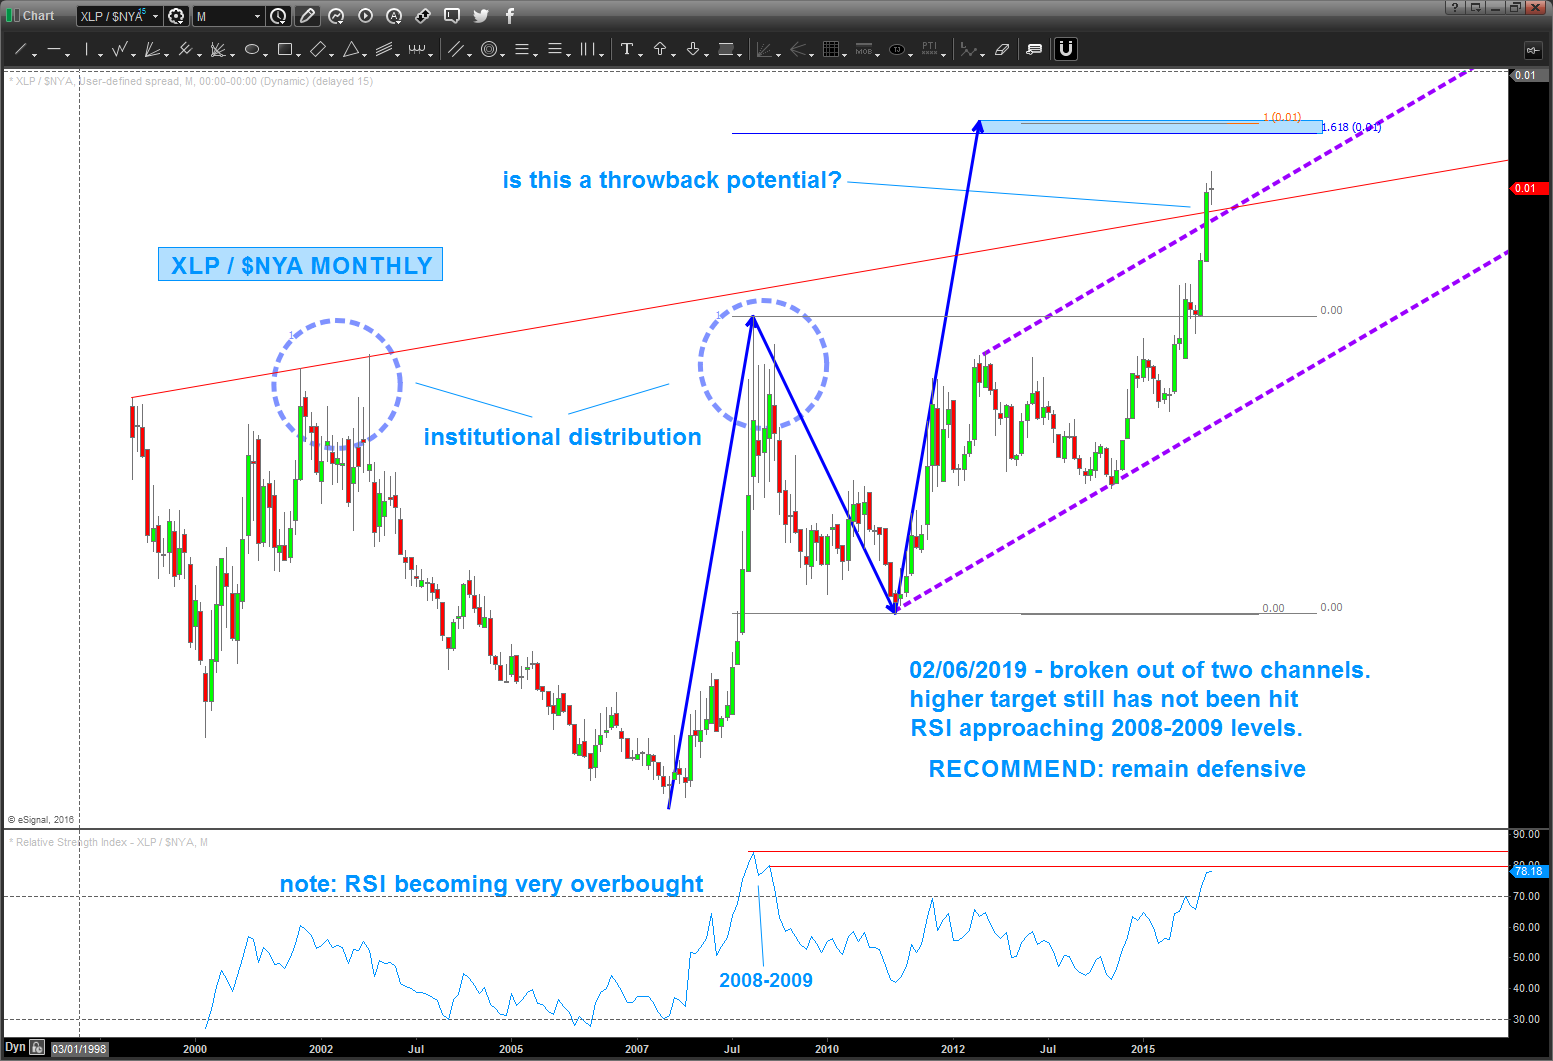
XLP / $NYA need upper target to be hit AND a sign of accumulation …
- note – we are forming a “doji” candlestick pattern – “uncertainty” on a monthly basis, yet the higher target remains a little higher.
- broke out of two monthly trend lines and have paused
- RSI approaching extreme overbought levels of the 2008-2009 panic.
UNTIL WE HIT THE UPPER TARGET – FOR ME – we are in no mans land.
Now, let me draw your eye to the circled part of the chart. Note, all the BIG WICKS. It took 6 months for this to carve out a top which tells me that as the market was going down back in 2008-2009 the institutions started “accumulating” and then the market took off. Not sure what will happen this time, but, again, would remain defensive till this upper target is hit OR we get a monthly close (a monthly) back below BOTH the purple and red upper channel trend lines.