$TSLA
so from my fellow geek technician JC he always loves the “from failed breakdowns/ breakouts come strong moves” well here is a possible set up.
as a PATTERN guy what I have found is – totally technical – there is a reason for the market to stop at resistance or support.
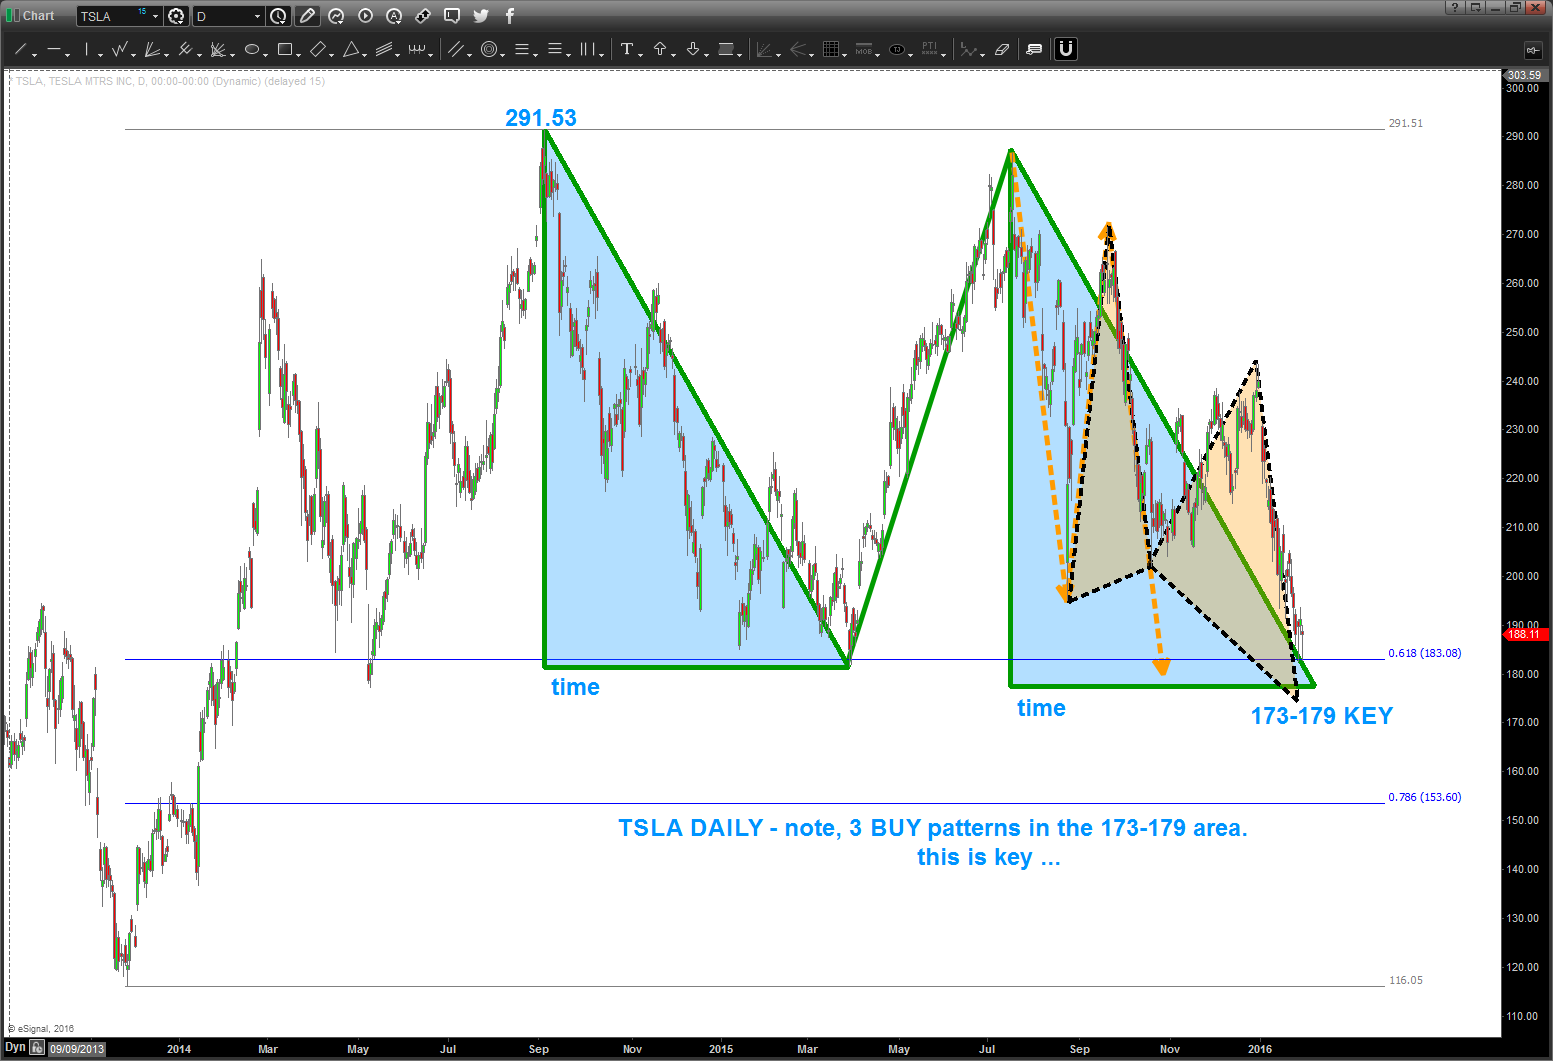
in this case for TSLA you can see it’s “respecting” the .618 retracement from the last low … EVERYONE is watching this level and horizontal support.
and, if it breaks down, then “everyone” shorts and right below this breakdown level? 3 patterns coming in 173-179 ….
- pay attention to the “shaded blue triangles” as they represent equality in both PRICE and TIME. Appears 2/10 is the time frame for this level to be really equal in price and time. TBD …
- this type of pattern is a classic “FLAT” Elliott Wave correction … so, if TSLA is to go higher, believe this level needs to hold.
watch this level closely.
as a corollary, if we have a daily close below 173 then we have 153 and then, potentially, lower in the future.
let me know if you have any questions.
B

Looks like it’s going to find support at this level.
From: Barts Charts To: bretsnover@verizon.net Sent: Monday, February 1, 2016 10:54 AM Subject: [New post] $TSLA #yiv9614963698 a:hover {color:red;} #yiv9614963698 a { text-decoration:none;color:#0088cc;} #yiv9614963698 a.yiv9614963698primaryactionlink:link, #yiv9614963698 a.yiv9614963698primaryactionlink:visited {background-color:#2585B2;color:#fff;} #yiv9614963698 a.yiv9614963698primaryactionlink:hover, #yiv9614963698 a.yiv9614963698primaryactionlink:active {background-color:#11729E;color:#fff;} #yiv9614963698 WordPress.com | BART posted: “so from my fellow geek technician JC he always loves the “from failed breakdowns/ breakouts come strong moves” well here is a possible set up. as a PATTERN guy what I have found is – totally technical – there is a reason for the market to stop at resis” | |