Loonie, time to get long …
Posted on January 22, 2016 Leave a Comment
I missed my entry at the .786. (was on travel)
That’s OK …what I’ll try to do is do a real time look at getting into the first retrace.
- Here’s the charts …
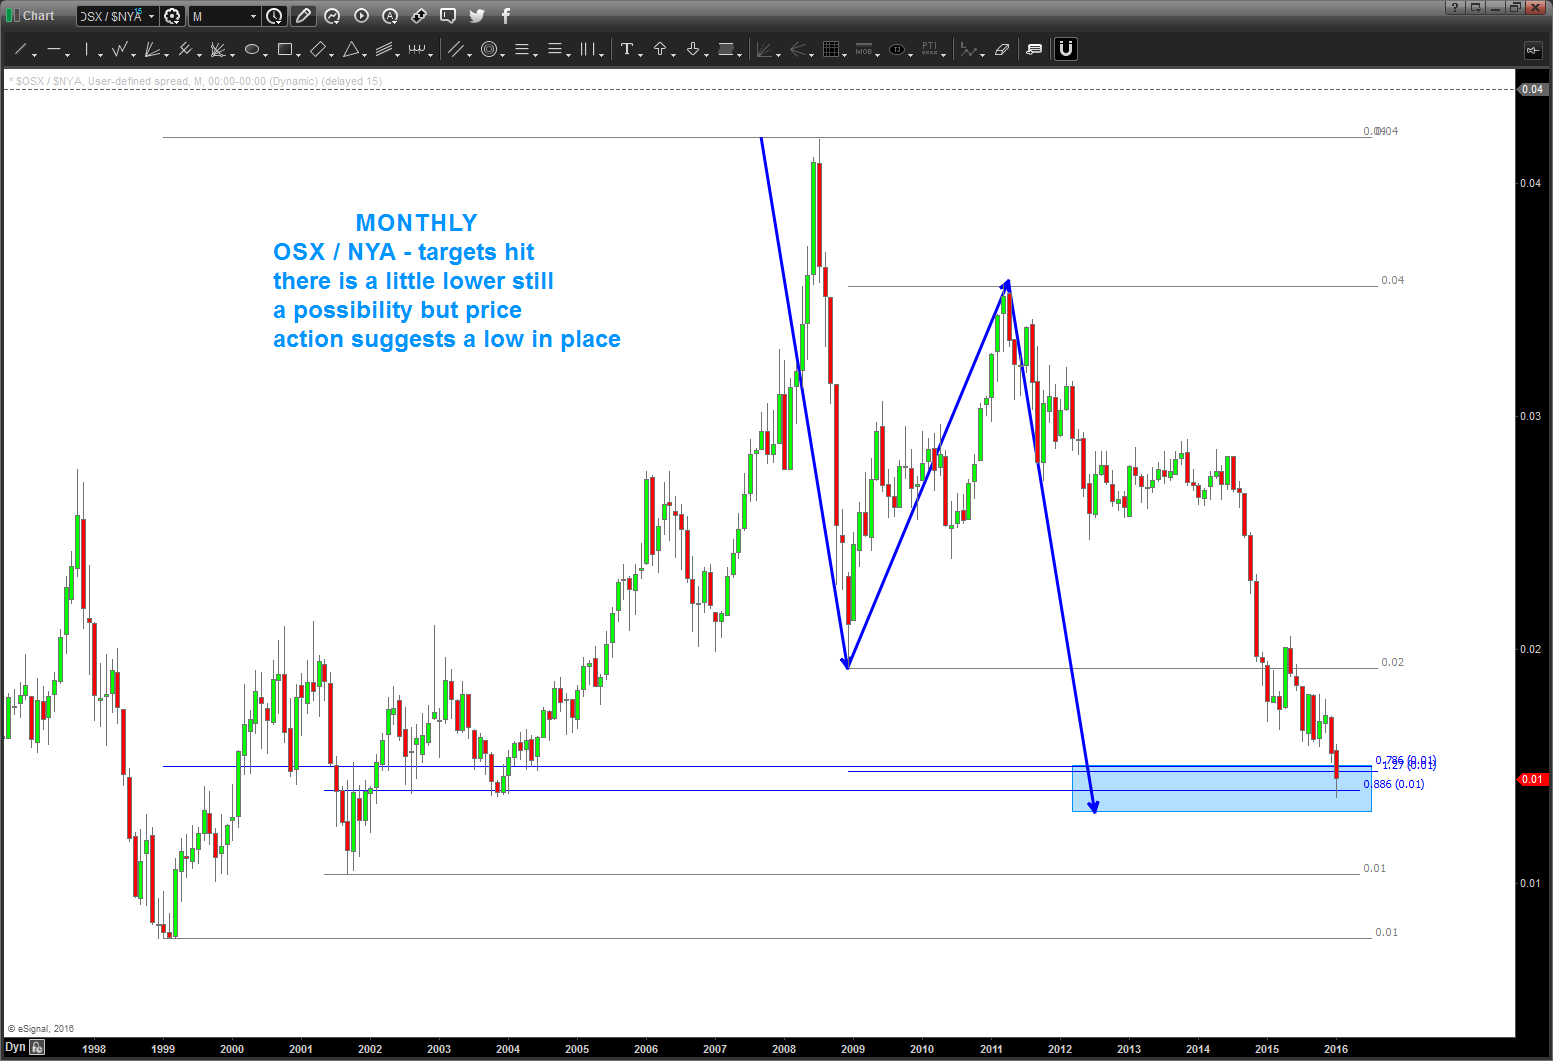
- Relative Strength of the $OSX / $NYA.
- note, the AB-CD is a little lower but believe we are in the zone for the PATTERN To be complete
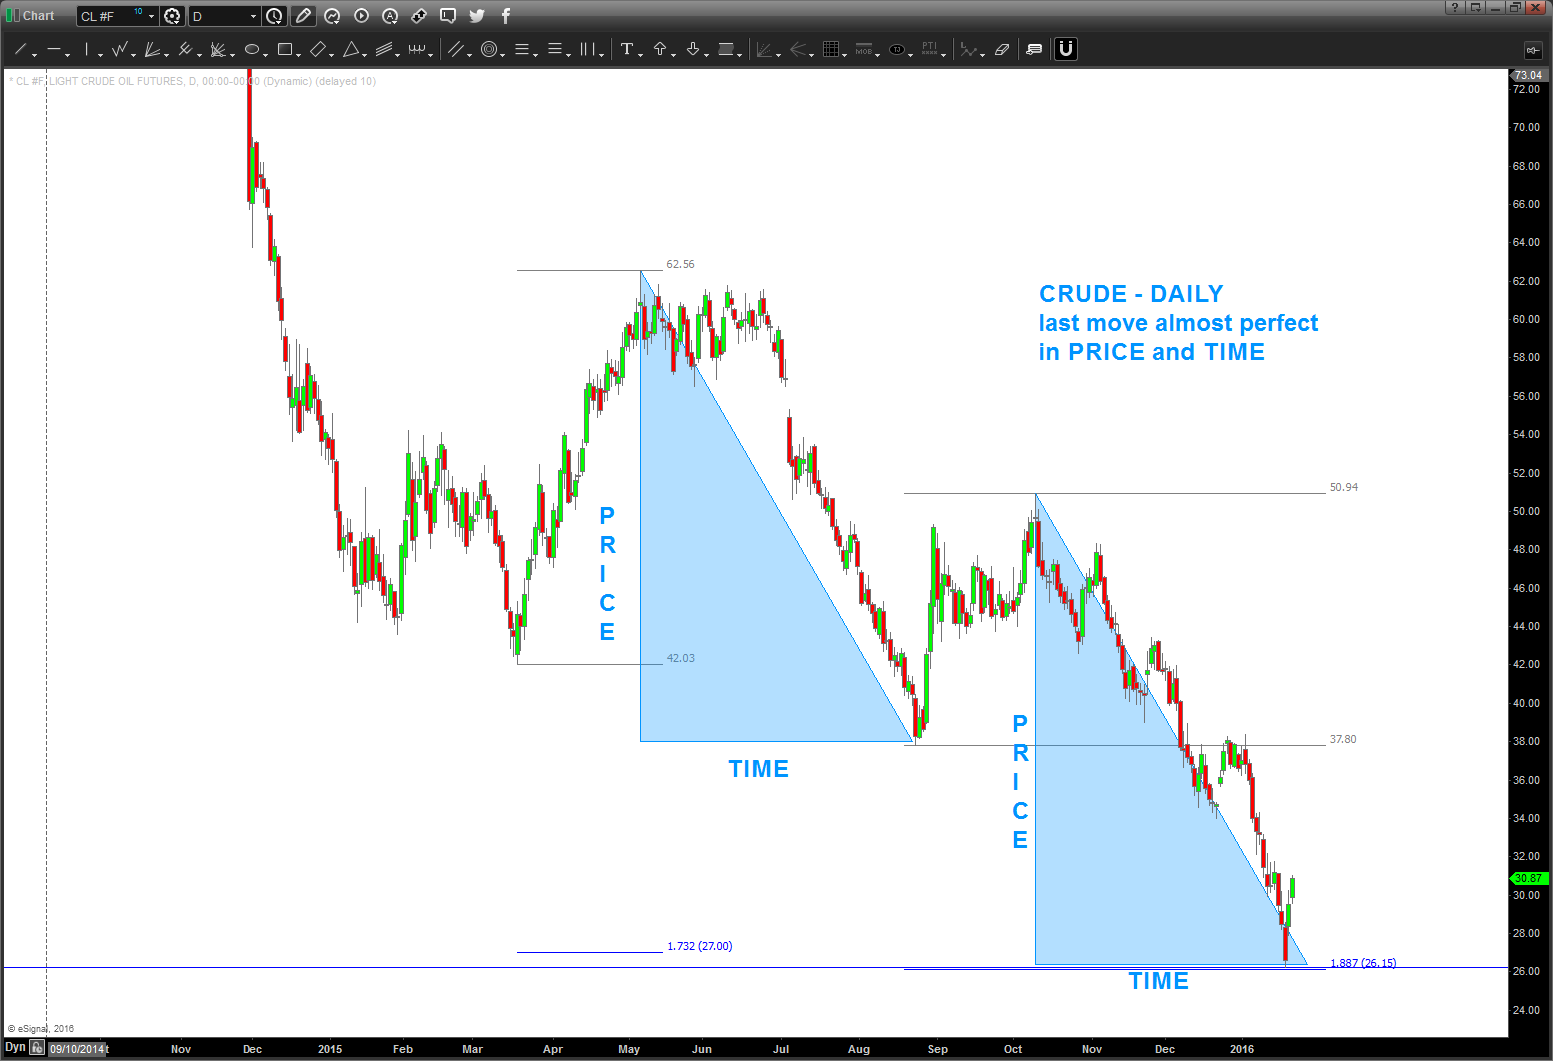
- Crude
- on schedule, and look at the daily, almost perfectly on time
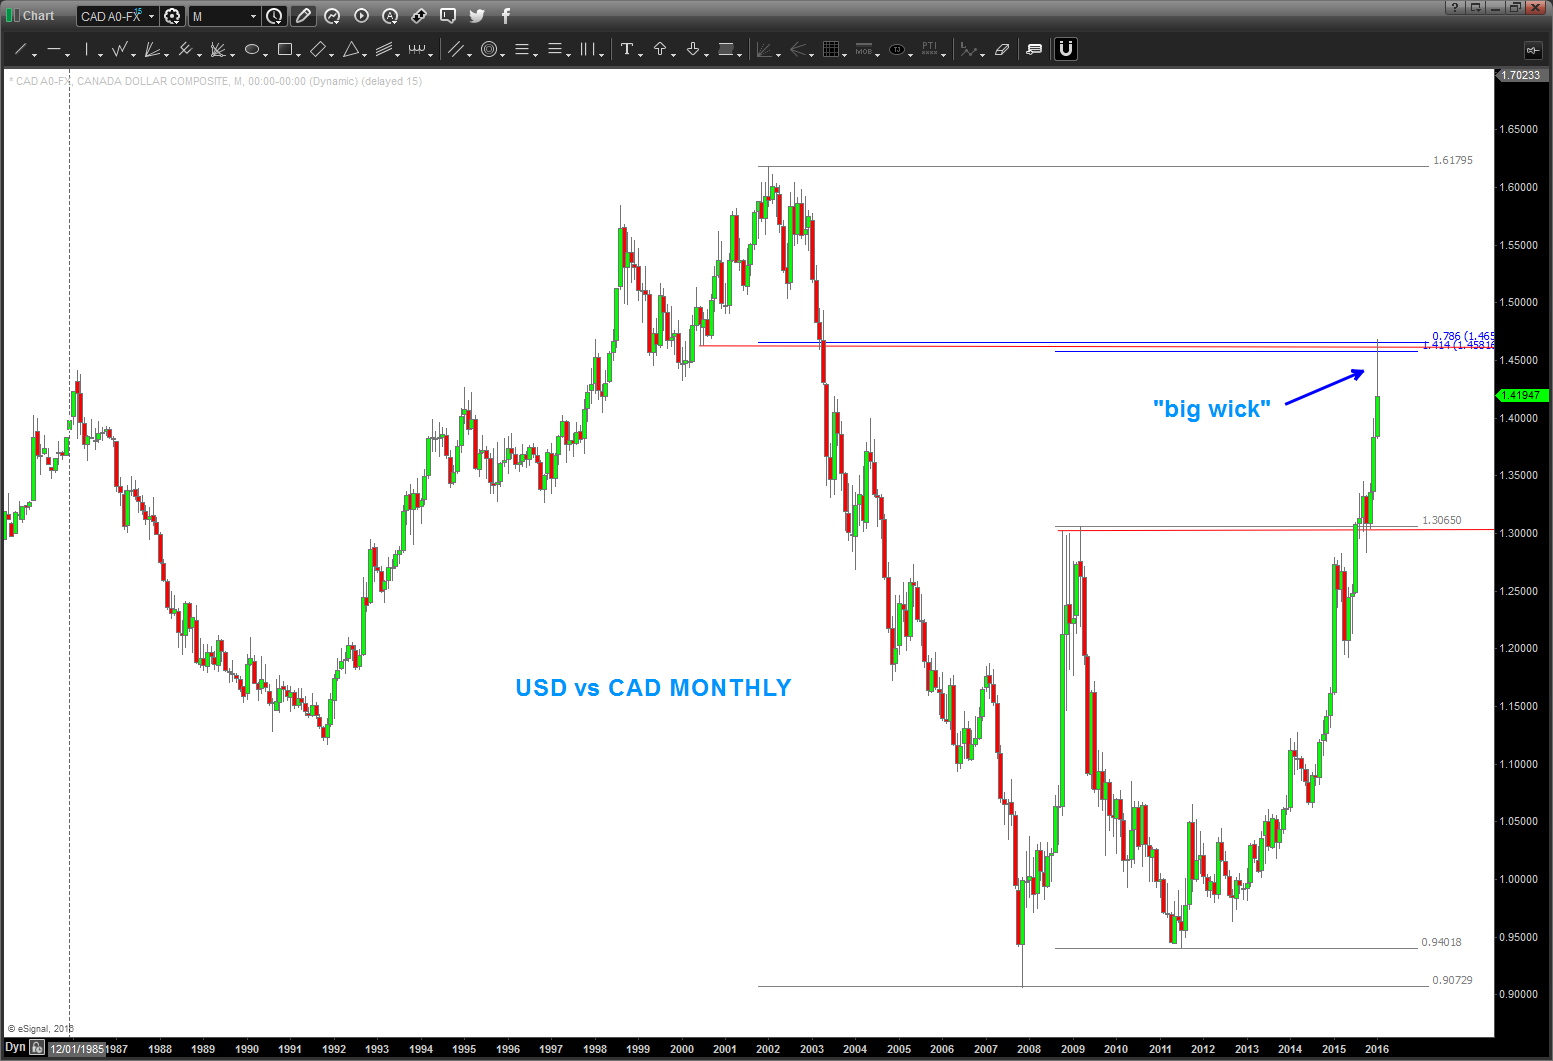
- USD vs LOONIE
- smacked exactly into the .786 and other ratio’s and has begun to strengthen …
- Relative Strength of the $OSX / $NYA.
Note: using intermarket and ratio analysis we were able to synchronize the “POTENTIAL” pivot in the Loonie, using Crude, relative strength of the OSX and then the patterns on the Loonie.
Stay tuned as this might get really interesting.
this entire thing is wrong w/ a daily closing above the .786.
I have my line in the sand, I like that.
B
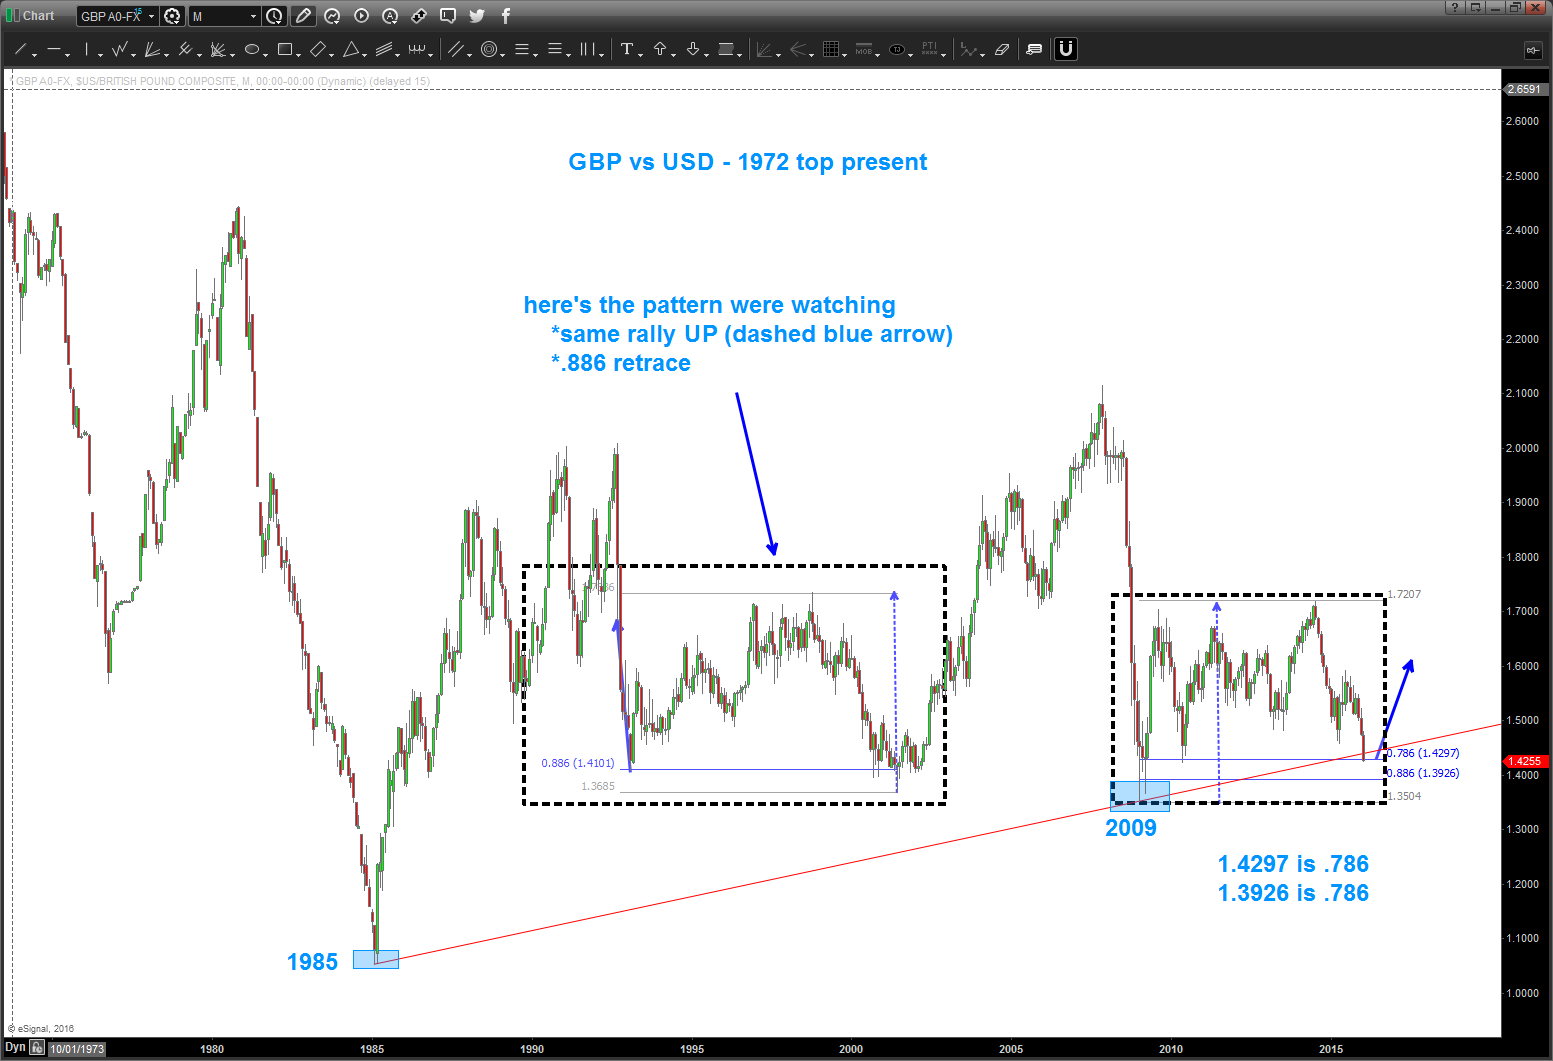
yes, that was a 30 year trend line that has broken on the POUND vs USD!
Posted on January 17, 2016 Leave a Comment
I like the pattern going all the way down to the .886 at 1.3926

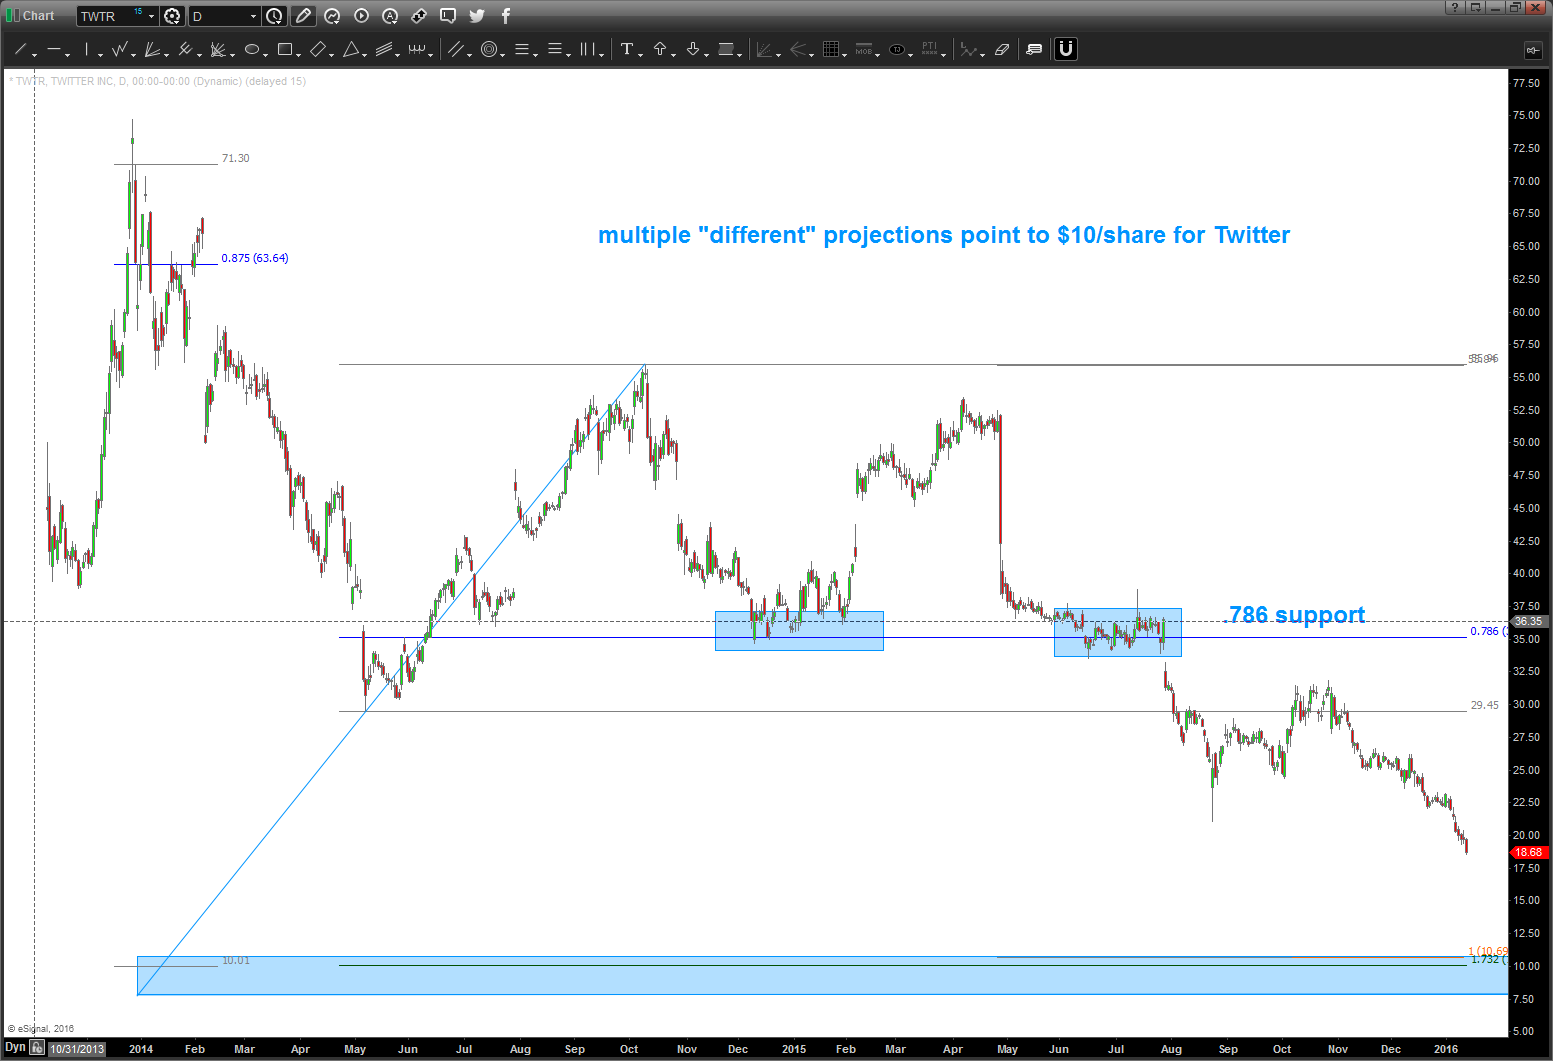
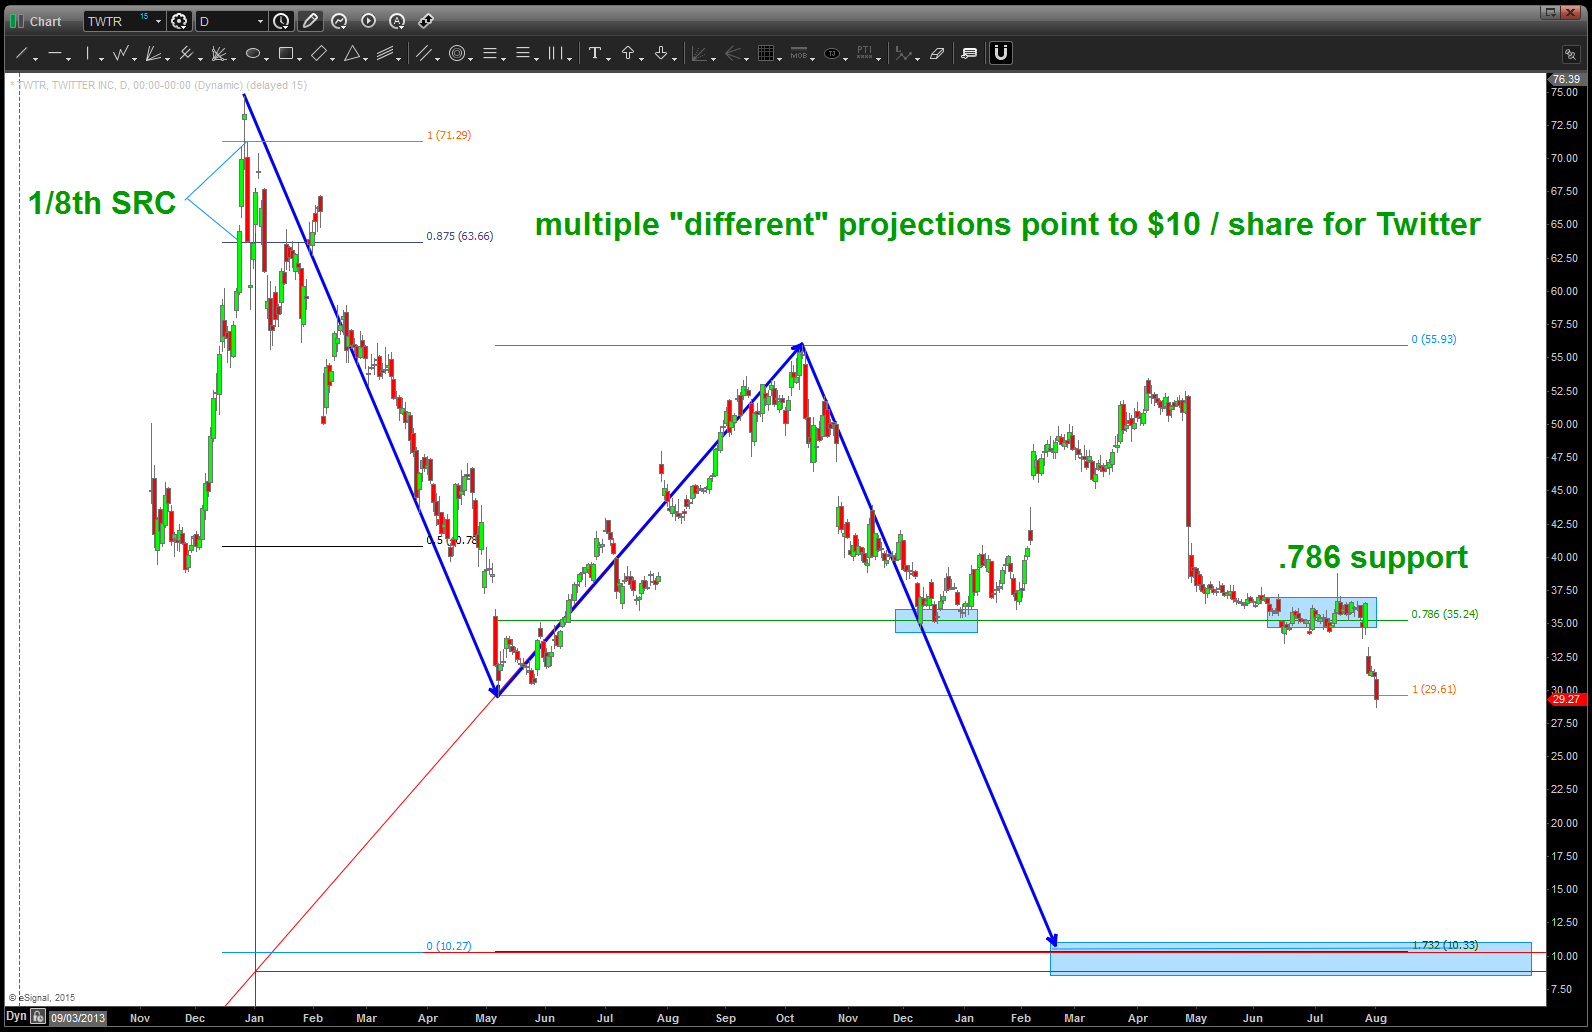
$TWTR pointing to 10/share, updated
Posted on January 13, 2016 2 Comments
1/13/2016 – updated
folks, look, I have no idea where the market is going. I just “see” and “feel” PATTERNS.
the math said 10, not some crystal ball or any of that …. once it broke thru the .786 (math based only) it will see the last low and usually extend down … that’s what it’s doing. it MIGHT GET TO 10 and IT MIGHT GET BELOW 10.
THE MATH SAYS 10….
in/around 10 – BUY $TWTR or don’t.
here’s the updated chart …
$TWTR going to 10? Maybe …
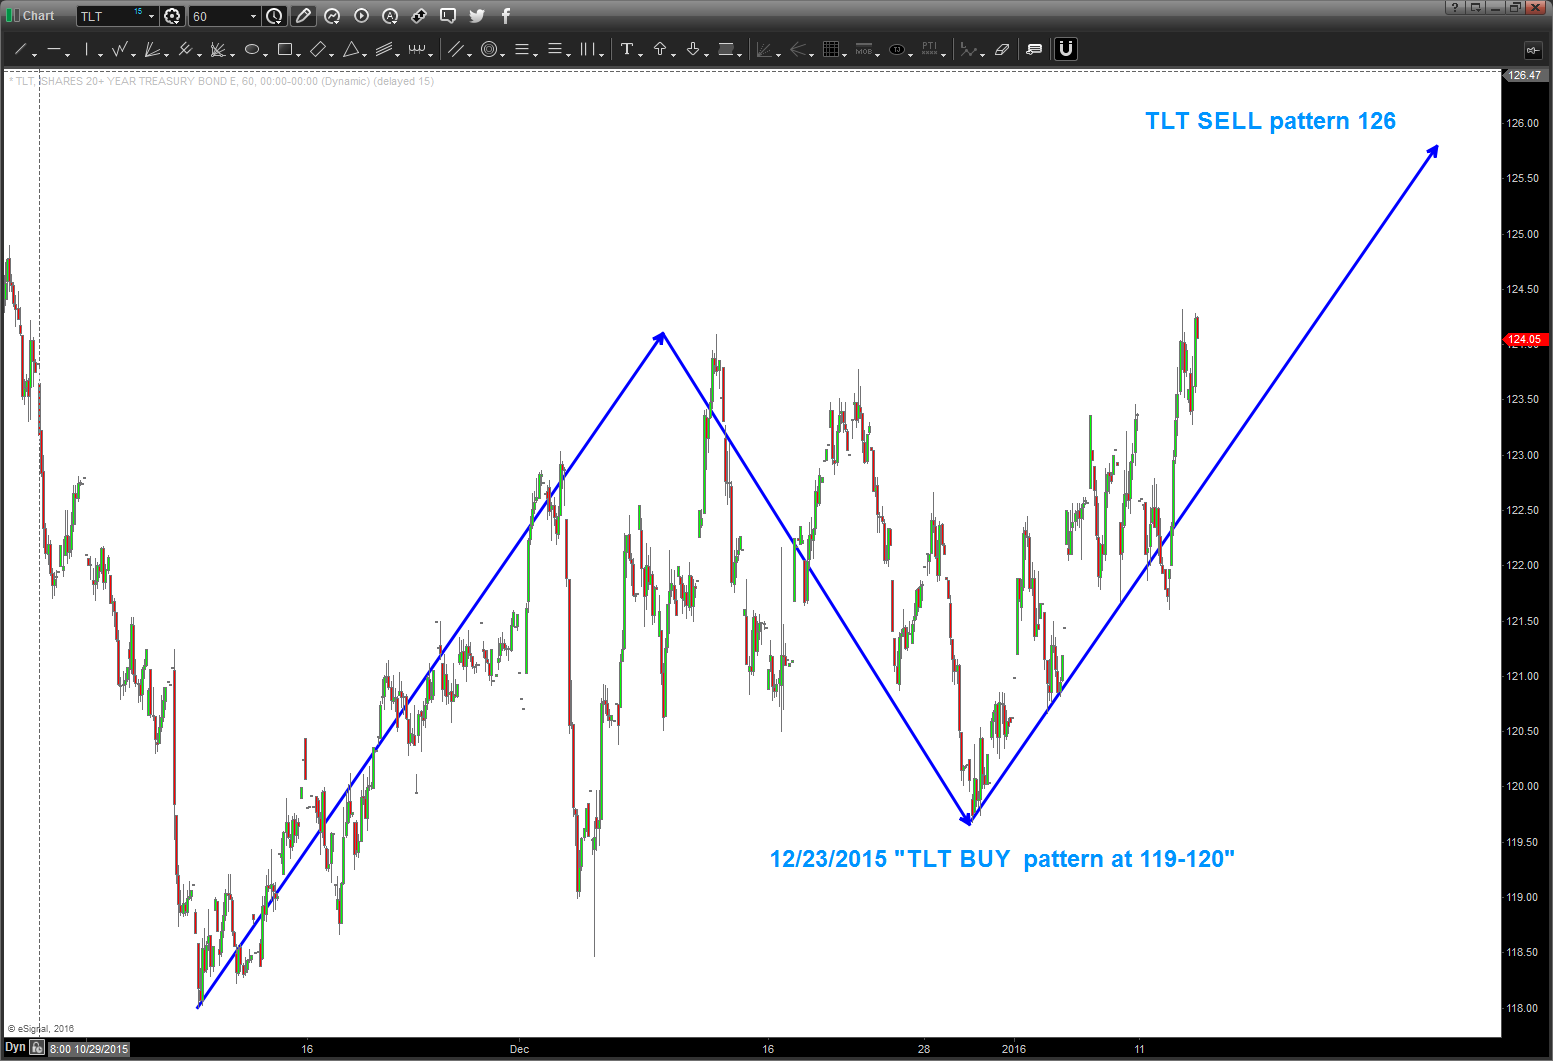
long bond BUY pattern is now a long bond SELL pattern
Posted on January 13, 2016 Leave a Comment
1/13/2016 – update.
so … just as the long bond buy pattern didn’t get any better than this (see below) the long bond now has a sell pattern that doesn’t get any better than this. cool, hugh? I really don’t give a shit about anything other than the PATTERN.
as I said below … “patterns work and sometimes they don’t”
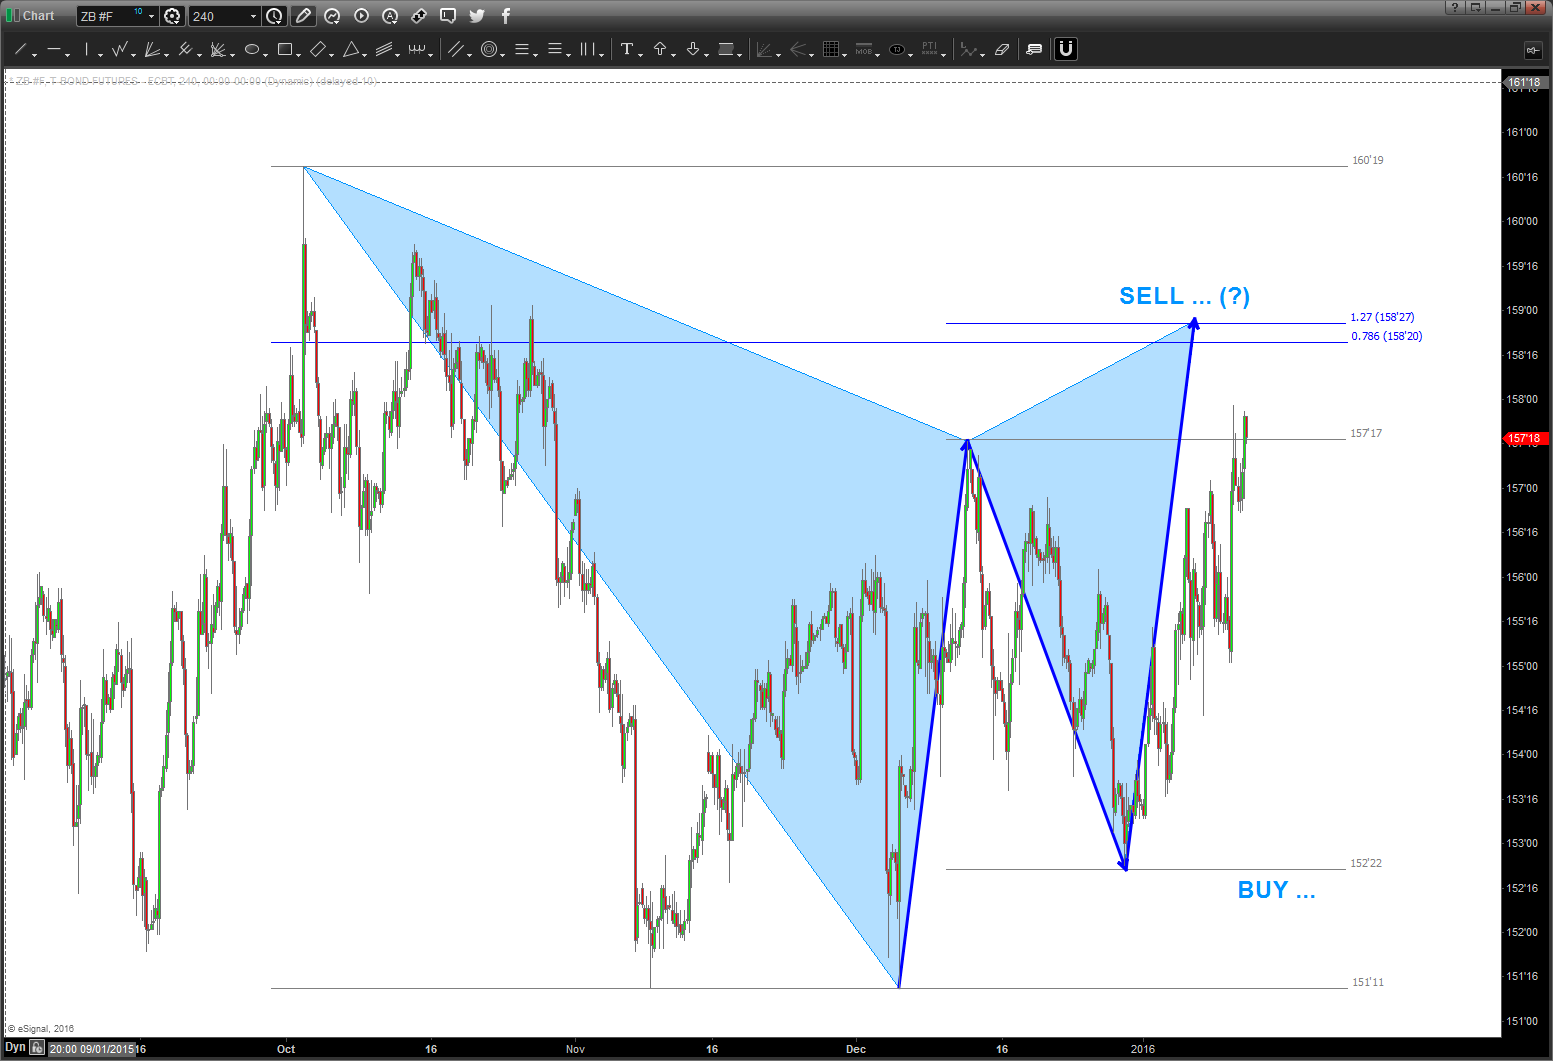
patterns work and sometimes they don’t work.
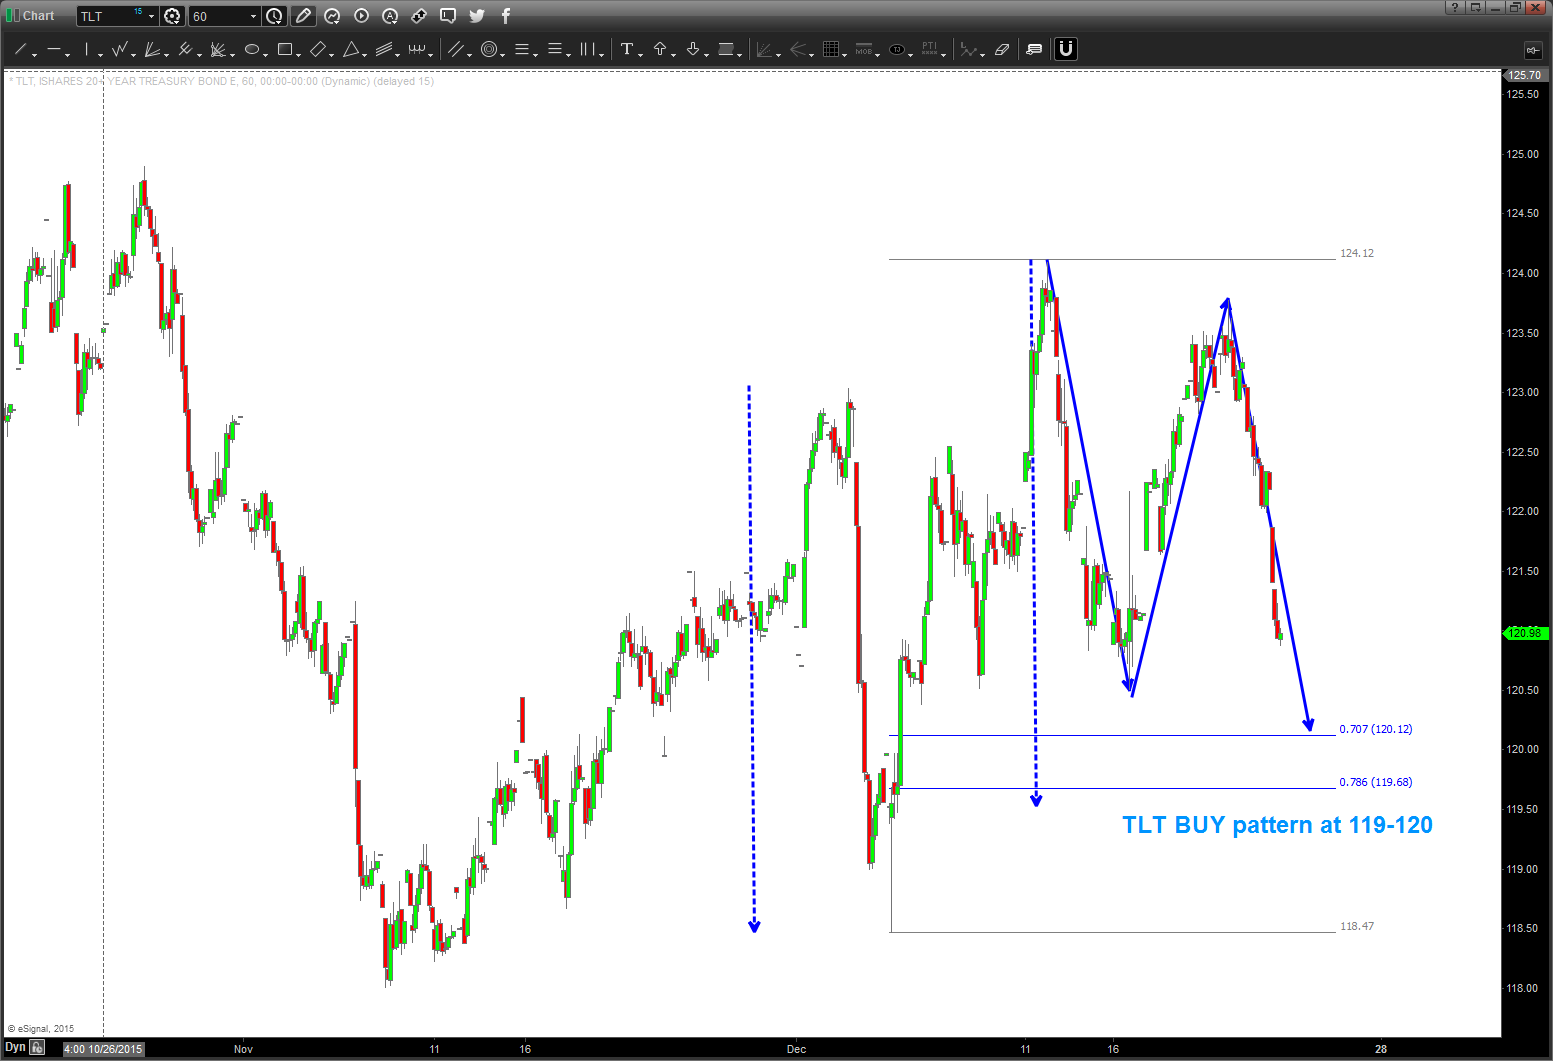
nice BUY pattern on the long bond and the ETF TLT.
watch this one closely …
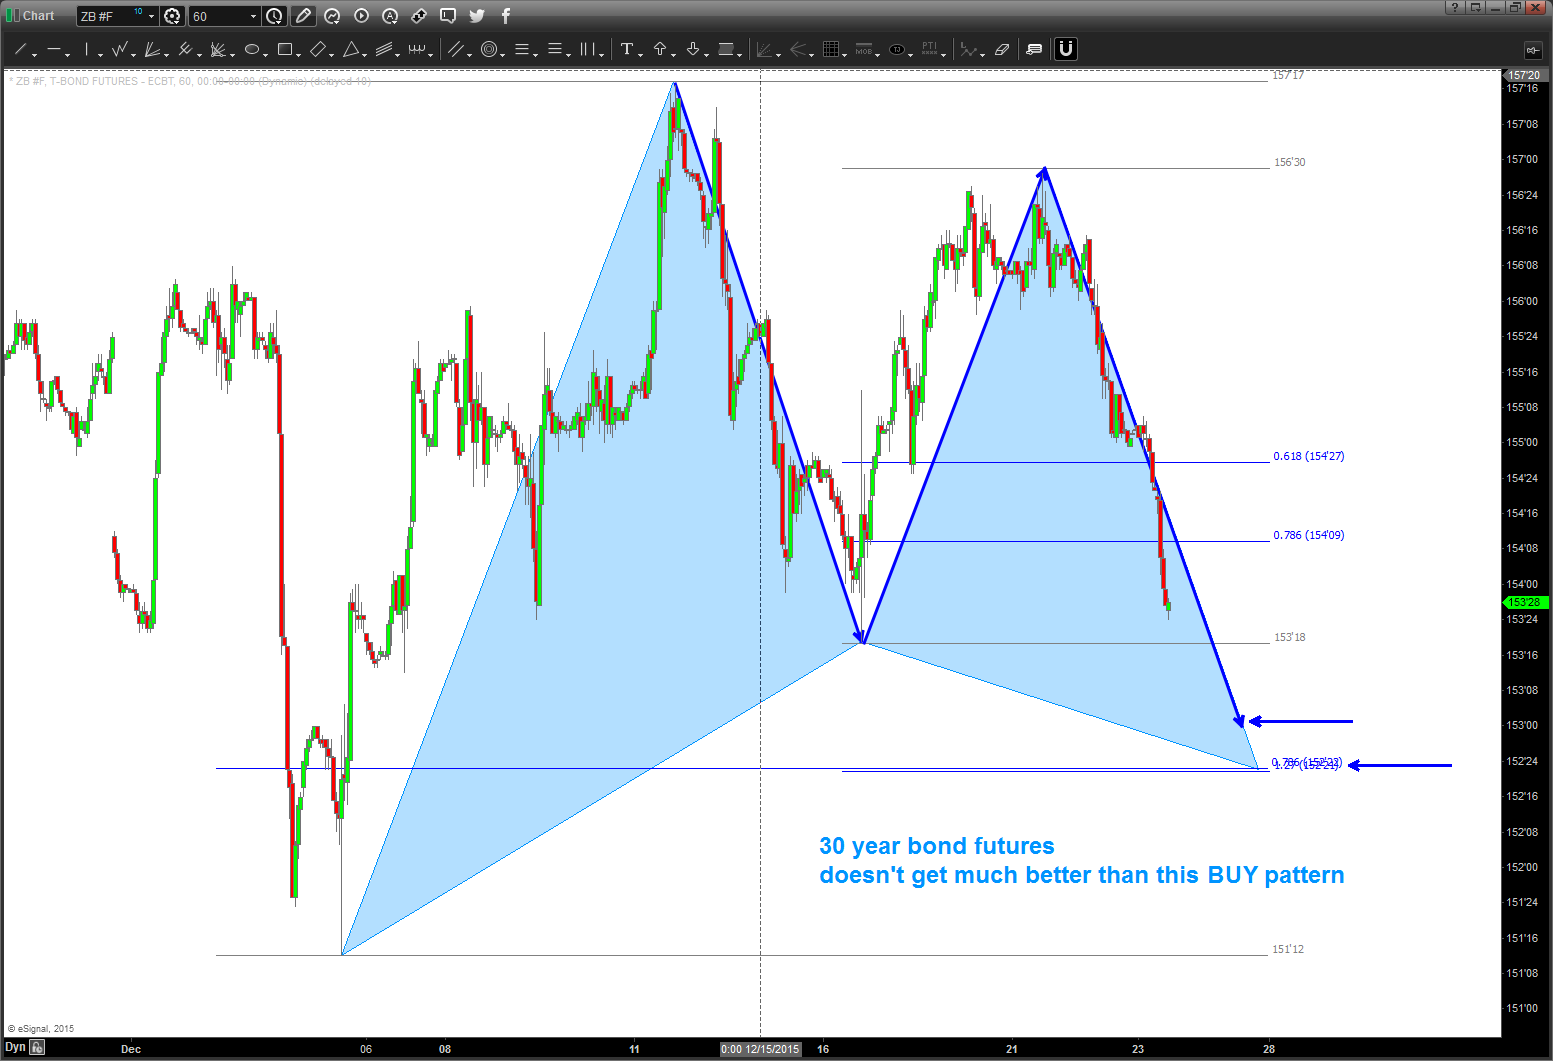
man, I love this chart …
Posted on January 12, 2016 Leave a Comment
“should I stay or should I go …?”
check it out … the POUND is furiously getting liquidated and, well, for the global economy that ain’t good folks.
trust me, the options on FB or AMZN and blah blah can make you a lot of money but when the currencies are rolling – like they are now – it’s the shifting of the seismic plates folks.
Pound:
- testing a 30 year trend line from 1985. Note, it caught the 1985 and 2007 plunges. Is it going to catch this one?
- the highlighted blue rectangles show an EXACT price pattern. they are “mirror images” of each other.
- go RIGHT- LEFT from 2001-1993 and we go UP the blue arrow.
- we are now folding down into the 1993 low.
- where did it fall to?
- the .886 retracement
- where did it fall to?
- we are now folding down into the 1993 low.
- fast forward to 2009-2016 and we go UP the same amount.
- we are now folding down LEFT-RIGHT into the 30 year trend line, the .786 retrace and the .886 retrace
- “one” of these should hold the pound for a powerful move.
- we are now folding down LEFT-RIGHT into the 30 year trend line, the .786 retrace and the .886 retrace
- go RIGHT- LEFT from 2001-1993 and we go UP the blue arrow.
- remember, from failed breakout/breakdown levels come POWERFUL moves …
Let’s PLAY the IF-THEN ….
IF the pound respects one of these upcoming levels as support THEN we should get a very nice BOUNCE (800-1000 pips?)
IF the pound does NOT respect these upcoming levels as support THEN we might have another currency collapse unfolding.
Let me know if you have have any questions.
B

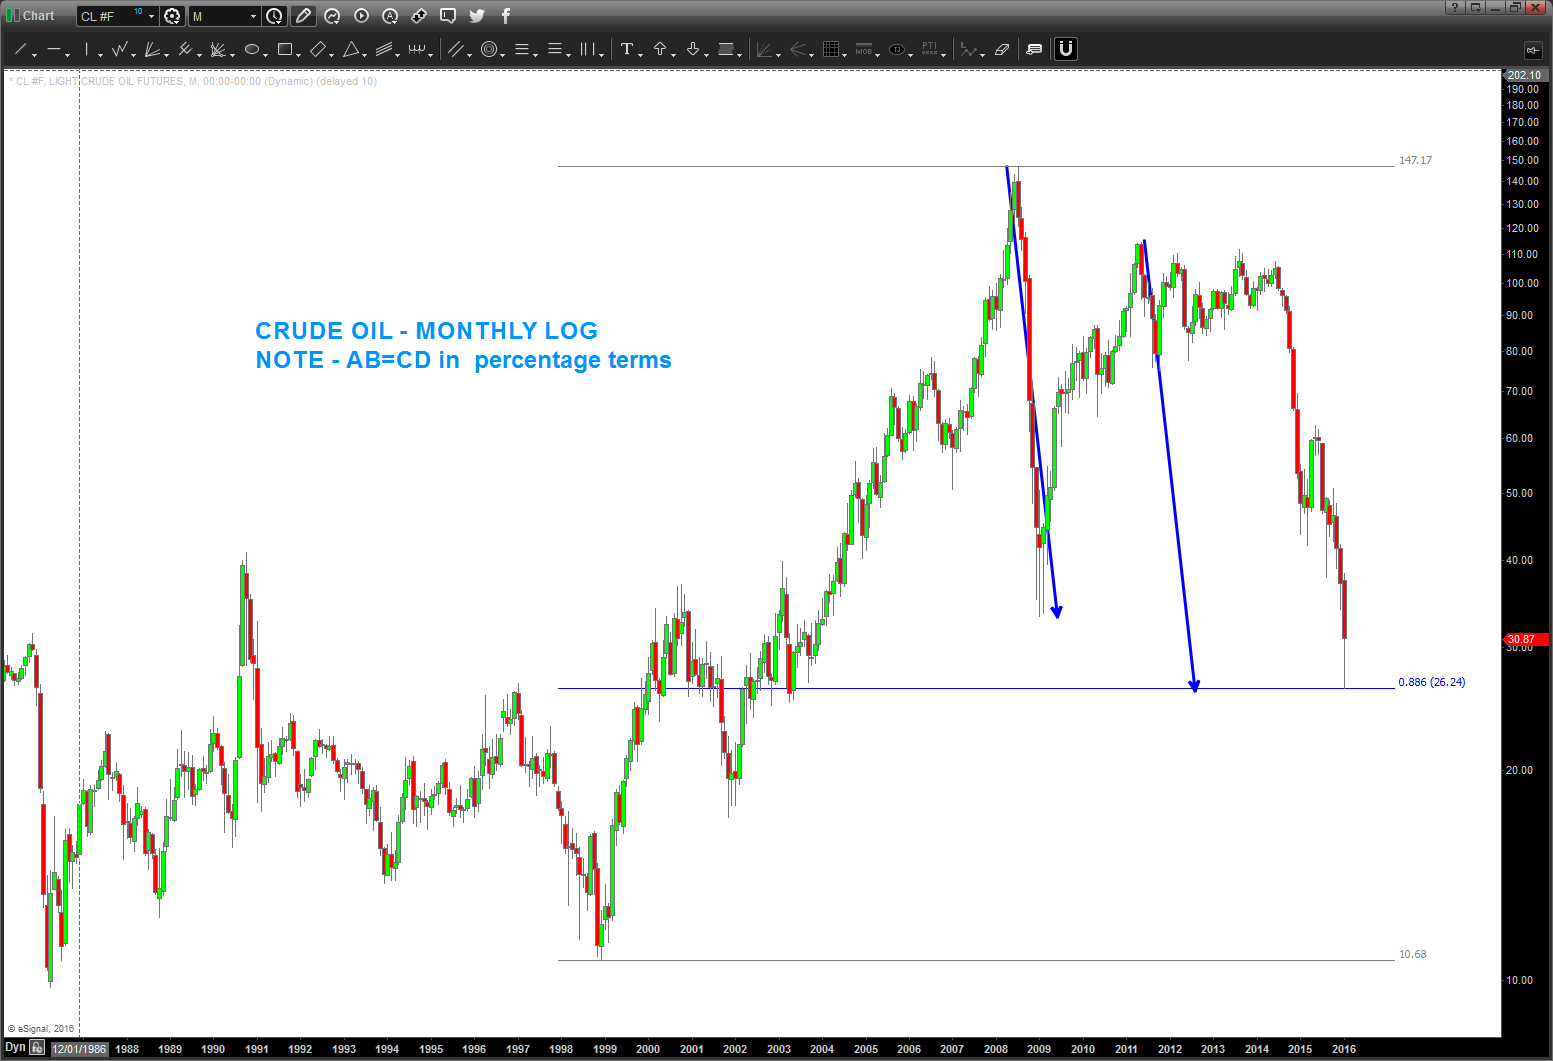
Crude Oil Approaching BIG low …
Posted on January 11, 2016 Leave a Comment
1/11/2016 update.
note the percentage corrections … certainly looks like 30 and 25 are possibility. Especially since the OSX/NYA ratio hasn’t bottomed along w/ the Loonie but i do believe we are getting ready for a big bounce.
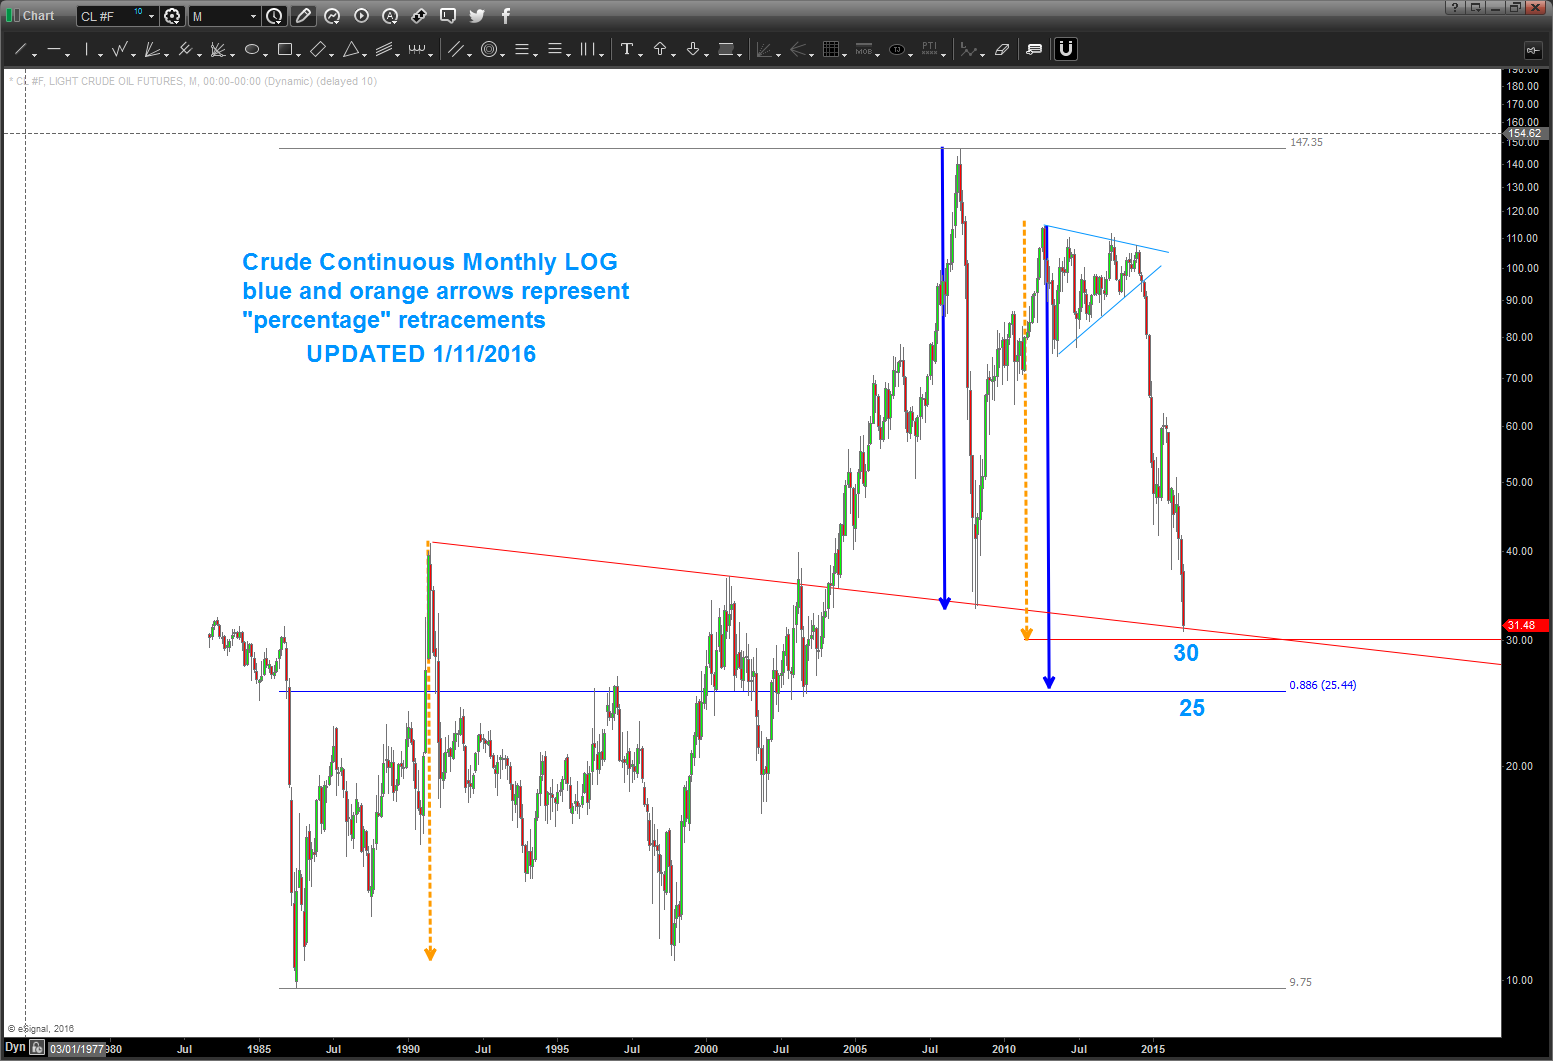
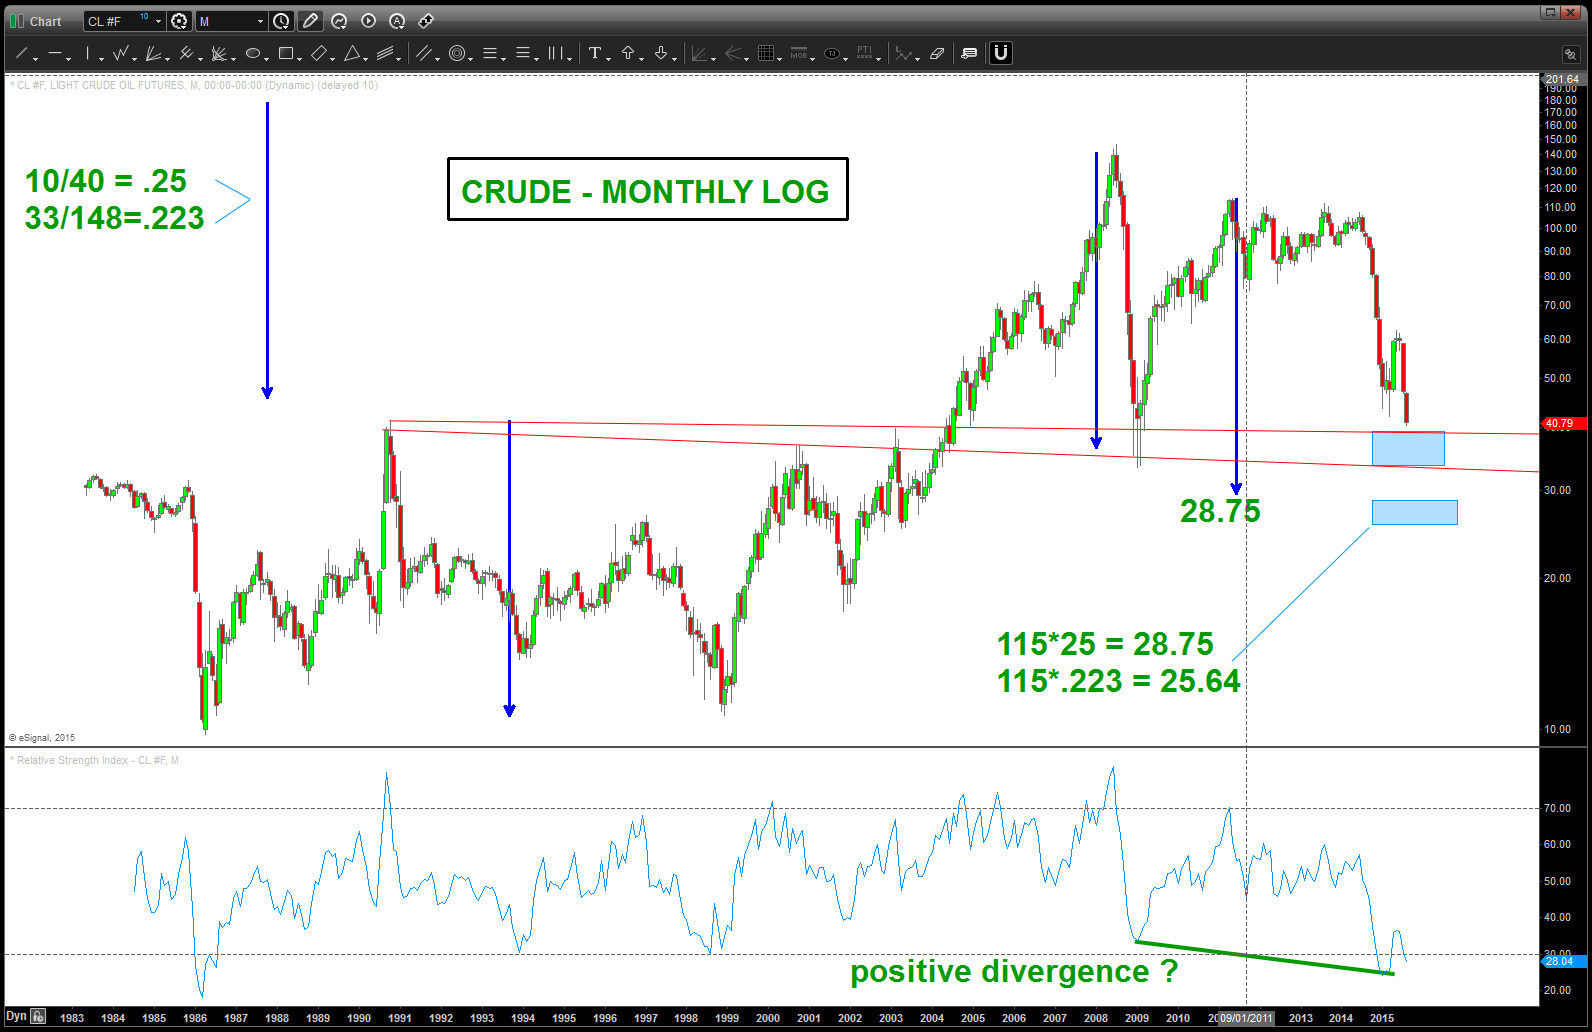
Crude Continuous Monthly Log
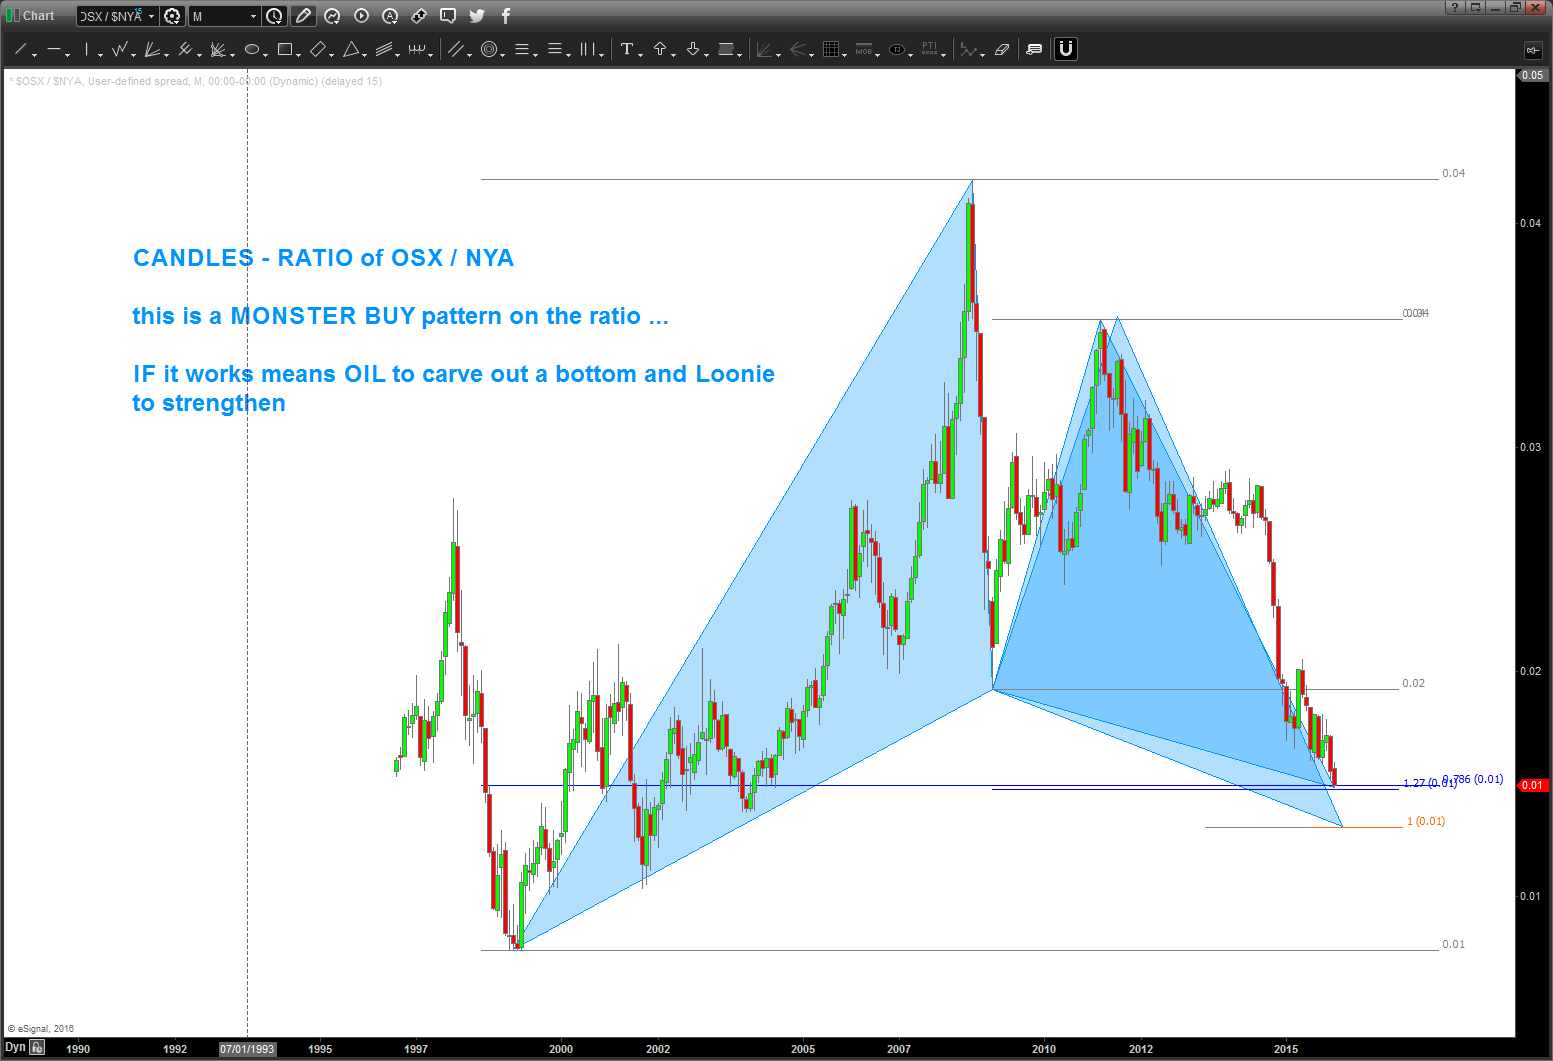
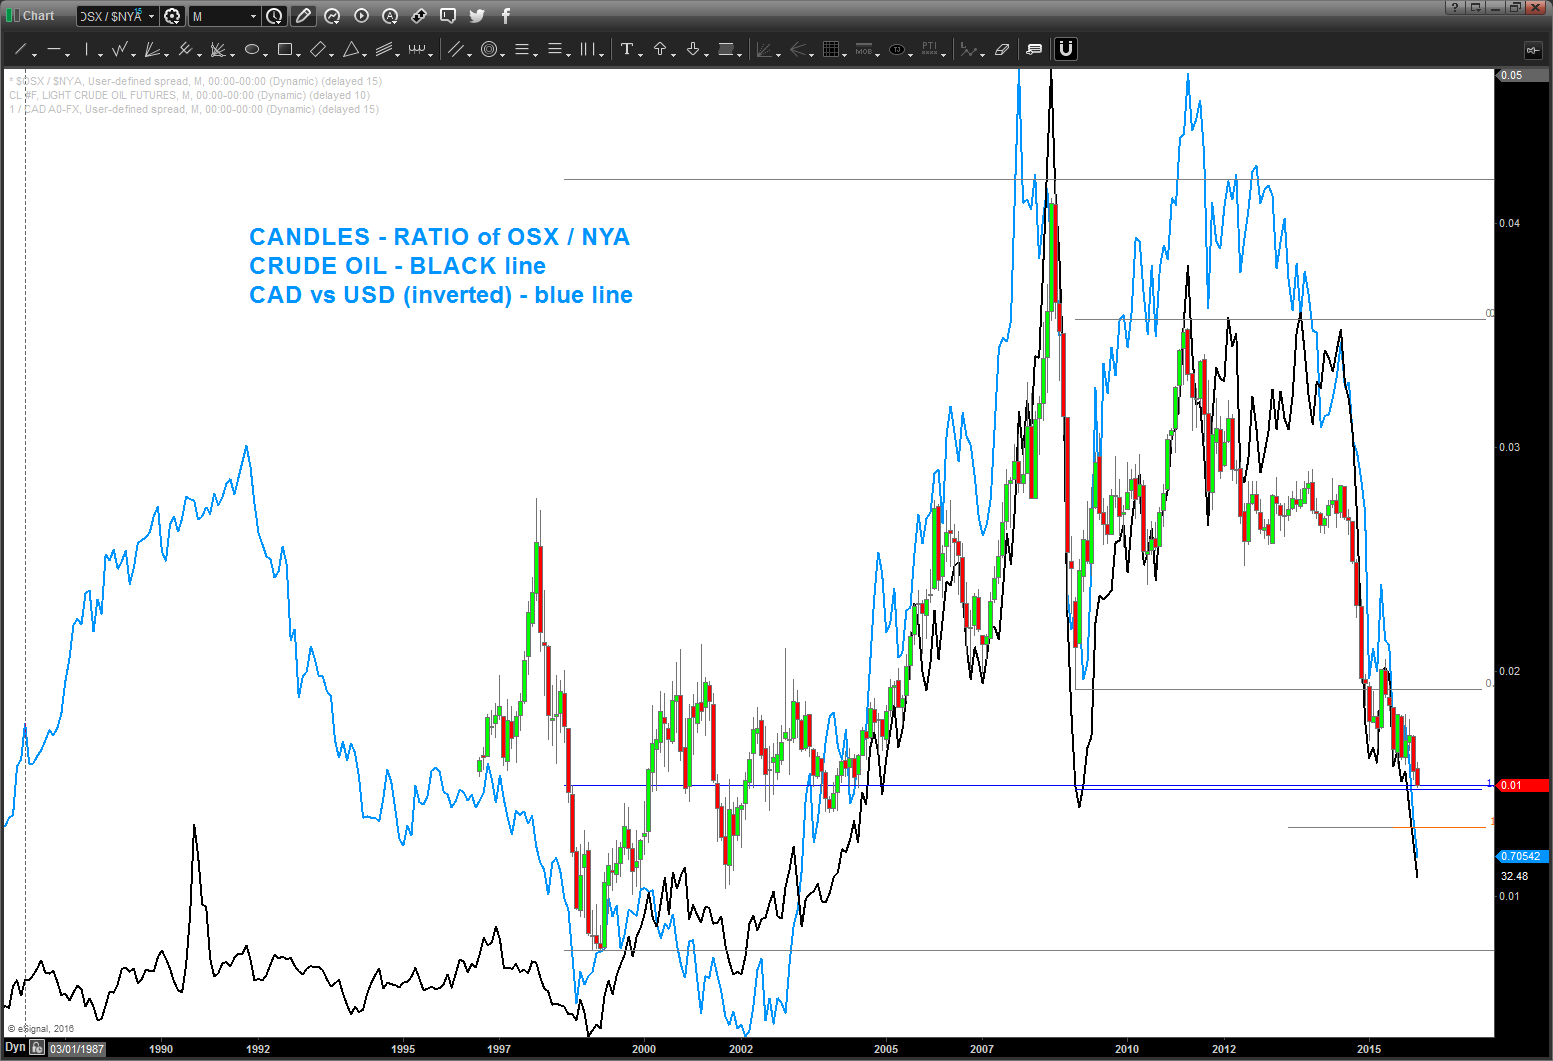
ratio analysis combined w/ patterns is helpful OSX, Crude and Loonie
Posted on January 10, 2016 Leave a Comment
here’s the RATIO of $OSX / $NYA. it has a buy pattern HERE or a little LOWER.
below that is crude and CAD vs USD (USDCAD inverted) overlaid on top of the ratio.
they move together
so IF this BUY pattern works THEN we have a big move coming BULLISH for Crude and the Loonie.
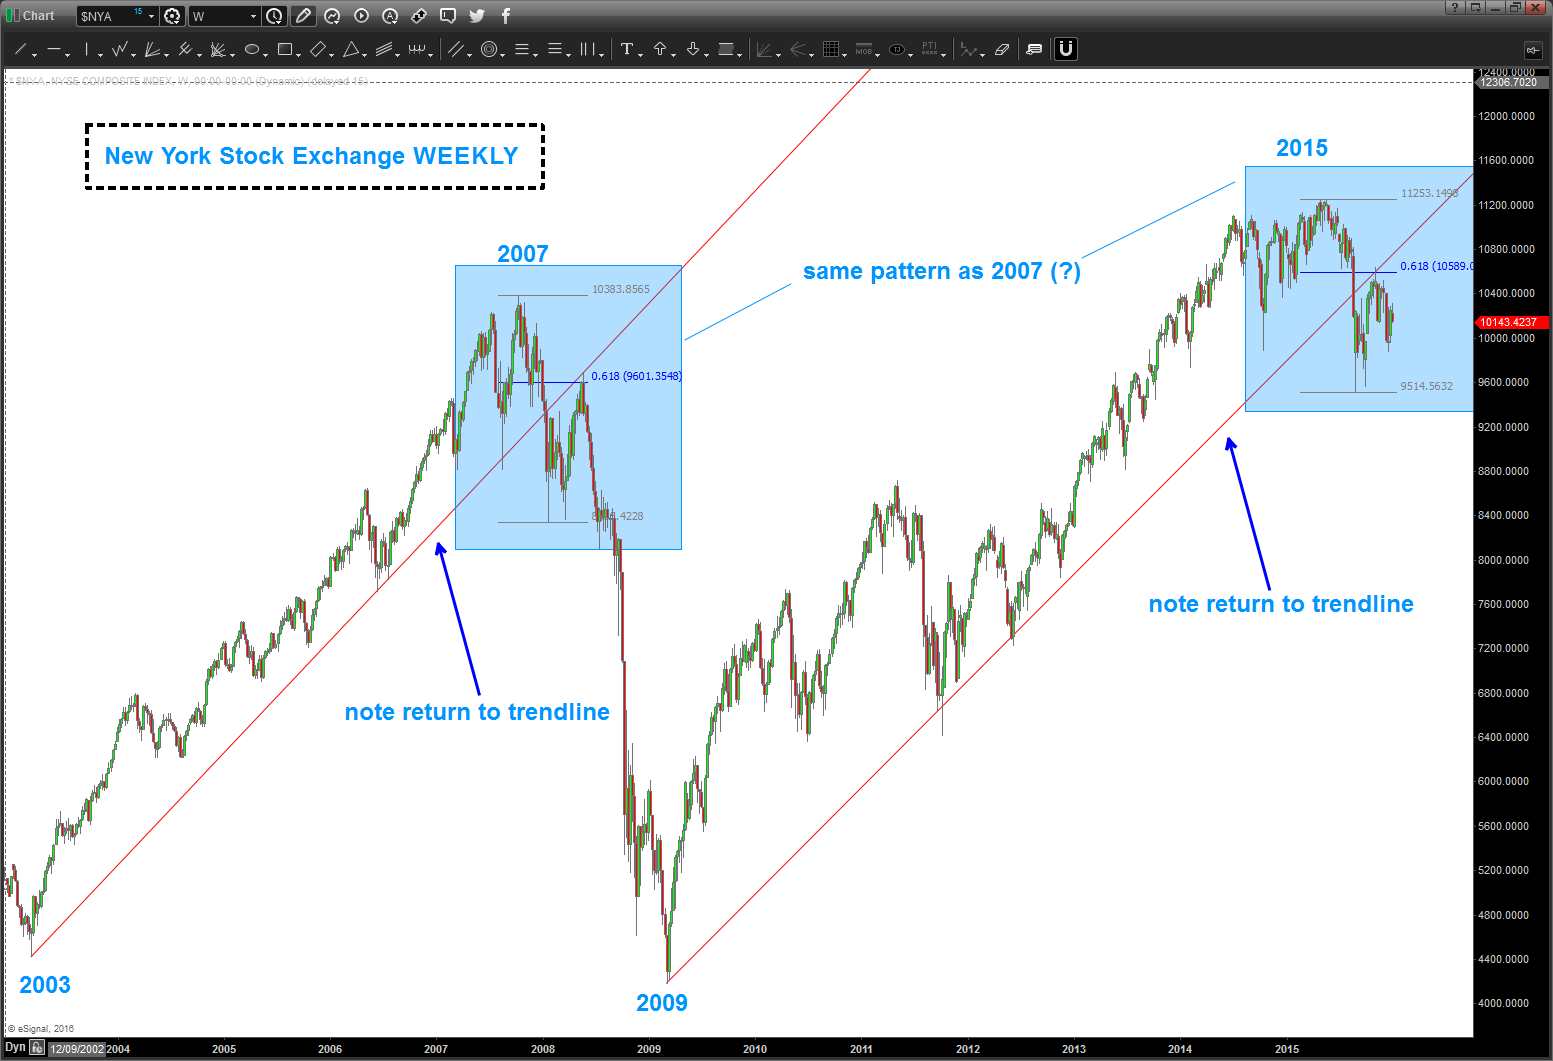
New York Stock Exchange … $NYA doing the same thing as 2007
Posted on January 3, 2016 Leave a Comment
two things to note:
- the trend line break and then the retest right at the .618 retracement from 2003-2007 trendline.
- CURRENTLY: the trend line break and then the retest at the .618 from 2009-2015 trendline.
lower highs since April 2015 …. just a pattern.
hope you have had a wonderful wonderful…
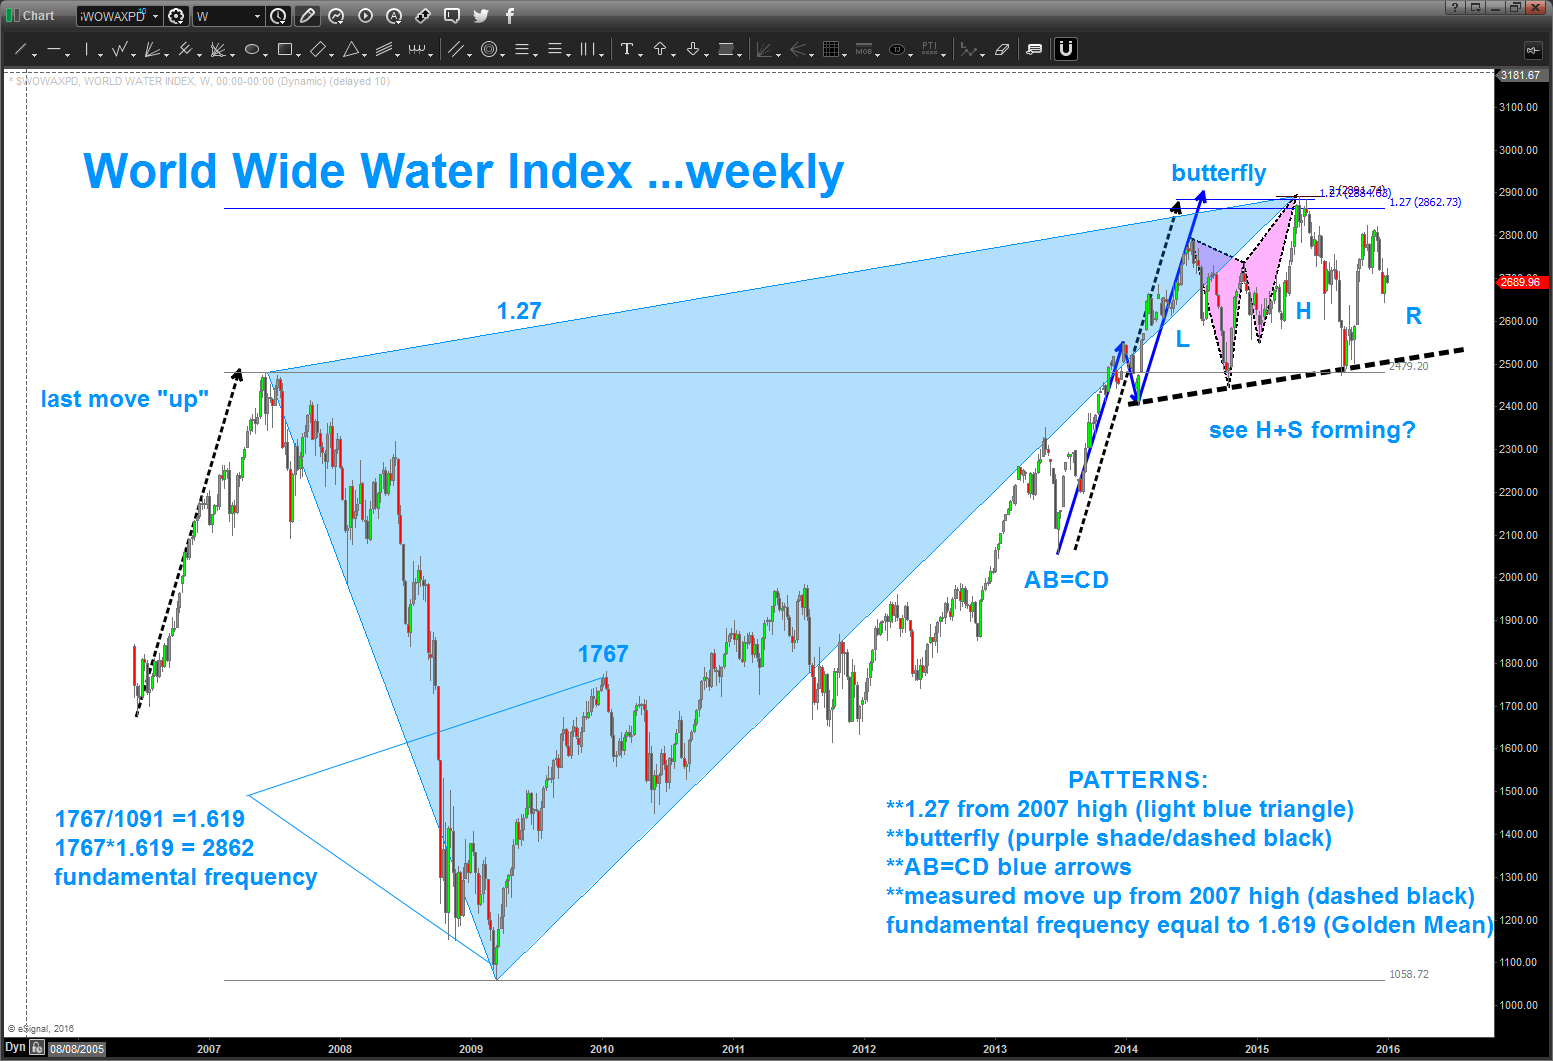
the ripples in the water of the World Wide Water Index
Posted on January 2, 2016 Leave a Comment
- the market is vibrations.
- vibrations are waves
- when a rock, for instance, hits a pond it produces waves that manifest outwardly
- in the market, the ROCK IS THE INITIAL IMPULSE MOVE
- we divide the high and the low and we get the fundamental frequency.
- in this case it’s equal to – basically – the golden mean – 1.619
- 1.619*1767 = 2862 and THAT landed right on the 1.27 extension (square root of 1.618) of the 2007 high.
so, we have a lot of patterns coming into play and that is arcing out the “standard” H+S pattern w/ the neckline shown by the dashed black line …. looks like 2500 ish is the neckline … a weekly close below that is something to watch …big time.
cool, hugh?