so you want to be a Pattern Recognition expert …
Posted on December 19, 2015 1 Comment
go to this website: http://www.constructingtheuniverse.com/
if it resonates w/ you …welcome to the journey and email me.
Bart
Using Elliott wave, the easy way
Posted on December 12, 2015 Leave a Comment
I love Elliott Wave – when it works.
I used to teach CMT III and the Elliott Wave principle and tried to make it easy. I am guilty, probably like a lot of you, of trying to count every squiggle and label this sub-wave that sub-wave and into oblivion we go.
So, here’s how I use it:
- LIVE BY THE RULES
- 2 can’t go below/above the beginning of 1
- 3 can’t be the shortest
- 4 can’t correct and overlap the end of 1 (we’ll get to this later)
- If you can’t count it, it’s probably correcting.
- If you see a 3rd of a 3rd figure out where it could end and BUY after Wave 4 correction over …
- If your going to study anything .. STUDY CORRECTIVE MOVES!
- Flats, Zig Zags, Triangles, Double and/or Triple Three’s, etc.
- Again, if your going to study anything… STUDY THE CORRECTIVE MOVES.
That’s it … if your a sub-wave of a sub-wave kind of guy/girl so be it. count away!
so, why bring this up now?
Well, we are at a critical juncture and, understanding the wave principle RULES will help.
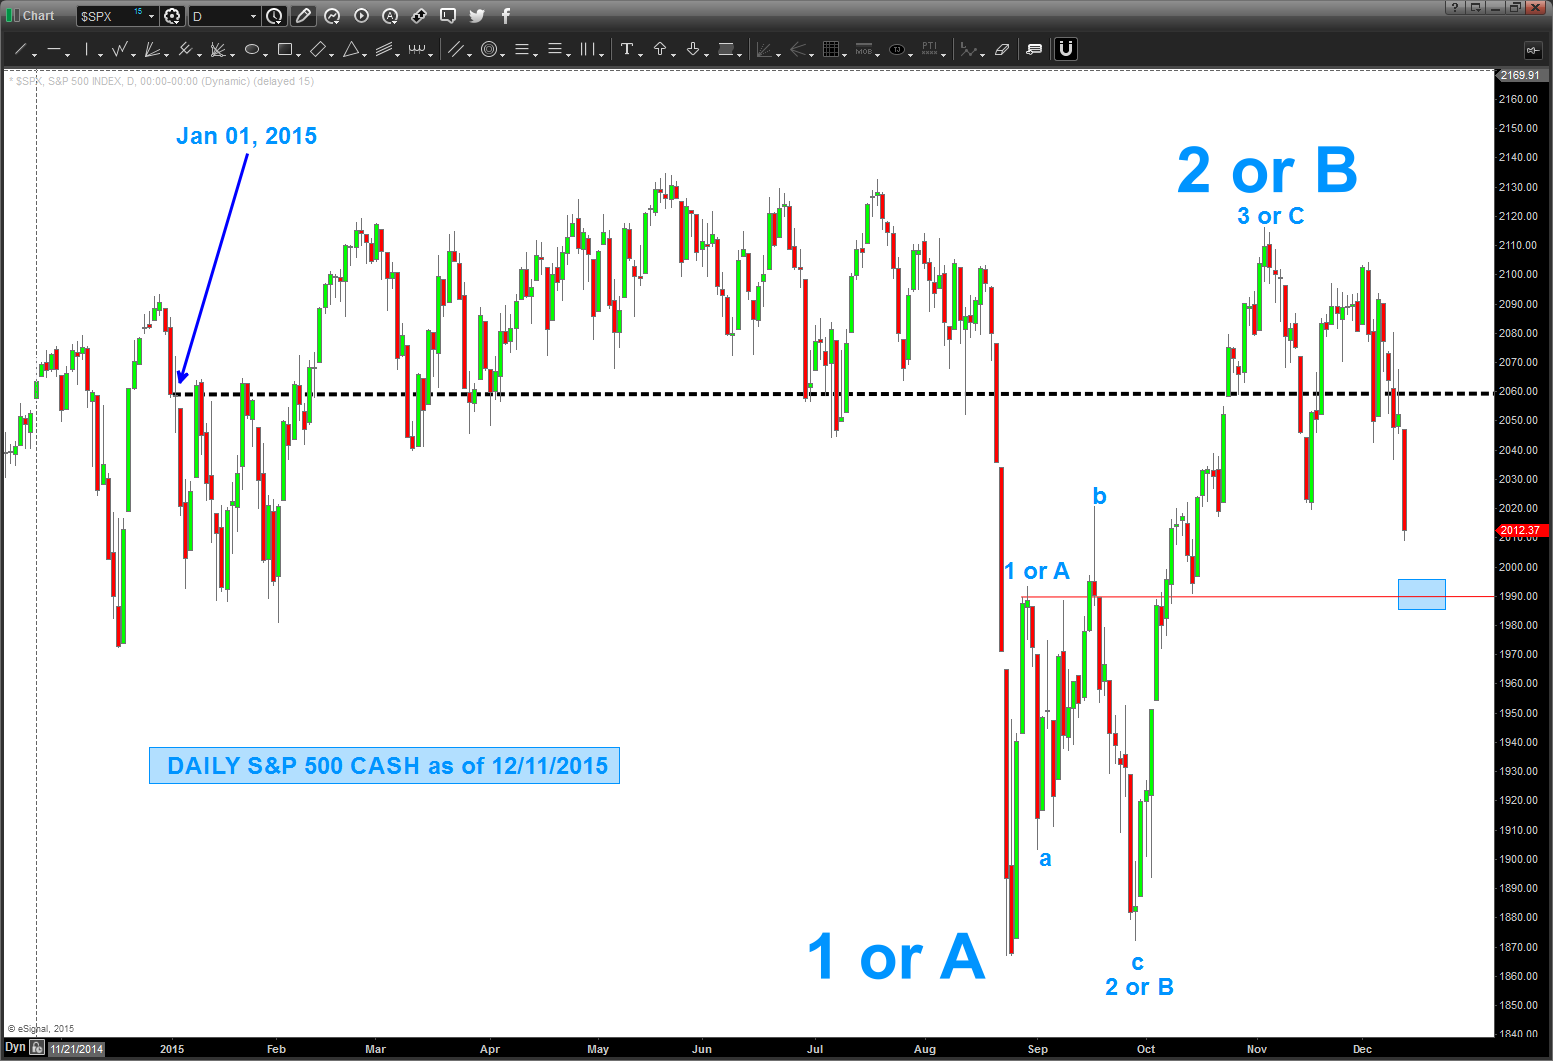
below is a daily chart of the S&P 500 cash since January 2015.
note I didn’t label the top a 3 or 5 … I’m not ready to do that because I want to see what happens next week.
you see, let’s go back to the 4 can’t correct and overlap the end of 1.
see the blue rectangle around 1990 (go Navy, class of 1990 (that’s synchronicity at it’s best on Army Navy day) ? IF we are to go higher in the near term and take out the new highs for another run we cannot close on a daily basis below that level. I don’t mind if we get an intraday spike below it but close above it on a daily or weekly basis but if we take that level out then the August lows will be attacked.
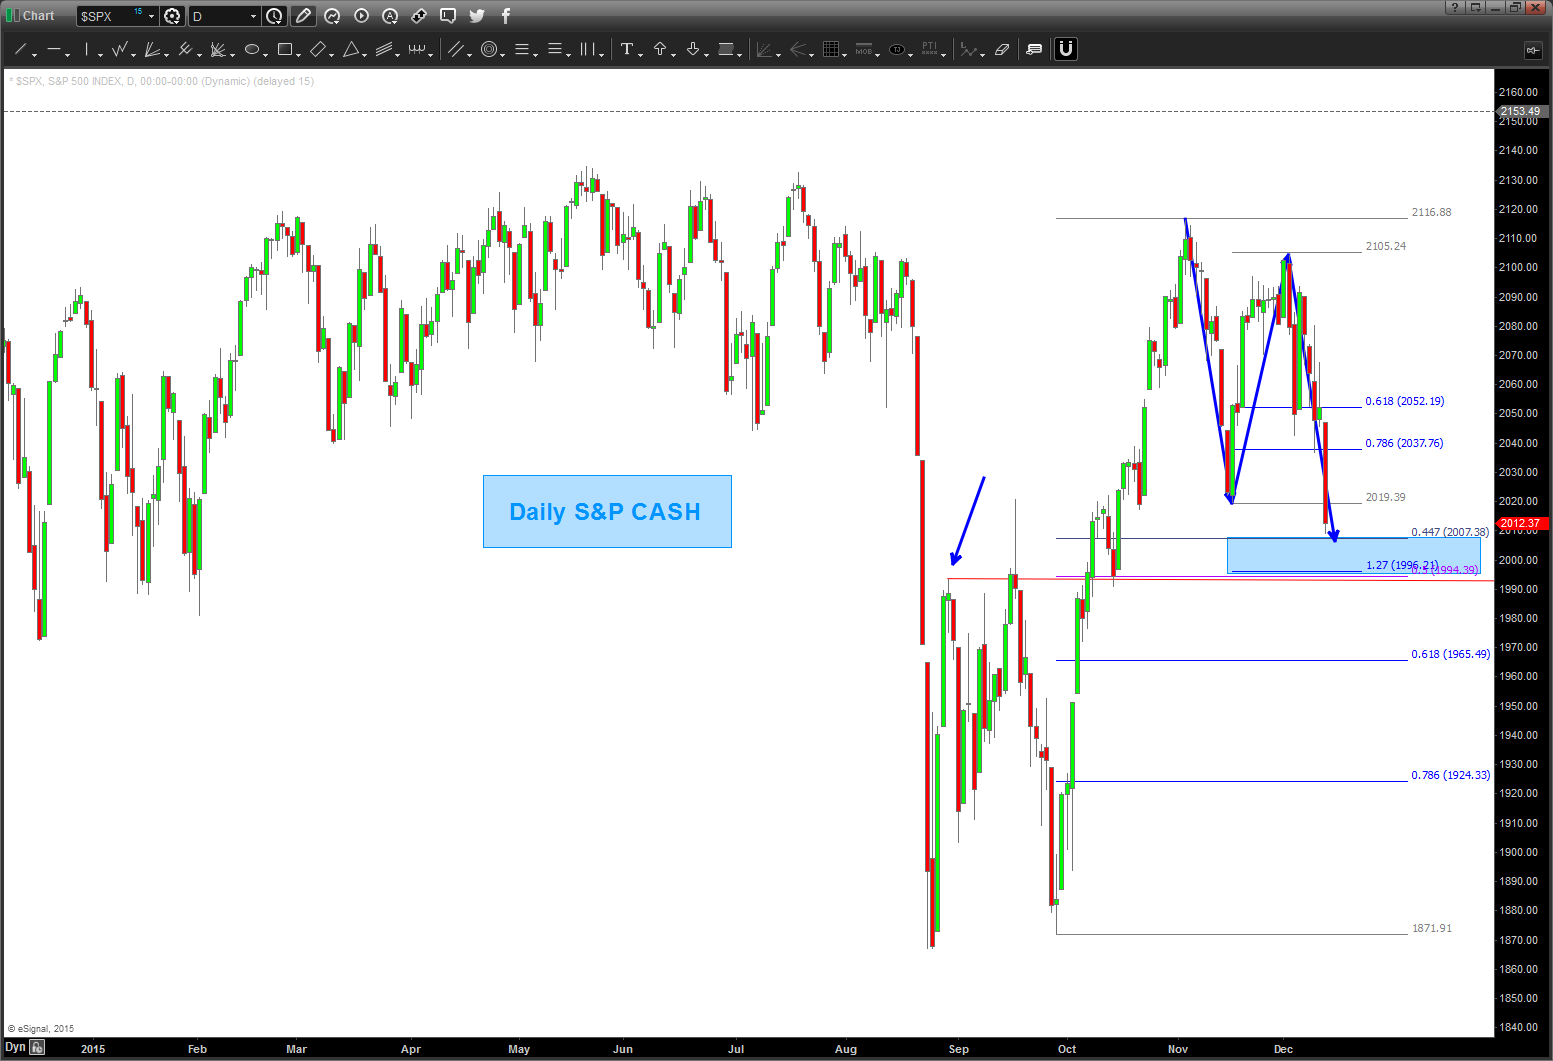
it’s that simple …we are finishing a near perfect BUY pattern on the cash index. as we have shown when patterns fail, the move is usually big and strong in the opposite direction of the pattern. if this BUY pattern works, then wouldn’t be surprised, at all, if we attack 2120 and higher in the coming months.
make sense?
Bart
here’s the BUY PATTERN ..
 .
.
Parabolic Velocity ….and $MO an update ….an update
Posted on December 11, 2015 Leave a Comment
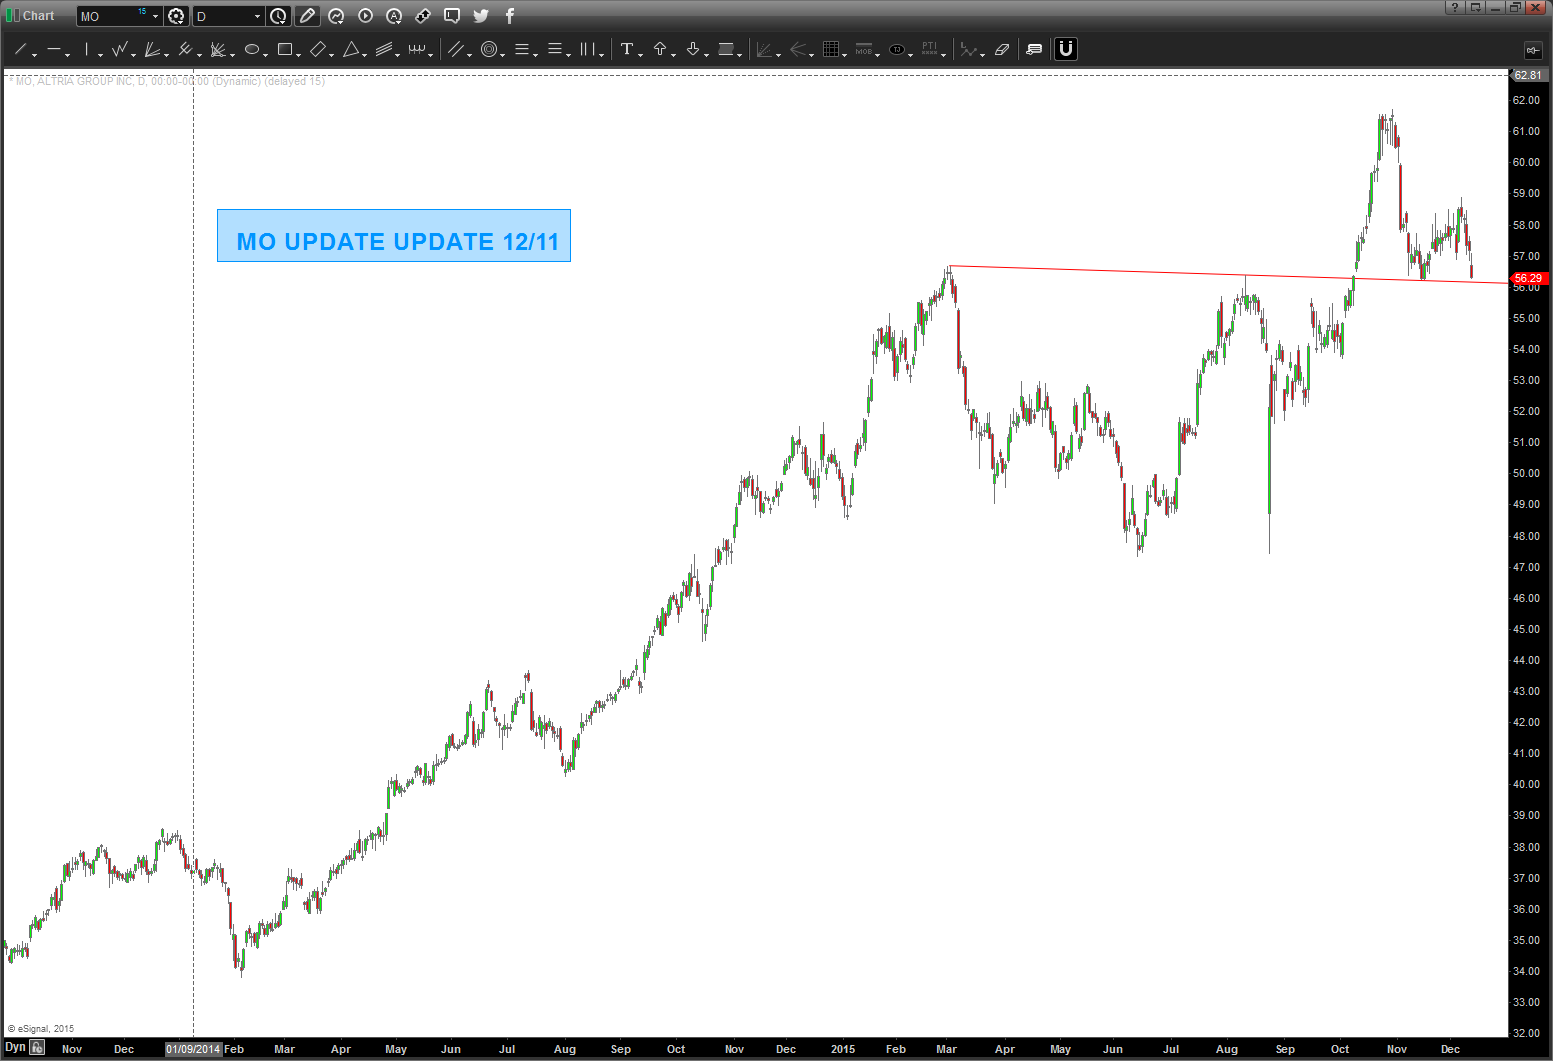
12/11: update to the update. again, still don’t know what Altria Group Inc. does. but I do know how to draw a trendline and it bounced off it and now IF it breaks below it on a daily close THEN it should go lower.
your 150 paged EBITDA, P&E, fundamental report complete in one chart. Pardon the sarcasm. Got hate mail on @stocktwits for this one also … it’s comical.
sometimes you eat the bar, and sometimes the bar eats you. https://www.youtube.com/watch?v=aPVLyB0Yc6I
Bart
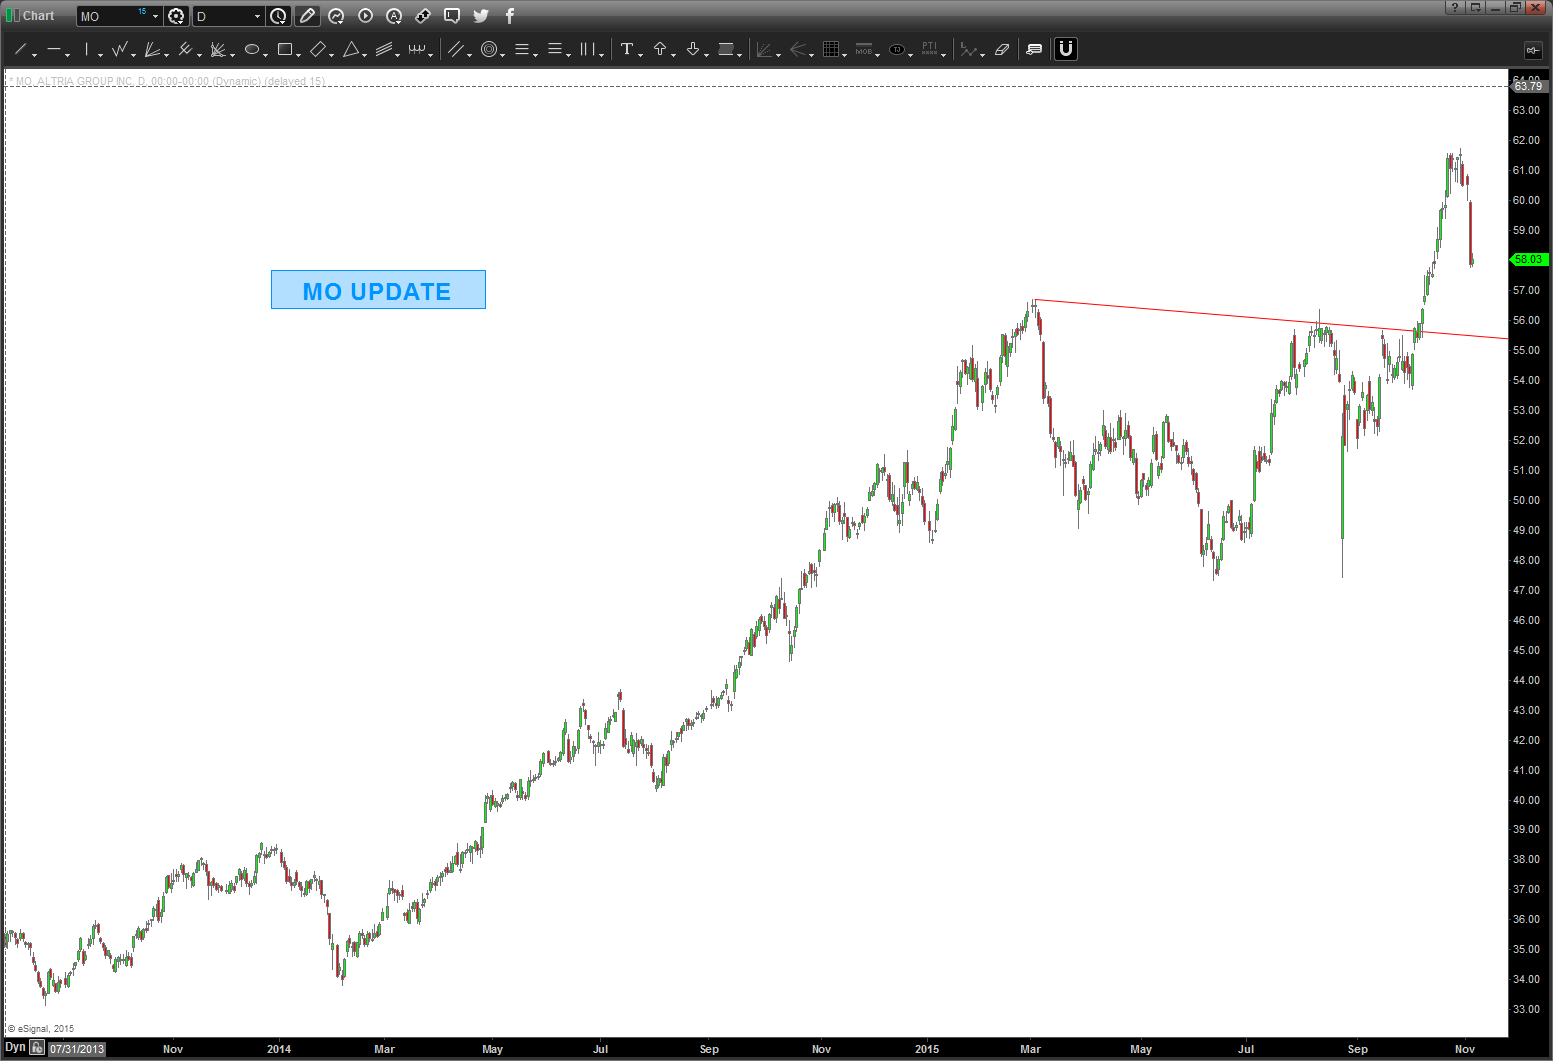
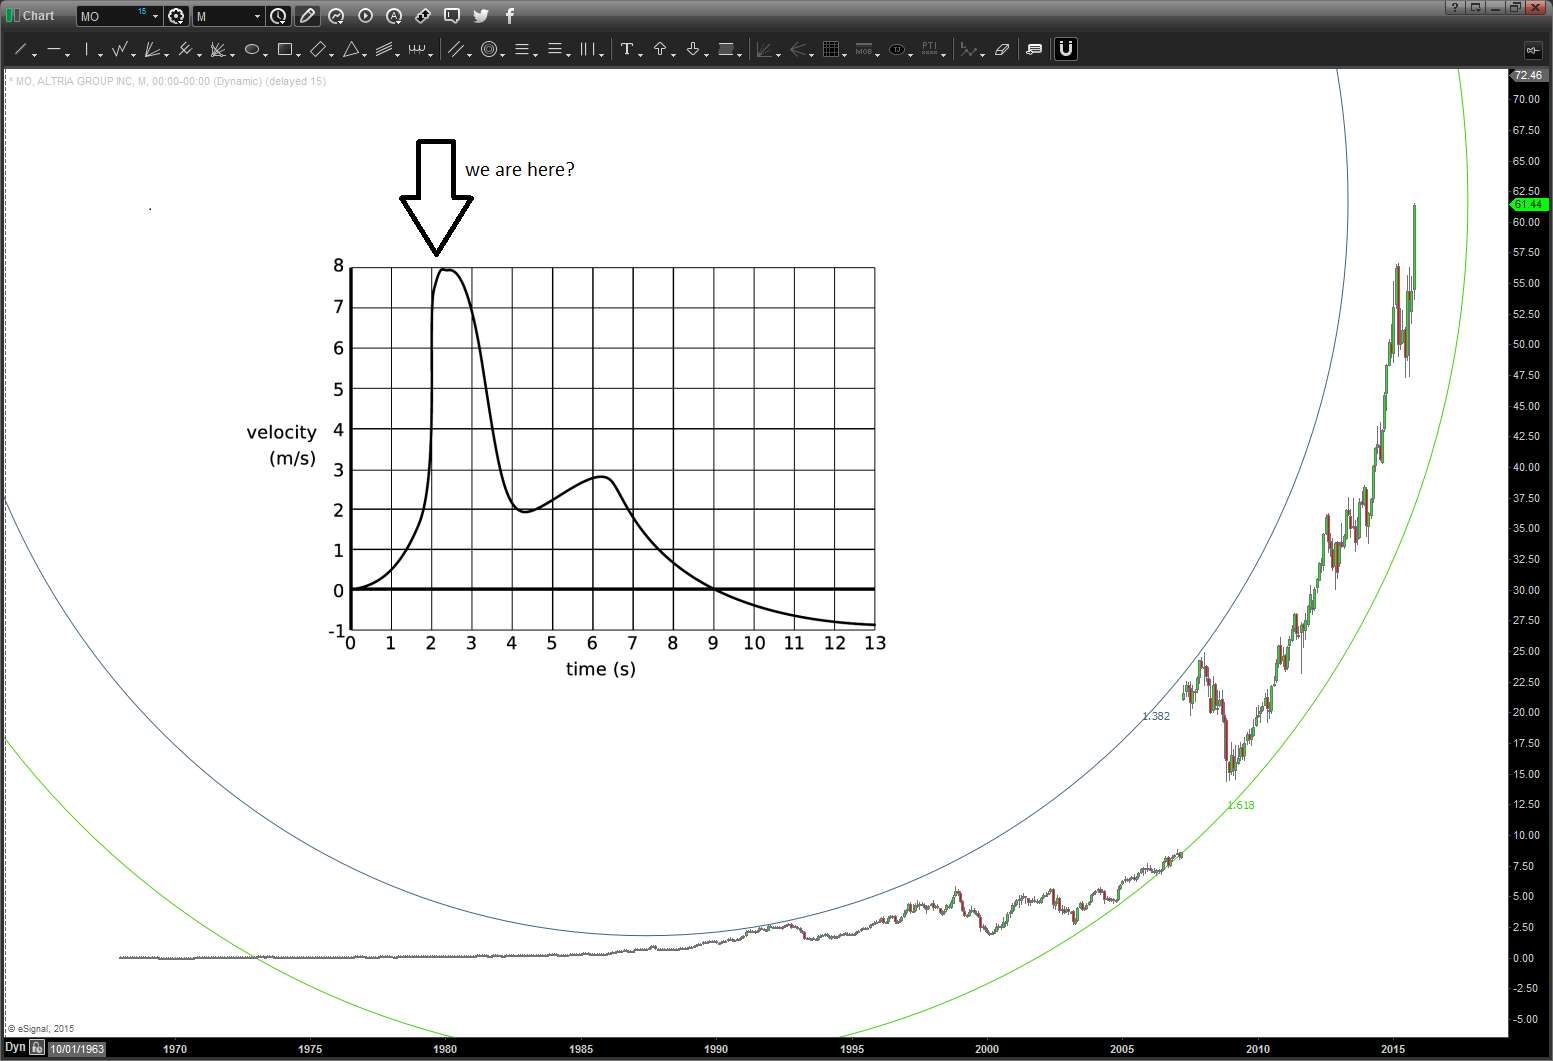
11/4 – update. again, I don’t even know what the Altria Group Inc. does … but I do know that parabolic velocity can only hit a certain Ps=0. What the hell does that mean? Well it’s the VN diagram when fighting a high performance fighter. You see at ANY given time in a fight you have a certain airspeed, altitude and G that will give you a turn radius and turn rate. In order to NOT give up energy you wanted your sustained rate of turn/radius to stay constant …. if your going to rip the g’s on and get a really powerful turn RADIUS going then your going to give up energy…. so you better be right OR your going to have to UNLOAD and get energy back and that will make you arc like an albatross. Get it .. Ps=0 might not be the best turn rate or radius but you know that your not giving up any ENERGY.
MO … tons and tons of VELOCITY but guess what? to get that HIGH of a price and go parabolic “it” had to be all in and a certain point you ain’t got “no moe thrust” and it stops and falls.
is this the top? I have no idea, but having been in many many 2 circle and 1 circle fights you learn to SEE how your enemy is doing/reacting and this puppy ($MO) gave it ALL. It’s time to UNLOAD (go down) and get some more knots (ENERGY) up to make another run …
watching this one, a move down into high 40’s not out of the question …
first stop SHOULD BE the top of that read trend line …
Bart
spent some time in the Navy and, one time, we (two seat Tomcat) decided to “see how high we could get from sea level” off the coast of SOCAL. So, we lit the afterburners and got going pretty fast and then the pilot smoothly pulled back on the stick and very soon we were pointing 90 degrees nose high and climbing like a bat out of hell. Pretty cool … and we kept climbing and climbing and finally (you could hear the TF30 engines grasping for any air) topped out around 55K feet or so … you could see the curvature of the earth. The ECS (environmental control system) was working overtime trying to keep the cockpit pressurized and …. we simply couldn’t go any higher, even w/ the engines going FULL GRUNT AFTERBURNER, it simply stopped.
guess what happened next? we fell like a stone … just left the hands off the controls and that was it … we had exhausted the power of the Tomcat to go any further …
folks, same thing happens w/ stocks. IF you can get into a pre-parabolic move based on your decision criteria (technical or fundamental) then ride it and go w/ it …. however, once you “sense” the parabolic stage then take some money off the table. I’m going to say it again … they have NEVER ended well. and depending on the size of the motor taking you straight up – it will eventually fail. Gravity is real in both a physical and subconscious way. Subconscious? Yes, the euphoria of the monster bullish move and the despondency of the bearish move will, eventually, yin-yang you and take off in the opposite direction.
here’s MO … were either “here” now or close to being parabolic. stay tuned …
continue to make it a great week.
Bart
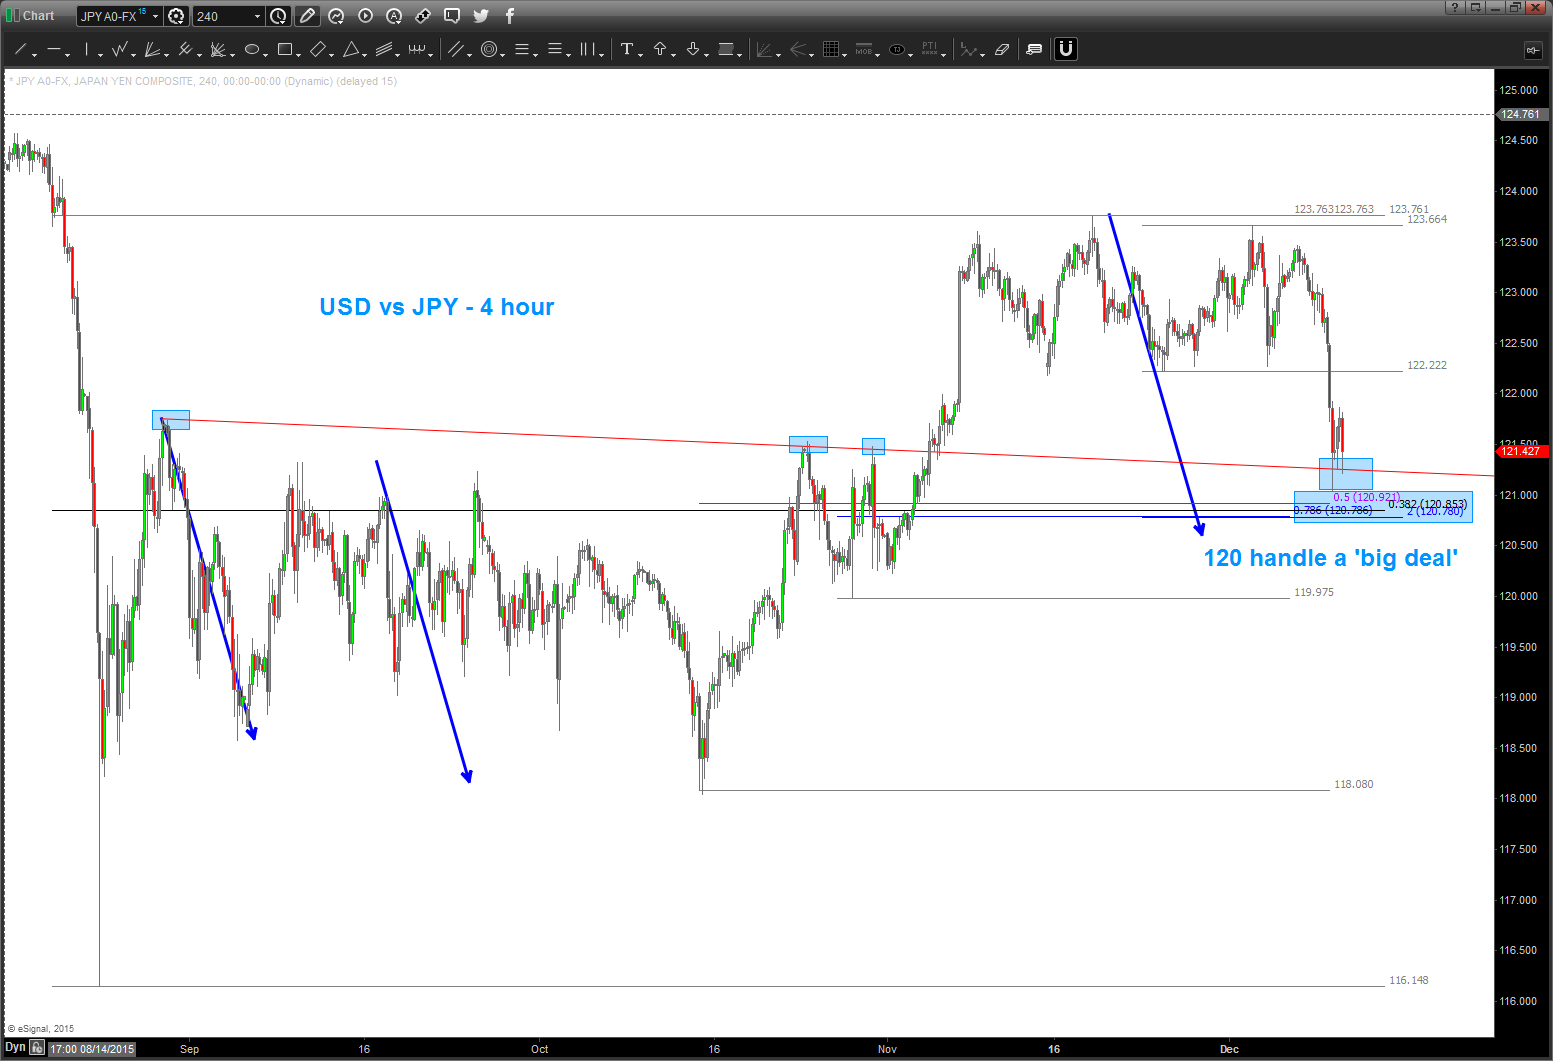
USD vs JPY – crucial support
Posted on December 10, 2015 Leave a Comment
again, if your a bull for equities, then we would like to see this level hold for the USD vs JPY.
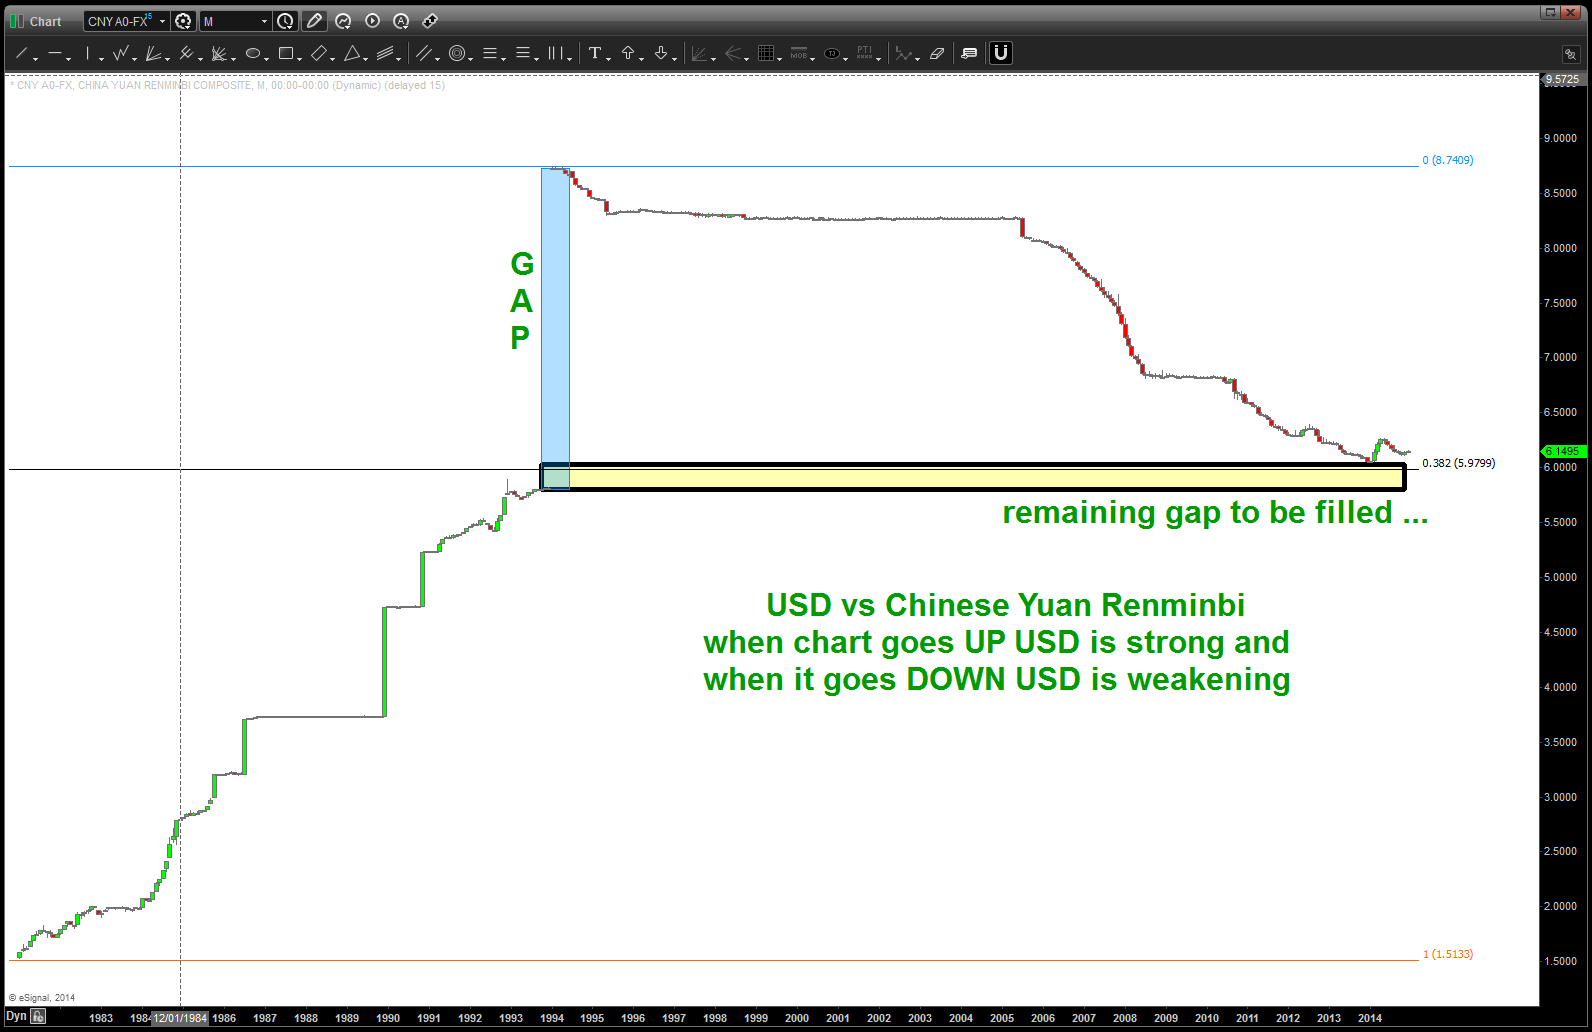
most important chart to end 2014 .. revisited in December 2015
Posted on December 9, 2015 Leave a Comment
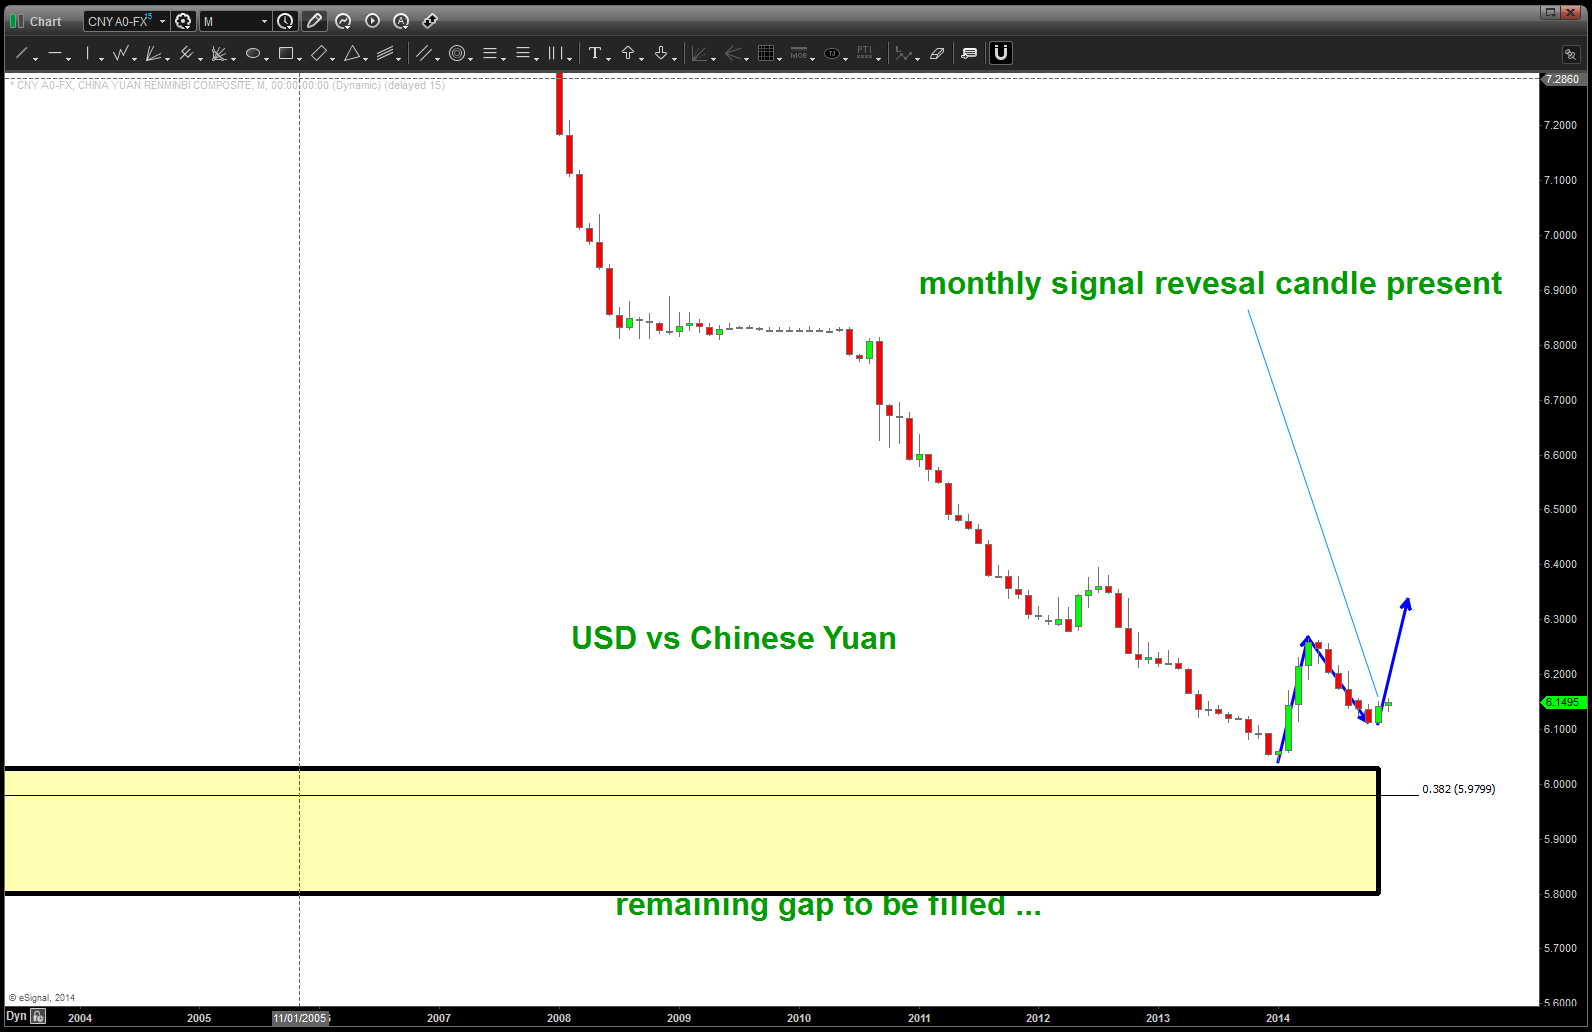
Folks, pay attention here … I know I can’t make this my “most important chart of 2016” like I did last year for 2015 but the dollar is on the move again versus the Chinese Yuan.
this is a big deal folks …
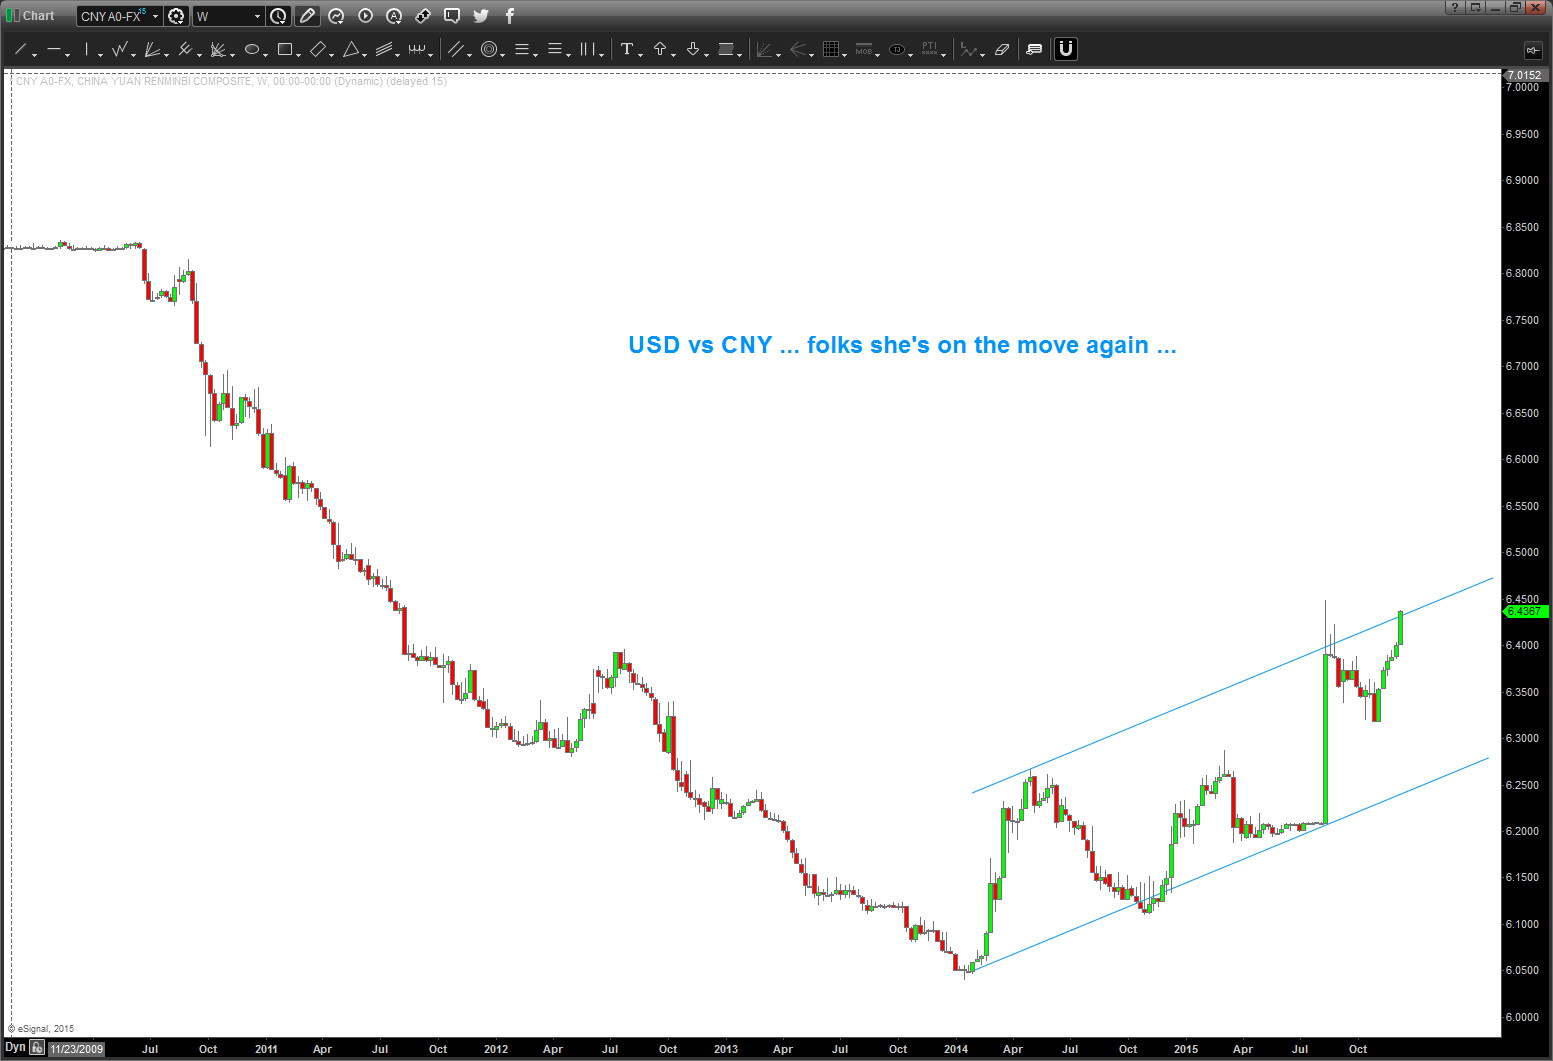
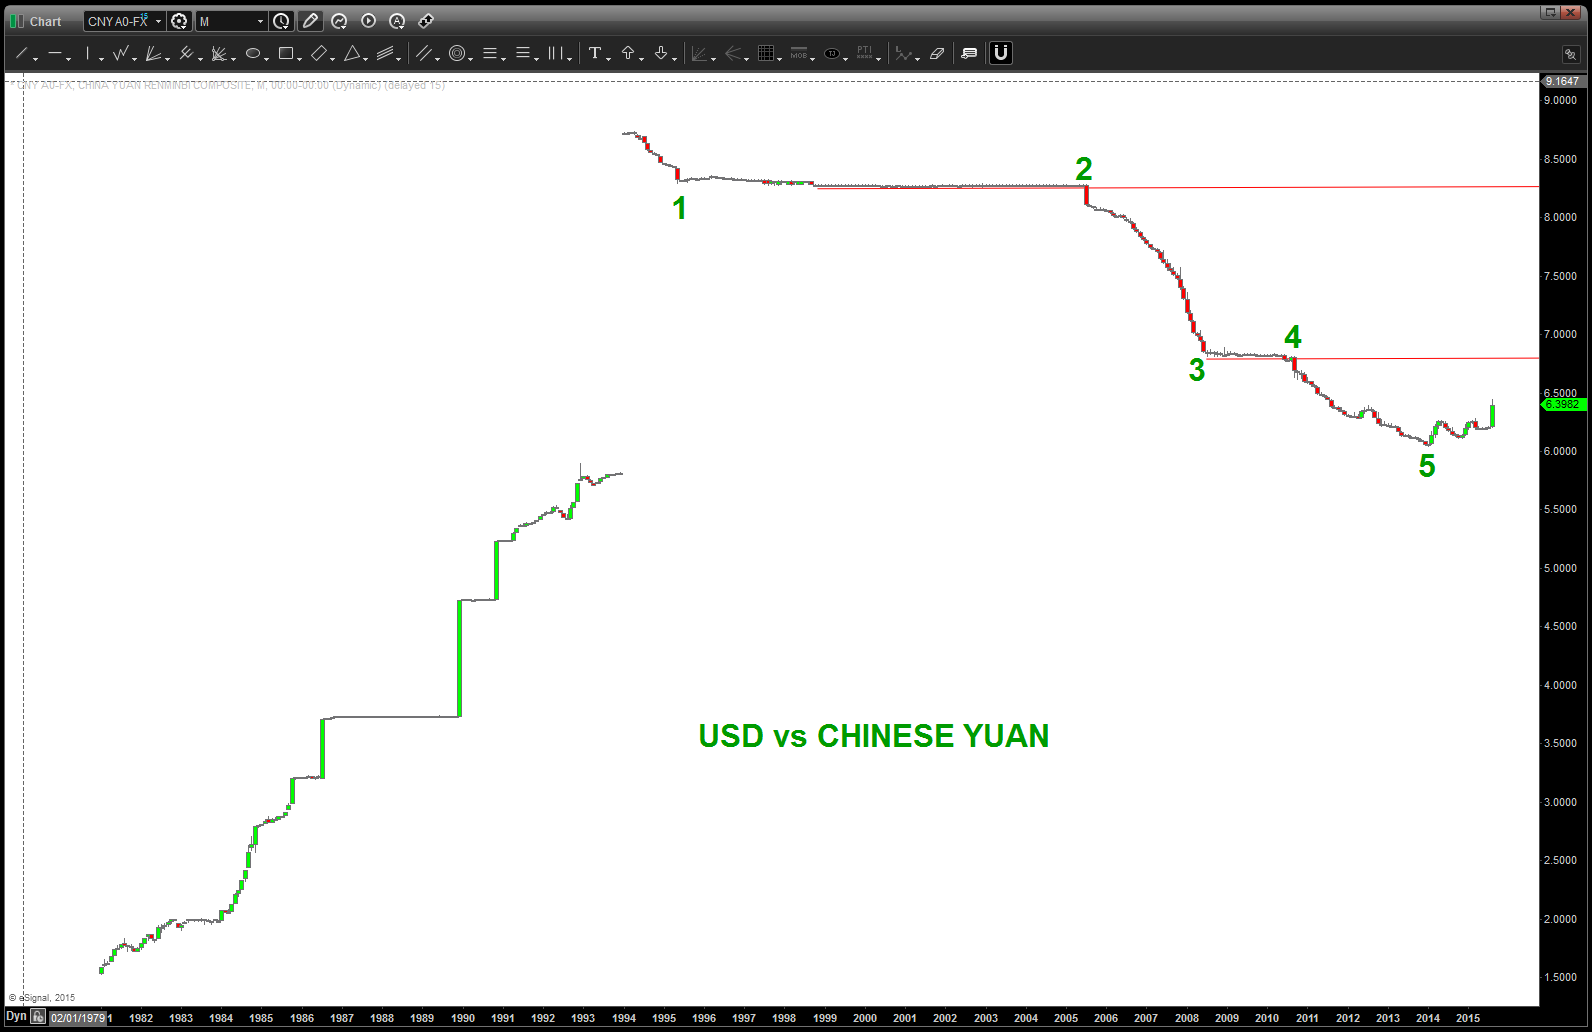
I felt pretty strongly about this one back at the tip of the year. I still do … here’s what I know – FX is the name of the game. Again, you can watch, talk and also make a lot of money trading the $YELP, $GPRO, $GOOGL, $AAPL, etc of the world but the REAL market is the currency market … this past year we have had a very real race to debase. and, quite frankly, it ain’t good folks.
This move by the Chinese was 1) expected and 2) ranks up there as a very big deal … nothing to really watch now, believe they are committed to depreciating their currency also.
One has to ask .. why is the worlds second largest economy taking these measures? Well, of course it’s because all is well and the global economy is doing GREAT! Or, could it be a global sovereign debt crisis and a house of cards?

Folks, there is a major global move occurring in the biggest market in the world – the FX market.
Not only is the YEN,RUBBLE and EURO simply crashing the Chinese Yuan continues to weaken against the USD. This is a big deal and should be watched closely. We’ve been blogging about it for a while (https://bartscharts.com//?s=yuan )
Appears, for now, our pattern has worked and the $$$ has again started to rise …
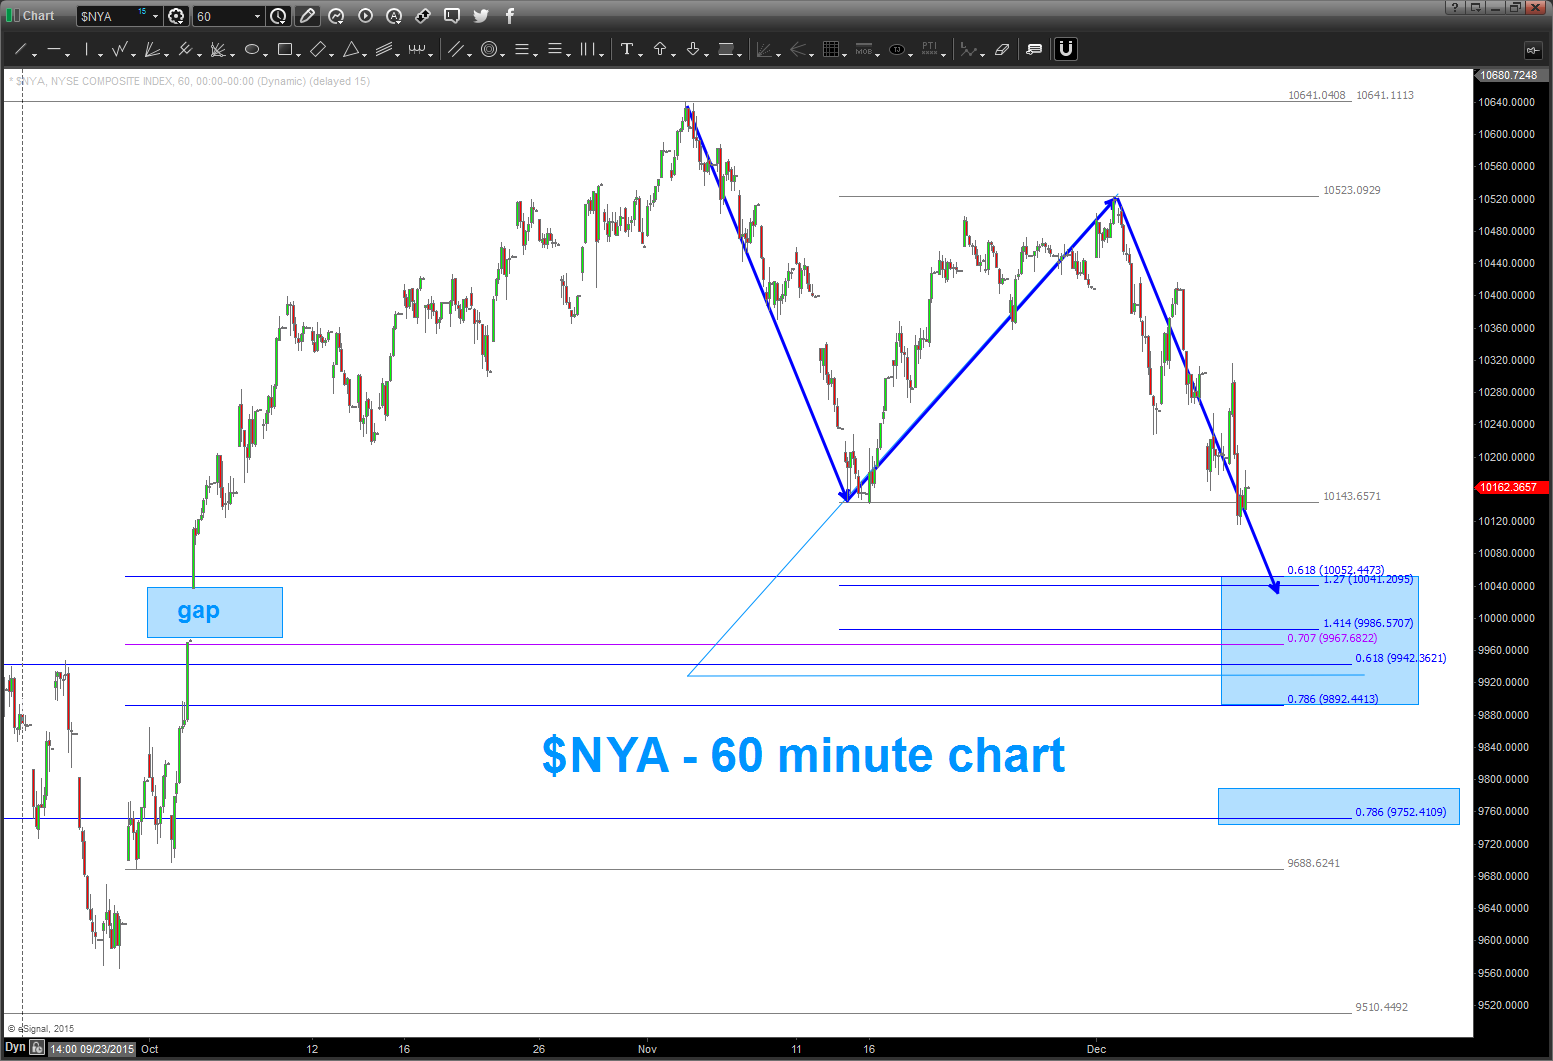
New York Stock Exchange Index BUY patterns coming into play
Posted on December 9, 2015 Leave a Comment
I know the DJIA, S&P, Russell and all of that is important.
but, for me, to get a really good look at everything – I use the New York Stock Exchange Index.
why?
“The NYSE Composite is a stock market index covering all common stock listed on the New York Stock Exchange, including American depositary receipts, real estate investment trusts, tracking stocks, and foreign listings. Over 2,000 stocks are covered in the index, of which over 1,600 are from United States corporations and over 360 are foreign listings; however foreign companies are very prevalent among the largest companies in the index: of the 100 companies in the index having the largest market capitalization (and thus the largest impact on the index), more than half (55) are non-U.S. issues.[1] This includes corporations in each of the ten industries listed in the Industry Classification Benchmark. It uses free-float market cap weighting.”
It’s big and it just gives a good feel for the overall market.
It’s coming into a VERY key area of support shown below. IF YOUR A BULL THEN THIS IS THE AREA TO GET LONG (with a stop) and if the level fails then something is not right. Don’t try to rationalize it, have a plan. We’ve had an amazing 6 year bull run. And, as a PATTERN recognition swing trader, the rules state to BUY the first PATTERN that comes along. Well, since August, this is the “cleanest” buy PATTERN to come along.
Also, as readers of this blog you’ll realize that sometimes the patterns are PERFECT and SPOT ON. At other times, they slip thru some levels but ultimately continue on their way.
Where is the bull thesis wrong? Right now, those August lows are the key to this puppy continuing on ….
also, below is the XLP / $SPX ratio … it’s put in a series of higher lows (bullish ratio – bearish equities) and is banging, right now, up to a high-high trend line … WATCH THIS CLOSELY.

so … the selling that has occurred has been expected to simply finish the pattern. we are getting right into the areas where the patterns are completing.
watch these levels on the $NYA … if were going higher, they should hold. if not, well, hunker down for the time being and we’ll expand our time horizon and look bigger picture.
cheers
B
for my good friend Joe … $KMI
Posted on December 7, 2015 Leave a Comment
the internet and social media is amazing. we are ALL connected …
we found each other thru health care and … he’s an avid trader.
so from time to time we meet on Skype and talk Health Care (hint hint – radical innovation is occurring) and the market. I’ve “seen” bits and pieces of KMI on my Twitter feed and everything but when someone like Joe asks me to check it out (He’s a “health care” guru) I take it seriously.
so, he’s also a budding PATTERN recognition trader (I’m bringing him away from the dark side of fundamentals (I jest)) and he asked me to break KMI down in what I SEE and not believe.
- it comes down to PROJECT (basic AB=CD suffices), EXTEND (extend retracements off IMPORTANT lows), RETRACE and IF/WHEN all the numbers come together you decide to take the investment opportunity OR not.
- throw a momentum oscillator on there – and if you have divergence in the direction of the pattern – it helps.
don’t know what the heck is going on w/ KMI but we do have some “music/math/geometry” coming into play …
PROJECT
AB=CD – the basics of measured moves.
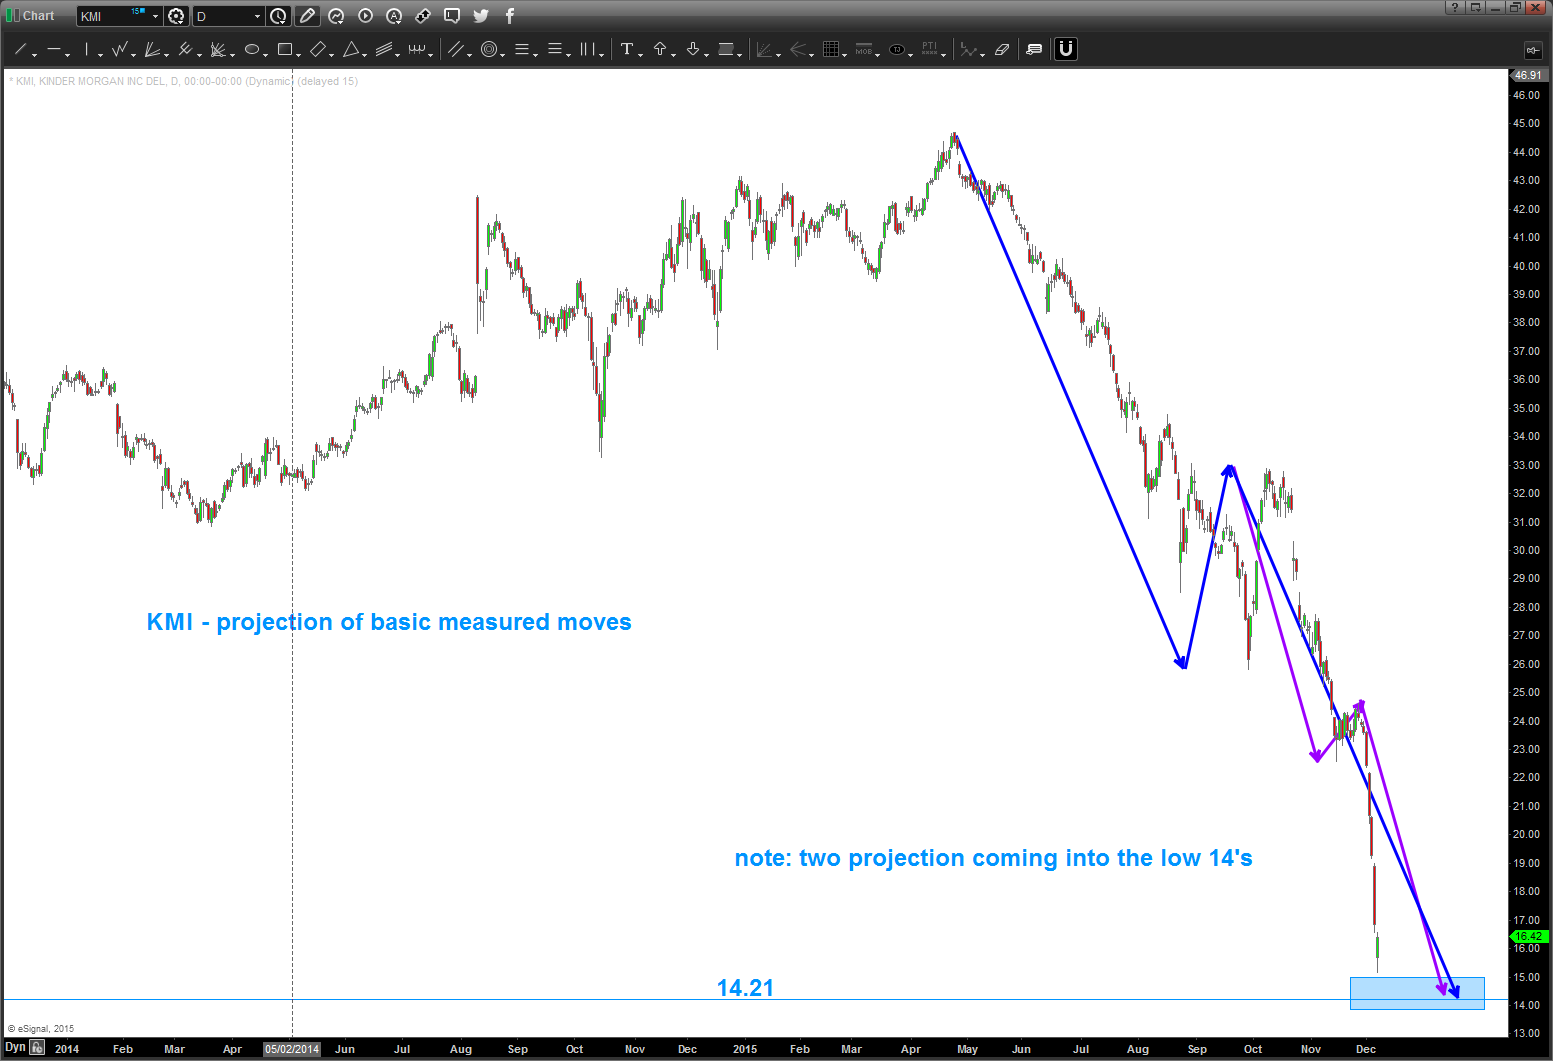
EXTEND
find – to the best of your ability- the KEY highs/lows of a march either UP or DOWN. Your eye will train to it … but this “key low” is easy to see – EXTEND off that low using sacred geometry, music, Fibonacci. guess what, the numbers come in around 14. Note, where the 1.618 extension comes in … put your STOP, if trying to go long, below there
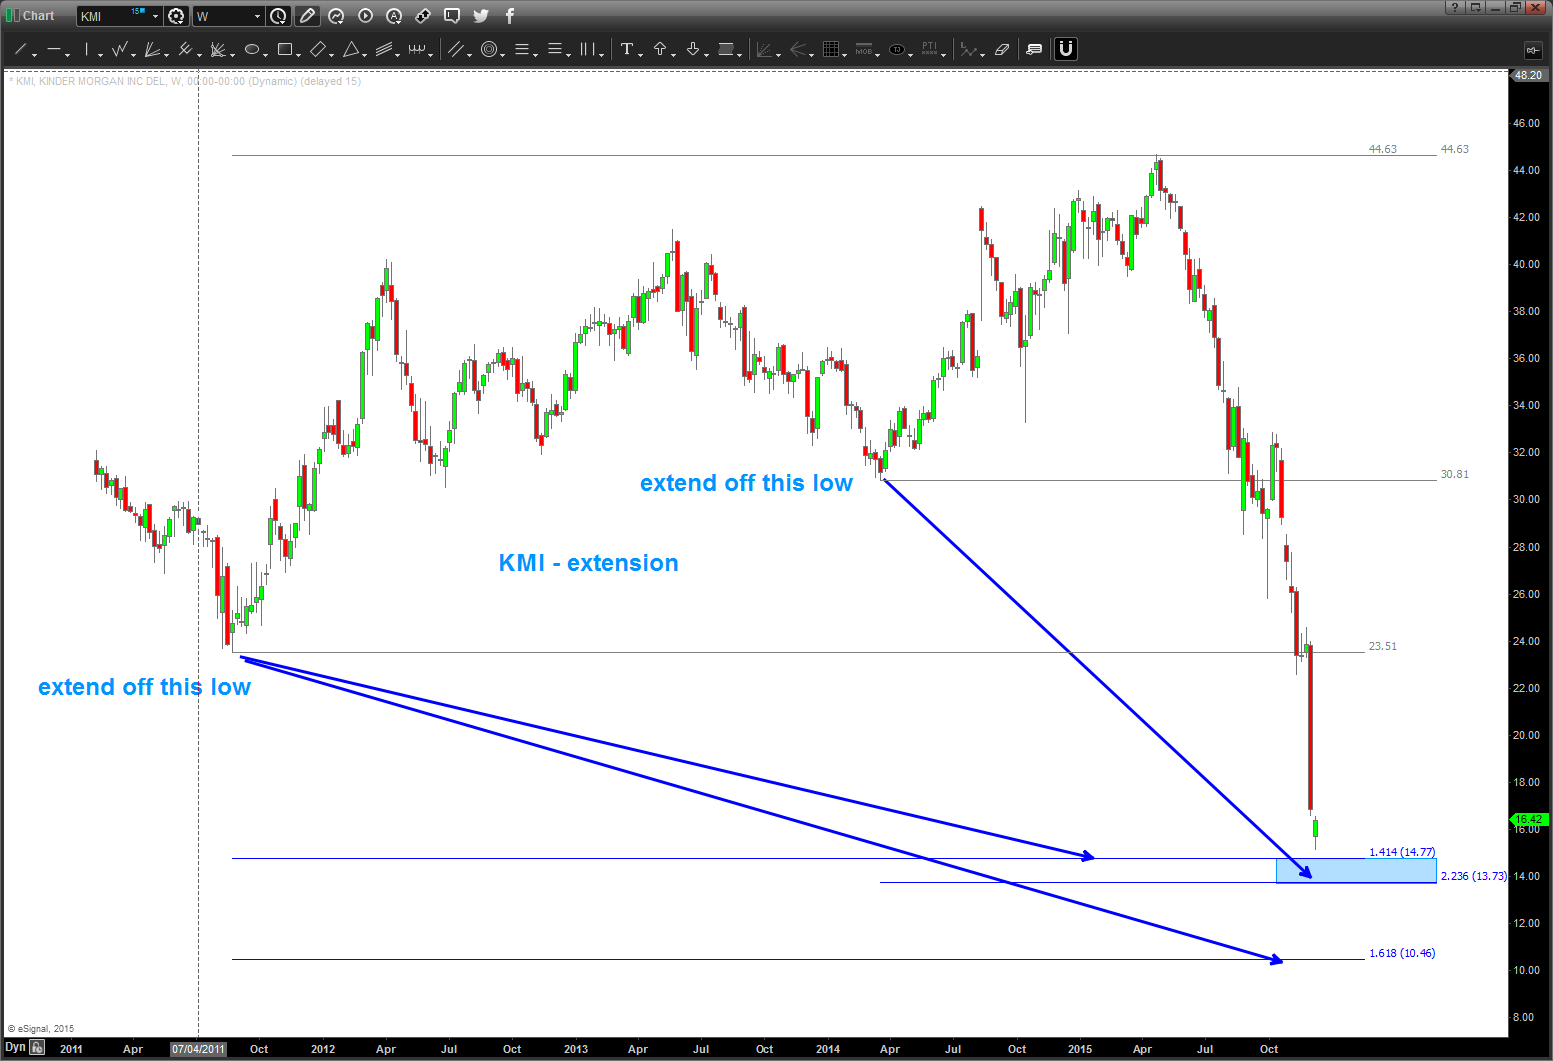
RETRACE
we can’t really retrace because we have blown thru the lows after the IPO.
Some recommend using “zero price”- which works- but I don’t think it’s necessary in this case. so let’s do some square root targets and you’ll find that 1.5 trips around the wheel is around 13.50 and you’ll also see with some basic TIME cycle analysis we are working on a 90 week cycle.
folks we hit that cycle this week …
so, as a PATTERN recognition investor:
- we have a bunch of math coming in around 13-14
- we have a time cycle coming THIS WEEK and have found support .. so, risk a 1 or 2 and go for it?
- what makes me “beg of caution” … STRAIGHT DOWN and when that happens patterns usually fail.
it’s all probability …but 13-14 looks “OK” to nibble on a long w/ a close stop? yes/no?
B
YIKES – mea culpe
Posted on December 7, 2015 Leave a Comment
here’s the UPDATED Loonie chart … nothing has really changed.
we have the bearish divergence BUT not being in LOG form the targets have opened up.
so, would work the targets w/in the Oil complex that I have blogged about to get LONG LOONIE. Have highlighted potential levels .. will update later in the week as this has the potential to be a good one.
M Y B US T ….
cheers ..
YIKES – I made a “rookie” mistake –
Posted on December 7, 2015 Leave a Comment
folks, mea culpe on the LOONIE chart from this AM. I did the entire monthly work on the LOG SCALE.
I was looking to short the USD vs LOONIE in around/here but it just wasn’t computing. I firmly believe in intermarket TA and w/ the OSX and Crude getting crushed this just didn’t make sense? How could all these measured moves and numbers be coming together IF I didn’t have the same patterns coming w/ the oil complex. T I L T …
I have VERY powerful targets on crude in/around 25-27 and they correspond to the OSX lower so … I made a mistake and was wrong.
Will update the Loonie tonight … don’t short around here.
Mea Culpe …
Bart
Yikes … look at this set up.
Posted on December 7, 2015 Leave a Comment
It’s ONLY probability ….but look at this set up coming in the USD vs LOONIE (Canadian Dollar)
It’s a pretty wide window, but we have a TON of “stuff” coming into play …
This will have big ramifications for the Oil Complex.
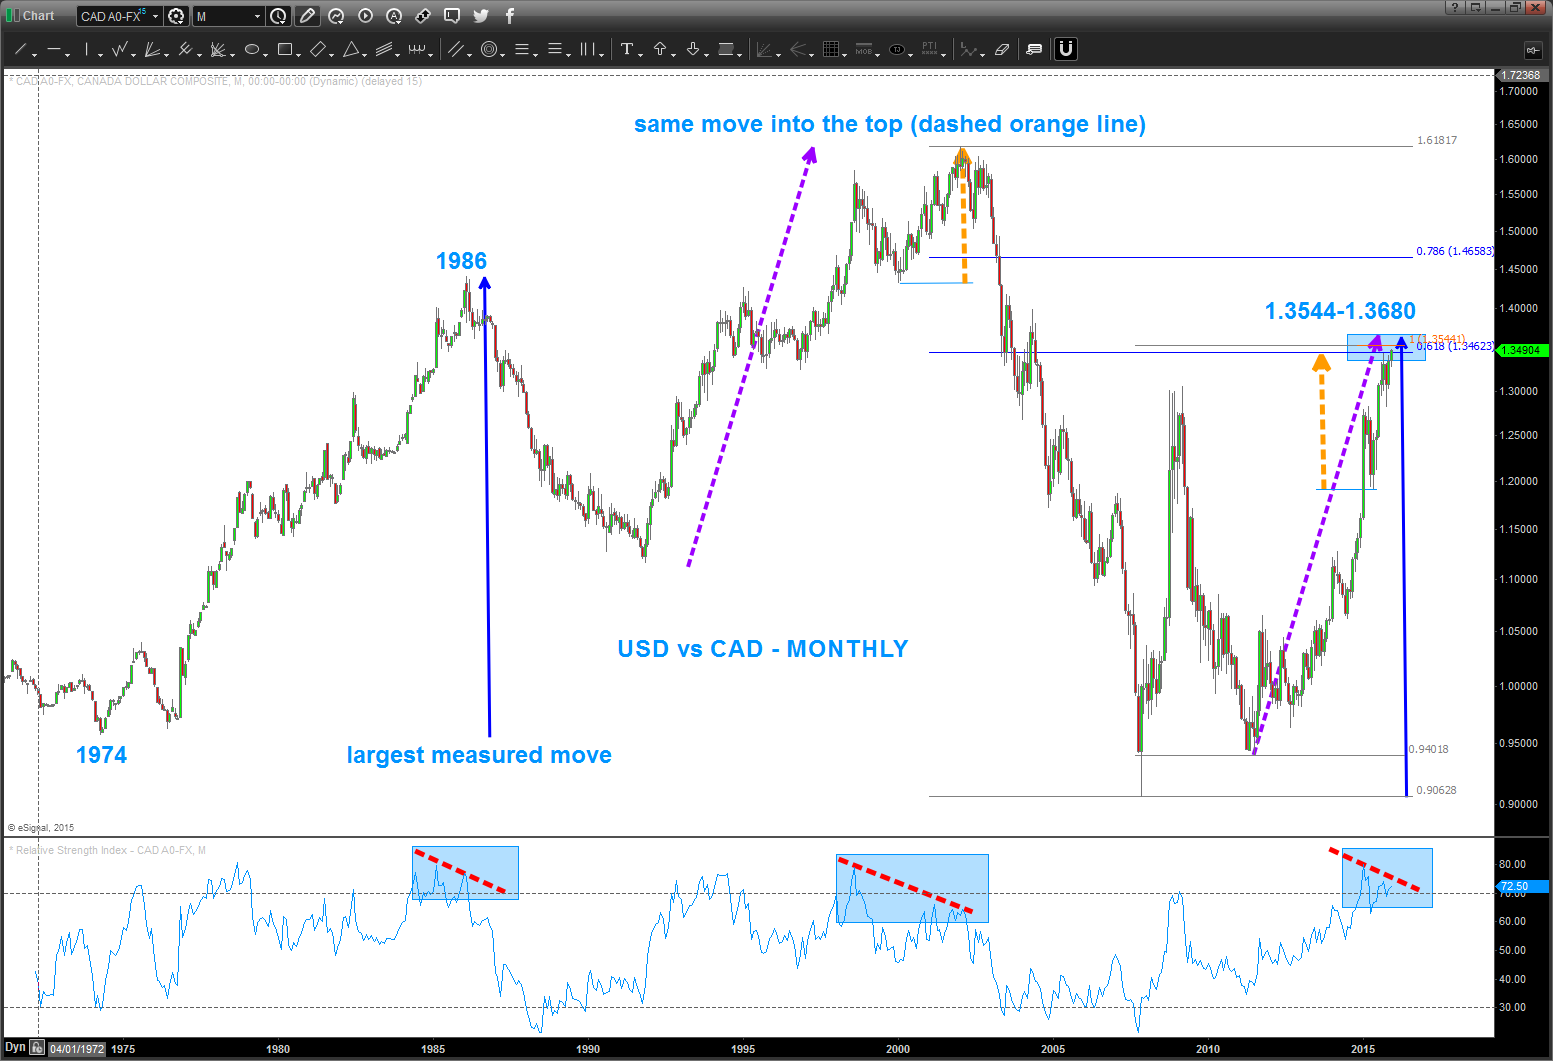
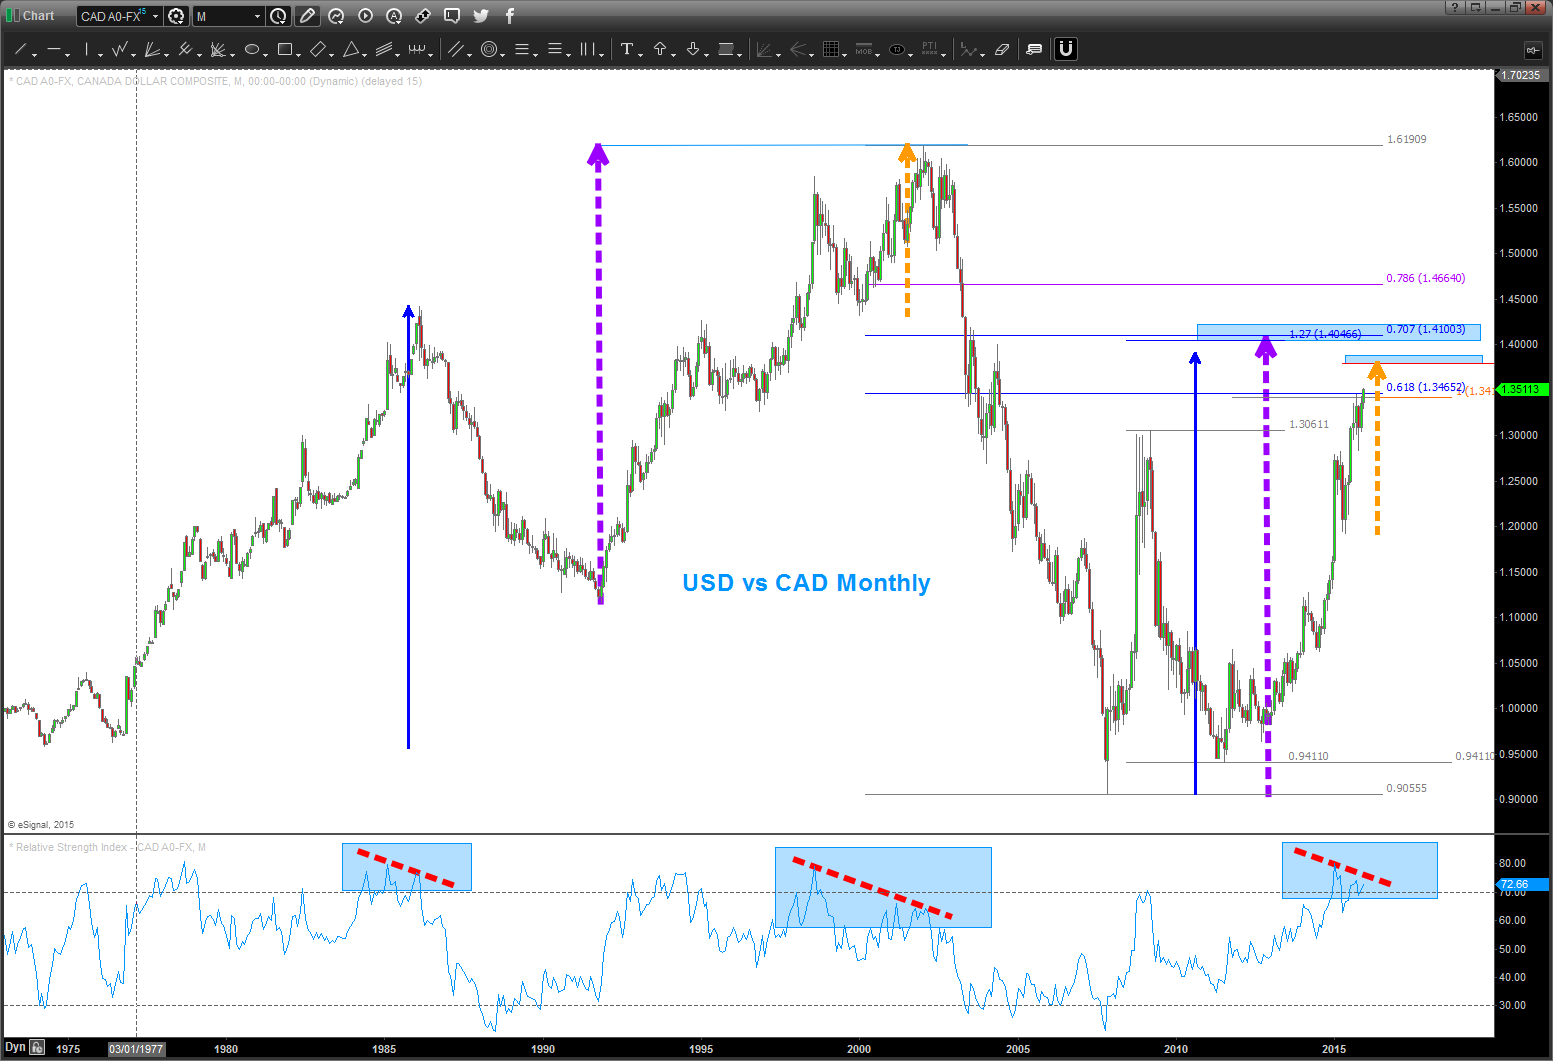
What do we have?
- Measured Moves
- blue vertical line is the LARGEST move UP in the history of this currency since 1971
- dashed purple line is a measured move prior to the high at 1.618 (yes that was the high)
- dashed orange line is the “last” measured move up before the high
- .618 retracement from the all time high
- AB=CD from the all time low
- MONTHLY bearish divergence
Here’s the weekly:
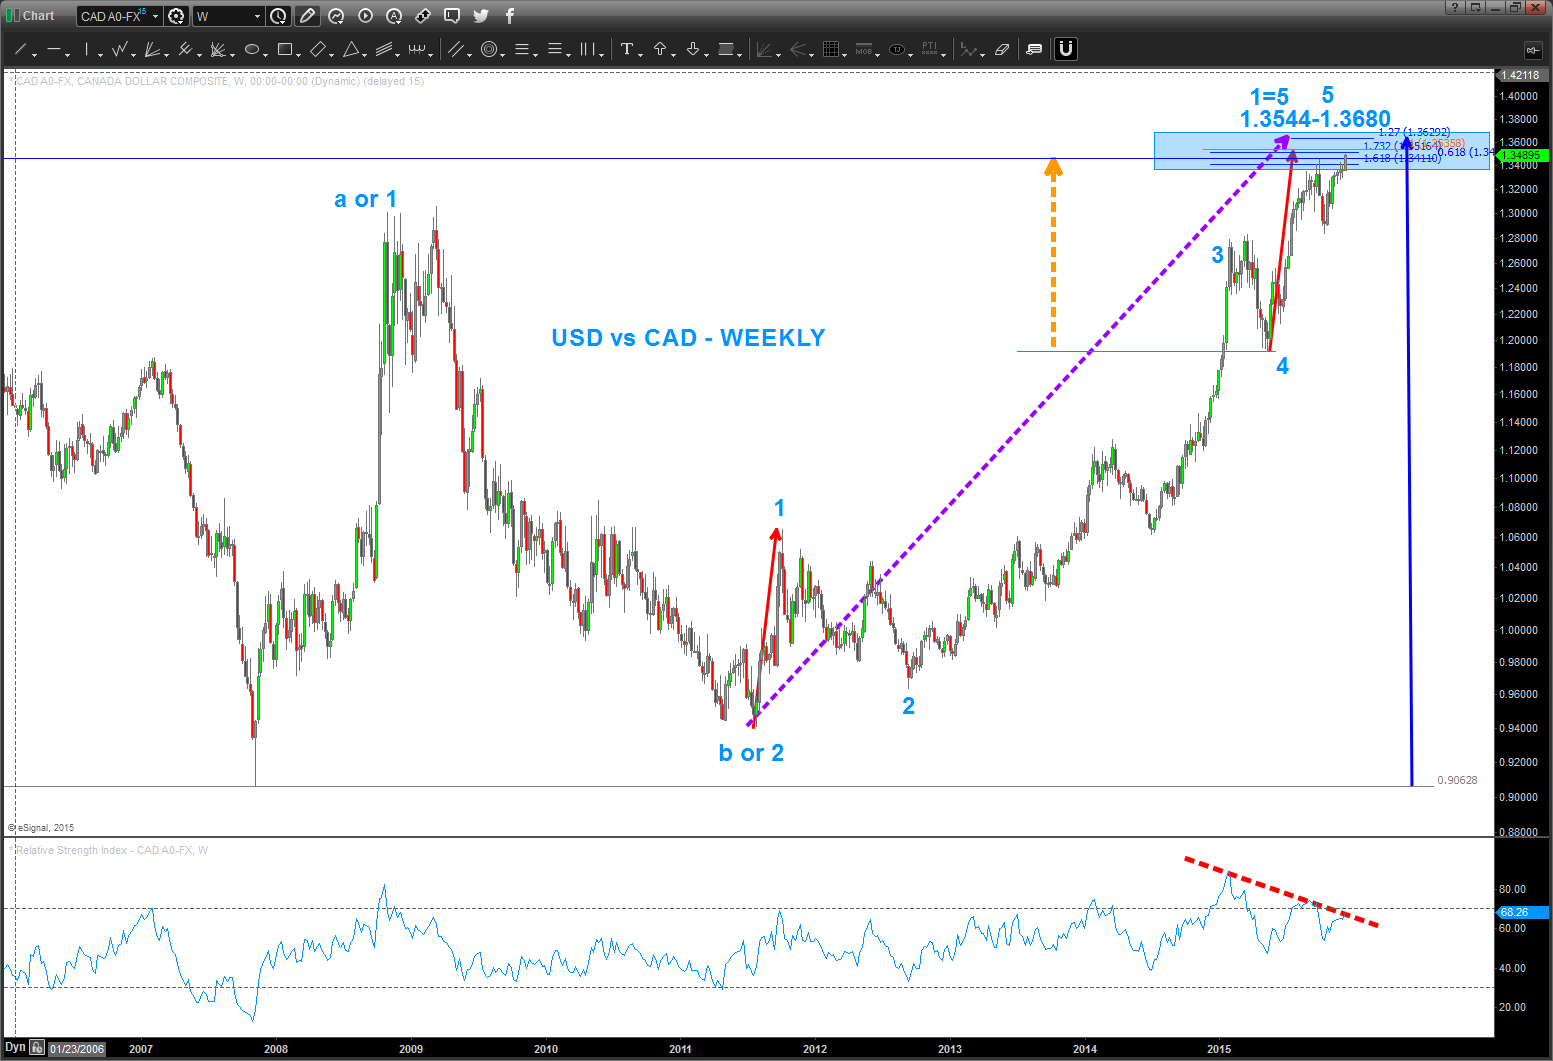
What do we have?
- a well defined macro 5 wave count
- 1= 5 (red arrows)
- 3 to 4 =- 1.618-1.7632 extension into target zone
- WEEKLY bearish divergence
Here’s the daily:
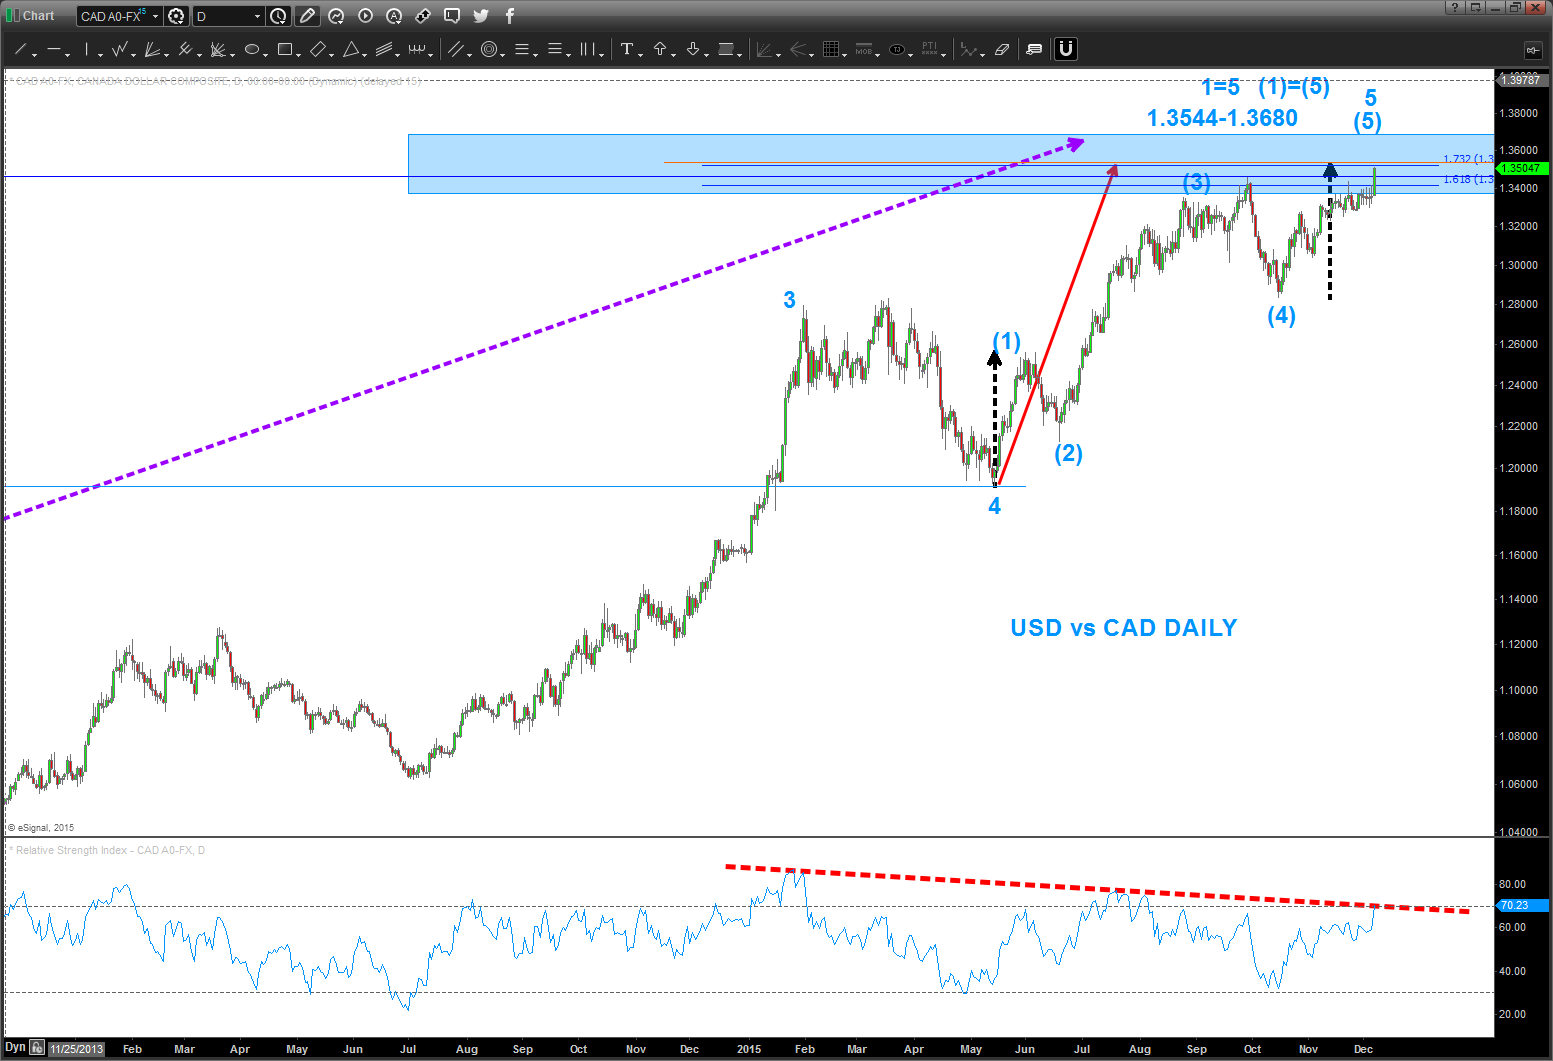
What do we have?
- 5 wave daily count up into target zone
- (1) = (5) (dashed black lines)
- bearish divergence
so, all this means is IF this level fails to the upside you can expect the Crude Oil Complex to fail big and the Loonie to get smoked.
we’ve got some nice thrust into the target zone so let’s see what happens.
HOWEVER, if this level holds we might have a pretty big set up going LONG LOONIE in the coming days.
B
