Yikes … look at this set up.
It’s ONLY probability ….but look at this set up coming in the USD vs LOONIE (Canadian Dollar)
It’s a pretty wide window, but we have a TON of “stuff” coming into play …
This will have big ramifications for the Oil Complex.
What do we have?
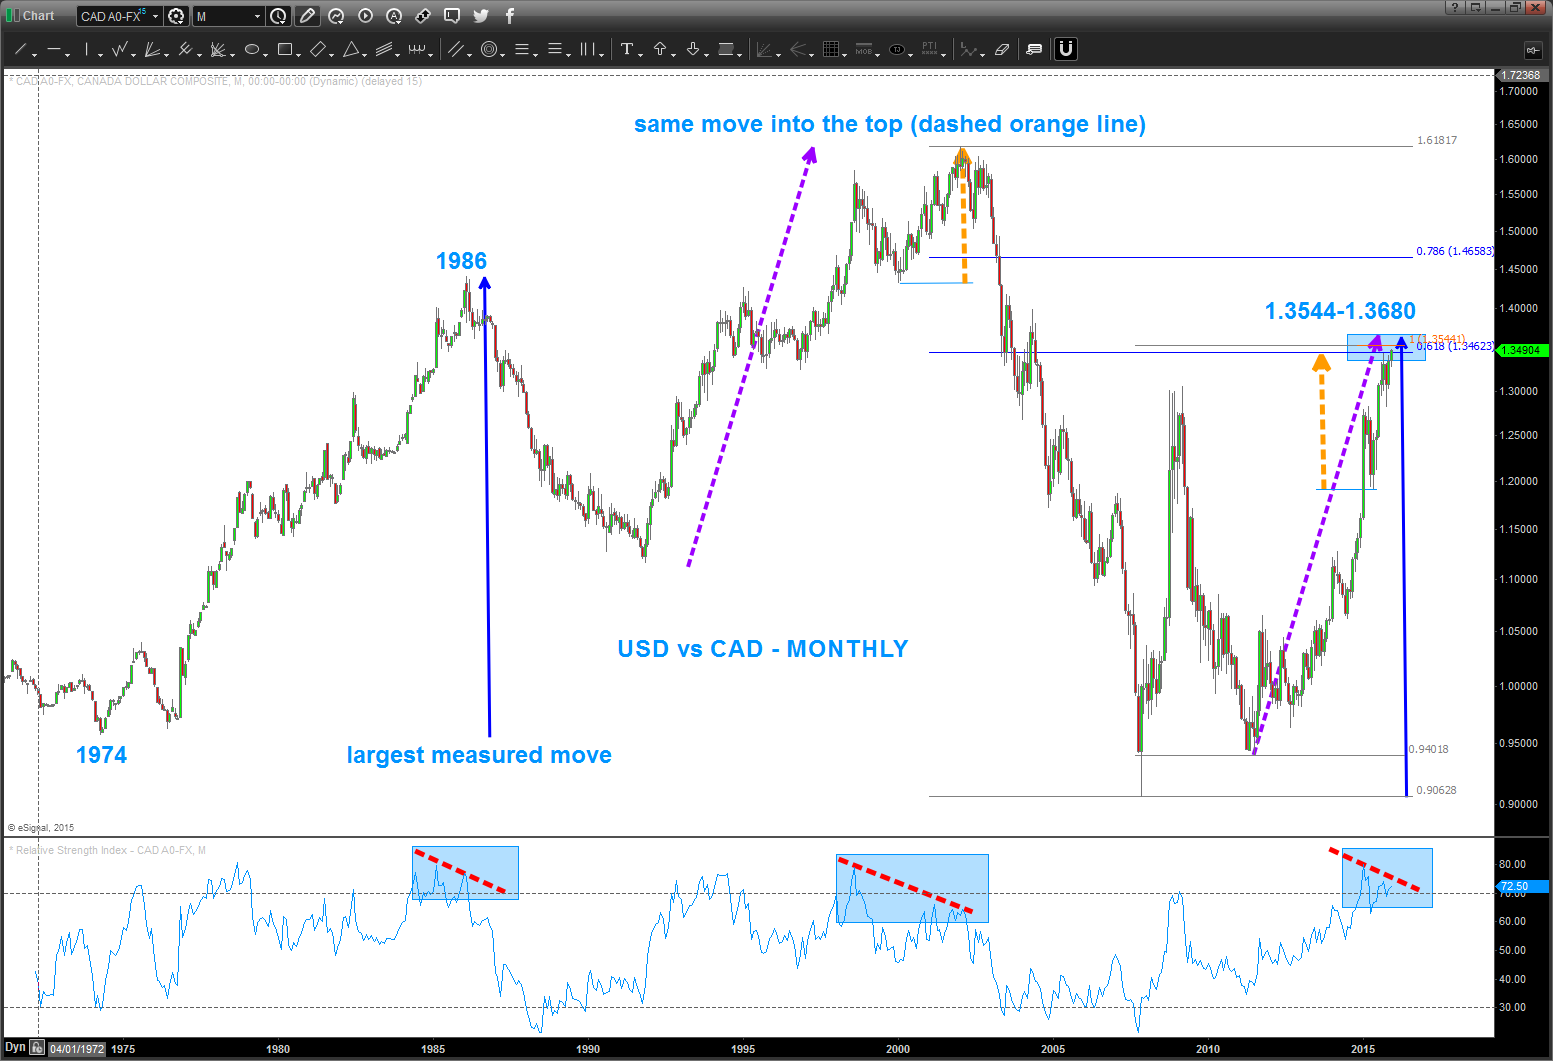
- Measured Moves
- blue vertical line is the LARGEST move UP in the history of this currency since 1971
- dashed purple line is a measured move prior to the high at 1.618 (yes that was the high)
- dashed orange line is the “last” measured move up before the high
- .618 retracement from the all time high
- AB=CD from the all time low
- MONTHLY bearish divergence
Here’s the weekly:
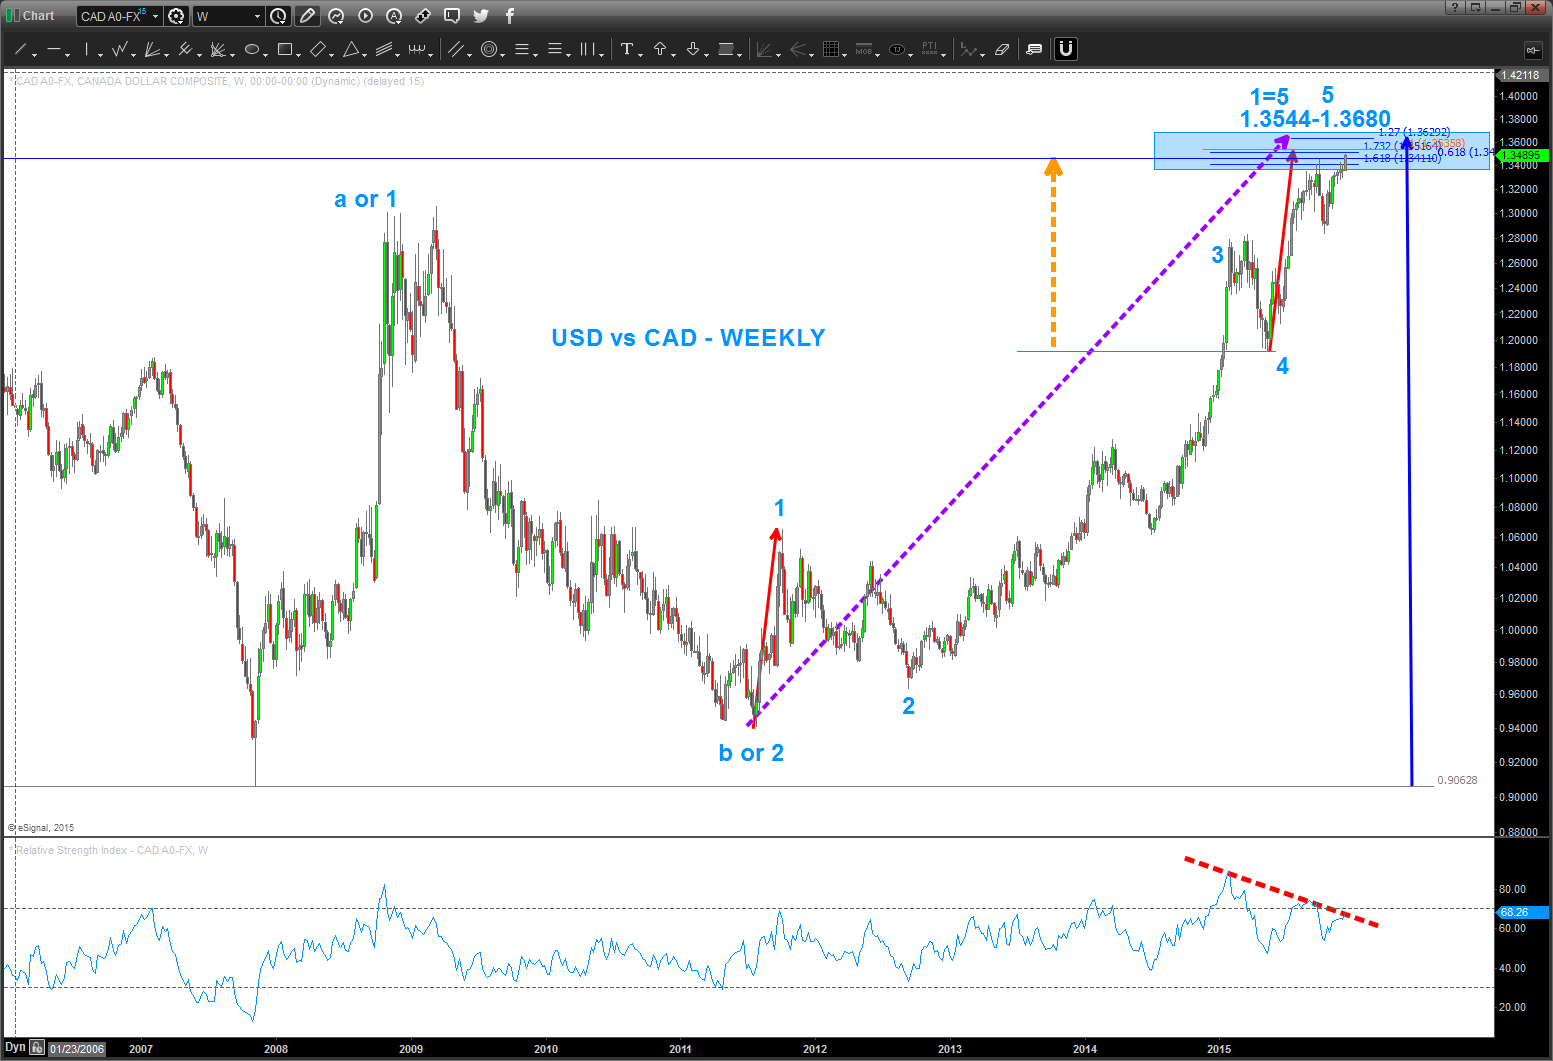
What do we have?
- a well defined macro 5 wave count
- 1= 5 (red arrows)
- 3 to 4 =- 1.618-1.7632 extension into target zone
- WEEKLY bearish divergence
Here’s the daily:
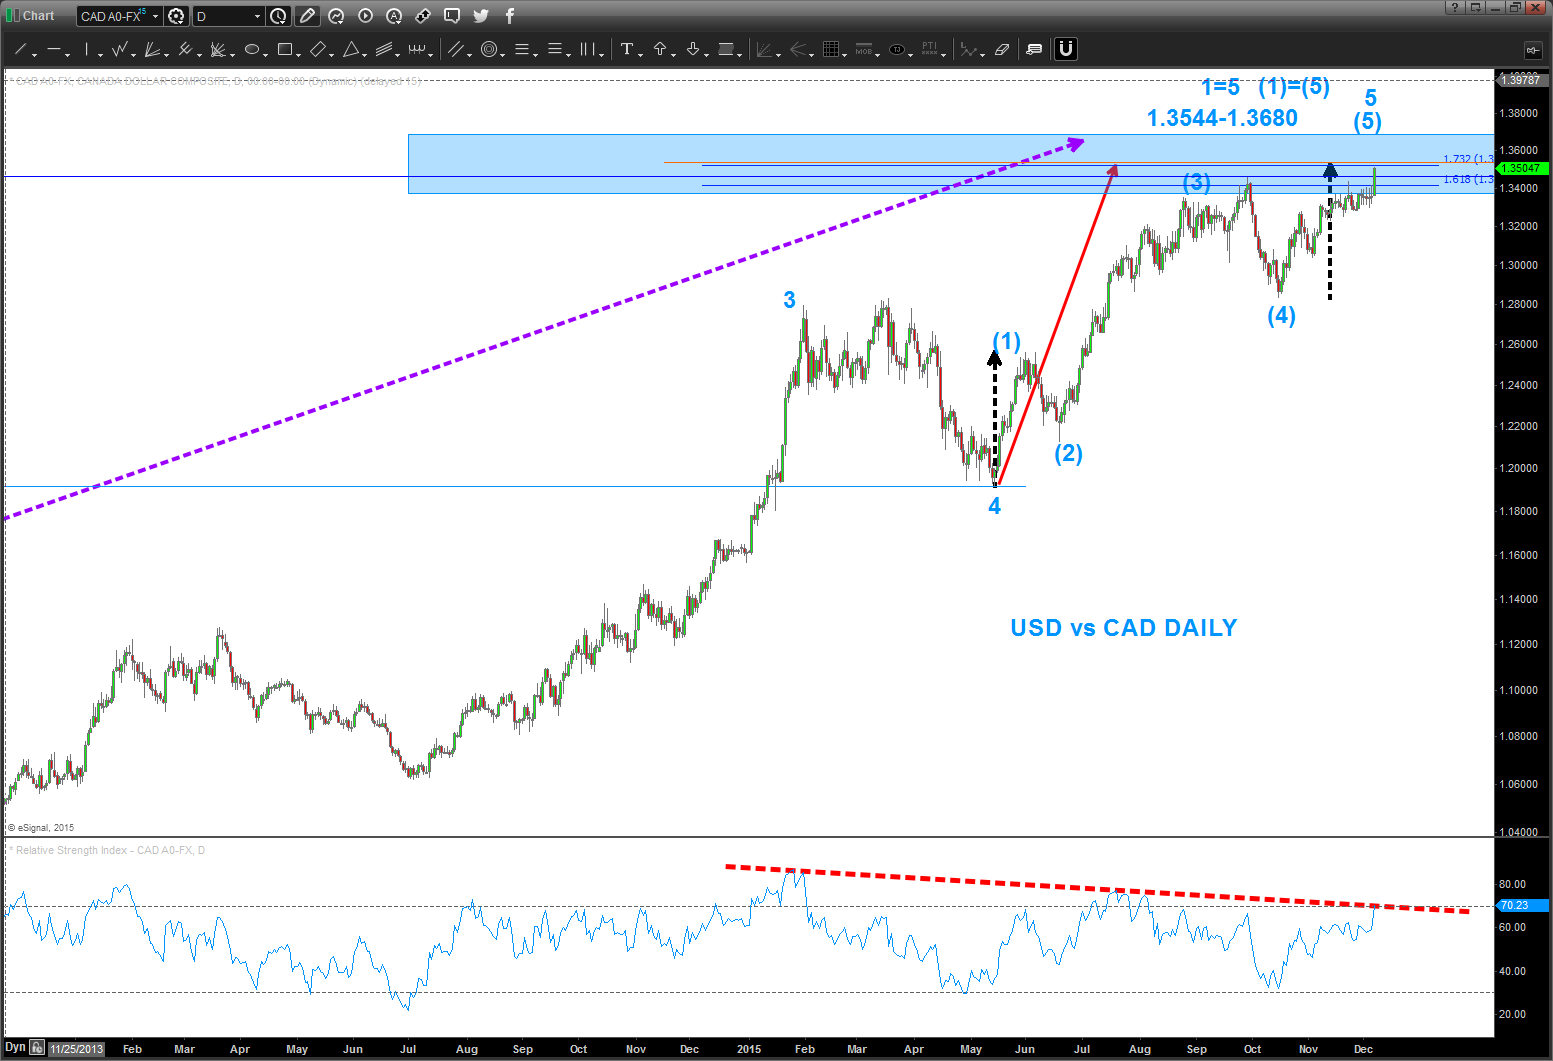
What do we have?
- 5 wave daily count up into target zone
- (1) = (5) (dashed black lines)
- bearish divergence
so, all this means is IF this level fails to the upside you can expect the Crude Oil Complex to fail big and the Loonie to get smoked.
we’ve got some nice thrust into the target zone so let’s see what happens.
HOWEVER, if this level holds we might have a pretty big set up going LONG LOONIE in the coming days.
B
