USD vs CHF (Swissy)
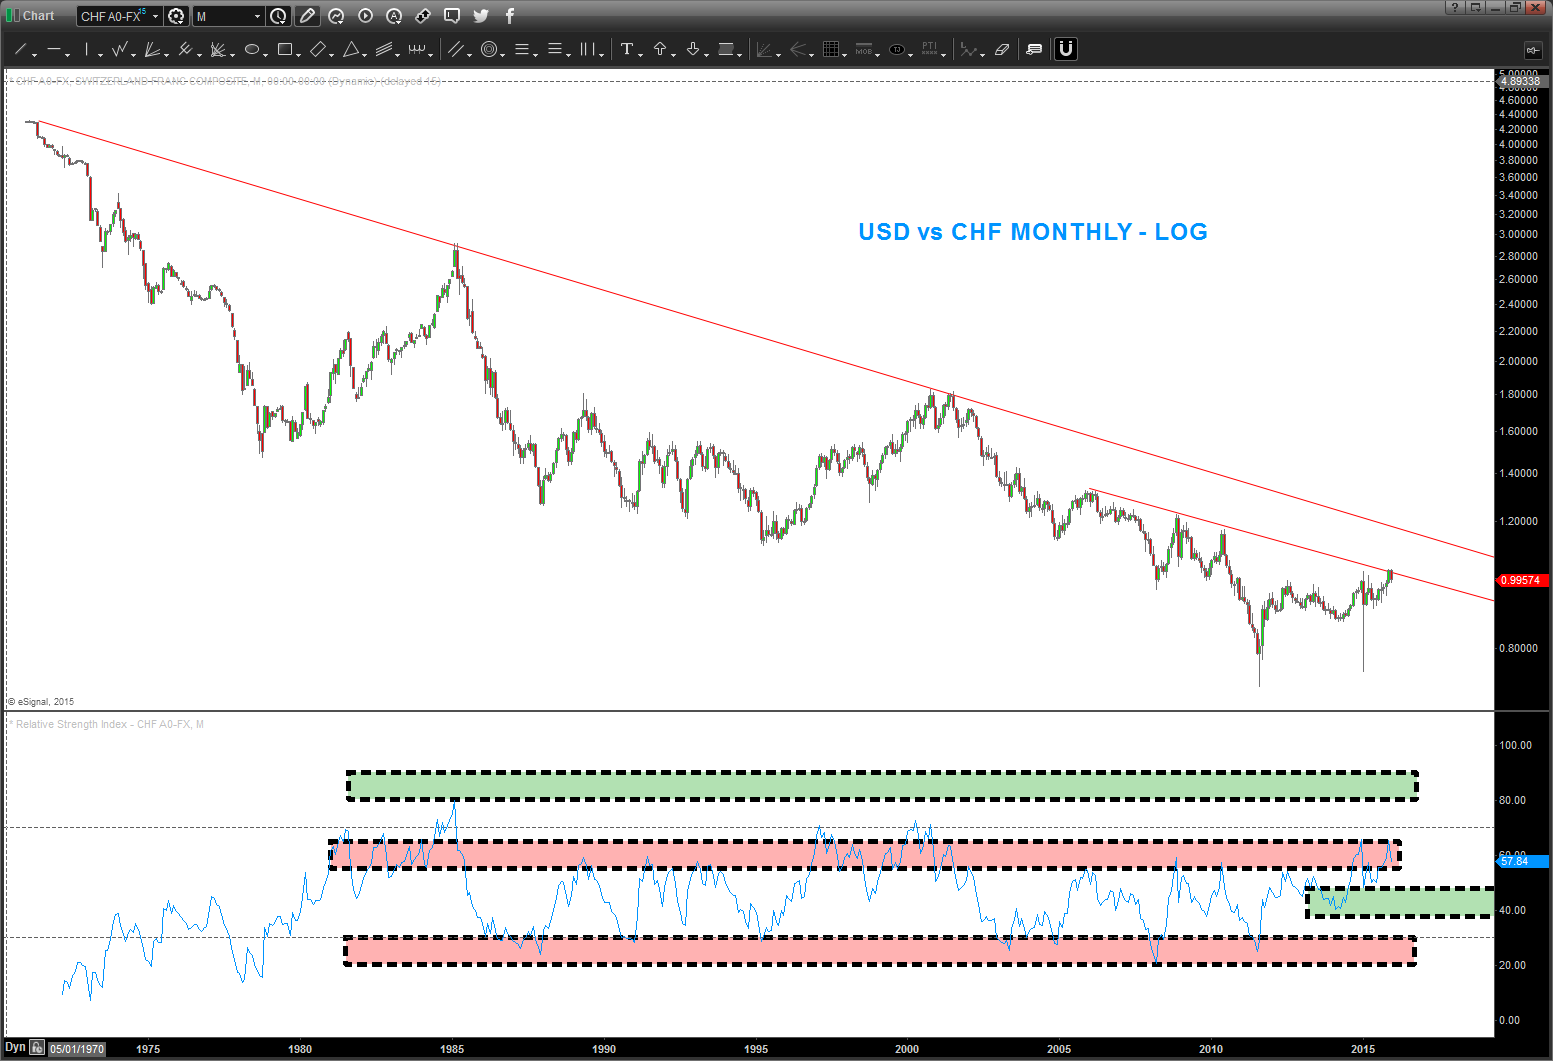
Long Term Monthly Log:
- note, it has not “officially” broken out (USD) versus the Swissy from the 1971 high
- note, the chart below is a LOG chart
- we also have resistance from 2005
- RSI – in a bear market, the RSI will oscillate around 20-30 and 55-65. Those levels are shown in red below.
- Besides a brief pop above the zone, in 1985, this market has contained and respected the “bear market” zones.
- however, pay attention to the support that was found in/around 2014-2015? that MONSTER MOVE down respected the BULL MARKET support zone. (Green)
- SO, IN CONCLUSION, we are at a pivotal time for USD vs CHF.
- we’ve tested, twice, the upper bear market resistance zones.
- if it breaks thru, then, more than likely, it will seek the green resistance above.
USD vs CHF – weekly
- pretty big candle going down, but as a USD bull, I’m going to look at taking a crack around the .382.
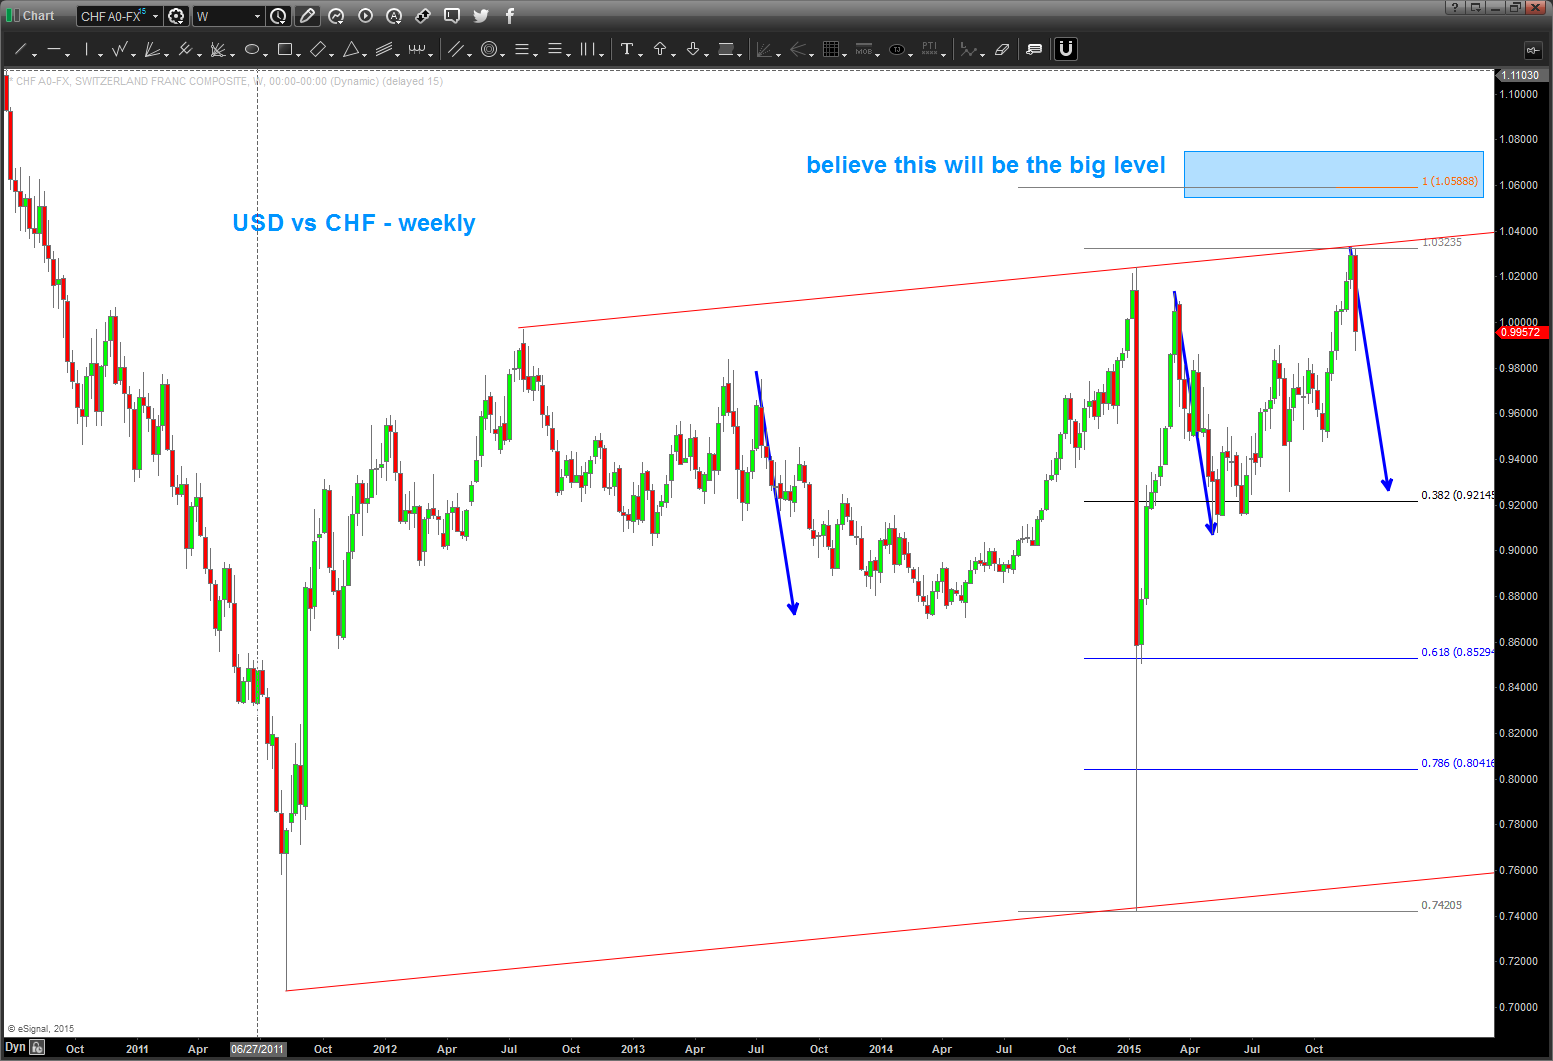
folks, this one is going to be interesting …
Bart
