just a little higher till pattern completes .. and we surpassed 2009 lows for the RSI
was talking to a money manager at my son’s basketball practice tonight and he was talking all kind of nonsense about some fundamental stuff … I just pulled out my Iphone and showed him @bartscharts and said “here, read this.”
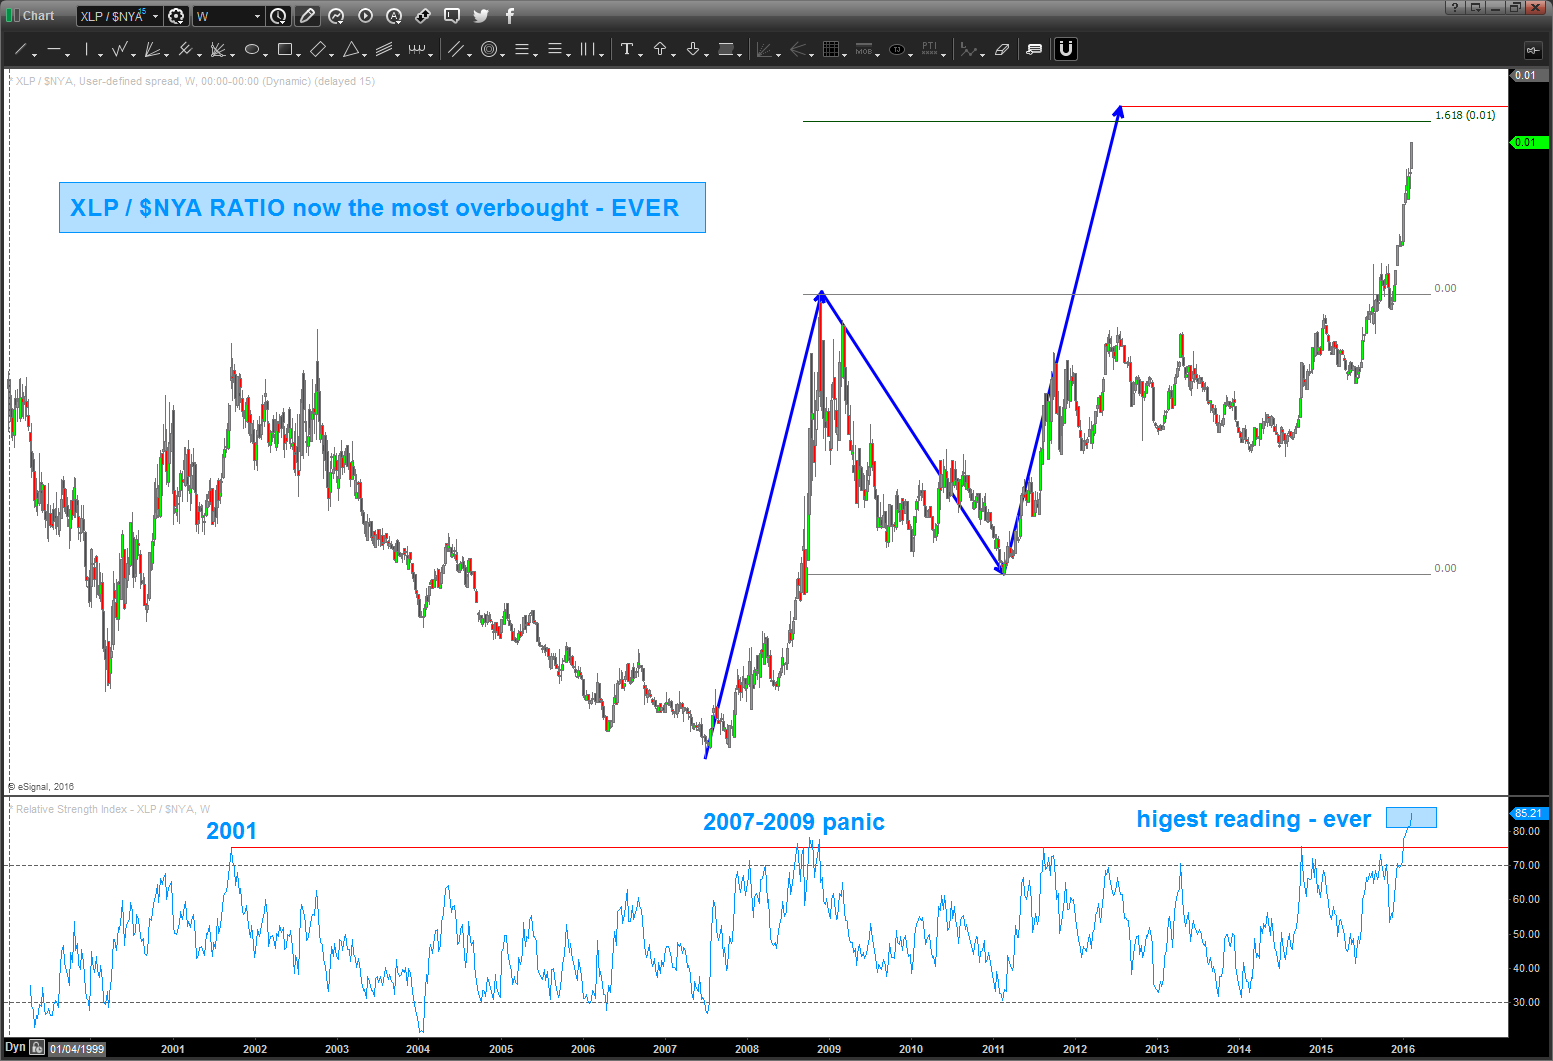
thus far, this ratio has been SPOT ON w/ providing market inflection points … its shows “risk on” and “risk off” flow of funds and in times of risk off the big guys go to shitter paper, toothpaste, canned goods and blah blah blah ….so, on this weekly chart, you’ll see a SELL PATTERN on the ratio which IF IT HOLDS is good for equities. personally, not doing a darn thing till that pattern is hit …
the probability that the ratio sells off (along w/ equities going higher) is increased due to the face that since the XLP came into existence, the RSI has never been this high …so, stay tuned but don’t go long equities till this pattern is hit …
B

HI Bart,
The ratio chart of the XLP $NYA certainly was good at showing when the market would rally from the lows. Which leads me to my next question, Is this a Bear market rally ? Some very good arguments that this could be the case i.e. Leadership of beaten down stocks like CAT, RIG , Ongoing strength of Consumer staples & Utilities, Prev leaders i.e. FANG stocks not showing strength & US based mutual funds showing net outflows 2.0 Billion during the rally.
Cheers
honestly – don’t know. just waiting for the first pattern SELL or BUY to work or not and then we’ll know where we are