Emerging Markets, EM Currencies, Patterns and an example
Posted on March 18, 2016 Leave a Comment
I’ve posted, more than once, how I really love when a market makes 3 waves to a new high or low and then fails in the opposite direction. It’s the classic “expanded flat” and – if you can get the C wave right – it’s a great trade to take to new highs or new lows.
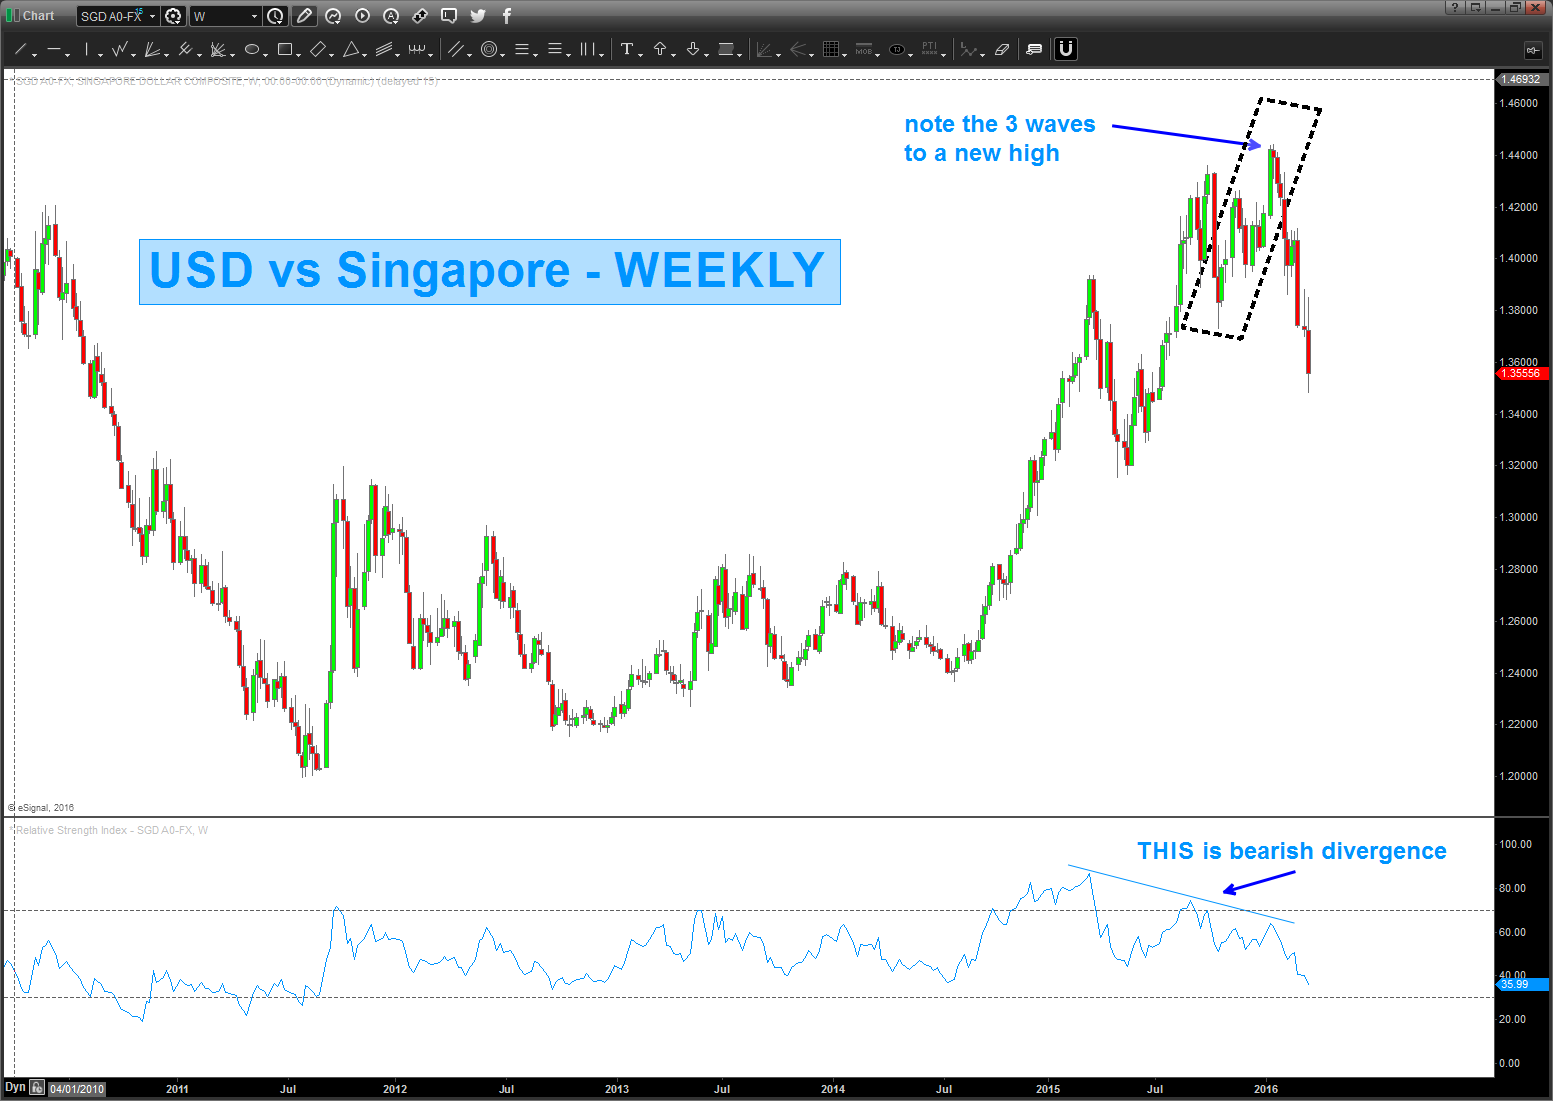
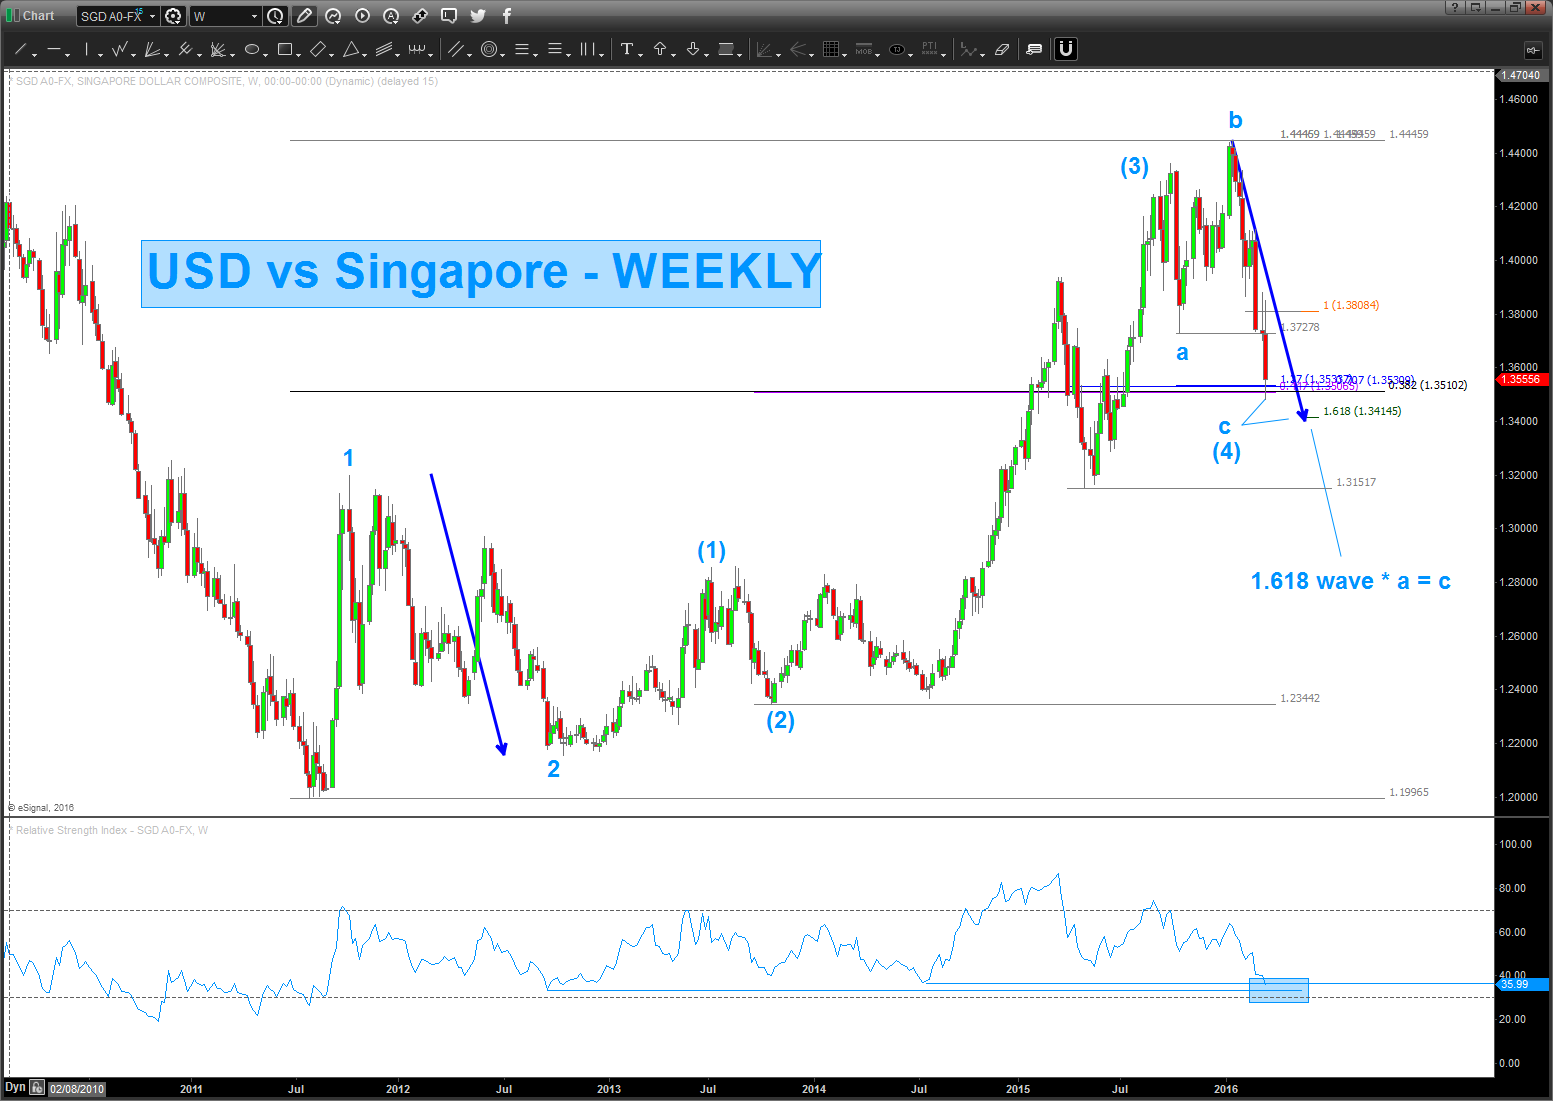
the chart below is of the USD vs Singapore:
- note the highlighted box – see how the market goes up into a new high in three waves? CLASSIC B wave ….
- note the monstrous bearish divergence
Here’s the potential count:
note:
- in the past, it didn’t have bullish divergence at the lows to get going so we are either finishing wave ‘c’ and/or we have one more wave to go down into the 1.618*a = c w/ the blue measured move arrow.
- either way, believe we are coming to the end.
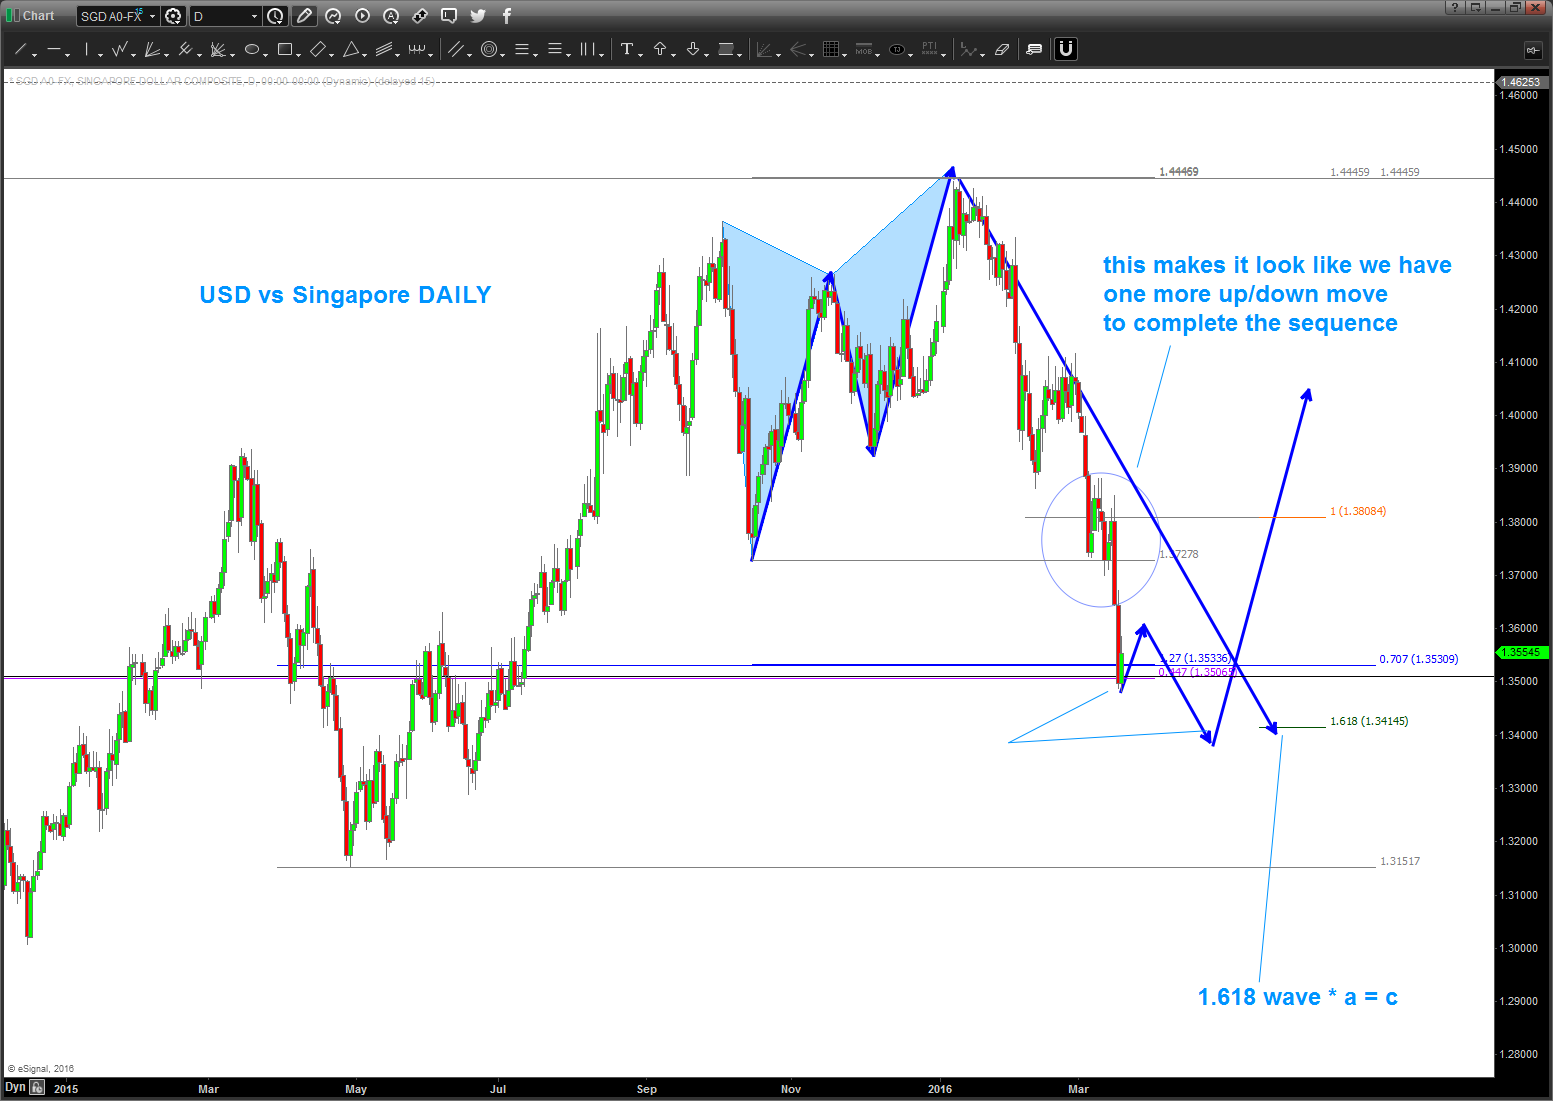
note:
- the subdivison of the circle part down doesn’t lead to a “clean” 5 waves down into these lows so I’ll watch for an UP/DOWN sequence to complete. this could be the low BUT my bias is the UP/DOWN into the low before entering a position.
what does this mean for the Emerging Markets Equity Exposure?
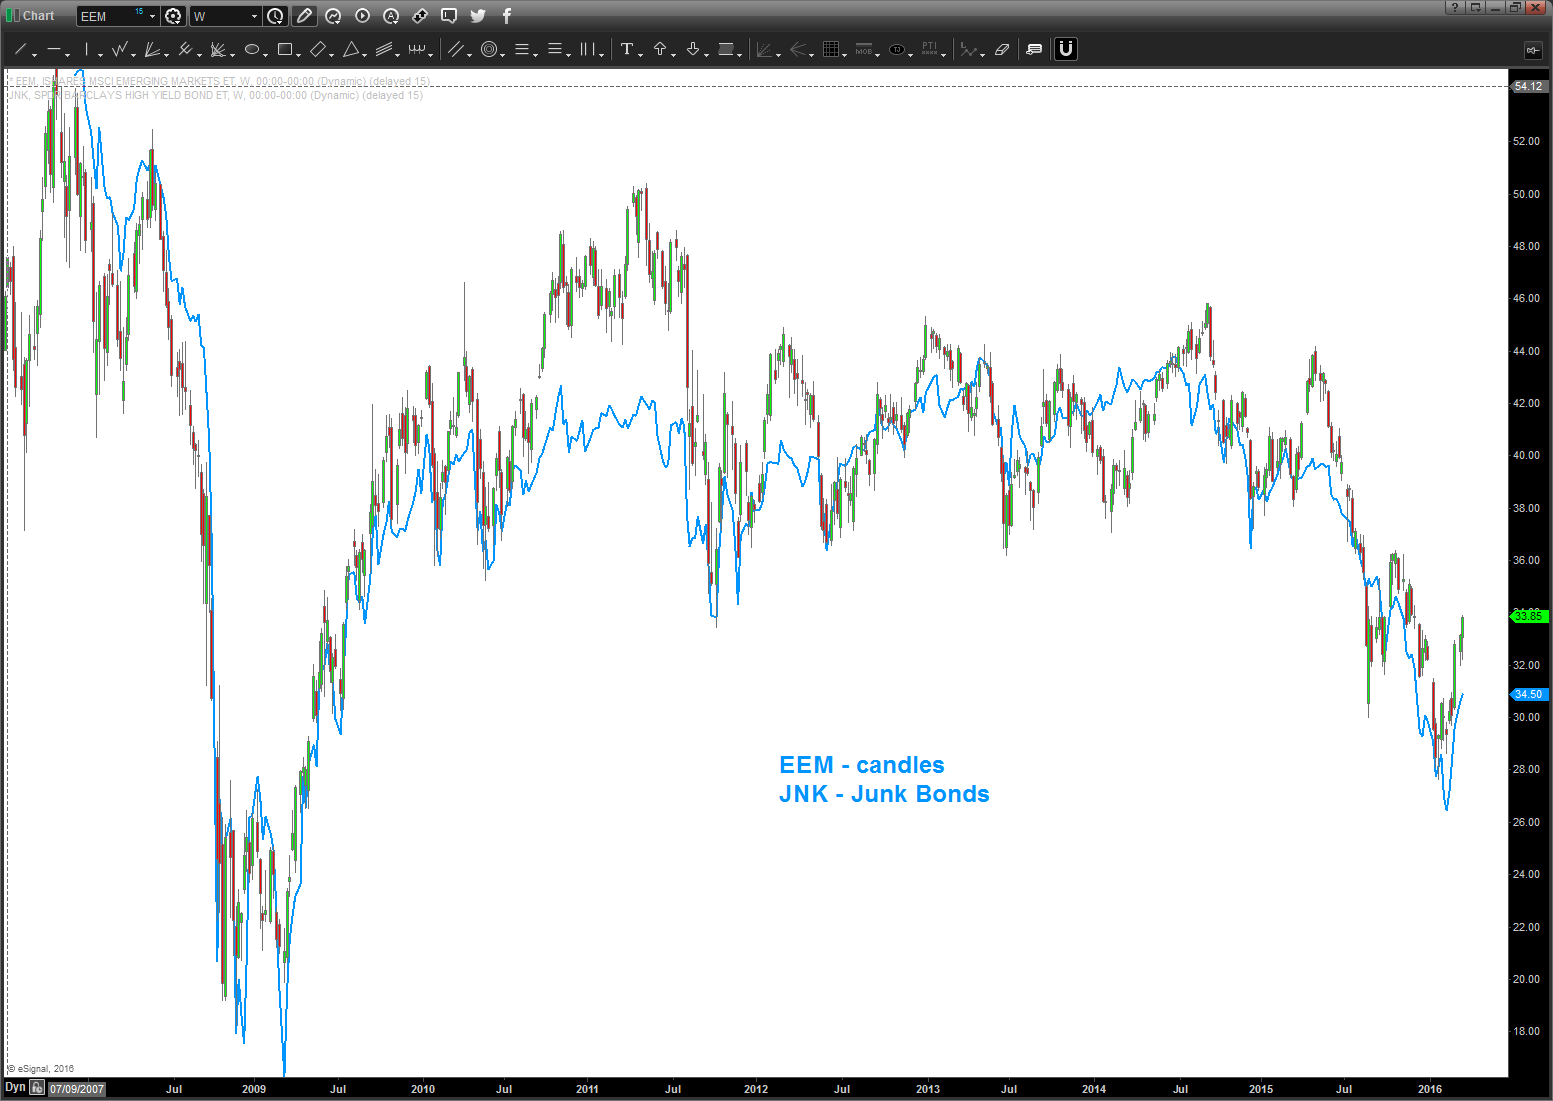
below is the Singapore Dollar (as an example) withe EEM overlaid INVERTED in the blue line.
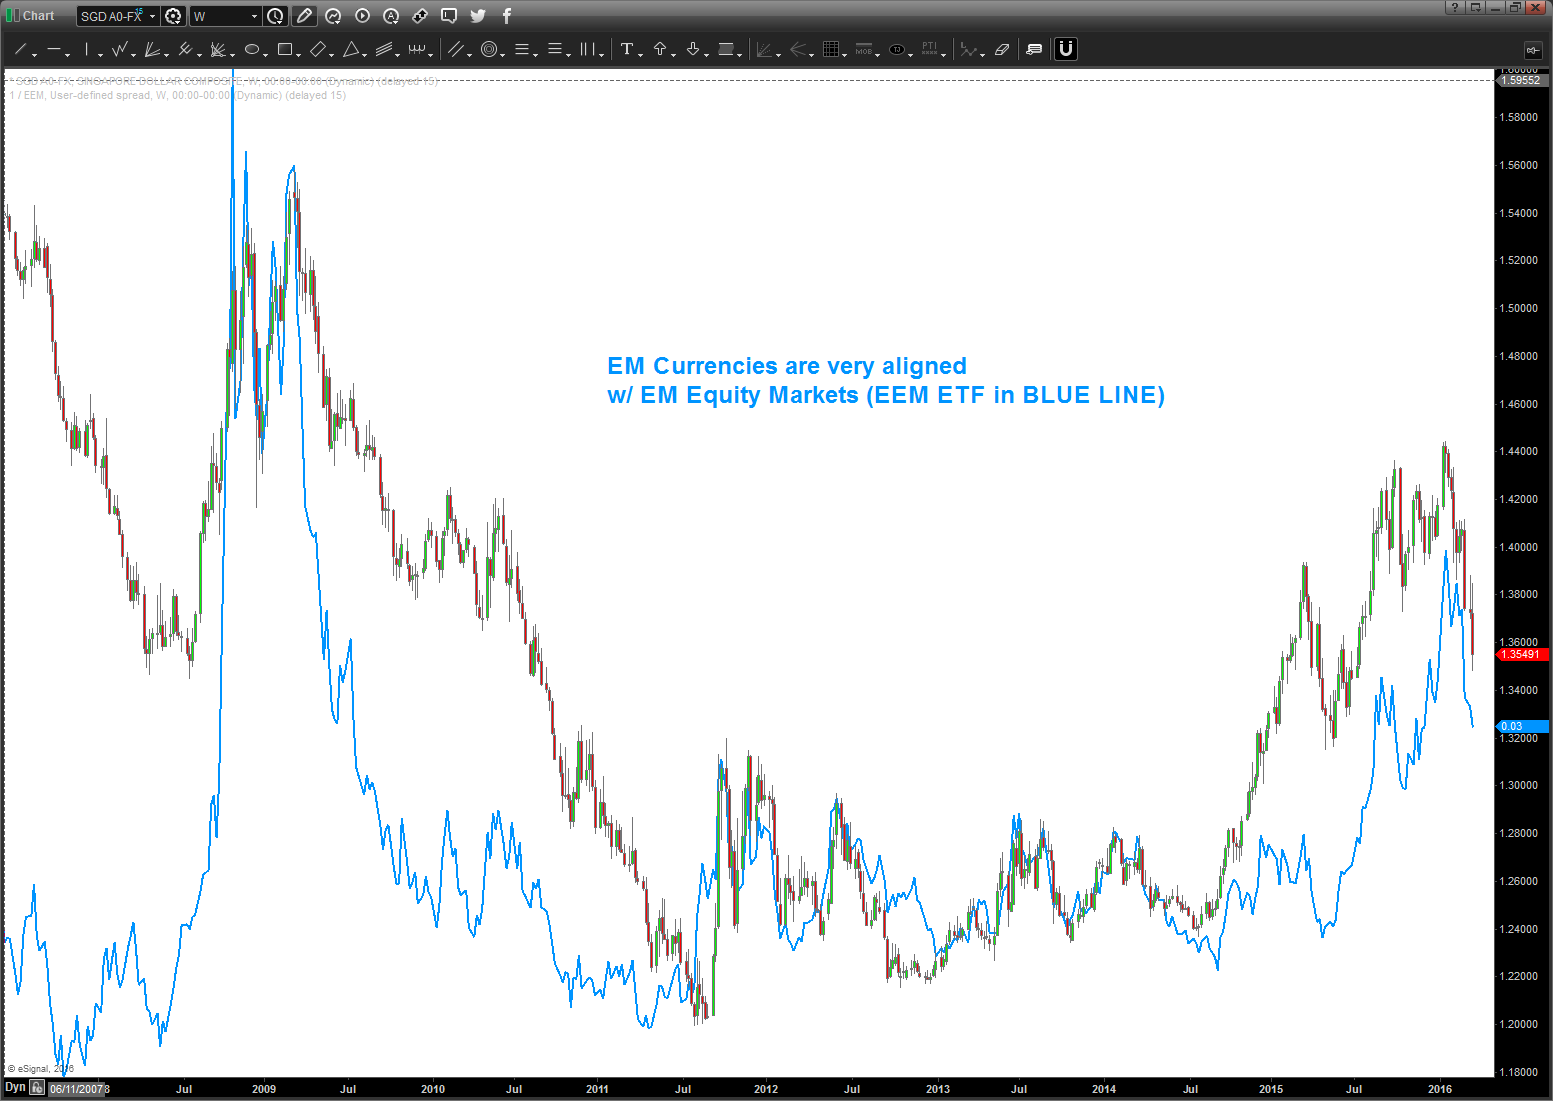
NOTE – very strong correlation to EM Currencies and EM Equities
Here’s the EEM:
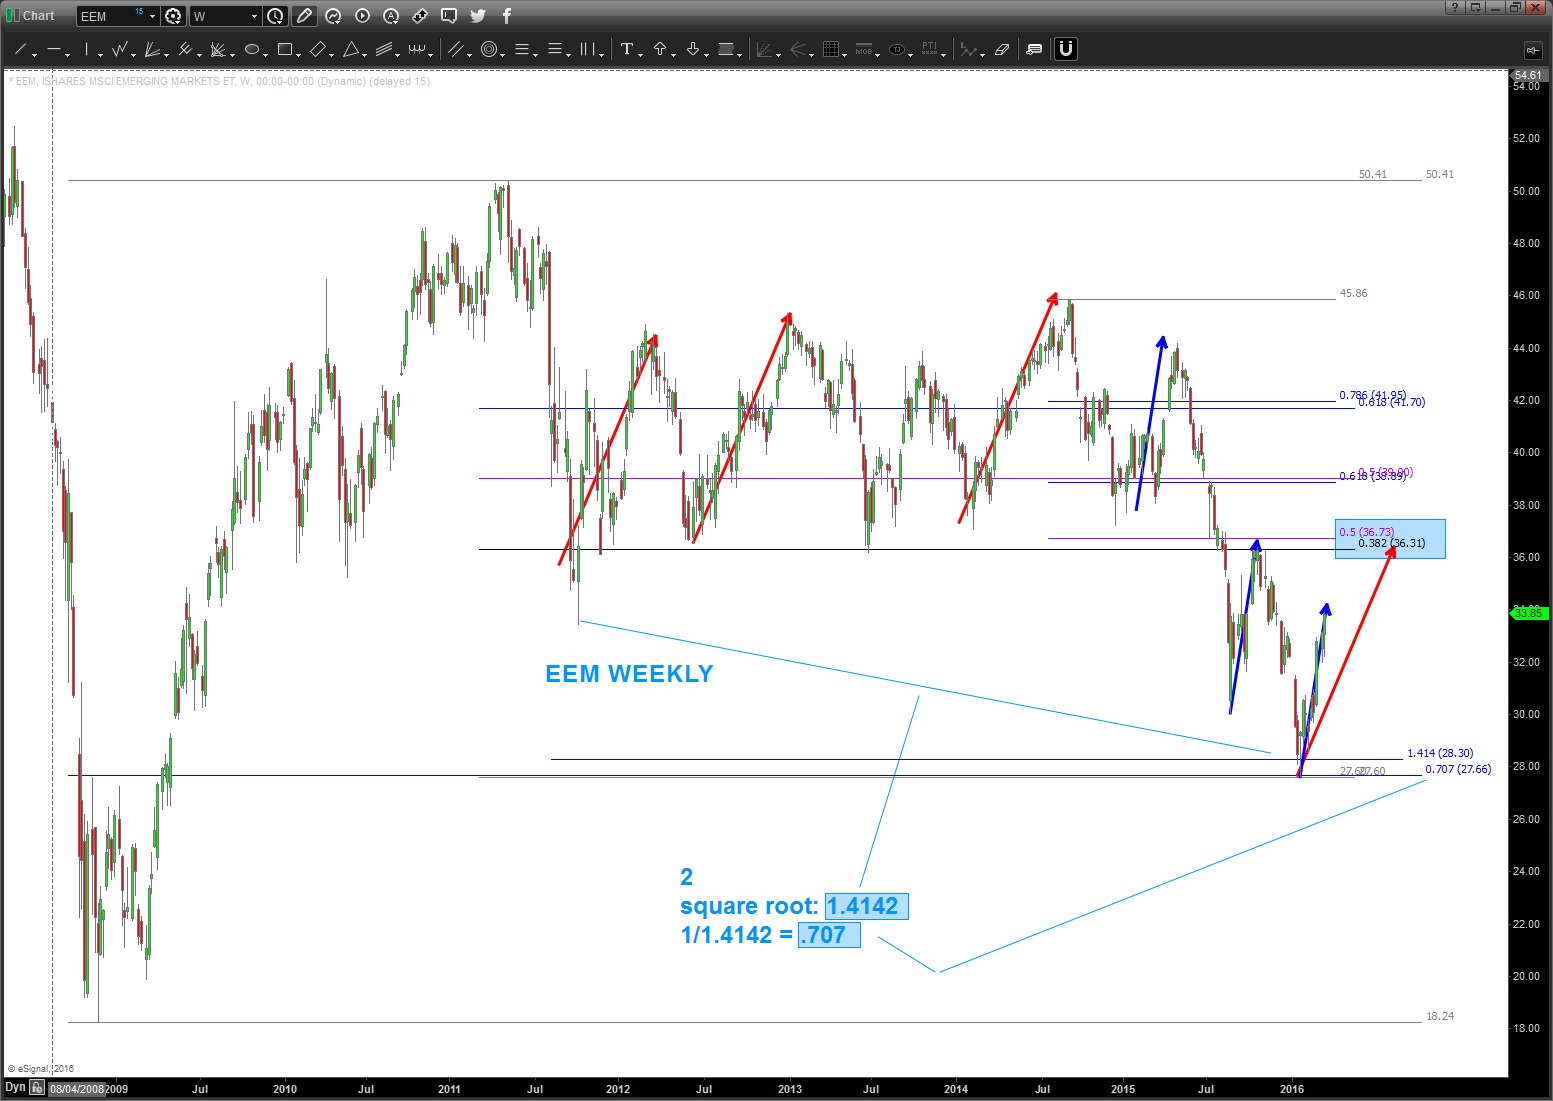
Note:
- .707 retrace and 1.4142 extension caught the lows ….see math on chart
- blue measured move arrows are complete – see how that corresponds to the low in Singapore Dollar?
- however, the red measured move seems to be the next logical target IF the up/down scenario plays out
- also, note how the measured move takes us back up to the year long support cliff
- however, the red measured move seems to be the next logical target IF the up/down scenario plays out
SO, now for the “if-then”
IF the US Dollar is finding the low against the Singapore Dollar THEN the EEM bounce is coming to an end.
Bart
PS — had to do it … JNK and EEM sure look alike. I wonder why ….. 🙂
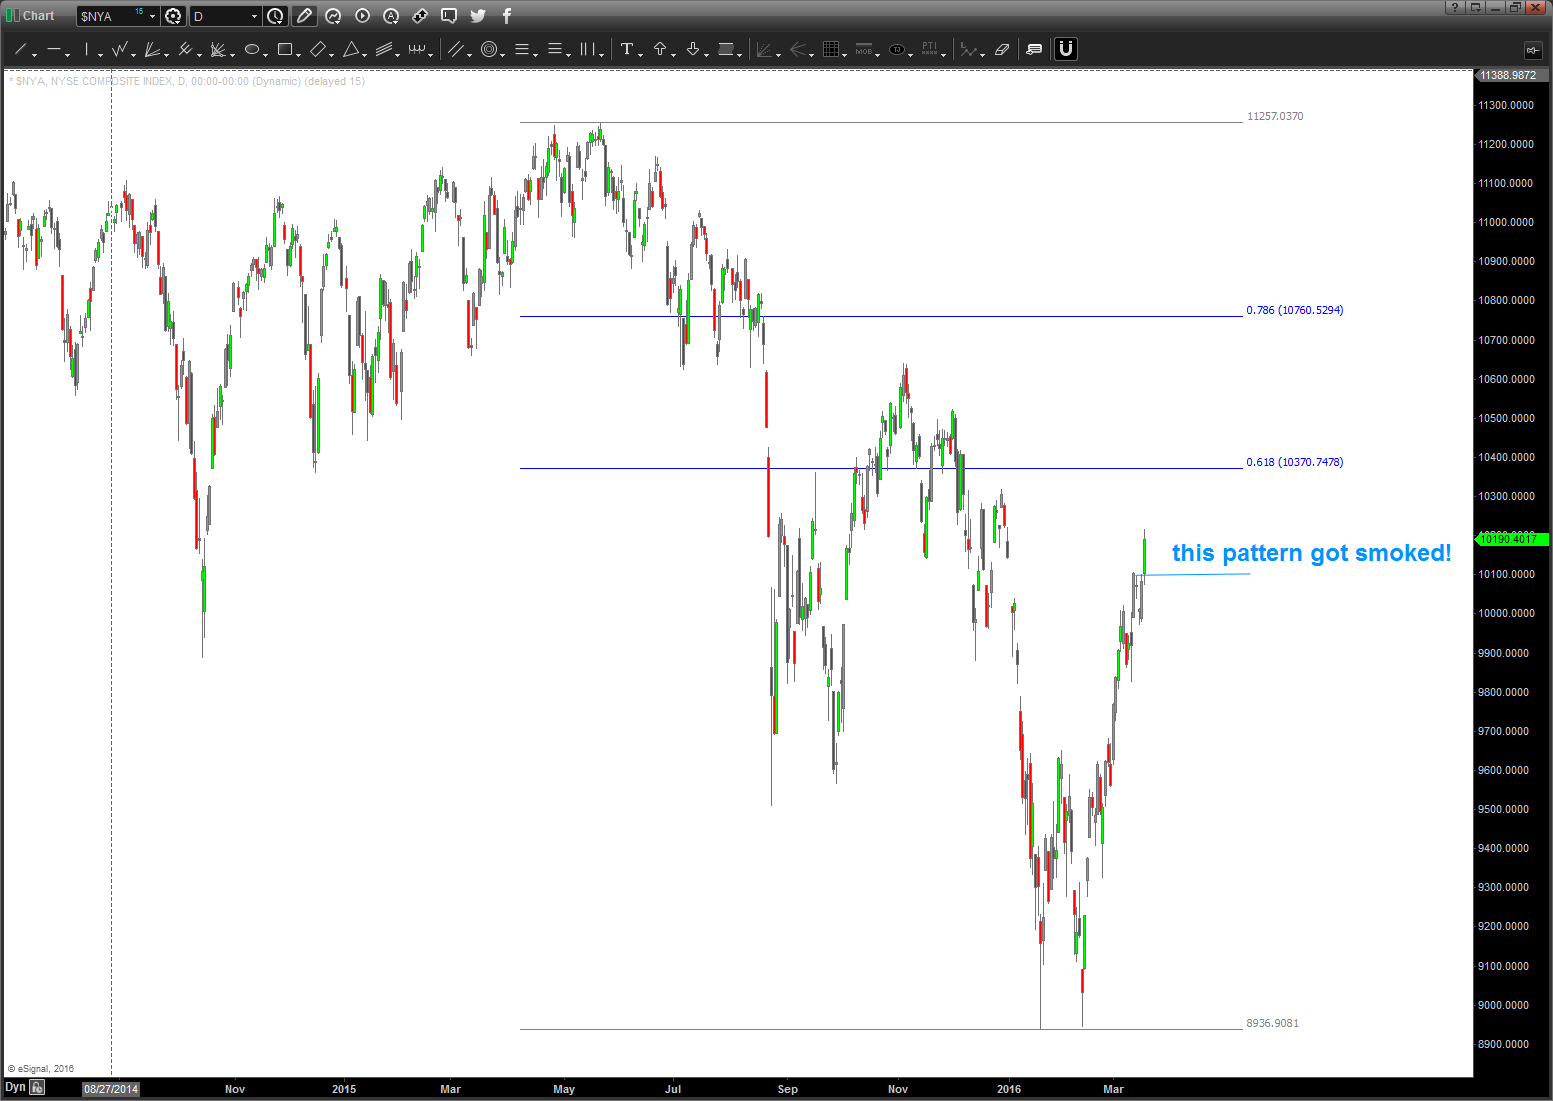
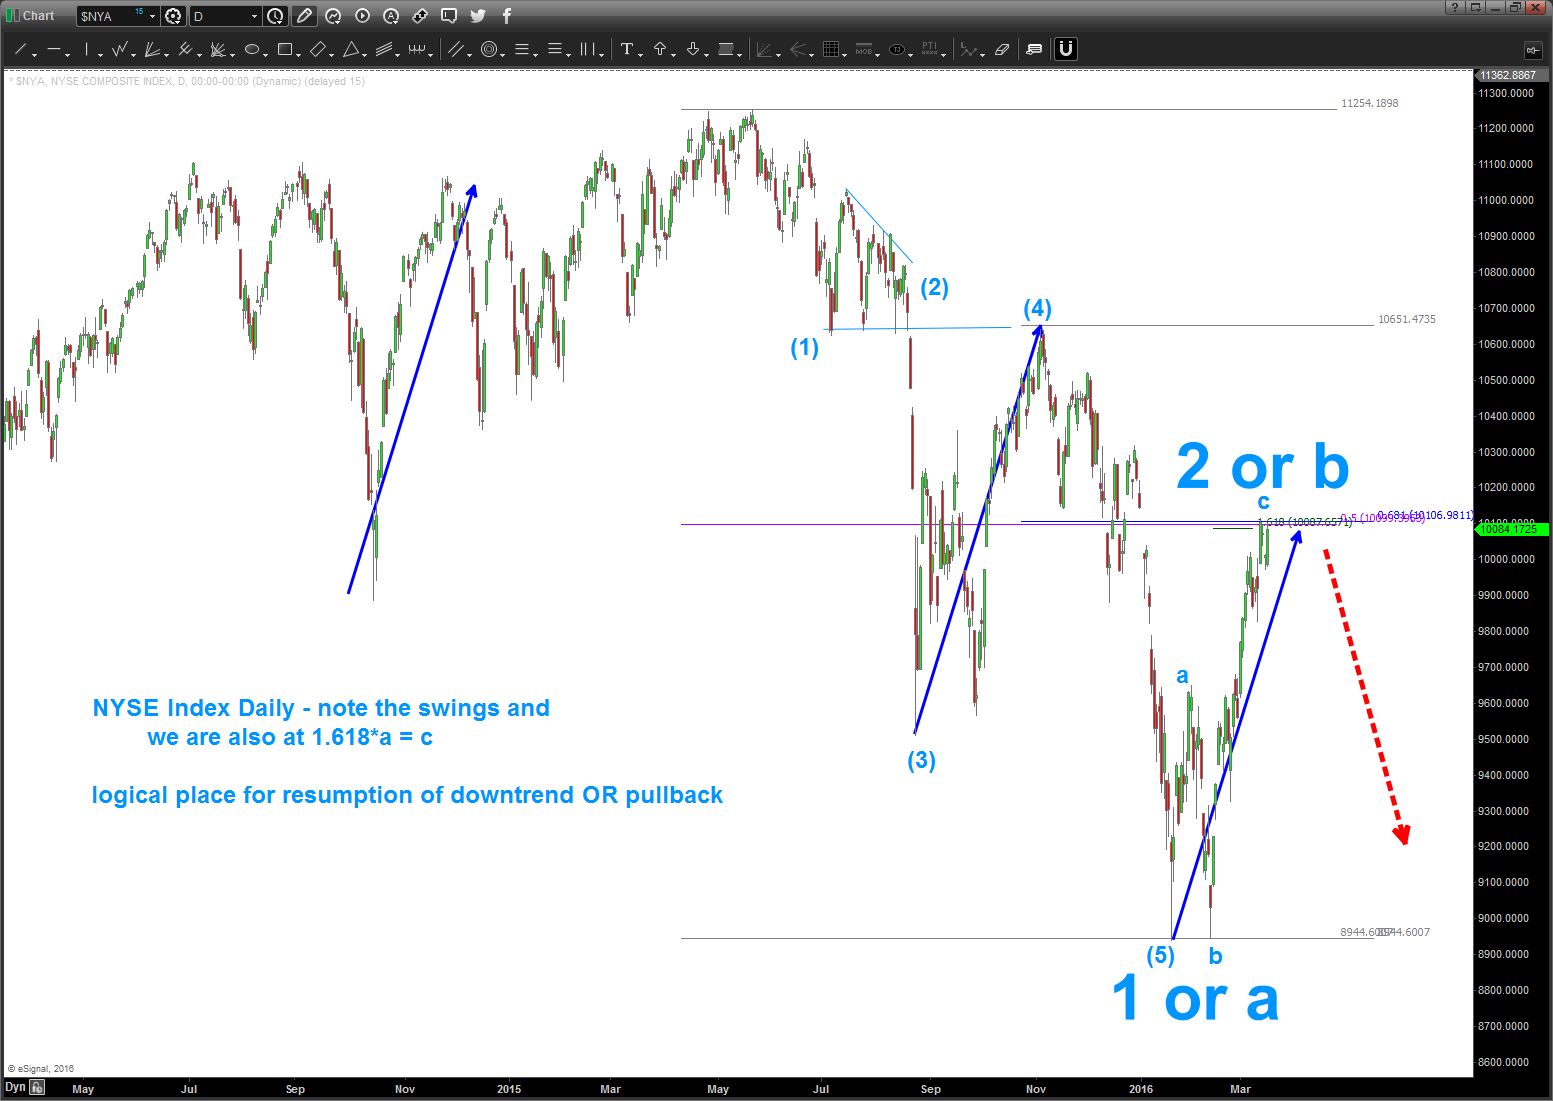
NYSE Index – resumption of downtrend or pullback in/around here?
Posted on March 17, 2016 2 Comments
well this pattern got SMOKED today … ctrl-alt-del on this one and look for the most logical stopping point.
not sure right now …
Addicting Adrenaline Fueled Adult Cowboys and Indians….the FED Rate Decision (rules of pattern recognition #3)
Posted on March 16, 2016 Leave a Comment
Note, Darth Vader and the Dark Side connotation with the mouse image below ….

My biggest LOSSES were back in the day trying to trade the FED Decision in the spot currency markets. There I said it.
What I came to realize, for me – maybe not for you – is its addicting, adrenaline filled adult version of Cowboys an Indians. I can’t even begin to estimate the number of people frantically clicking their mouses for BIDS and ASKS and seeing the easy money then evaporate into the losses but then turn into winnesr and then losers and then, ultimately, closing the position at the market and saying – “great I made money” or “I am so thankful I am out of the market.” Come on, admit it, if your a trader you’ve more than likely jumped into the cage with the gorilla’s juggling dynamite. (OBTW, the dynamite is lit – which means, it will BLOW UP)

Go ahead, click that mouse at 2 EST and you might as well be throwing money up into the center of a tornado with an insane idea that you know where the money will land. (hint: you don’t)
How big is the Spot FX currency market?
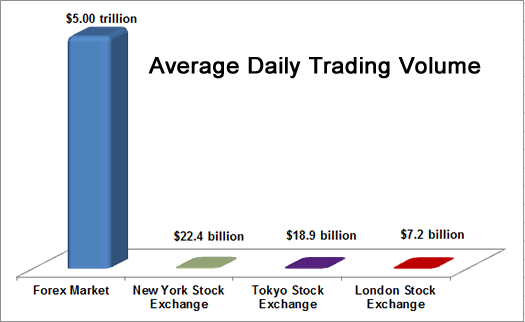
(note, at any given time the “retail” market is able to trade roughly 1.5-1.8 trillion)
so, what do you do? well you plan … you play “if-then” and look to enter the market long after the chaotic swings. Trust me, this takes discipline, letting 200+ pips move go in whatever way they are going to go and – sit on your hands.
#3 – as a discretionary trader and somewhat impulsive personality – I have a rule of life: DO NOT TRADE W/IN ONE HOUR of any major fundamental news announcement. NO MATTER HOW BIG THE MOVE.
I’m not trying to preach here – I’m reiterating my gameplan for today at/around 2 EST. Bottom line is there is no gameplan – I’m NOT going to trade a FED RATE announcement. I will watch the chaos like a sniper and prepare my next move … why?
Well, as you can see over the past couple posts the USD is at/approaching a crucial juncture. I honestly don’t know which way it will go but we have MAJOR patterns on the EURO, POUND, YEN, AUSSIE, KIWI that need to work themselves out. The EURO has been in a trading range for a YEAR. It’s also showing some similarities to the bottom that was formed in November 2000.
So, the charts below are going to be my gameplan for post-FOMC tonight around the Asian open.
CHEERS – Bart
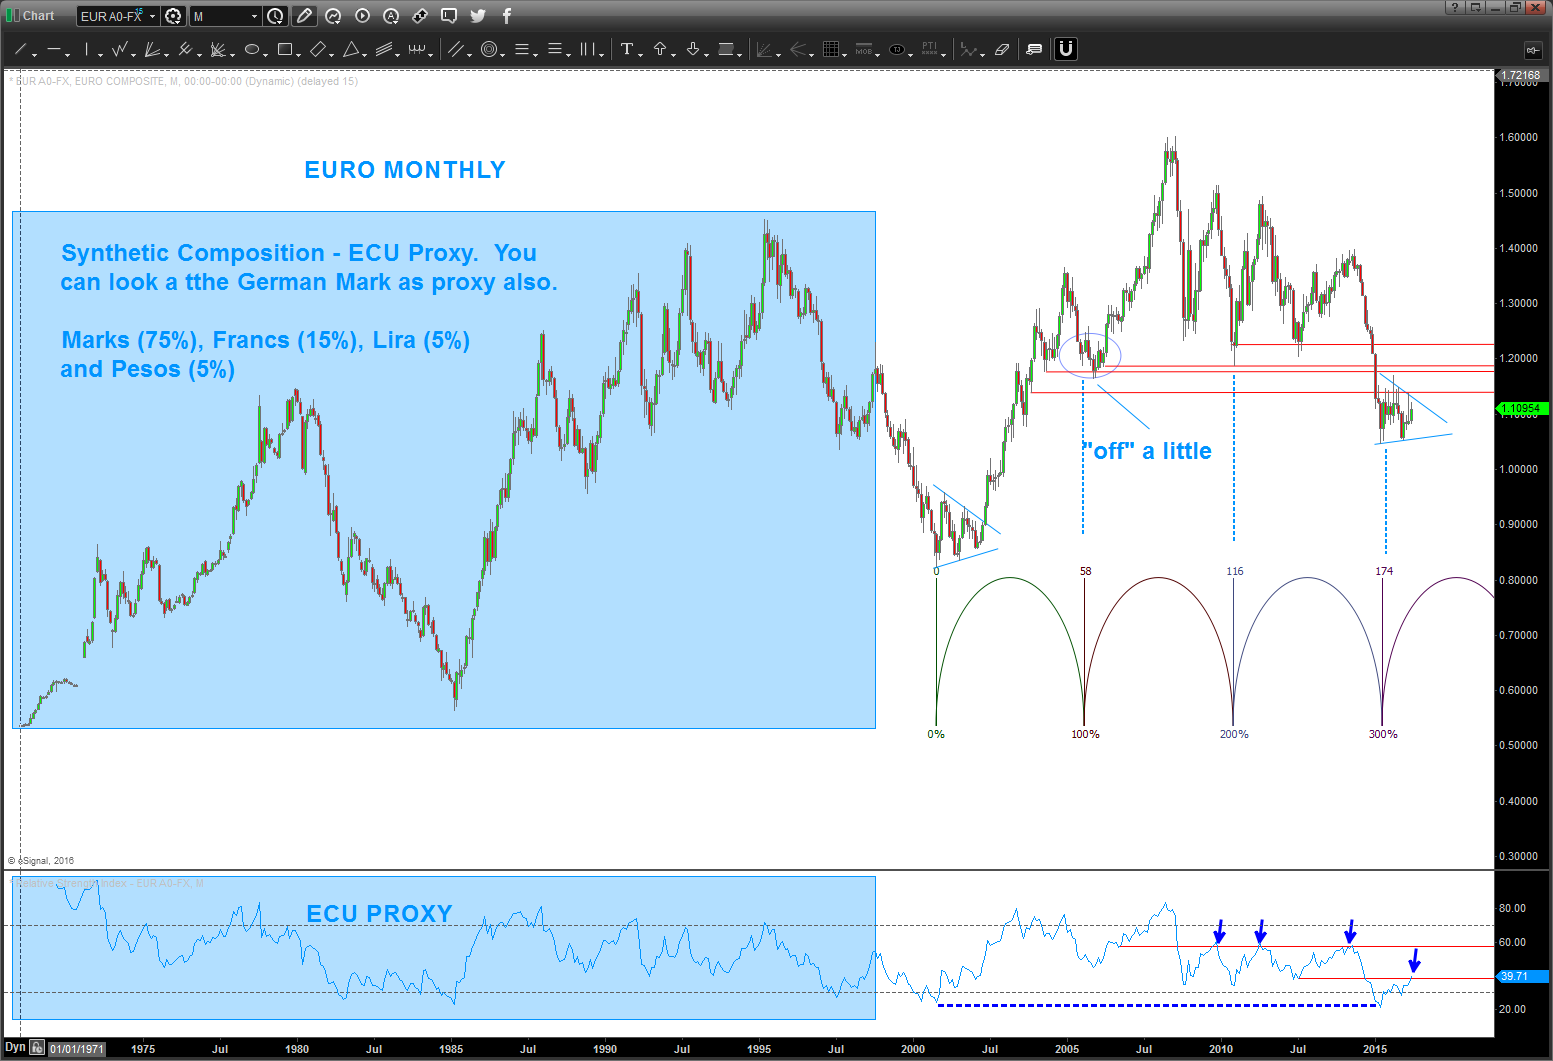
EURO MONTHLY:
- deeply oversold – the most ever since 2000
- consolidation occurring like 2000. should resolve soon
- RSI butting up against resistance (polarity)
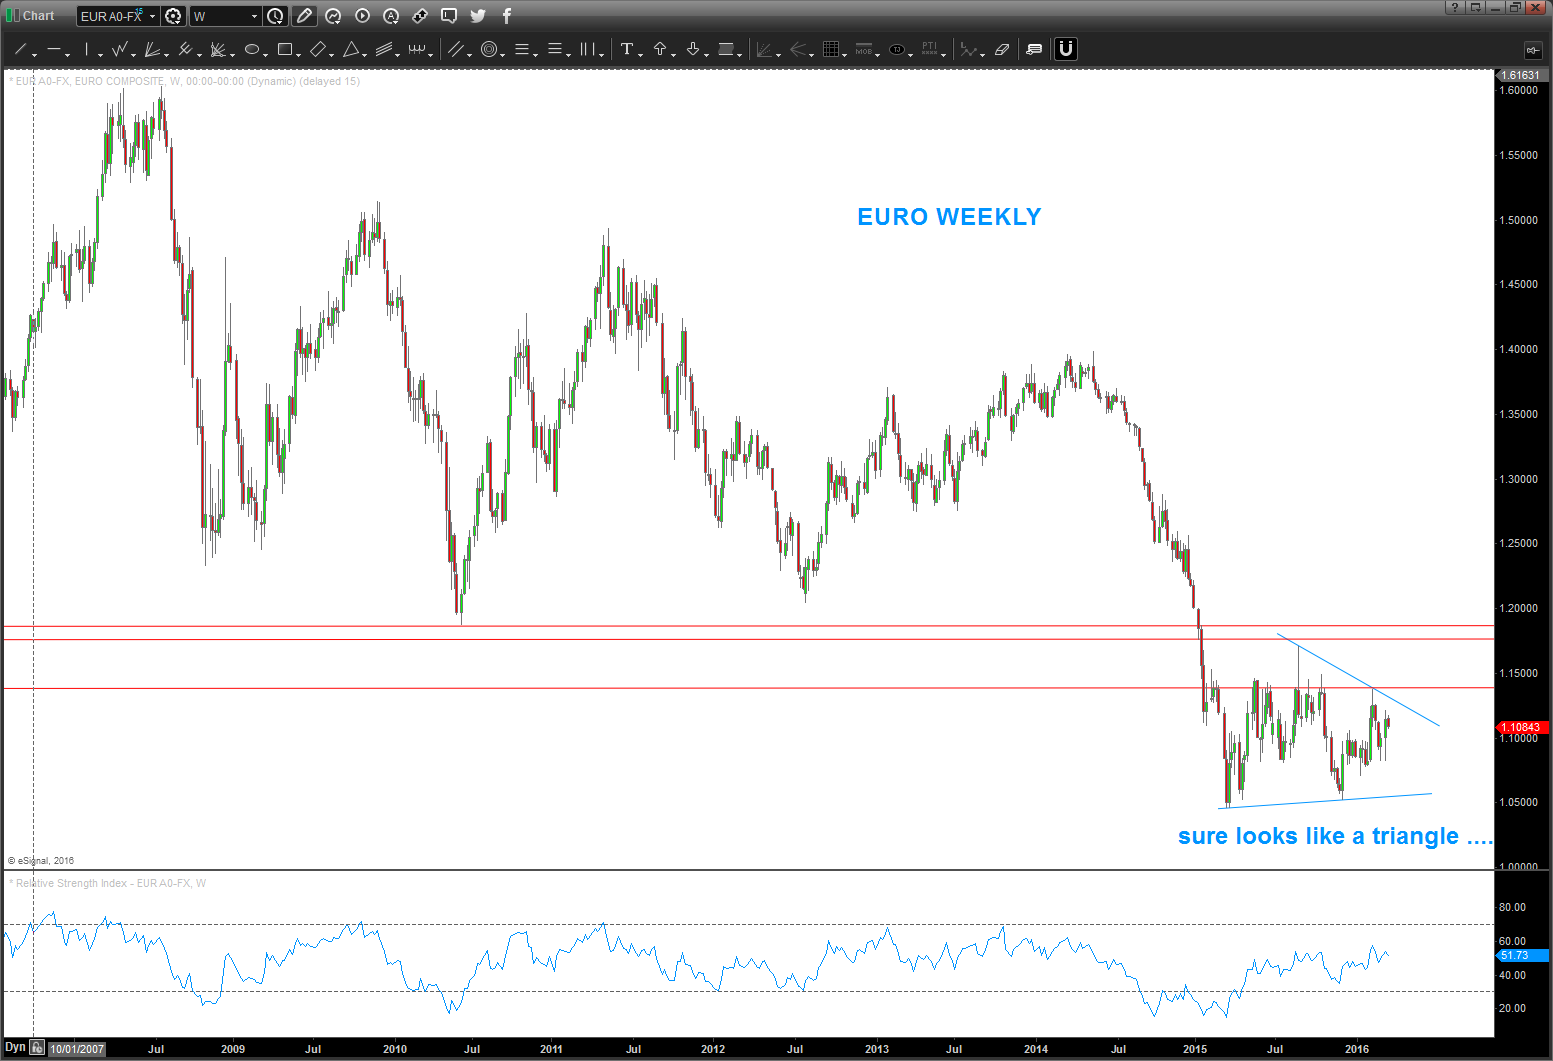
EURO WEEKLY:
- note the RSI has “recovered” but isn’t in the oversold region of the past rallies – it has “recovered” with no real move UP – it’s consolidating.
- note the contracting triangle
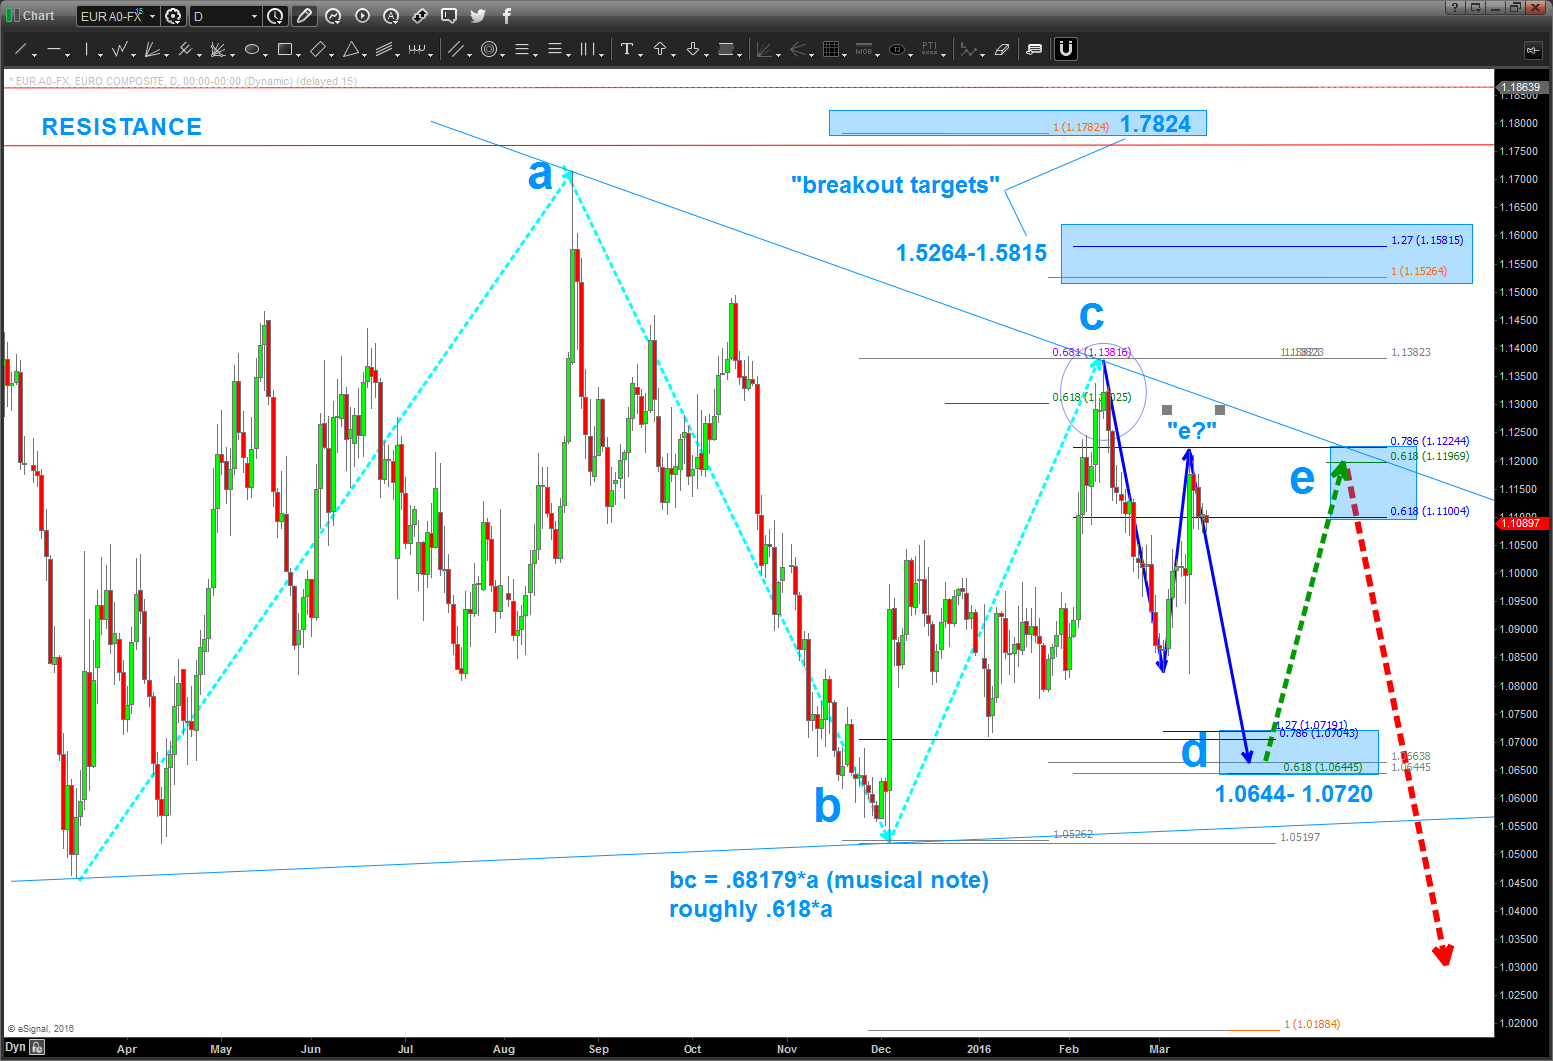
EURO DAILY: here’s my gameplan for the EURO in a nutshell
- the PATTERN shows a consolidating triangle. they occur in 5 waves a-b-c-d-e and the “wave” relationship should be .618 of the preceding wave. the “bc” wave has done that and we have a very nice pattern for “cd” in/around 1.0644-1.0720.
- would like to see that hold w/ a move up into “e” to complete the sequence.
- IF we break hard to the downside and the pattern is broken then “assume” that “e?” was the end of the consolidation and get short looking for a daily close below lower trend line as confirmation.
- IF we break strong to the upside then look for “breakout targets” and watch price action in/around these areas. If continually strong and a DAILY close ABOVE 1.171 then TRIANGLE THESIS IS WRONG. Adjust
go ahead and hate … CSCO appears ready to breakout and outperform
Posted on March 14, 2016 1 Comment
03/14/2016 – update
the move down to 16 did not materialize but do believe the Mirror Image Foldback is still working. Put this one on the radar screen as it appears to be getting ready to blow. An update chart below:
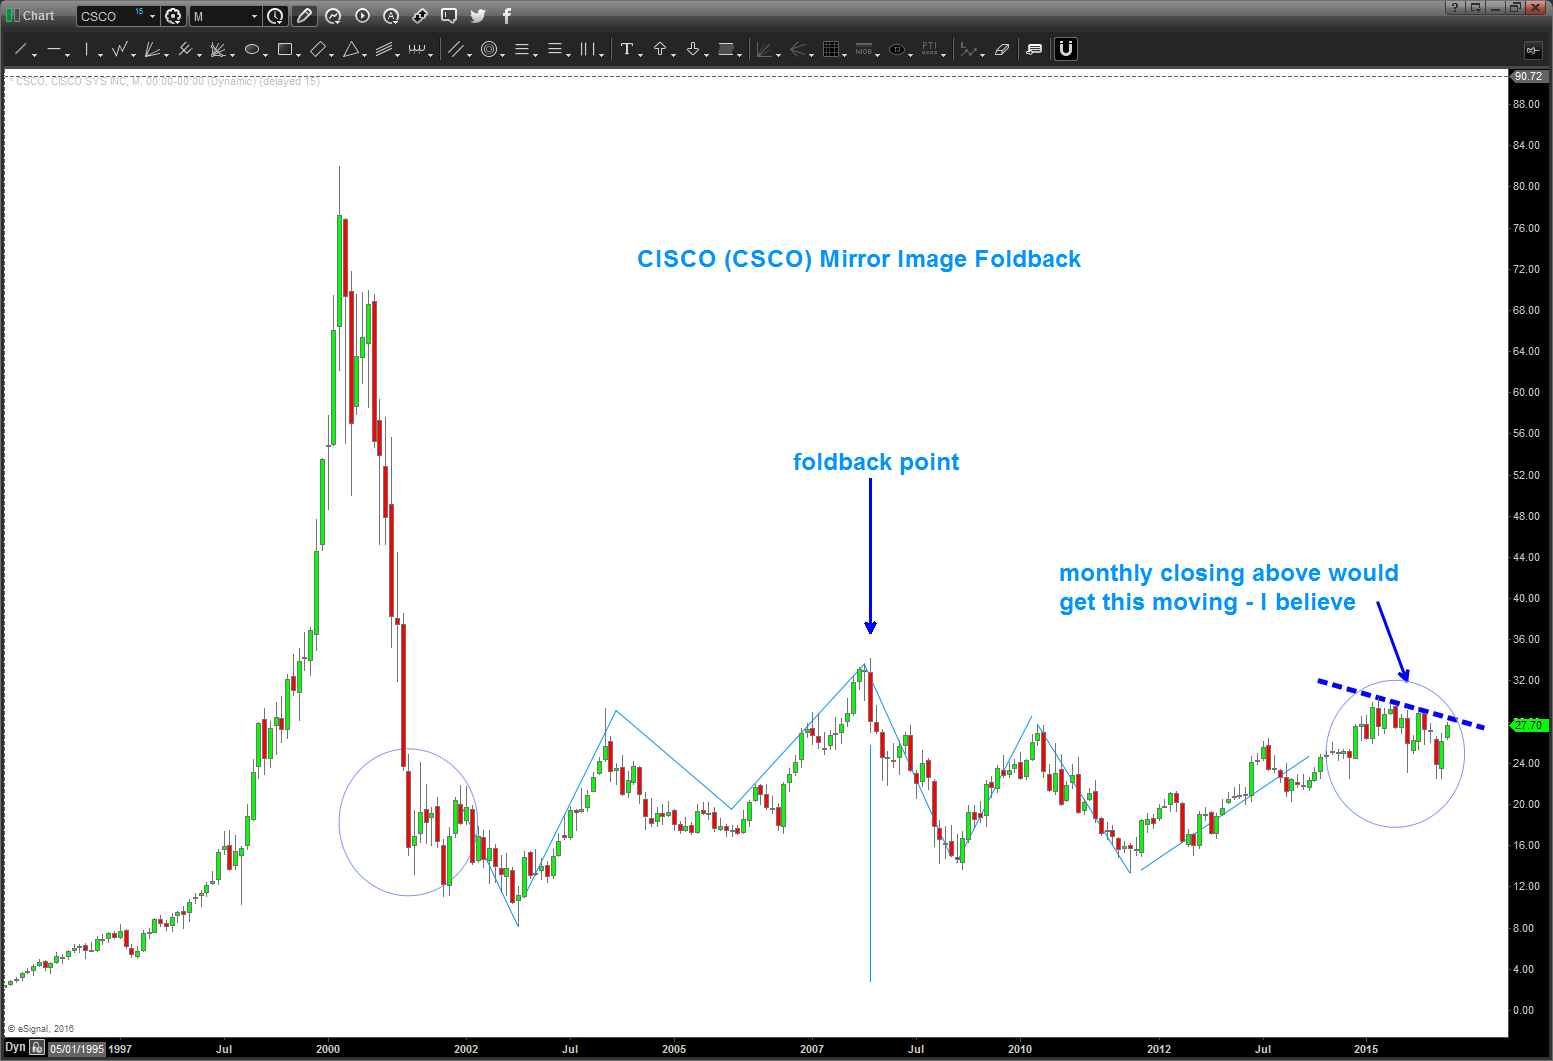
PUT THIS ONE ON THE RADAR SCREEN ….
now, look at these relative strength charts of CSCO vs FB/GOOGL/AAPL/AMZN
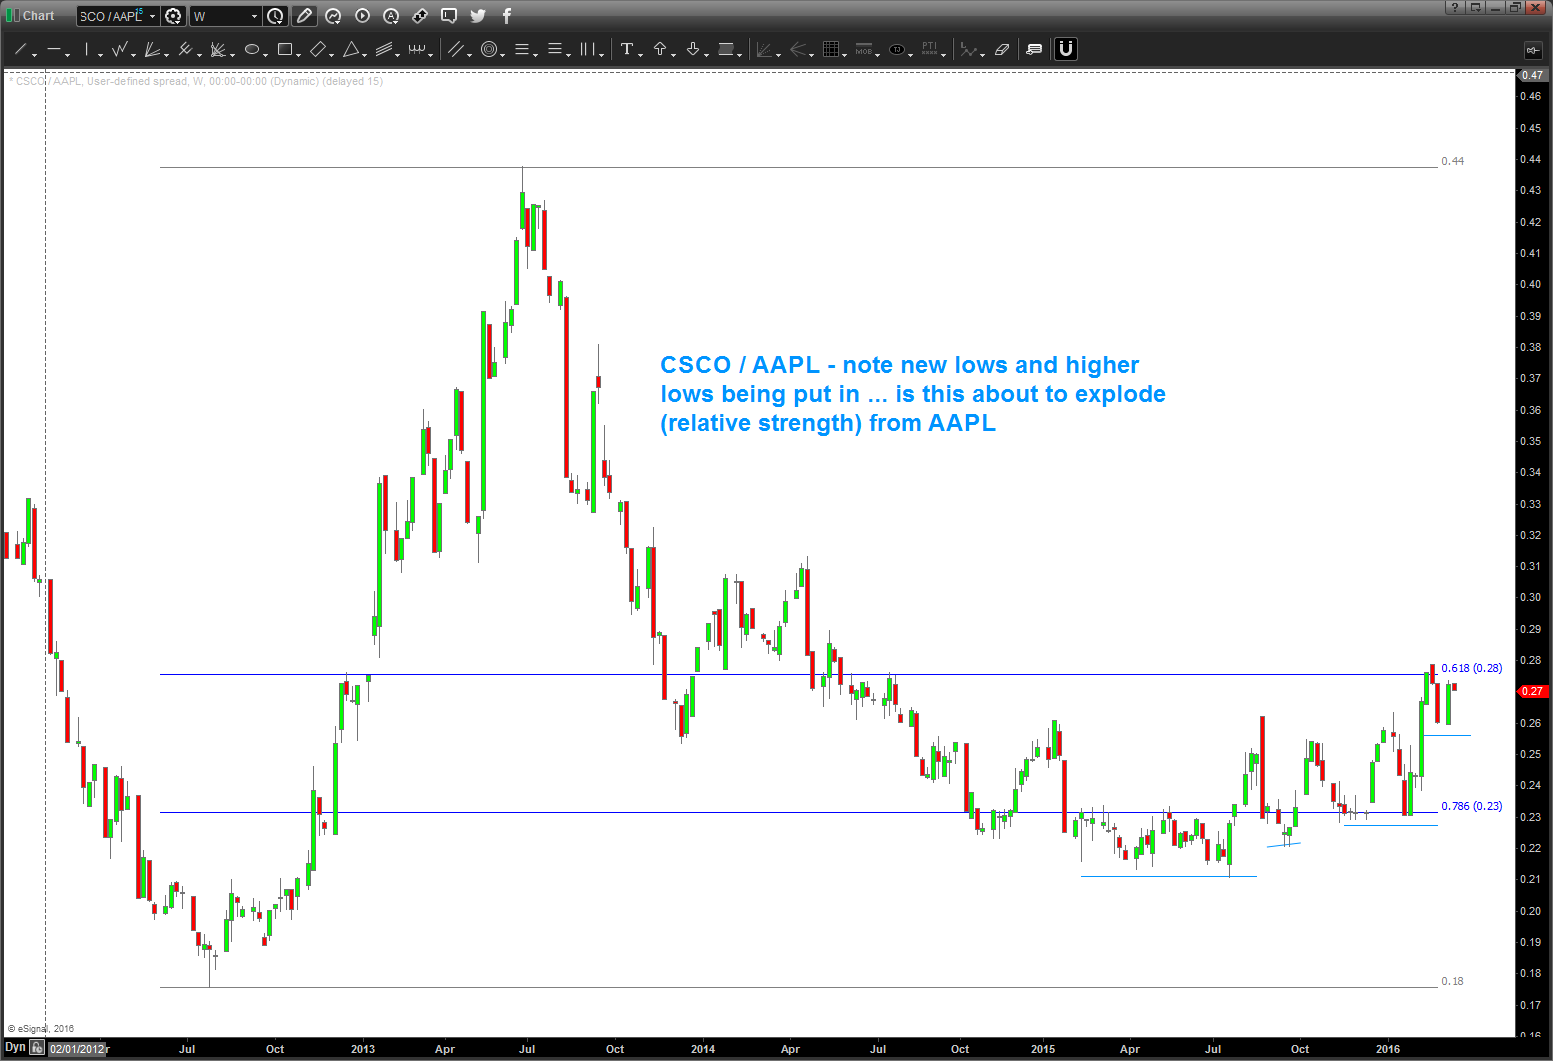
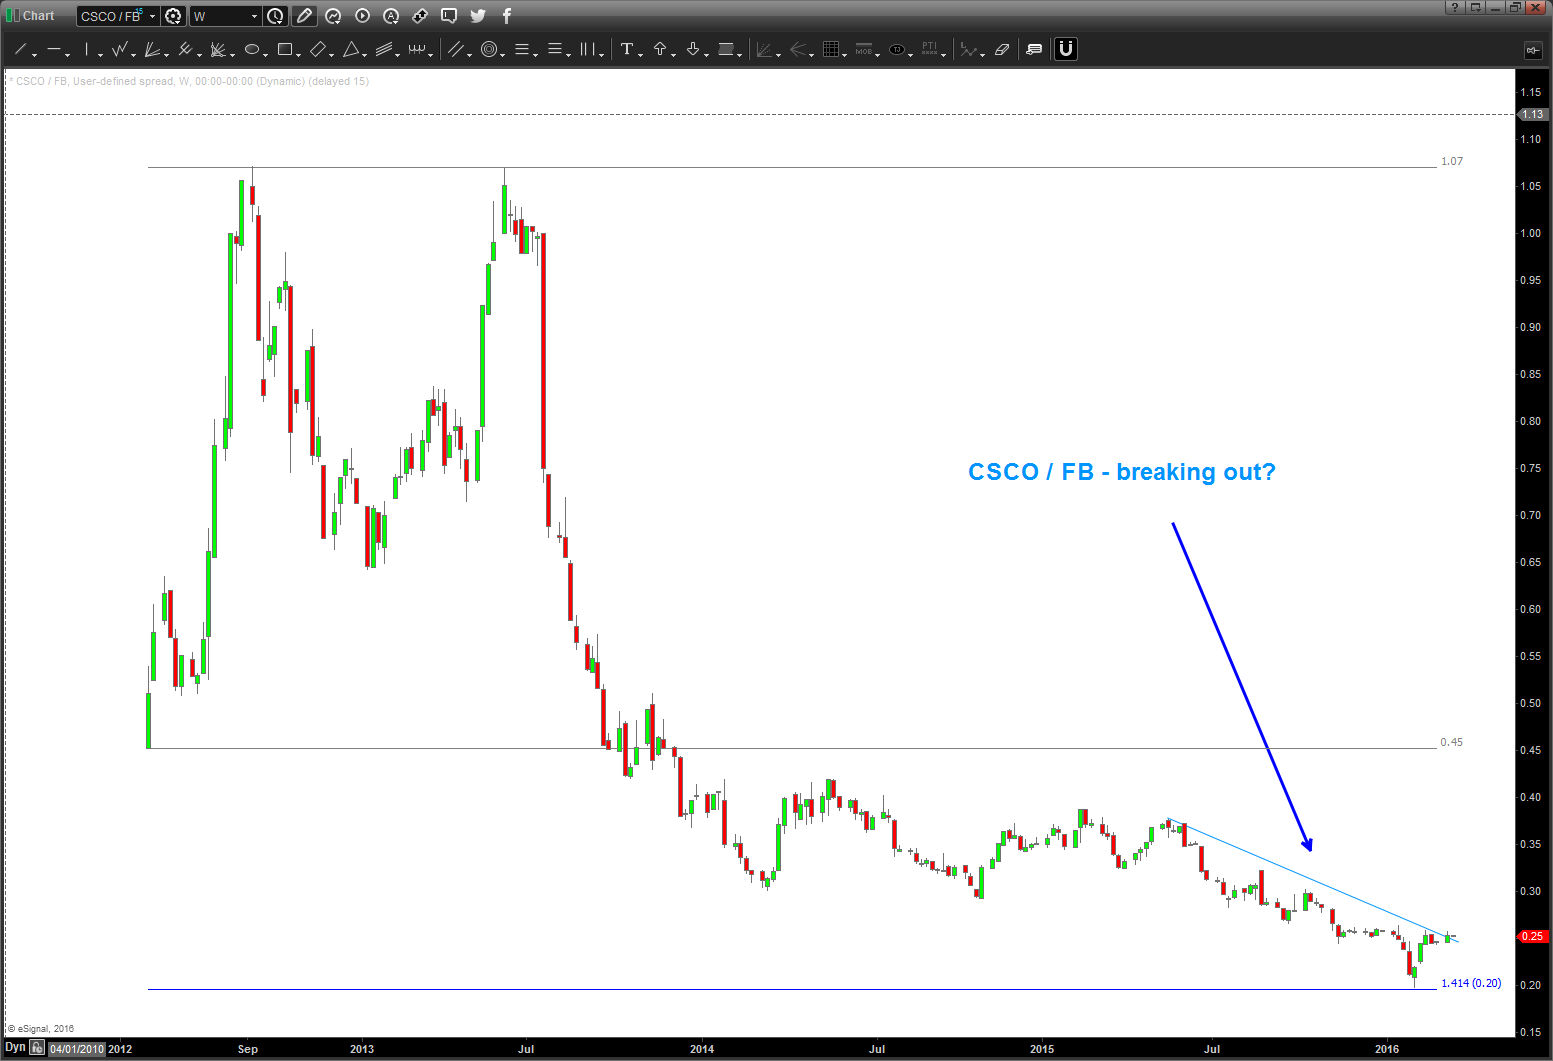
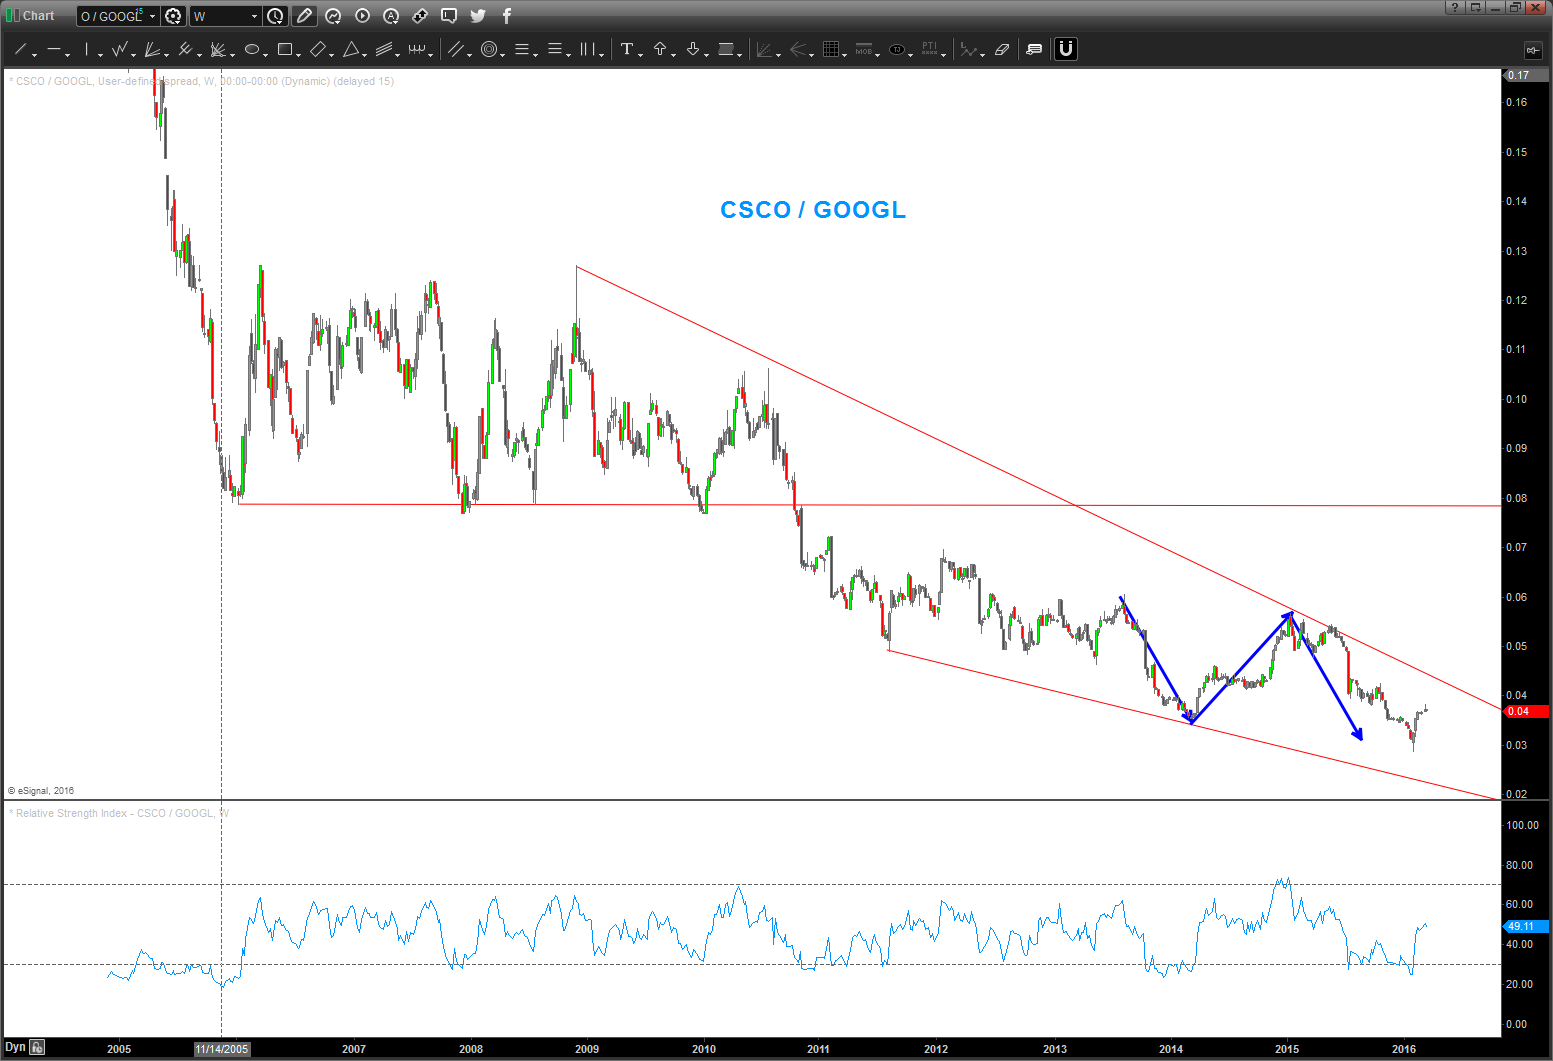
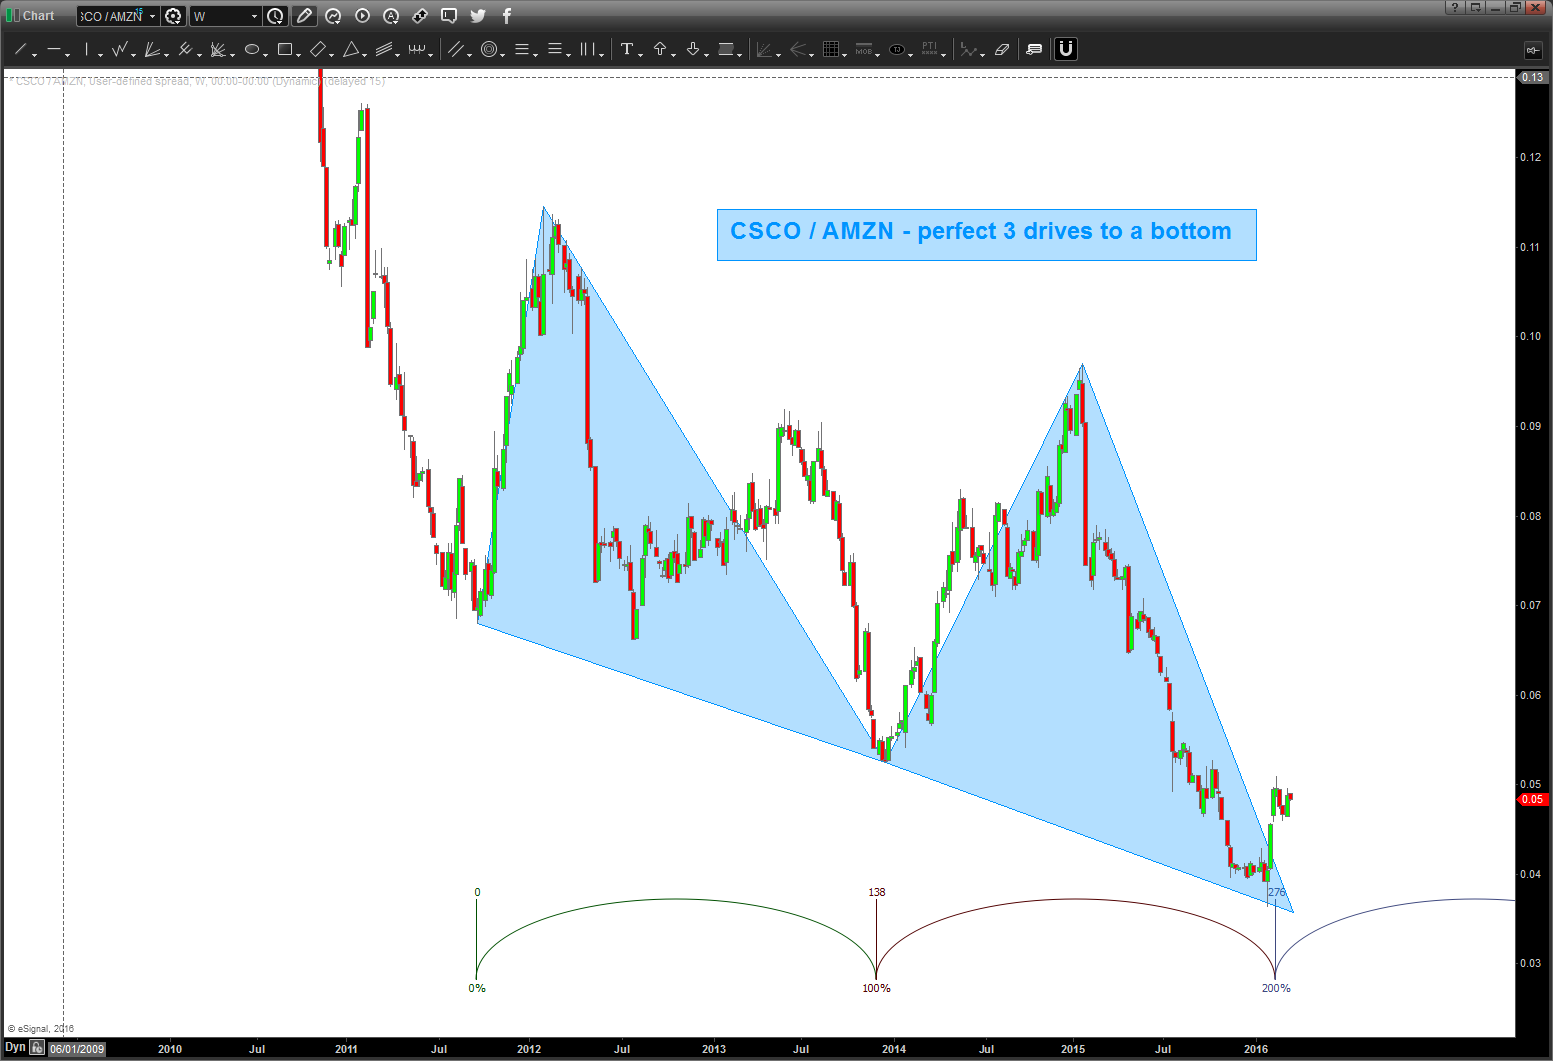
believe it or not … the glamour names certainly look to be under pressure from CSCO and it “should” start to outperform on a relative strength basis. With this type of underlying strength, watch for the breakout noted above.
Let me know if you have any questions.
B
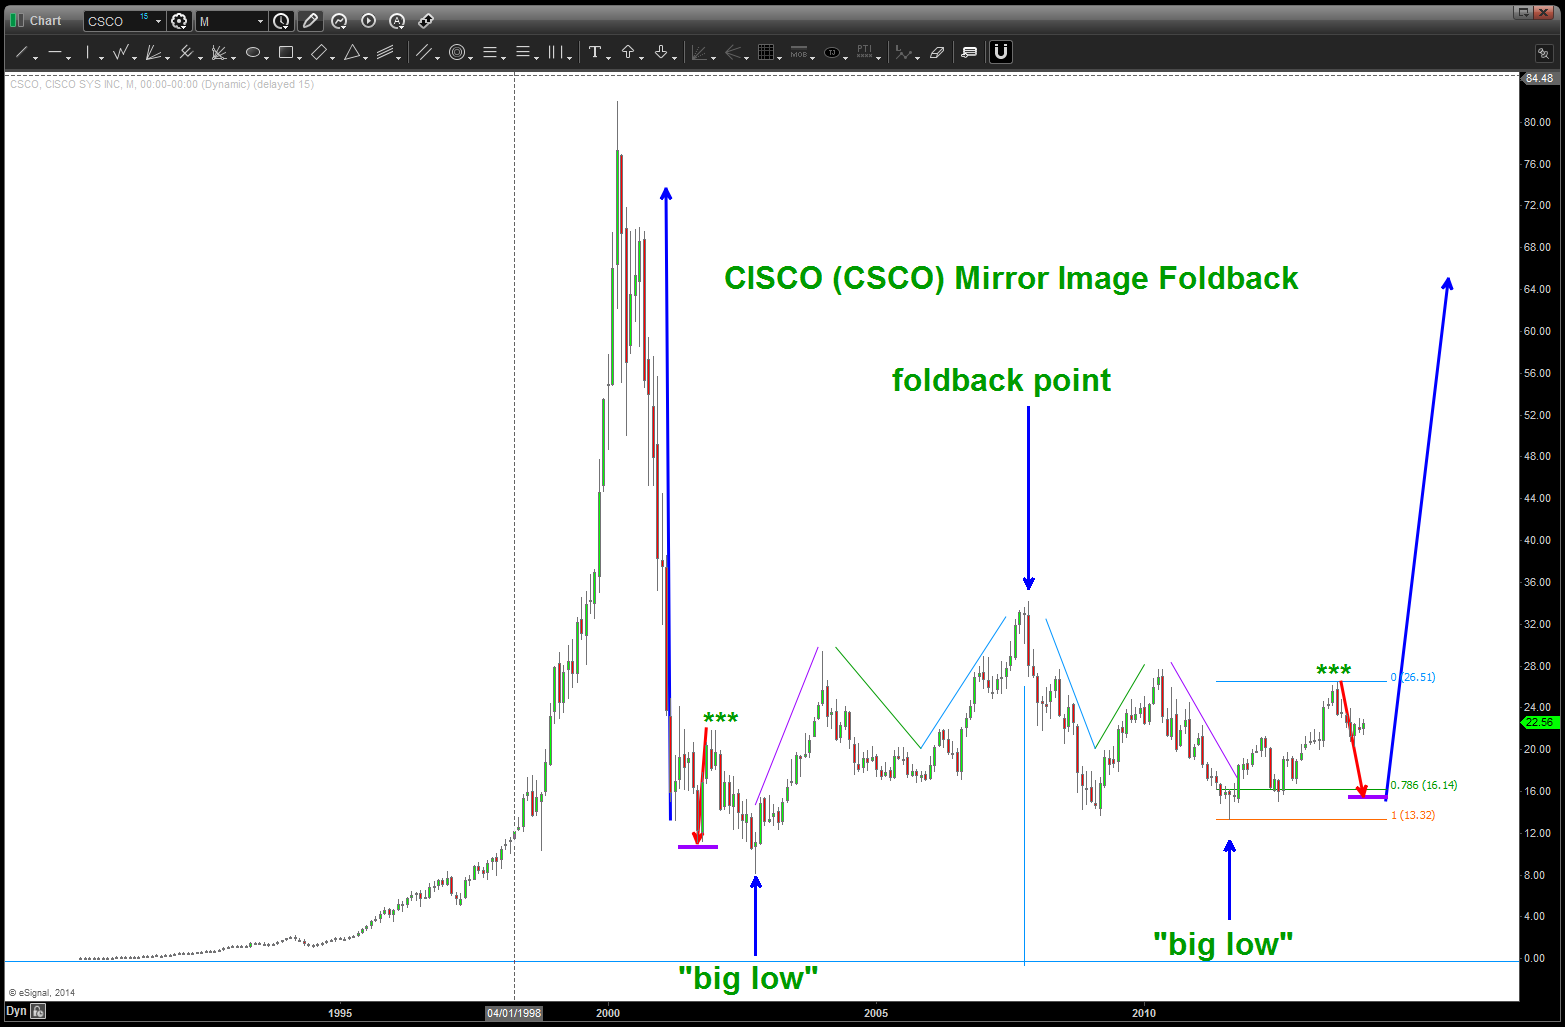
a move down to 16 would be a NICE place to BUY for a potential foldback as shown …KABOOM (?)
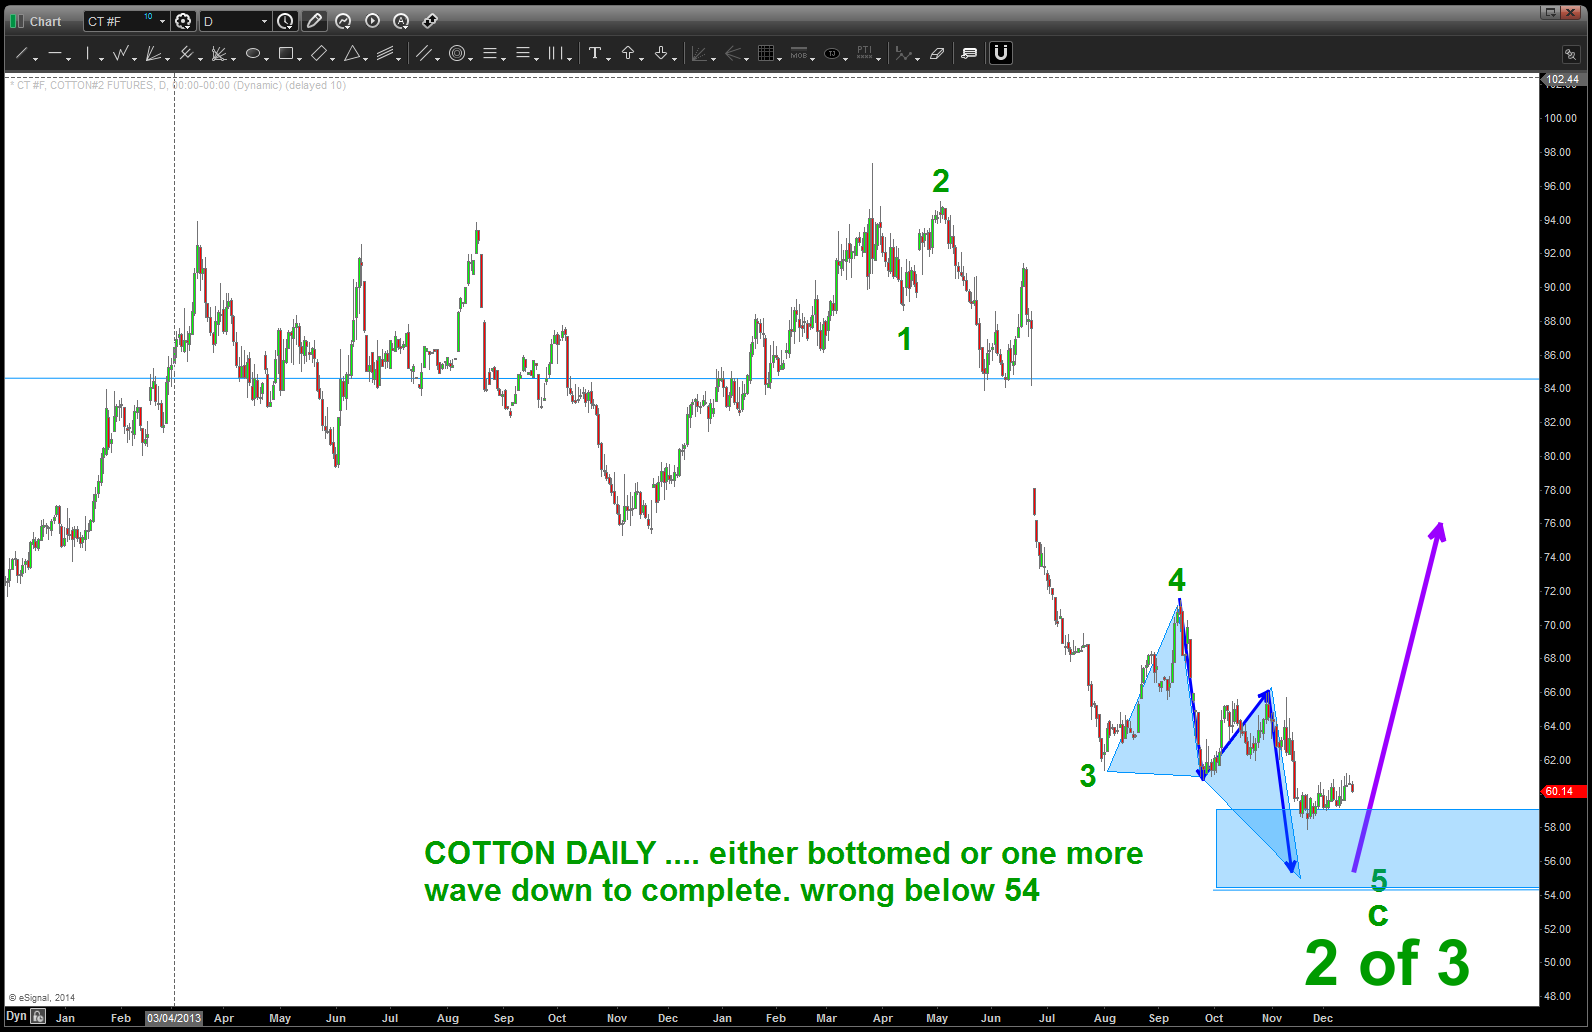
buy your shirts now … Cotton getting ready to explode – 15 months later
Posted on March 14, 2016 Leave a Comment
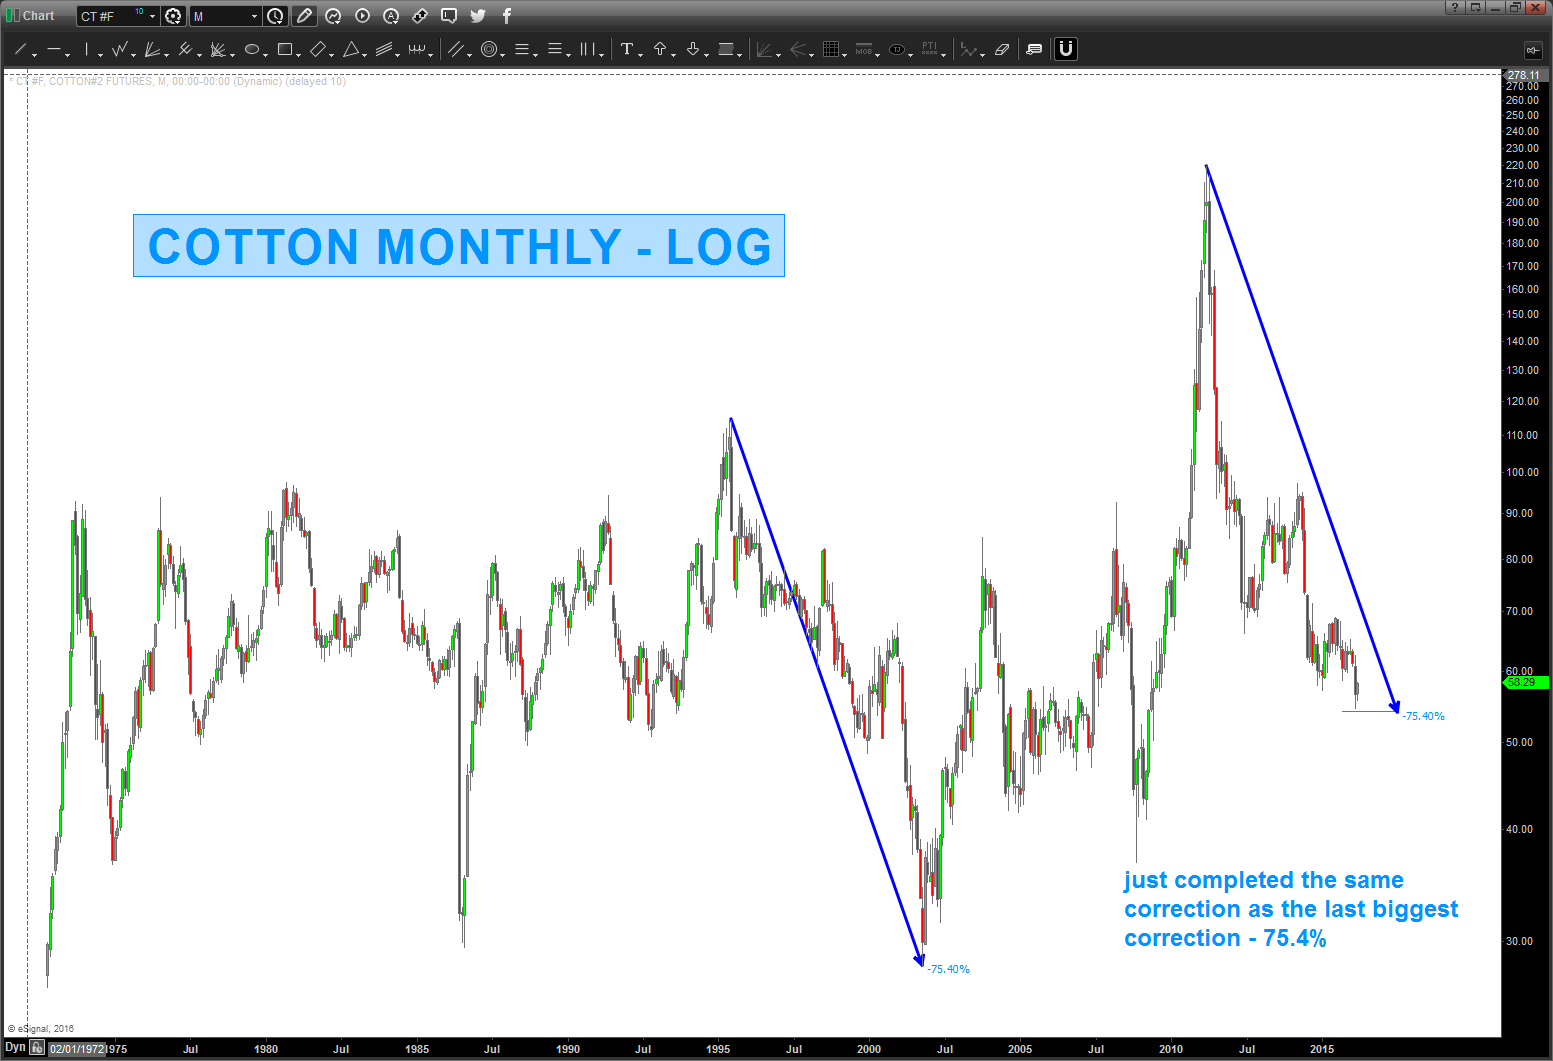
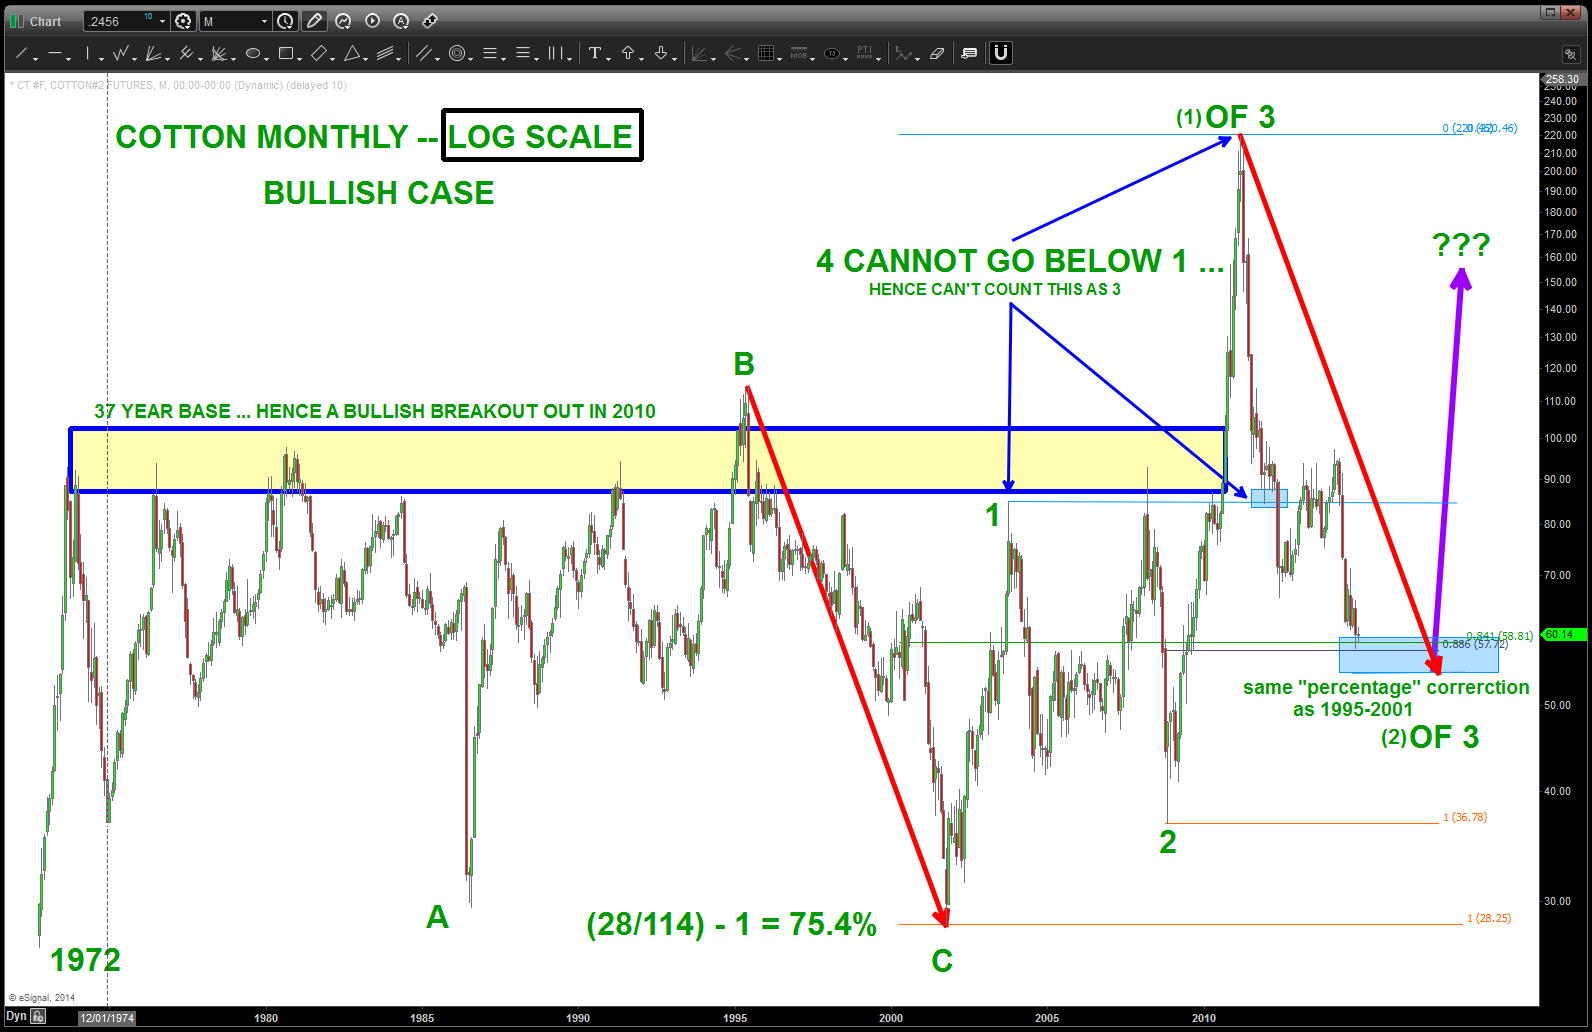
03/14/2016 – my good friend JC (www.allstarcharts.com) just blogged about cotton and it jogged my memory that 15 months ago I blogged about a low coming in cotton. (I’m good at timing, right? LOL) But, time is the key component and the PRICE level just completed the same corrective move (-75%) that represented the largest corrective move – EVER.
just saying, Cotton could be rolling w/ like Mr Toads Wild Ride …here’s updated charts:
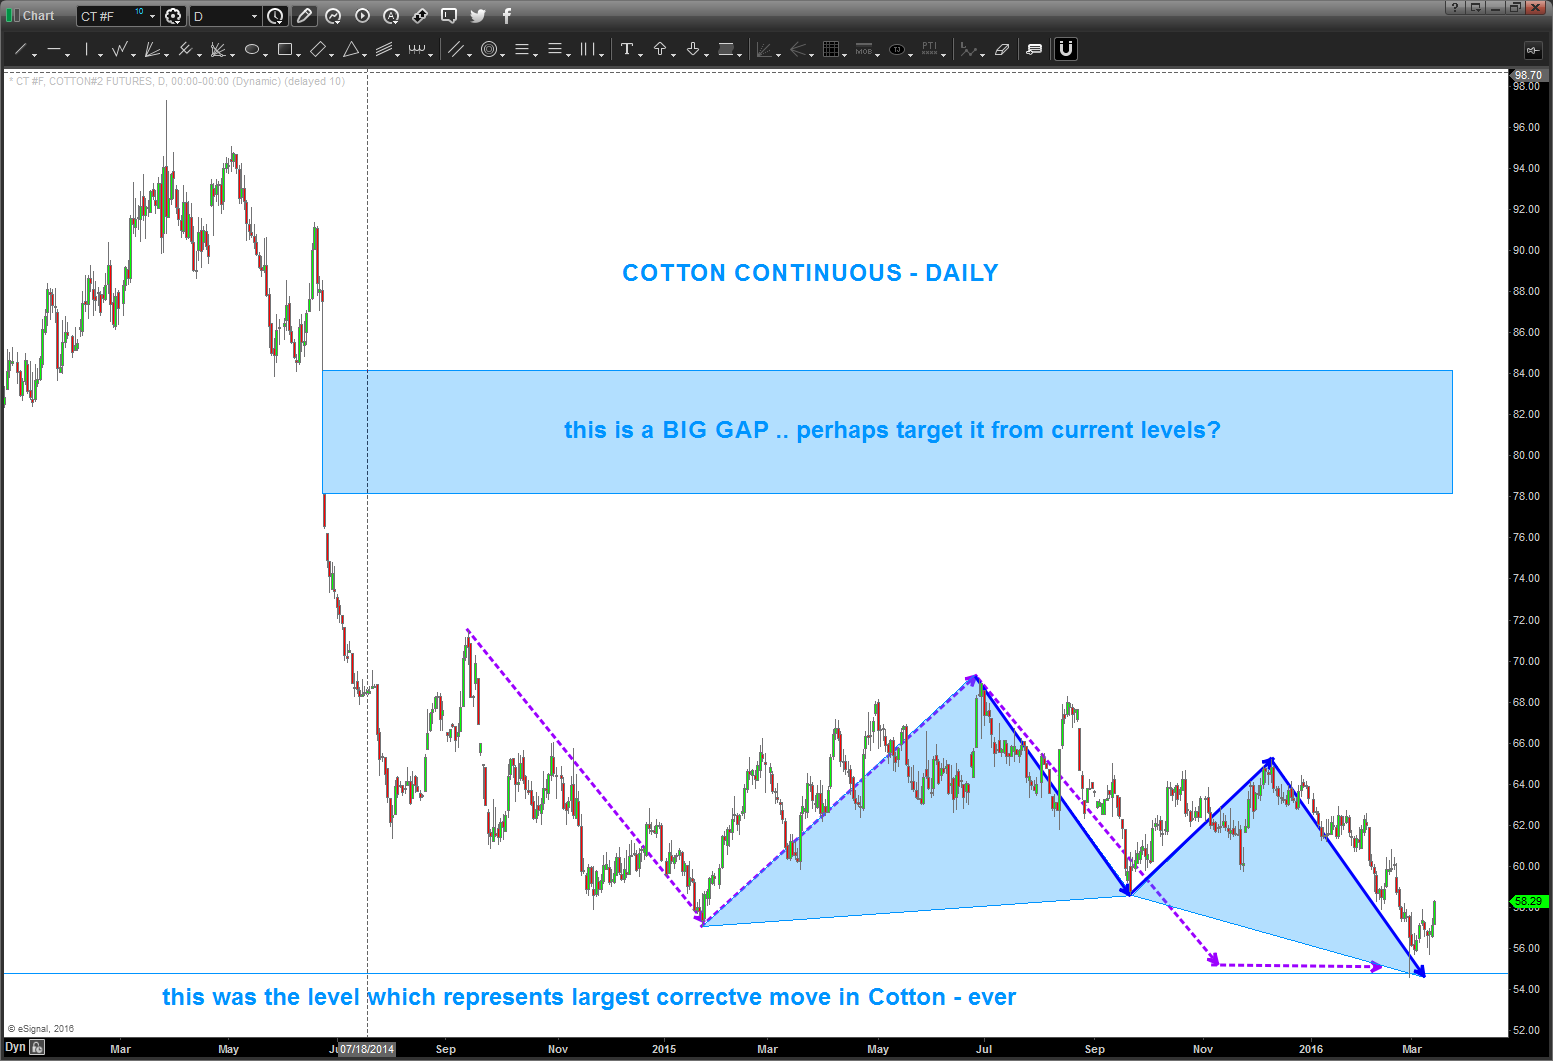
if your an ETF player, perhaps look at LONG BAL in/around these levels and stop out below 35?
Enjoy.
Bart
Wrong below 54.45 ….picture paints a thousand words. Two charts so here’s two thousand words.
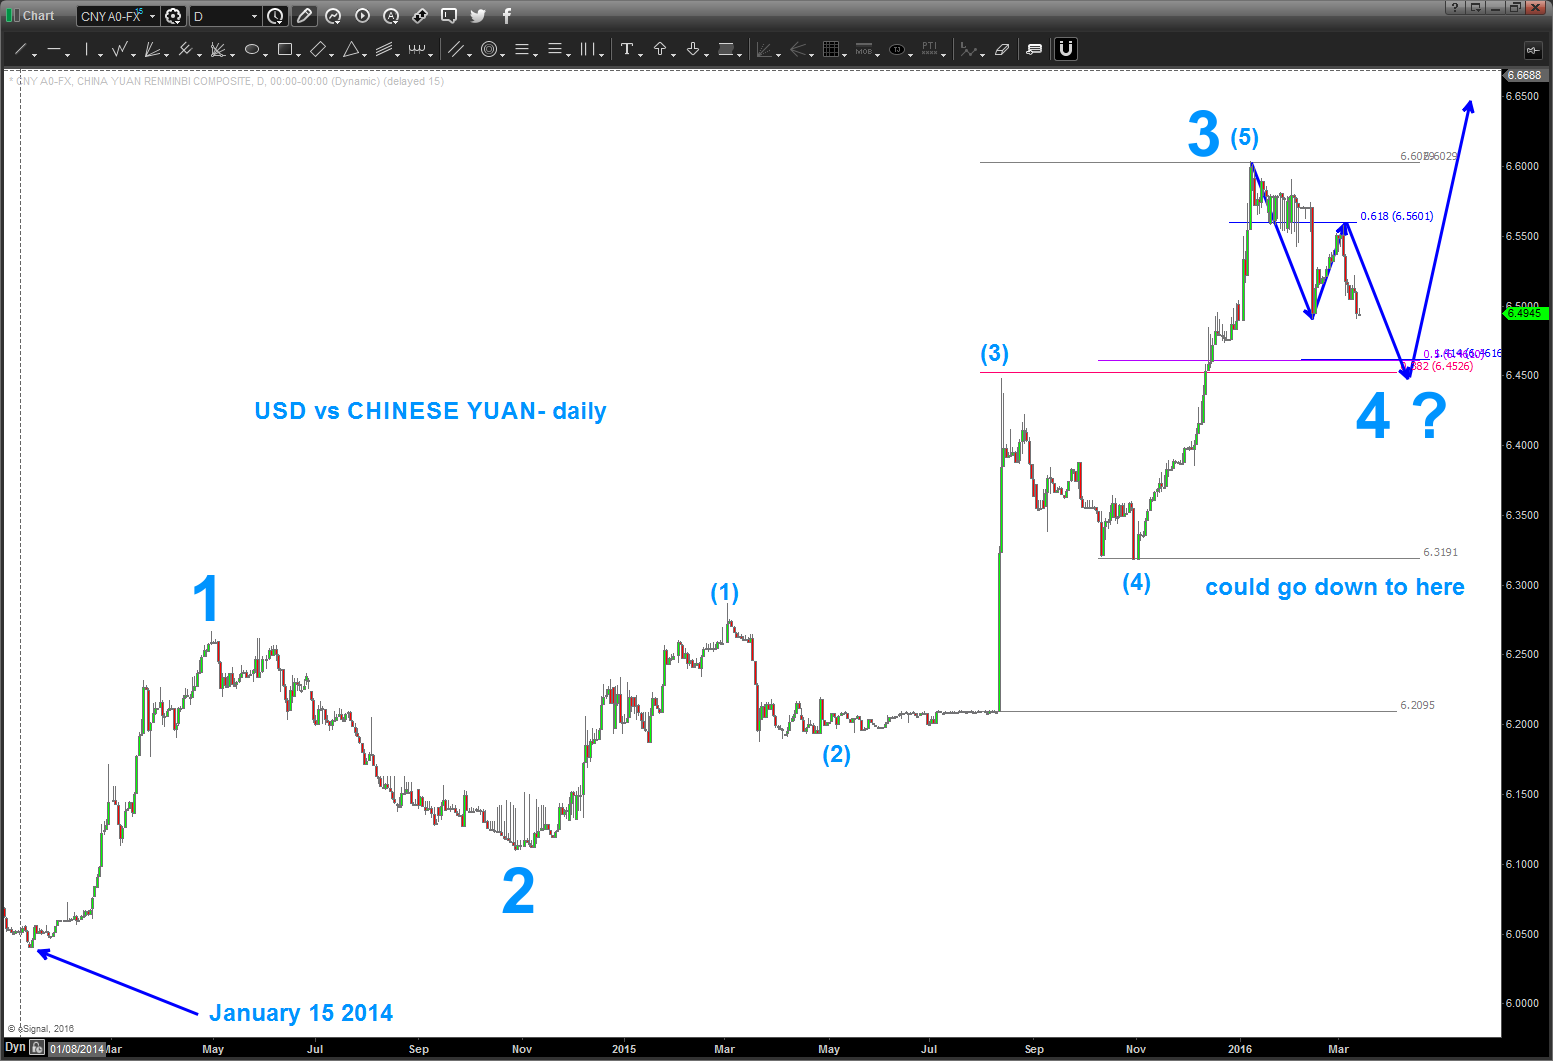
Chinese Yuan update …
Posted on March 14, 2016 Leave a Comment
sure looks like USD new highs after this pullback is complete.
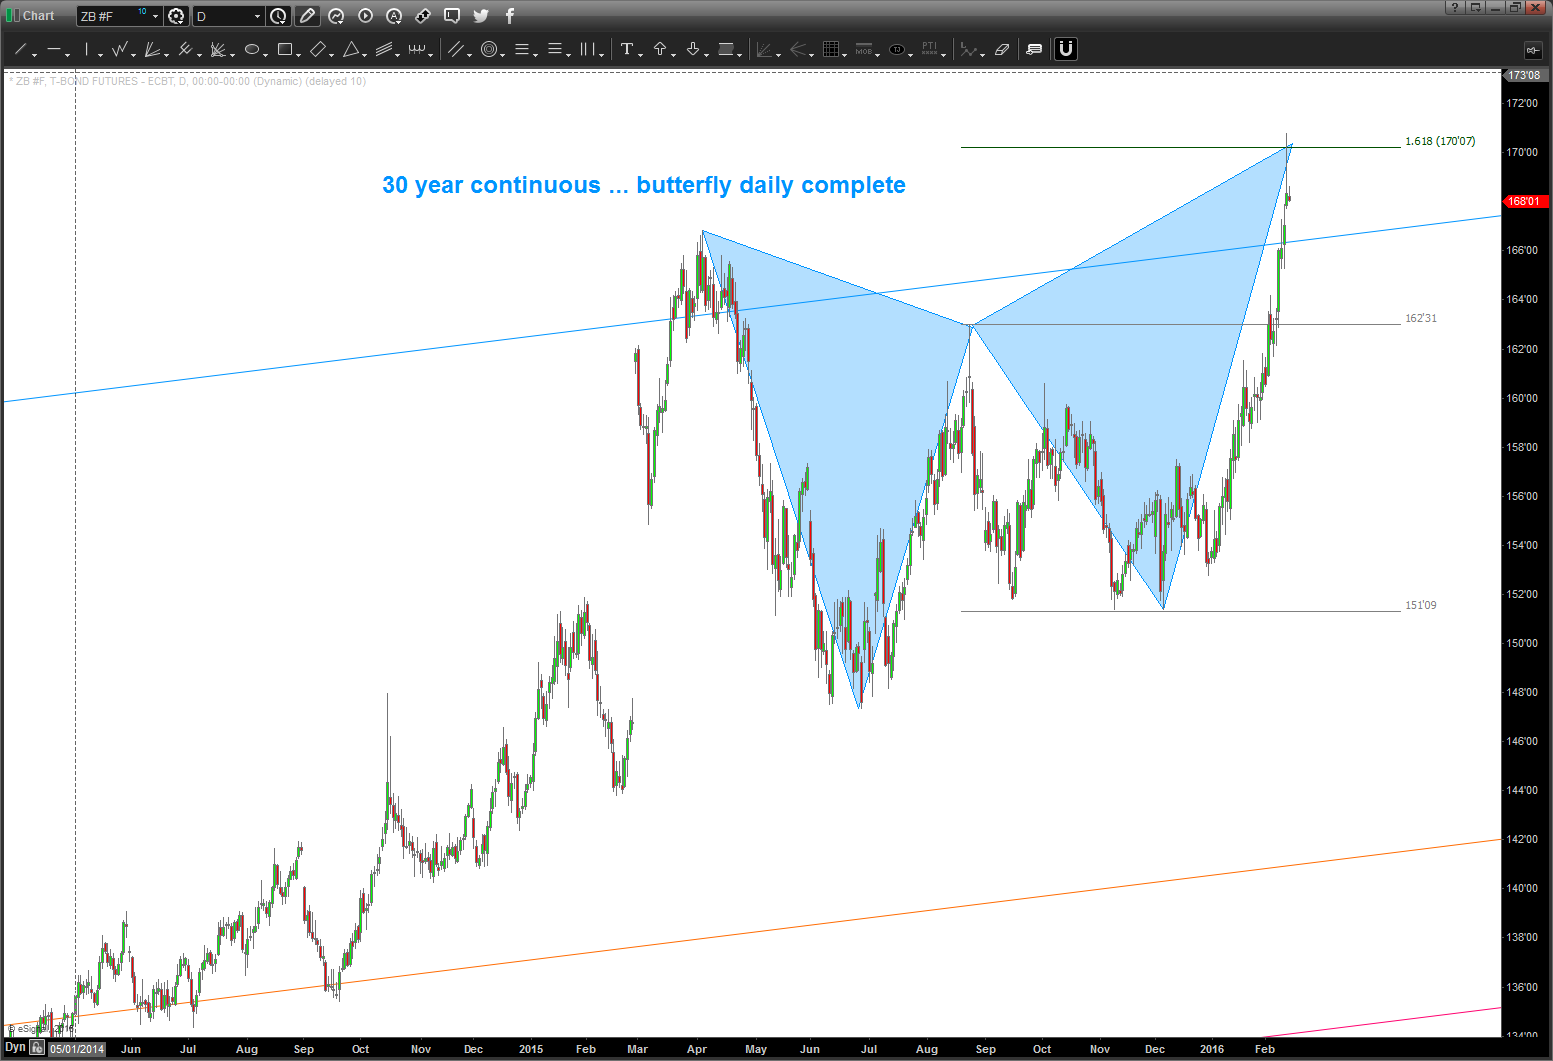
update to TLT and 30 year continuous futures …
Posted on March 14, 2016 Leave a Comment
03/1482016
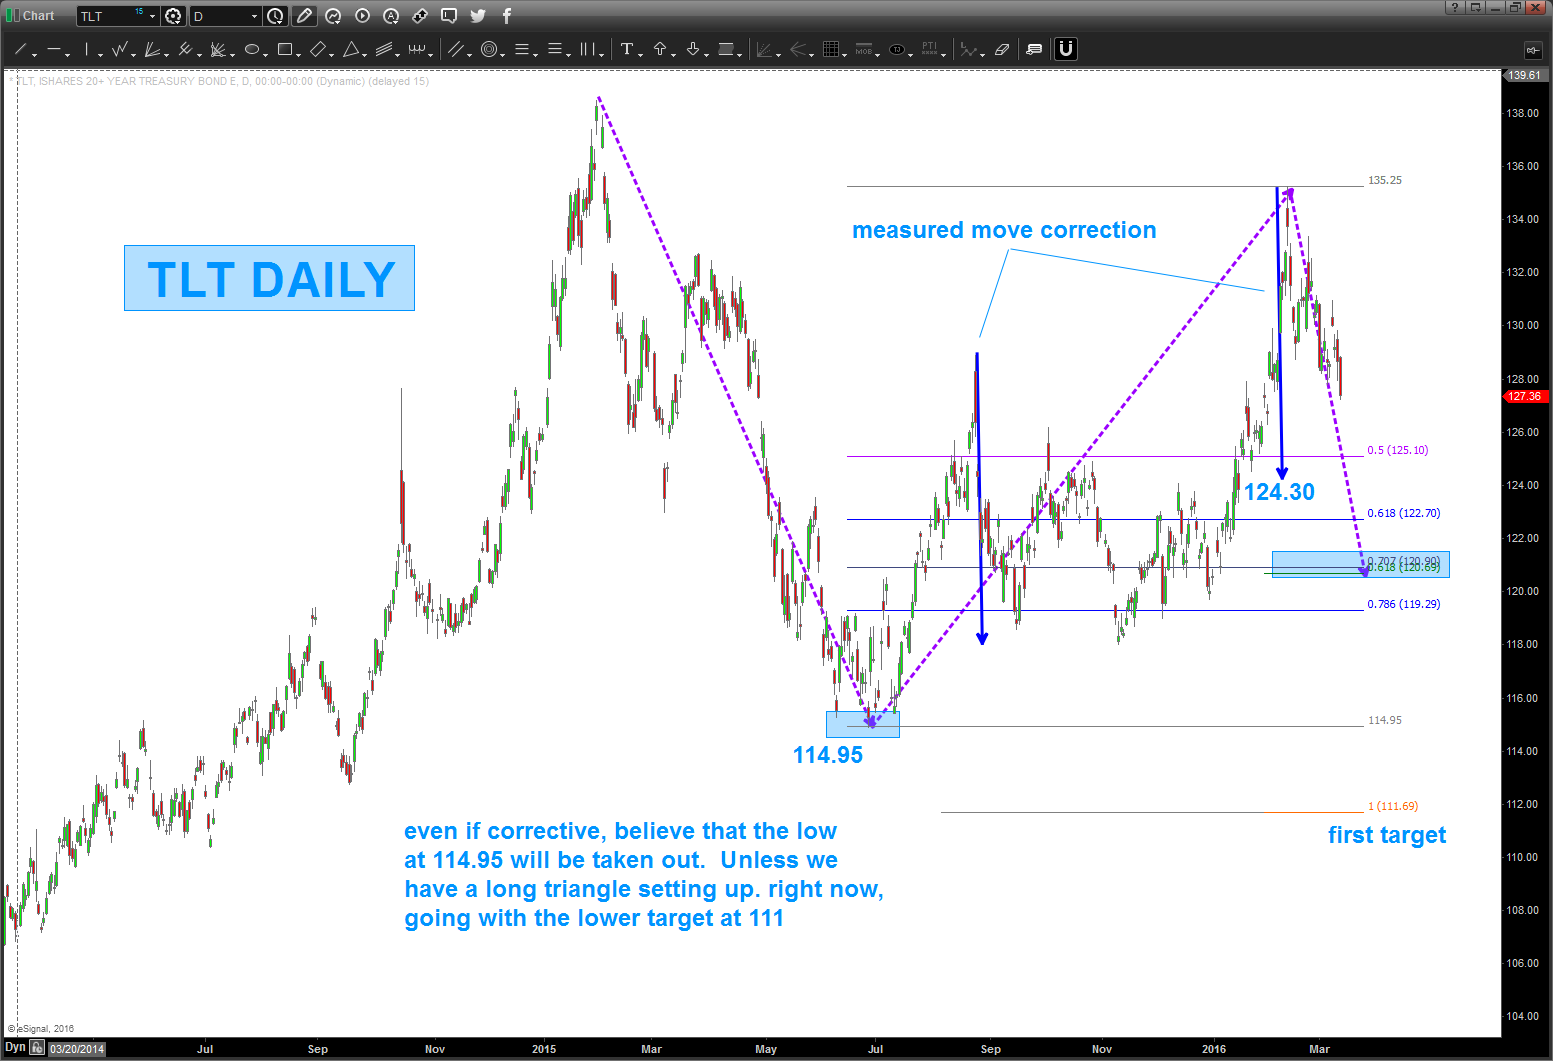
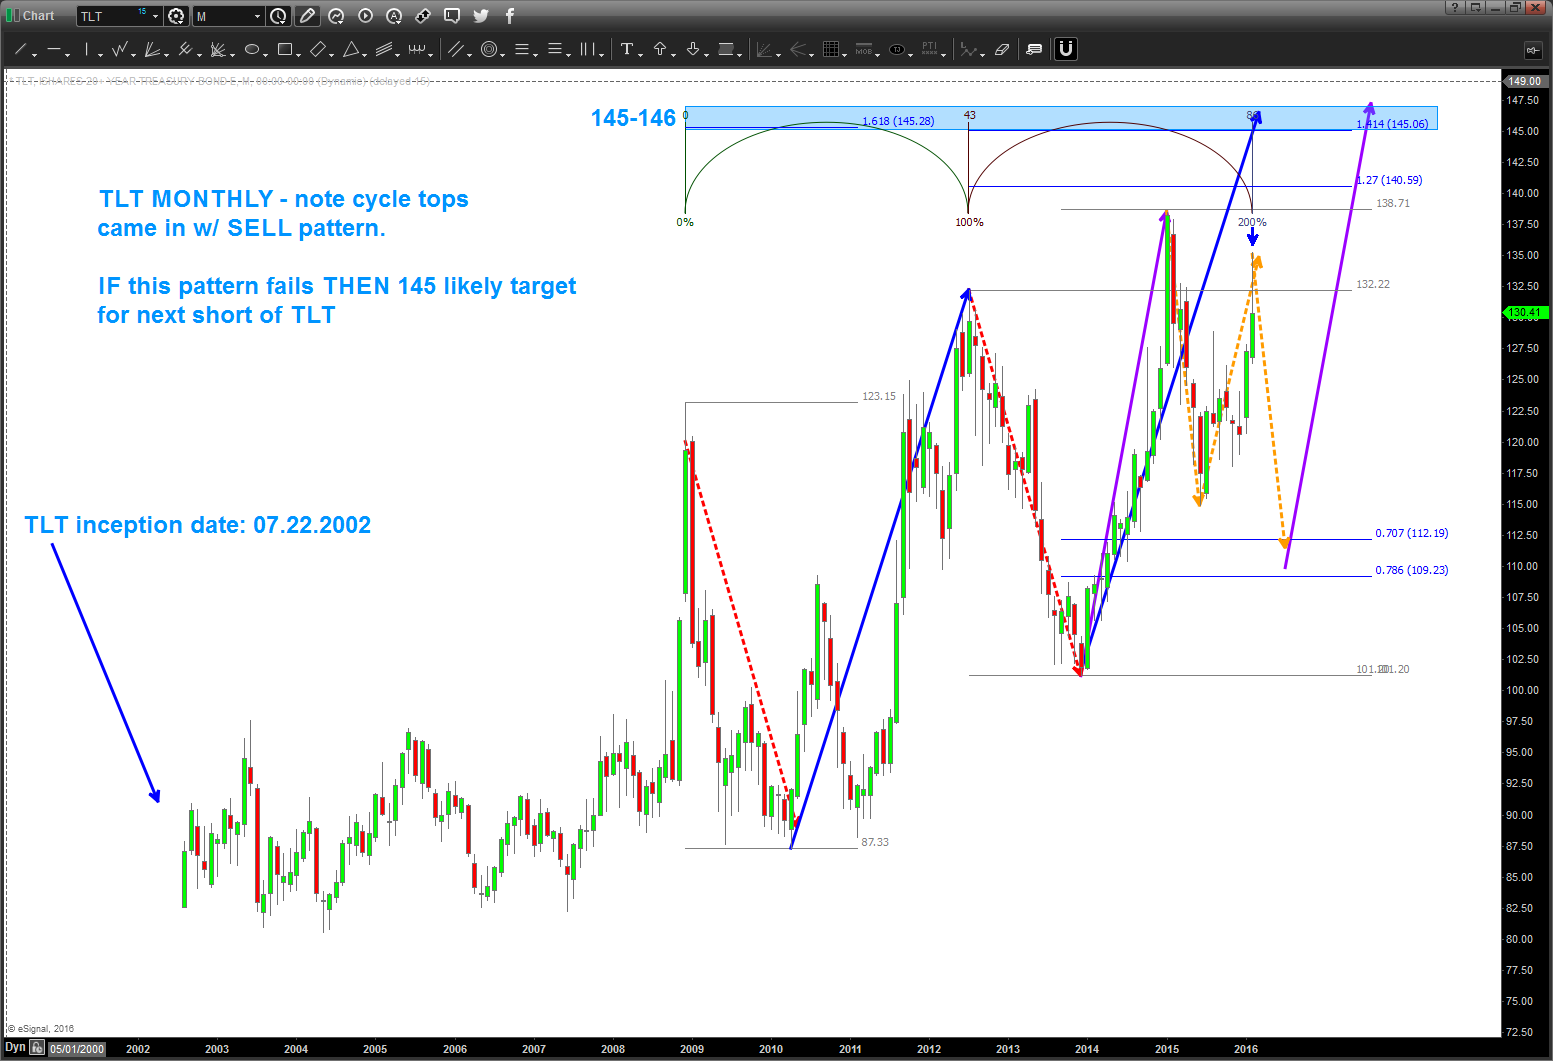
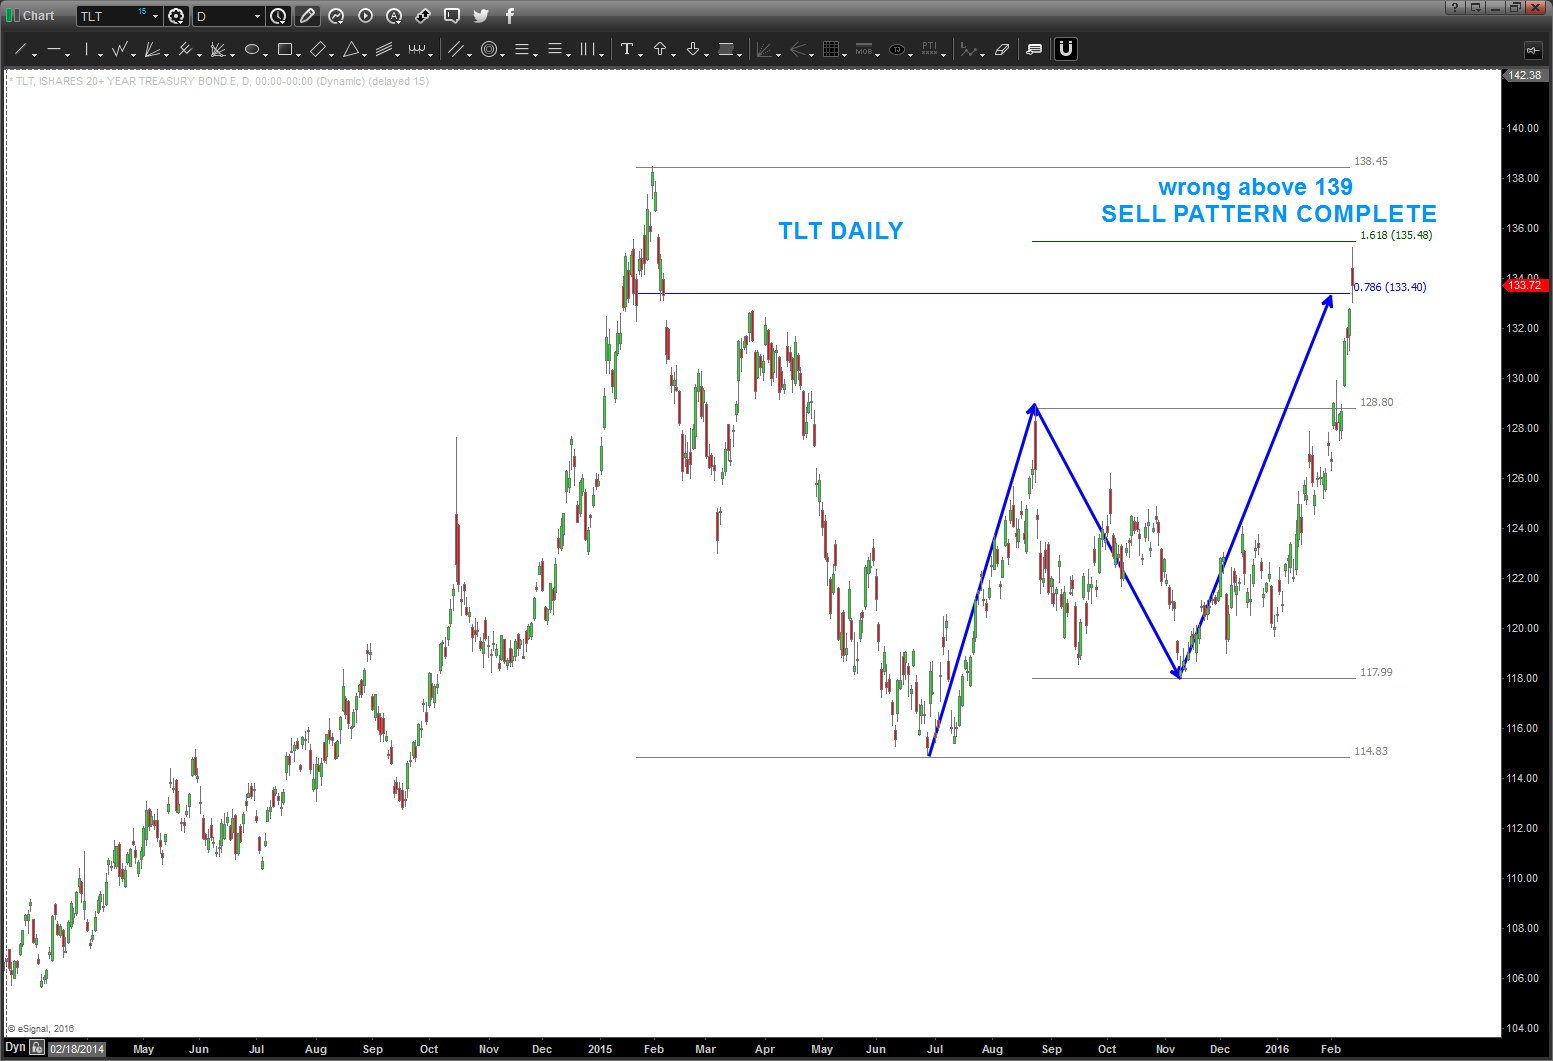
02/27/16 – TLT, if correct, should be losing steam over the coming days/weeks. Initial target appears to be 109-111.
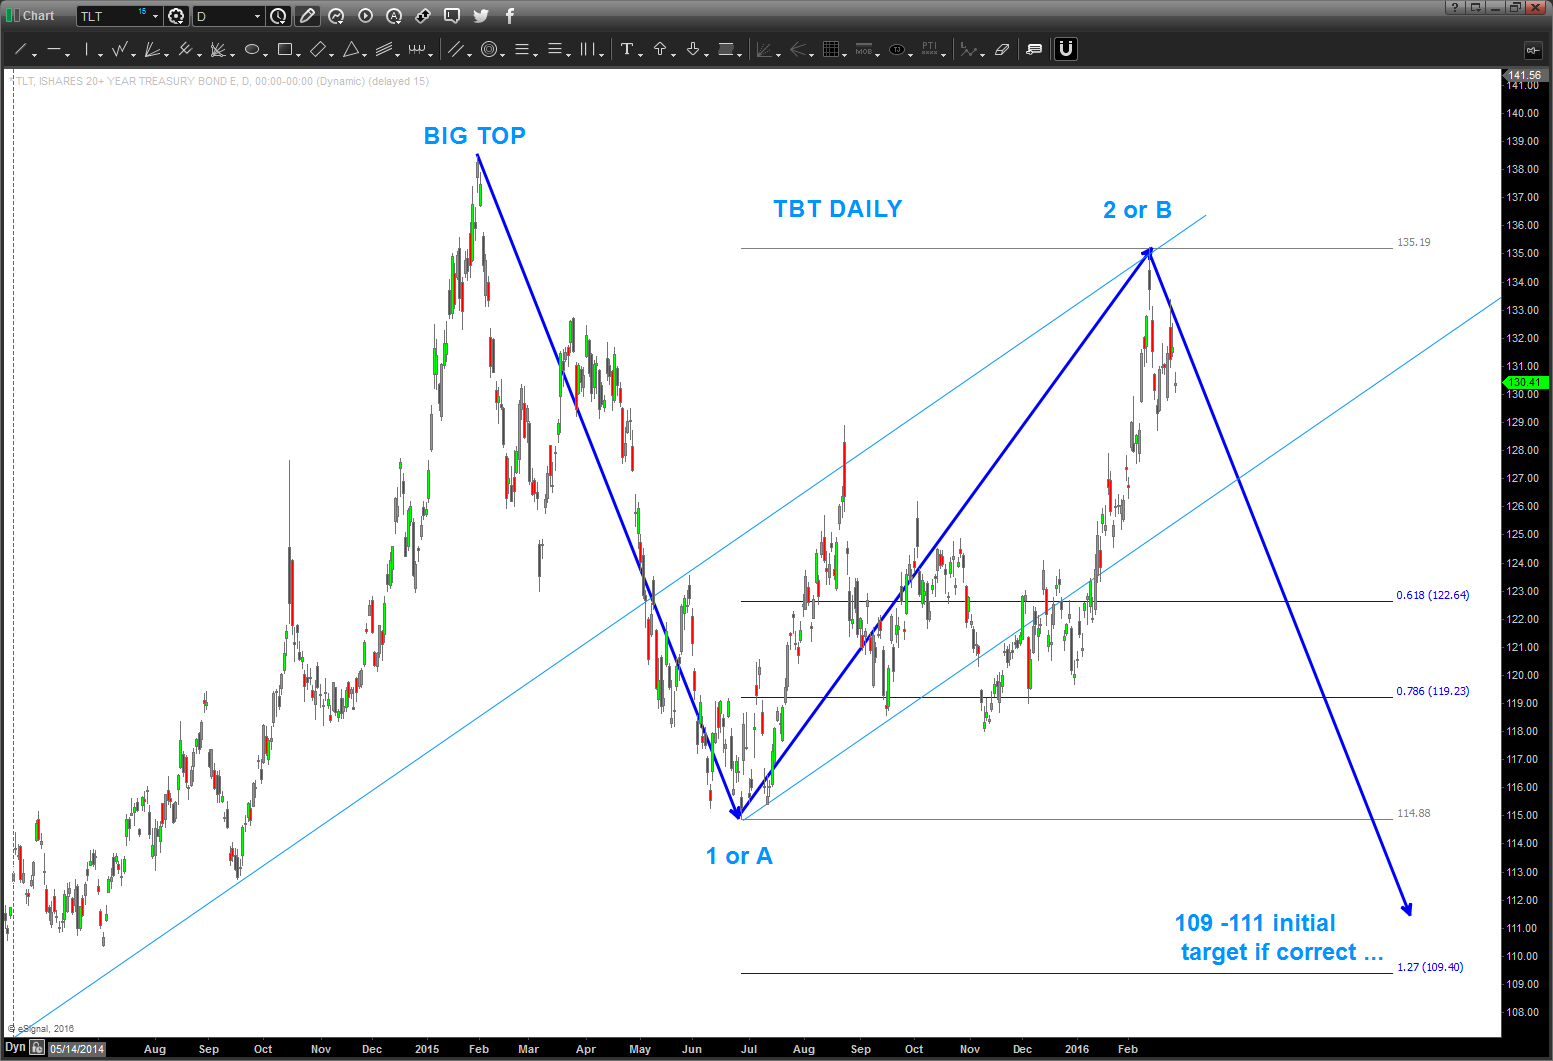
note, if this pattern fails, then 145 is a very strong target as shown below. also note, the cycle top times came in w/ pattern completion. right now, favor the short side into the 109-111 area but do want to show possibilities.