the current market conditions and the AUDJPY – update
Posted on March 13, 2016 Leave a Comment
03/13/2016 – UPDATE
I’ve received a bunch of requests trying to see if this is a new BEAR MARKET or a corrective move w/in the context of a BULL MARKET. so, in order to give it a shot I’m going to go to the AUDJPY. TILT …? Yes, the AUDJPY. Please see below and read about the strong correlation of the AUDJPY and the NYSE.
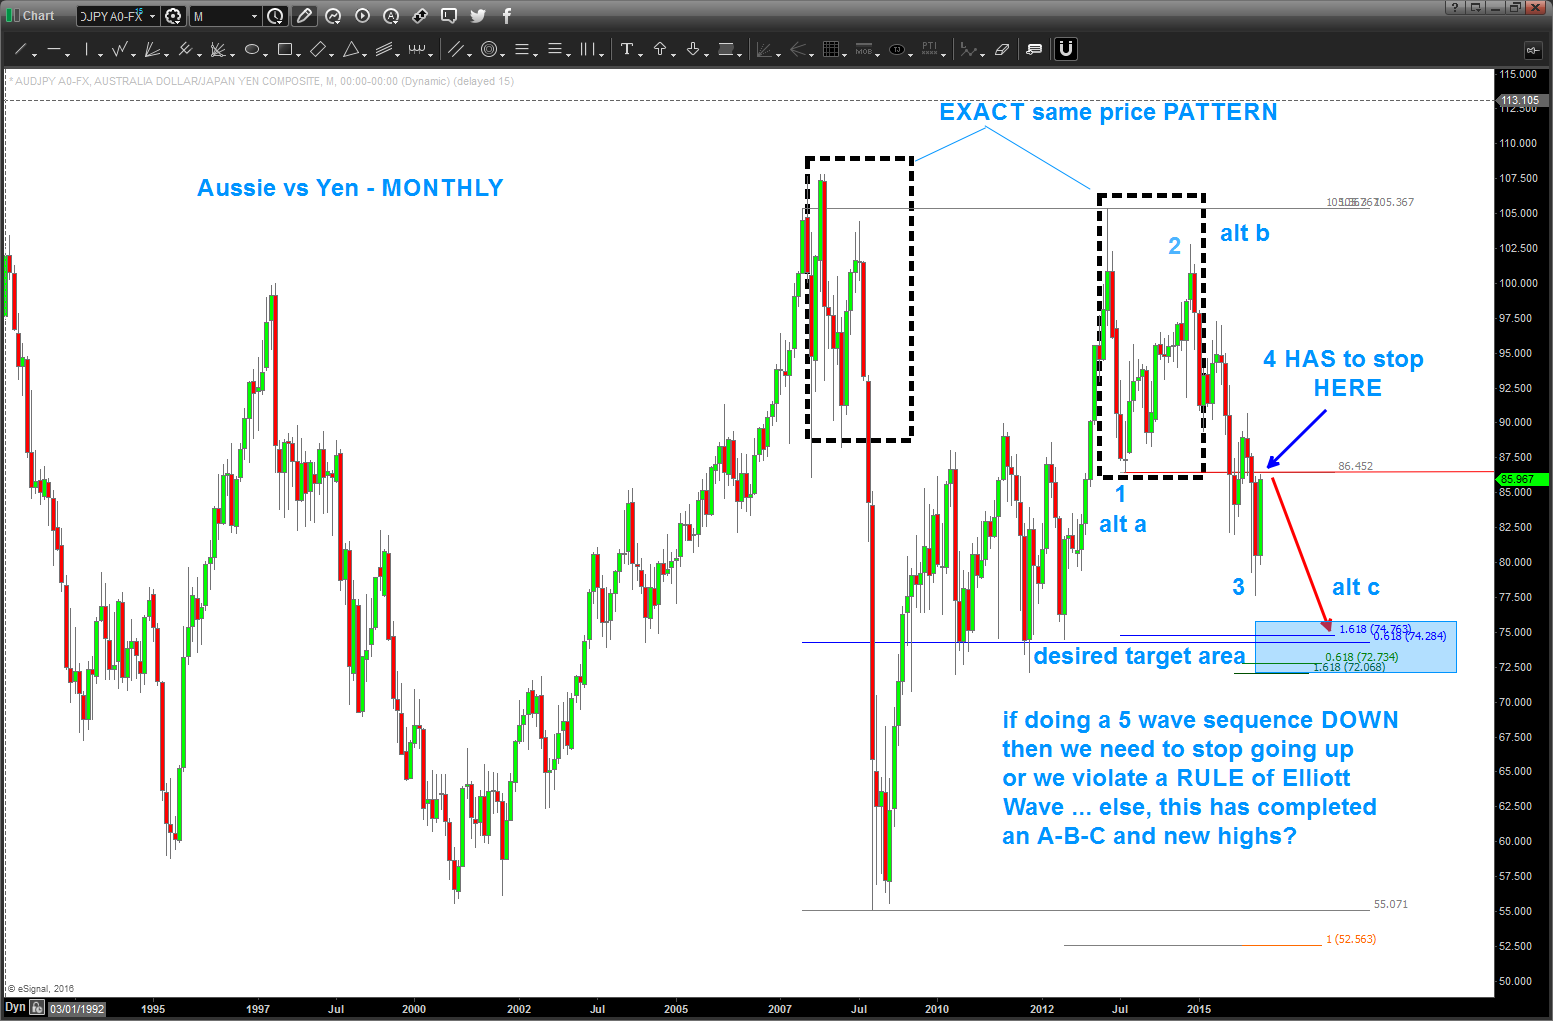
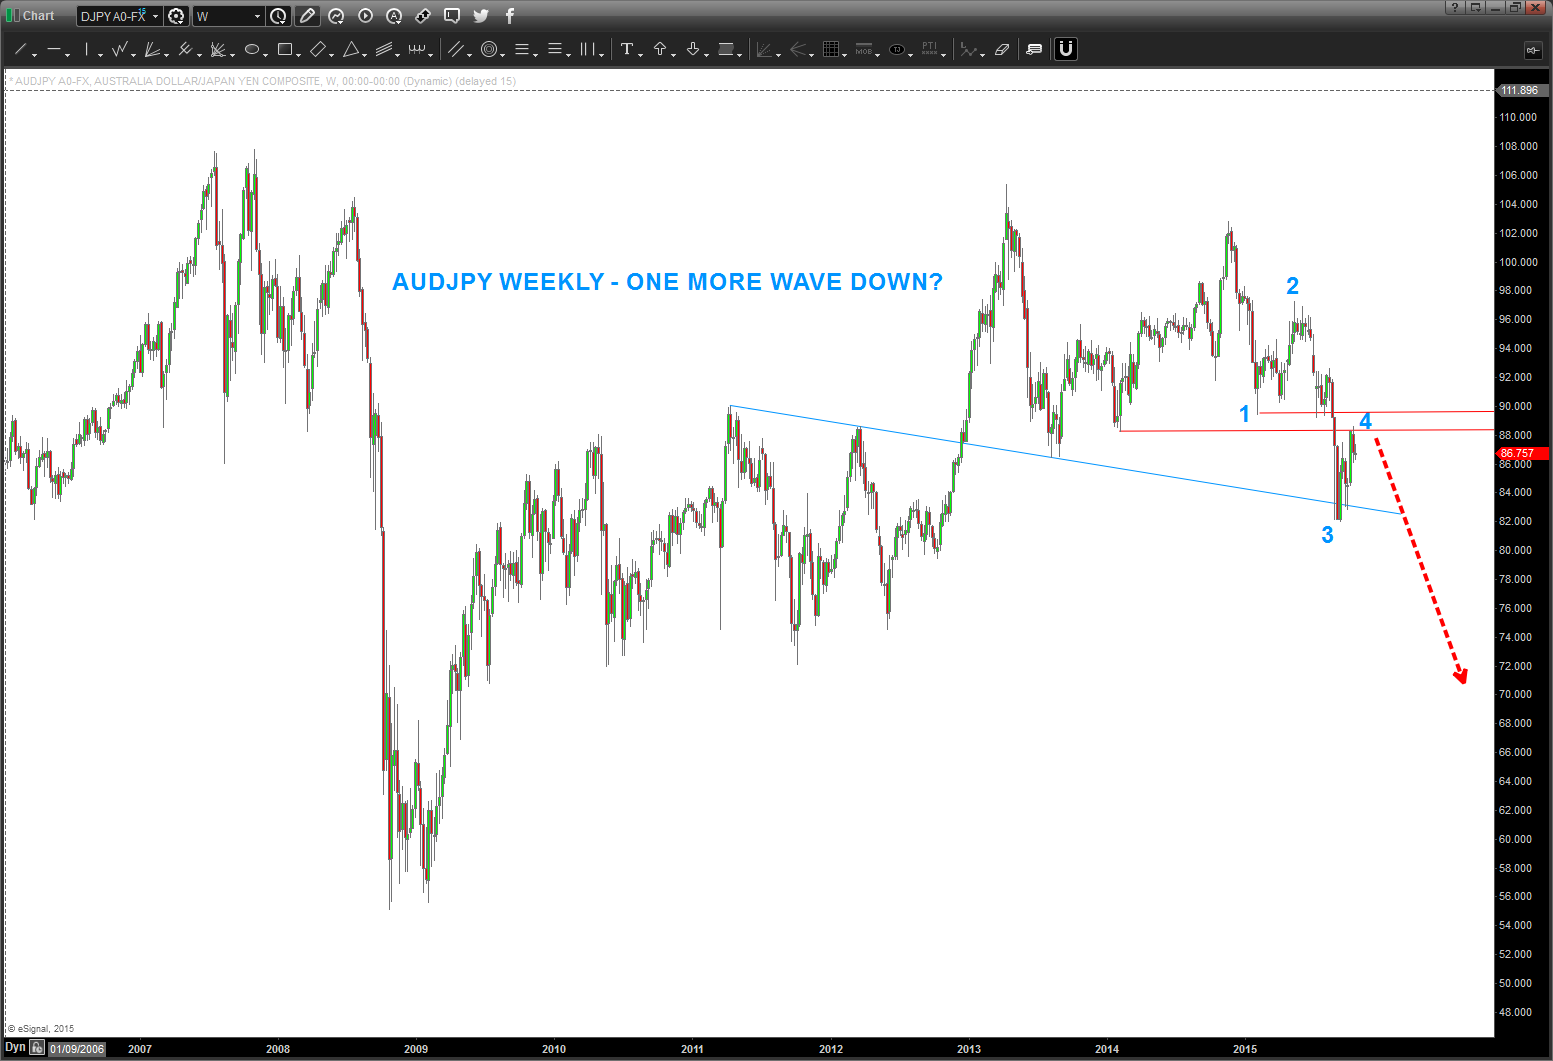
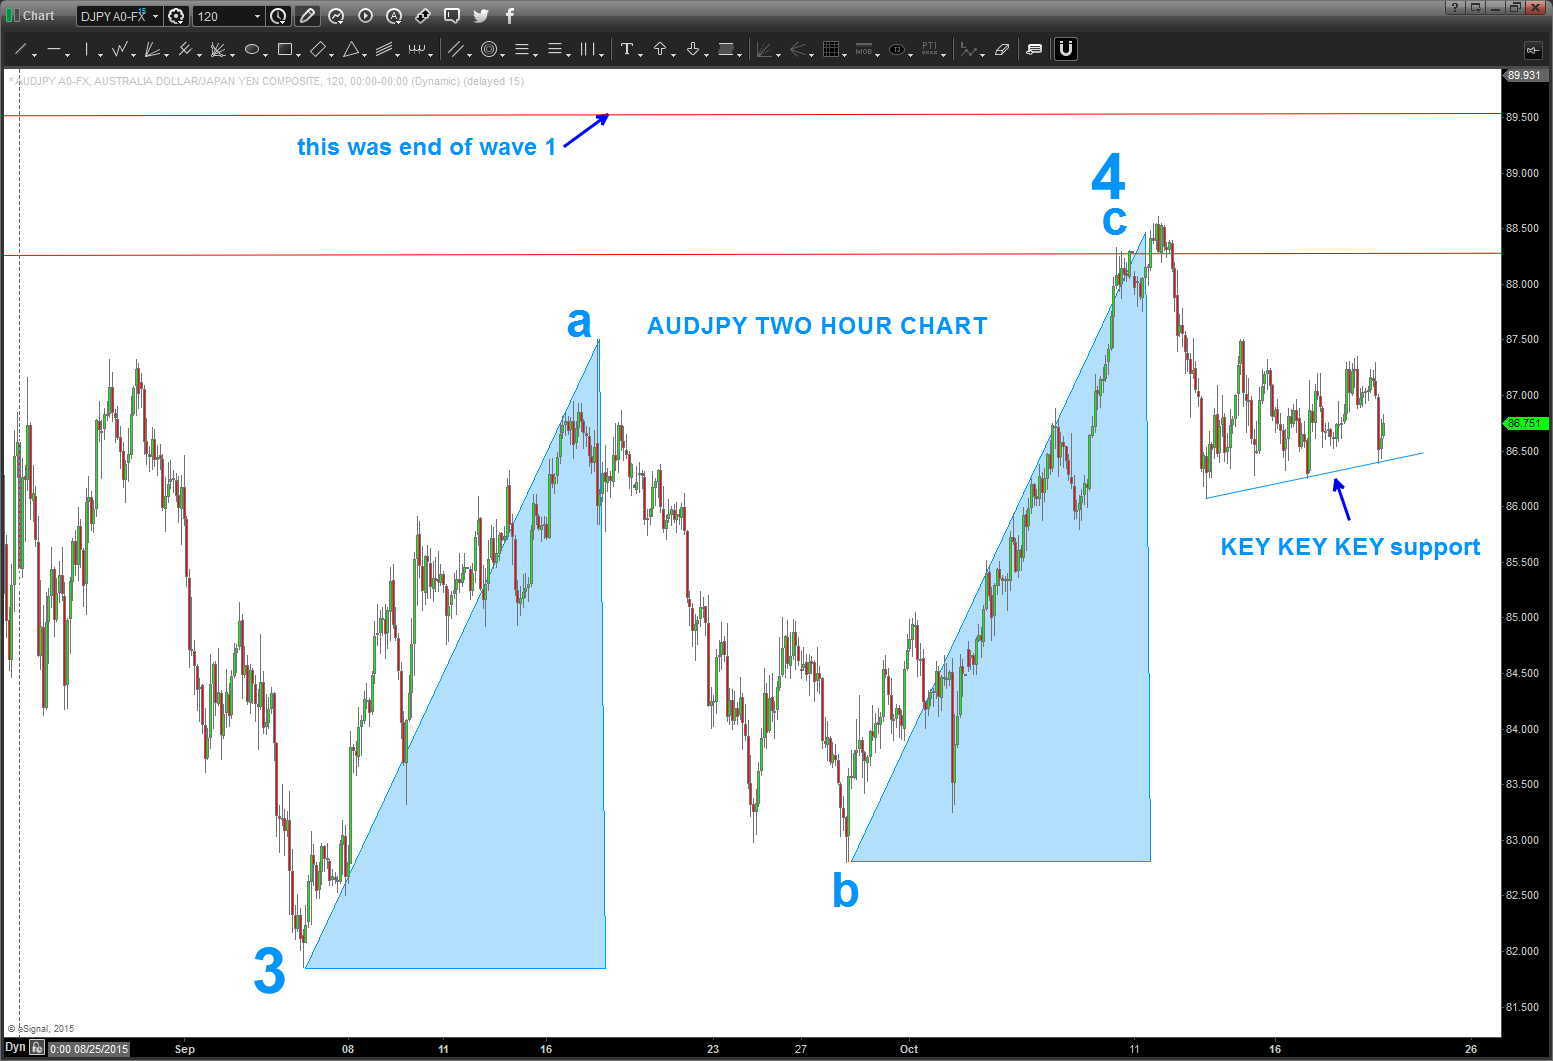
so, here’s the deal … the market corrects in a-b-c fashion. see the chart below – that’s the “alt” count shown. however, it also moves in 5 waves and that the count shown.
there are 3 rules – yes rules – which means don’t break them – for Elliott Wave. The one were are really following is WAVE 4 CAN NOT go past the end of WAVE 1. It’s that simple …
so, in the case of the AUDJPY, we need to stop right here and start back down to finish a 5 wave sequence. ELSE, the a-b-c correction is complete.
so here’s a thesis:
- IF the AUDJPY is to complete a 5 wave sequence down into targeted area THEN it needs to stop in/around here and NOT overlap the end of wave 1.
- this is BEARISH for equities
- IF the AUDJPY is complete w/ an a-b-c correction (the “alt” count shown) THEN it will blow thru the end of the wave labeled 1 and new highs to be seen.
- this is BULLISH for equities
obviously, I have NO IDEA which way this rolls … but I have some clear benchmarks to follow in the coming days and weeks.
does that help?
B
something to note …
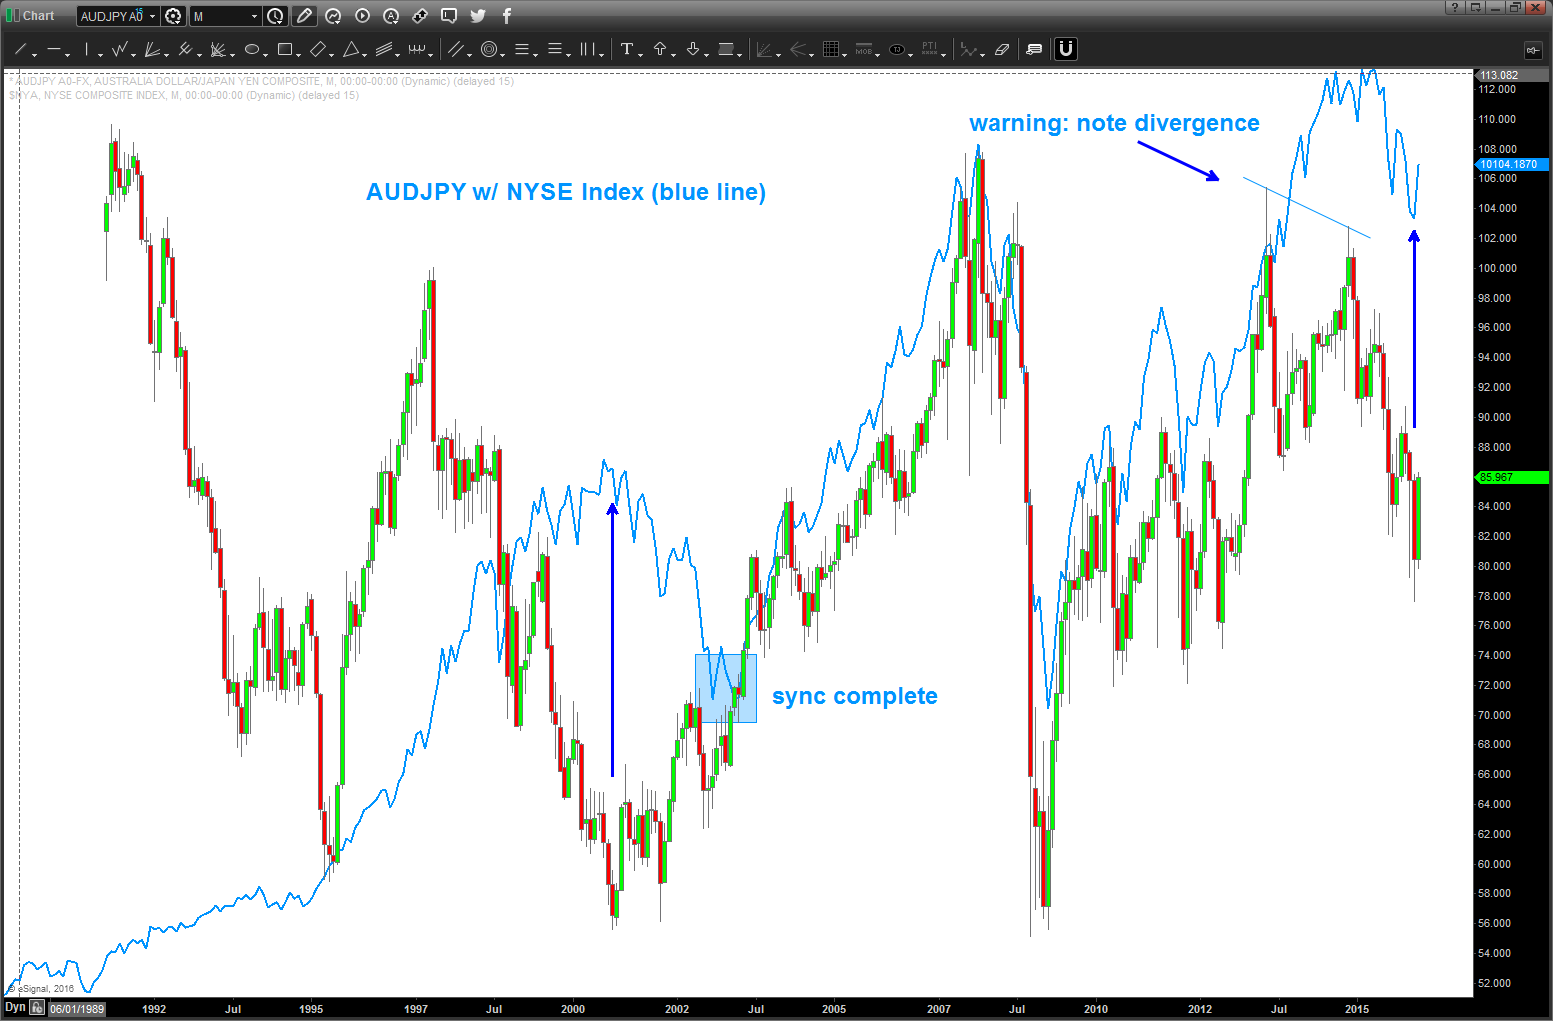
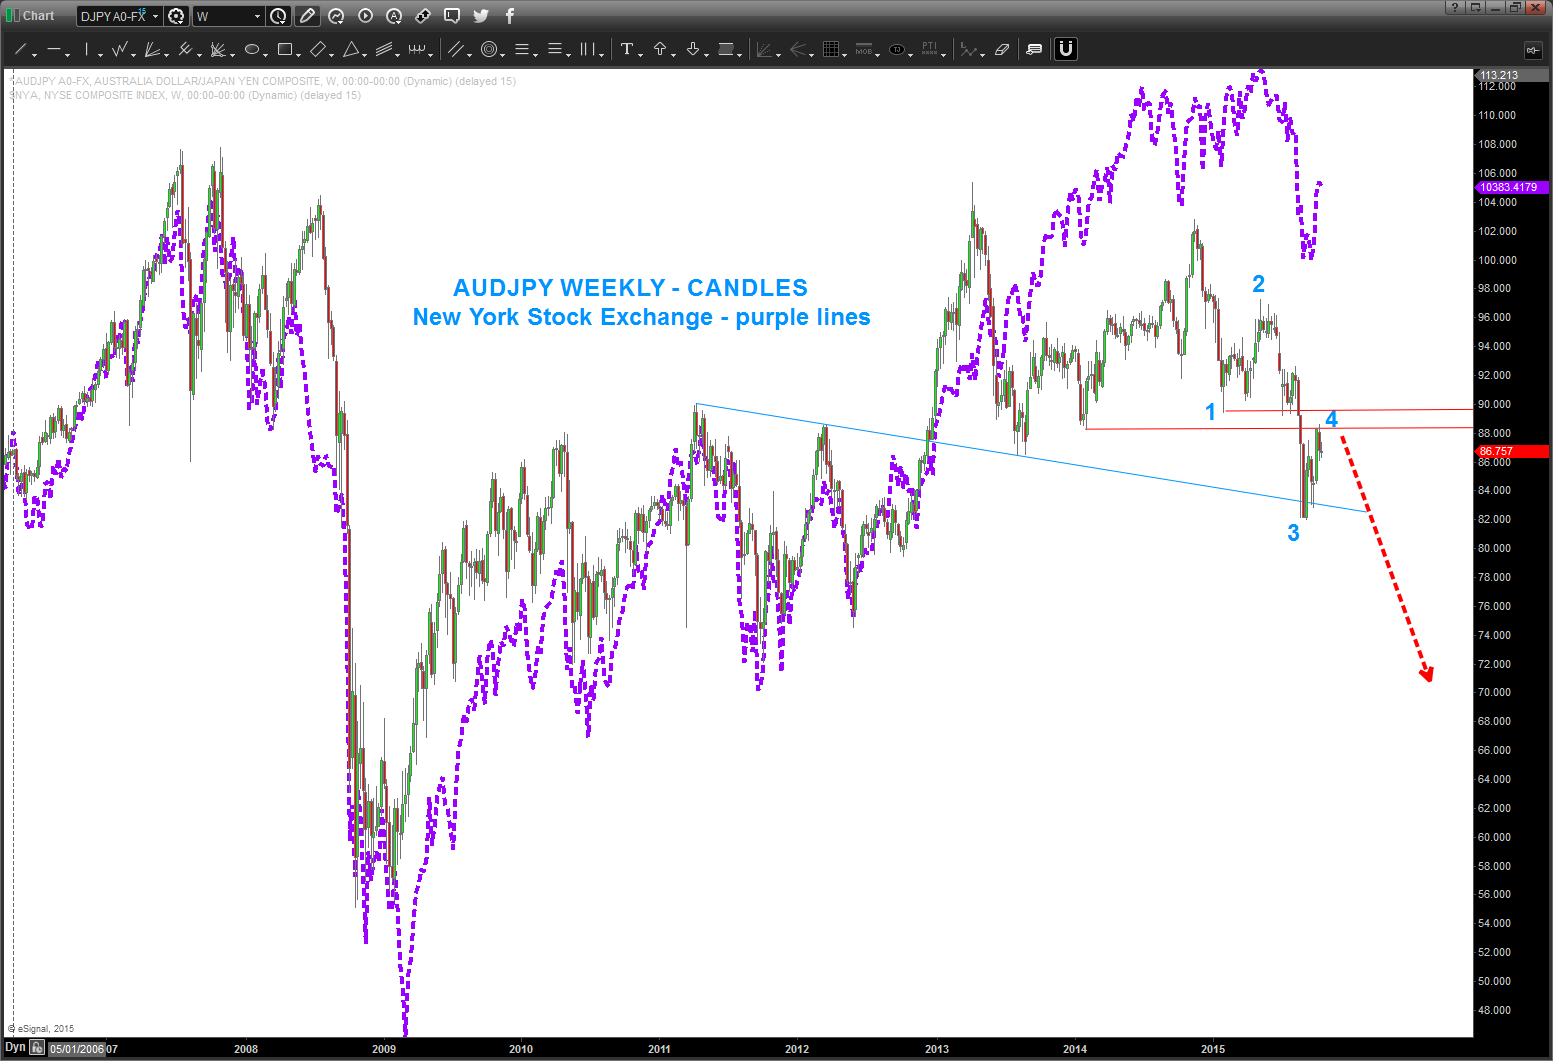
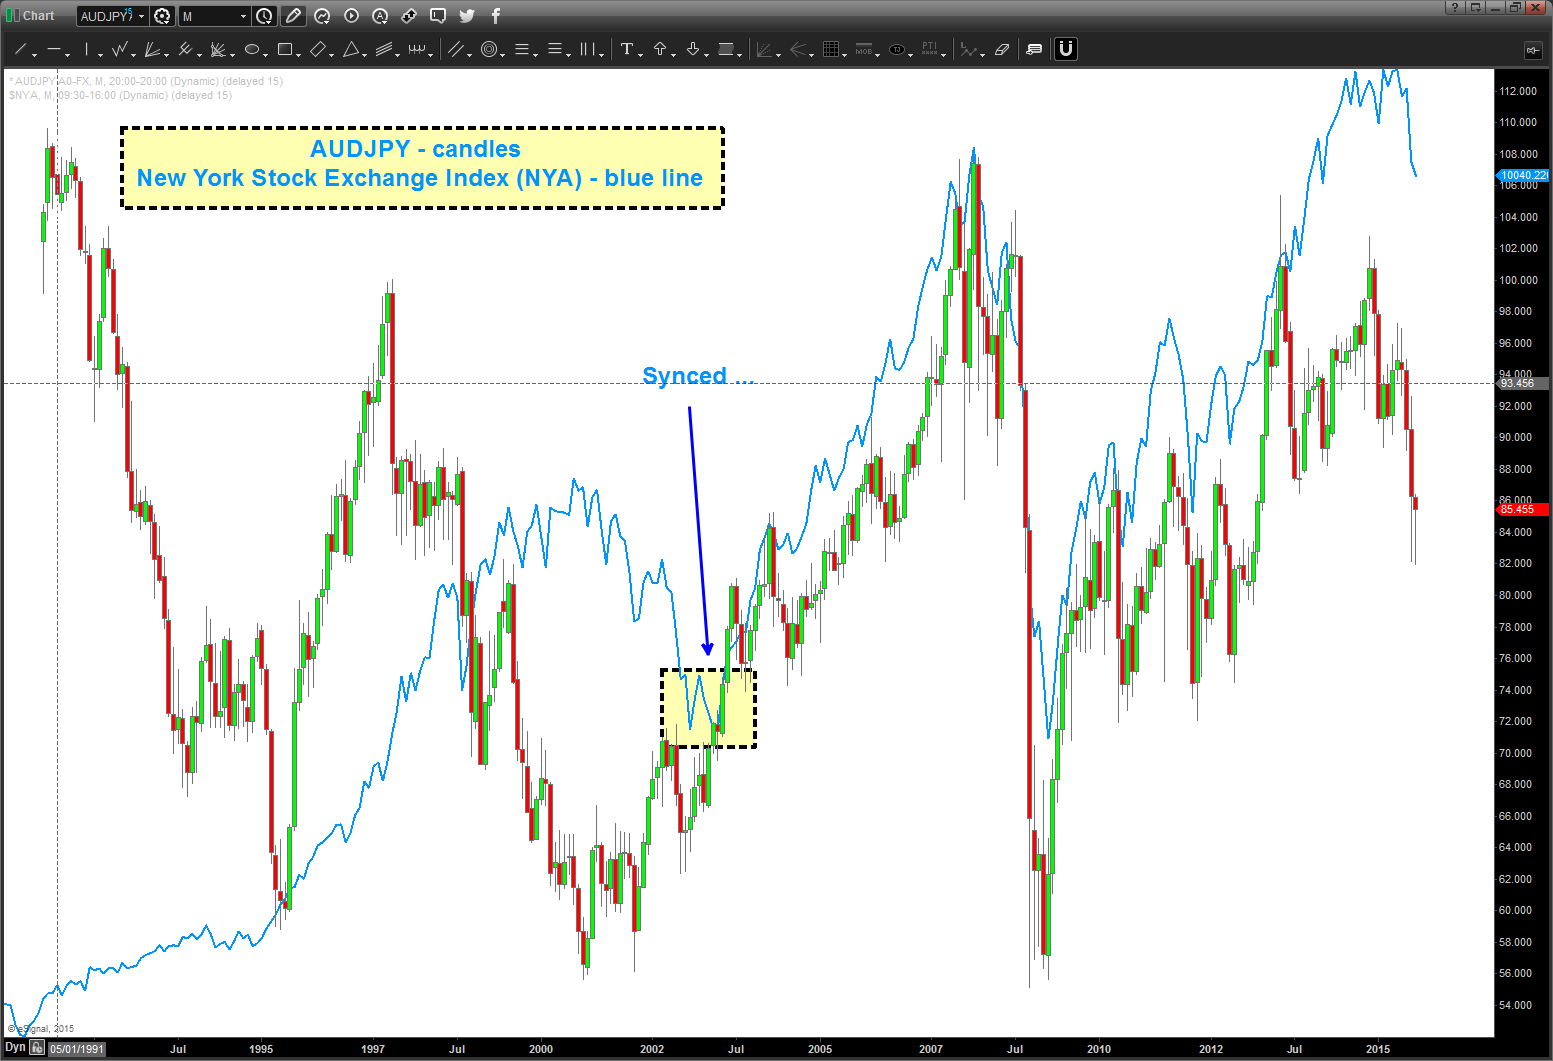
- the HIGH in 2000 was the LOW in the AUDJPY and then a couple years later they synced-perfectly.
- as the NYSE was making new highs, the AUDJPY diverged (and completed the PERFECT PRICE pattern like 2007) and then the NYSE Index dropped …
- the most recent low (remember the XLP/NYA?) timed the NYSE low – perfectly.
so, pay attention to this one ….
B
10/21/2015 – I’ve been asked what I think of the market of late …I’ve answered I have no idea. I see some patterns that suggest YEN strength across multiple currency pairs – and no it isn’t the USD vs JPY. That’s ugly. EURJPY, GBPJPY and my favorite AUDJPY appear they are willing to crack to YEN strength …. they “should” all go which means USD vs JPY which means pressure on equities.
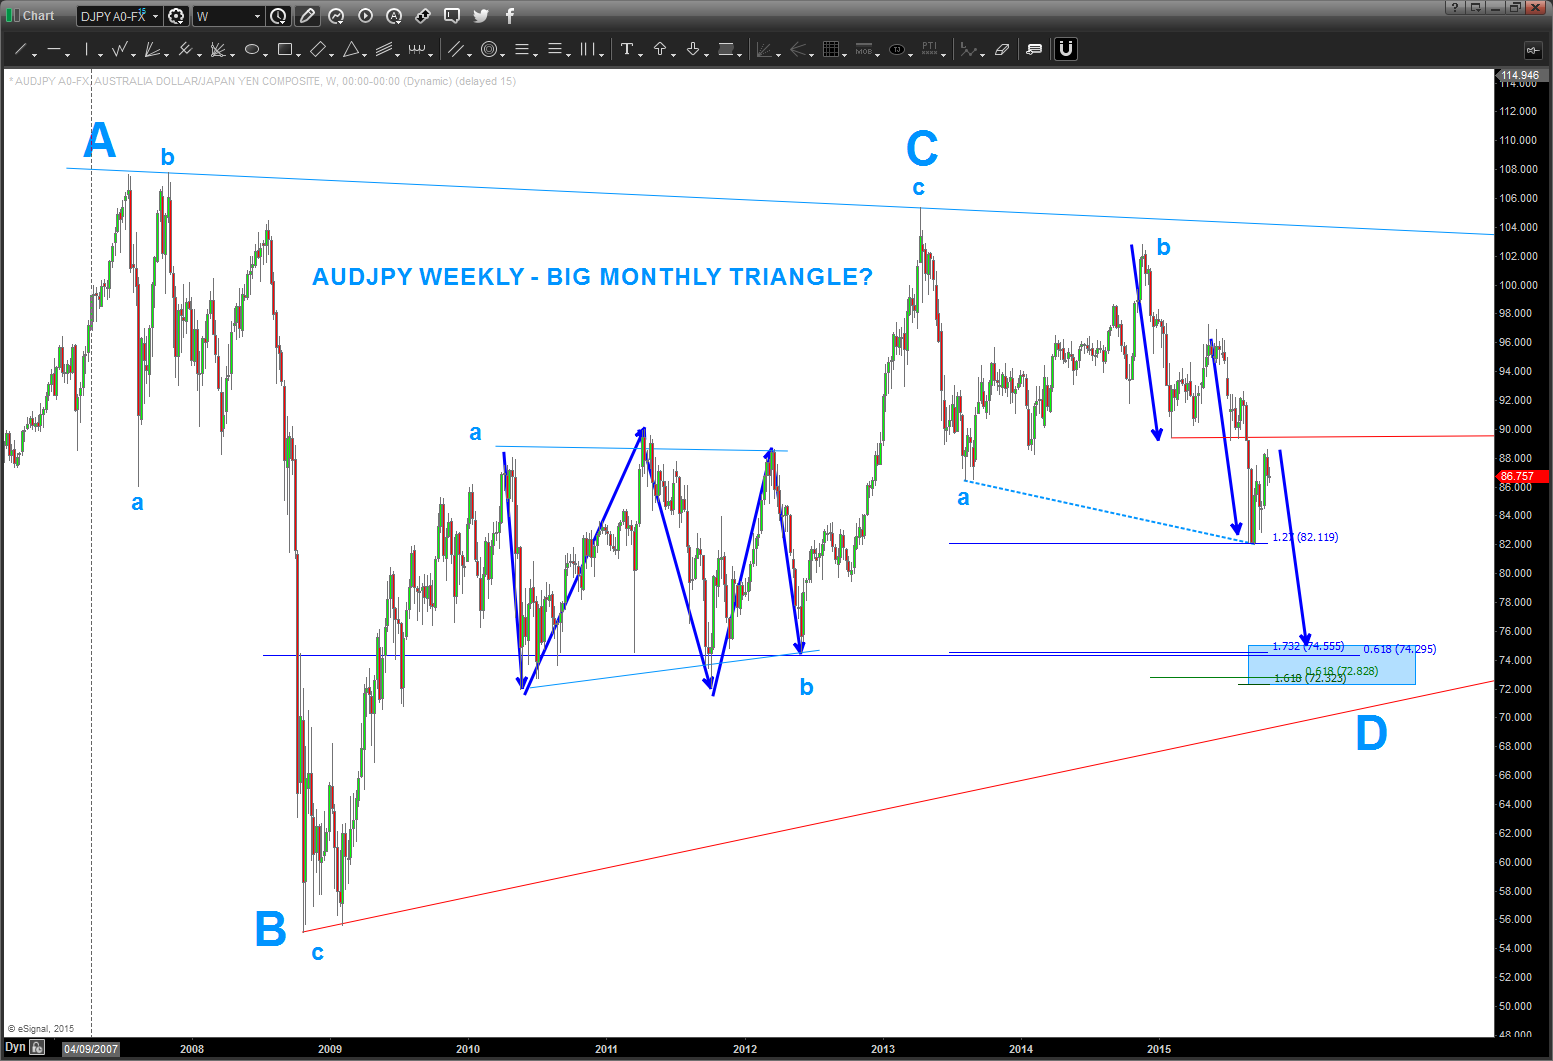
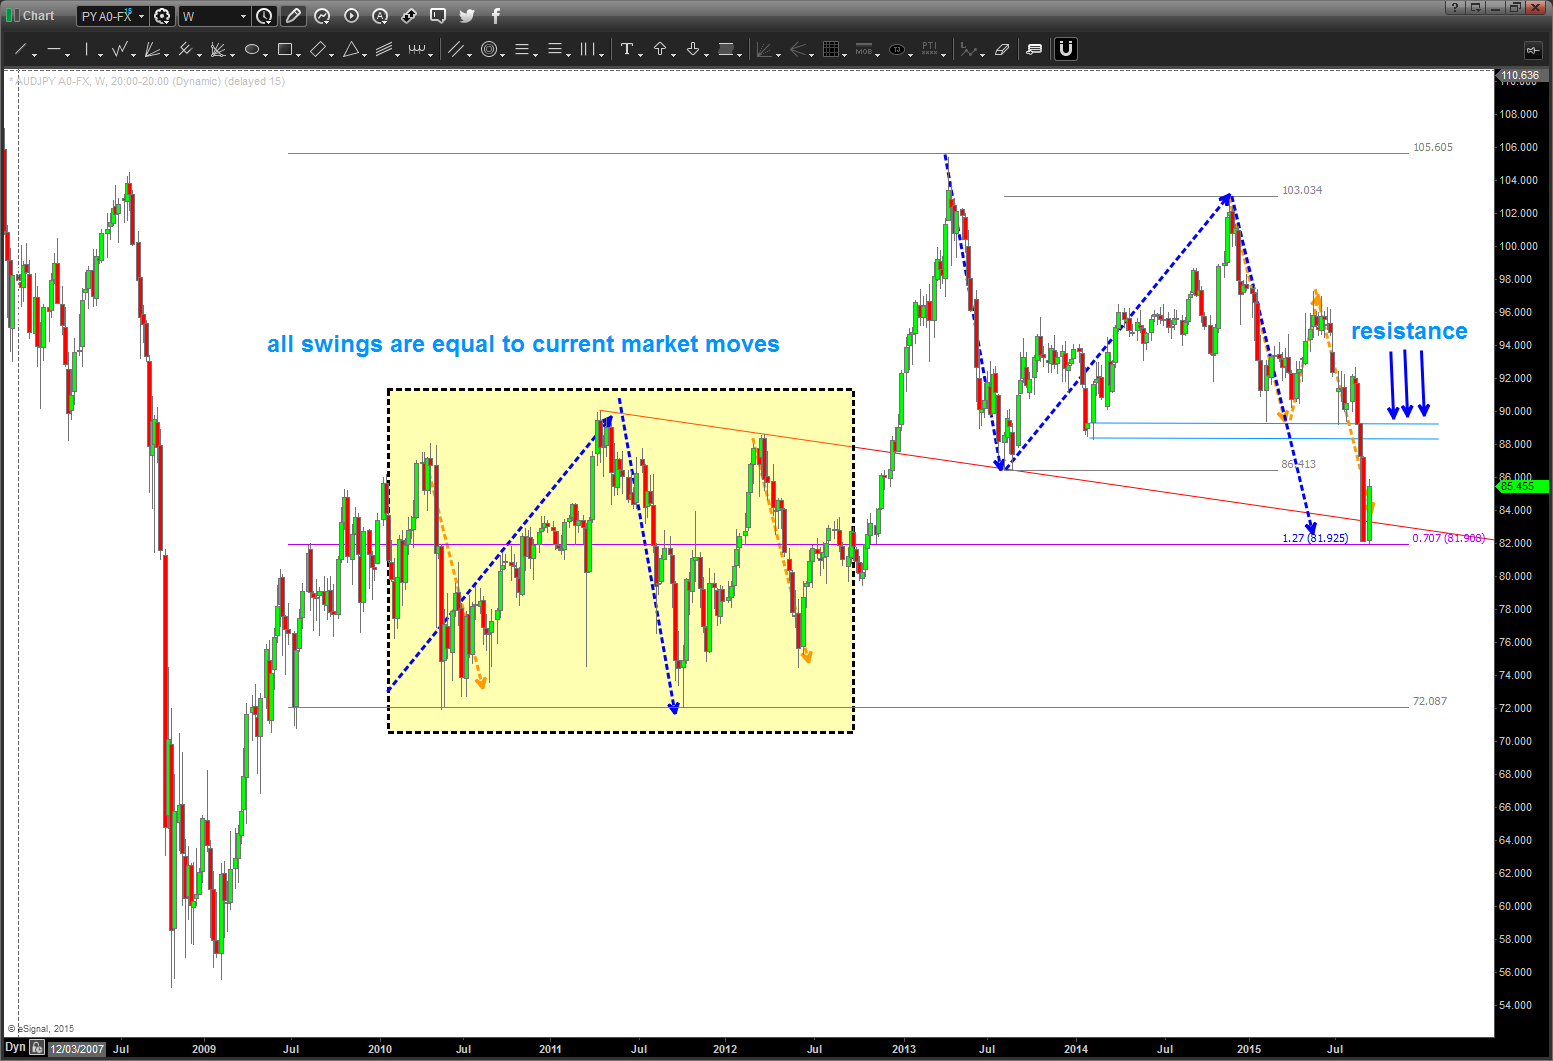
here’s an update to the AUDJPY pattern. Folks, everything about this is so precise and harmonic – it’s one of my favorites. why? simply, I have a greater than 50% chance that the form, proportion and harmony are correct. Sure “looks and feels” that we have completed a daily/weekly wave 4 – almost perfectly in PRICE and TIME and therefore if we break the “KEY KEY SUPPORT” as shown, chances are we are in the beginning stages of 1000+ pip move. If your a currency trader – be ready to rumble.
- NOTE THE CORRELATION BETWEEN THE AUDJPY AND NEW YORK STOCK EXCHANGE INDEX ($NYA)
Thanks for reading and let me know if you have any questions.
ROCK ON, OK?
BART
folks, this is not a “I told you so” blog or any of that because I have no idea what’s going to happen from one minute to the next in the market. just look for patterns and then “IF-THEN” the resulting move if the pattern works or doesn’t to manage risk … seriously.
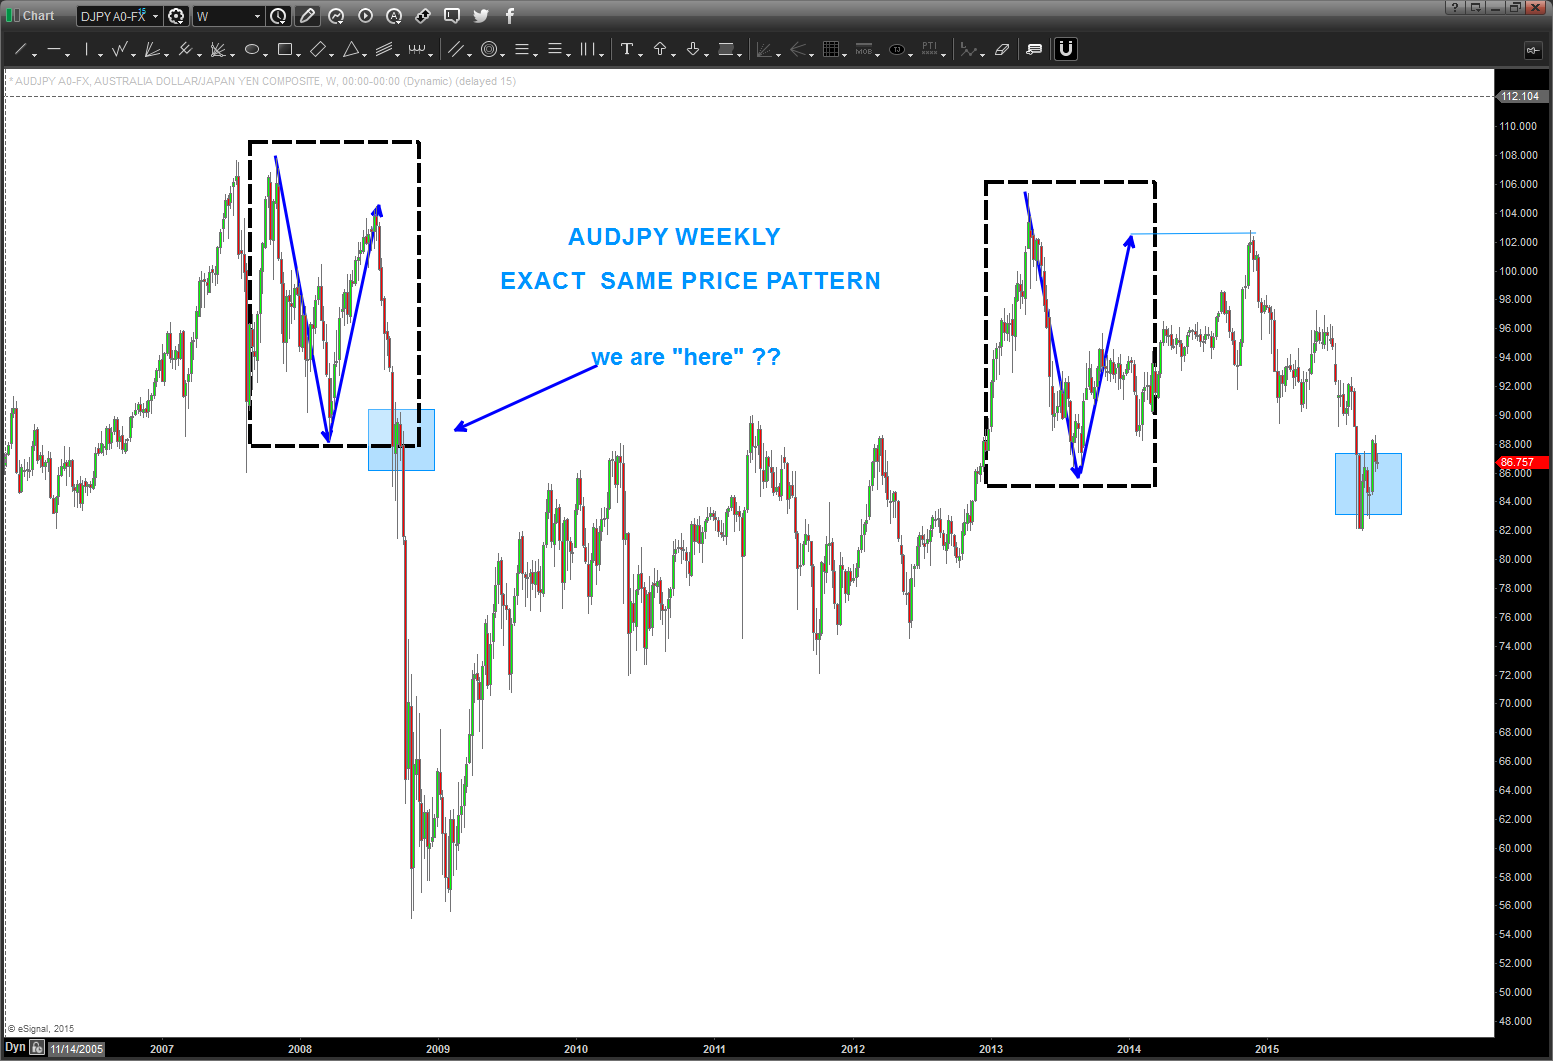
but I did want to spend just a little bit of time on the PATTERN that appeared on the AUDJPY back in November 2014. Yes, almost a year ago.
first off – here’s the foot stomp – GO BACK AND LOOK AT LONG TERM CHARTS and, obtw, take all of the indicators and oscillators and all that other useless garbage off the chart and look for PATTERNS and MEASURED MOVES. Once you find them, then throw all the indicators you want onto the chart … it’s like using steak sauce on a perfectly grilled steak.
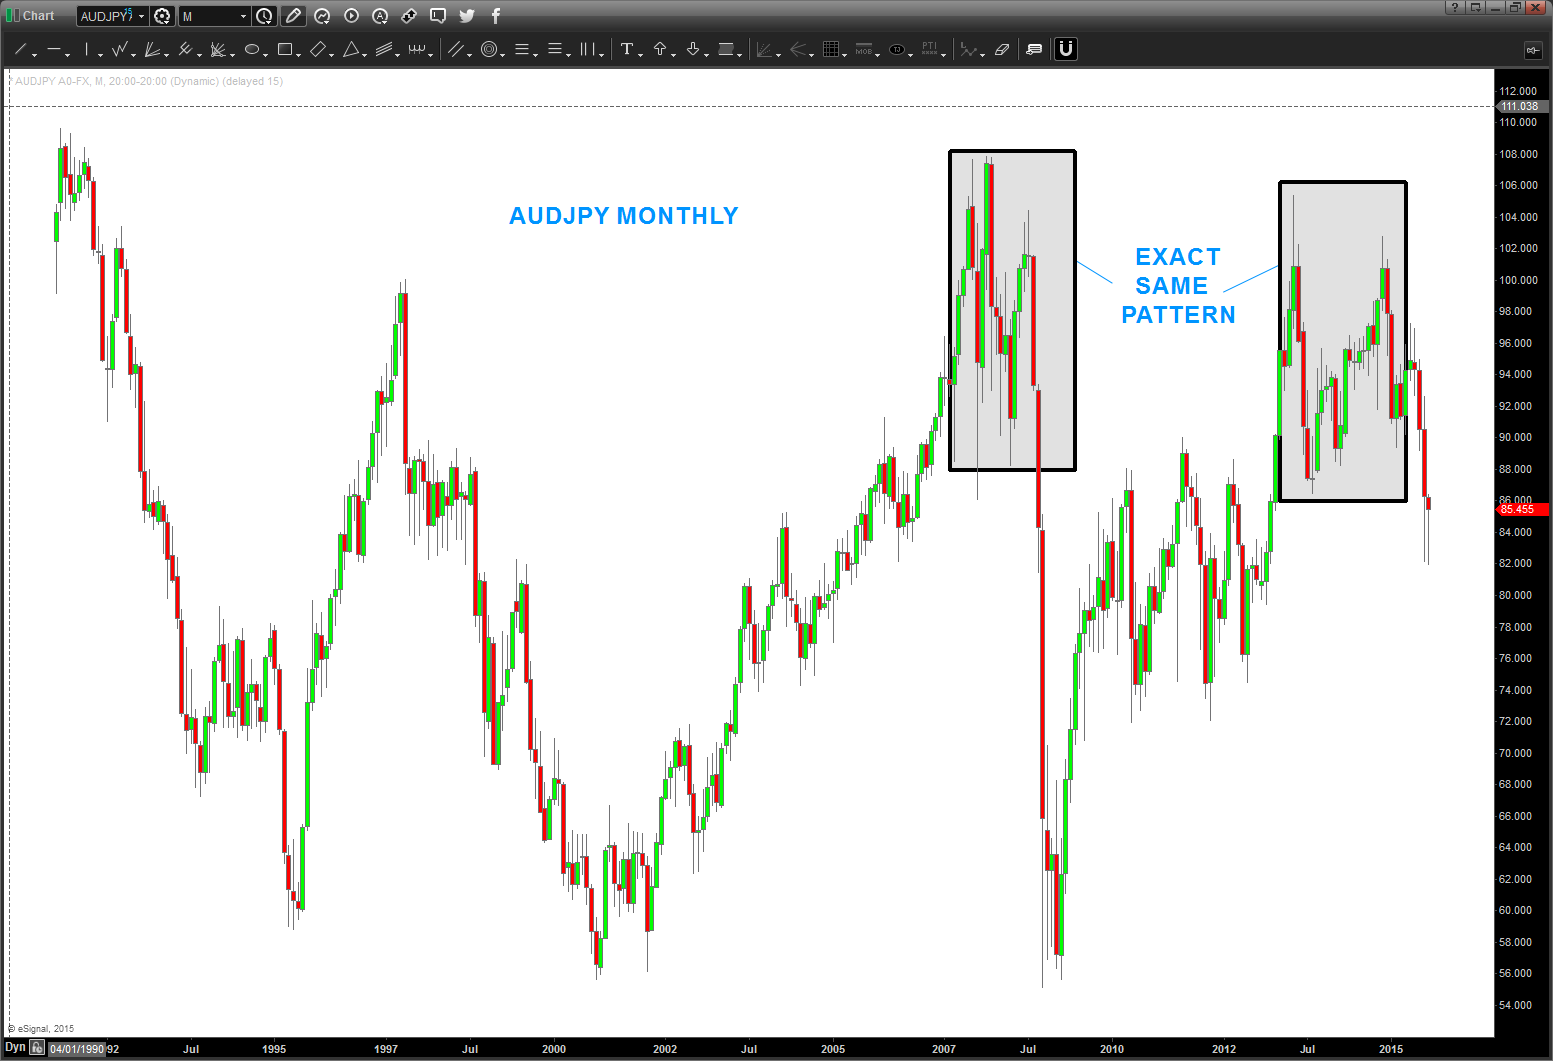
anyway – look at the PERFECT repeat of the pattern in 2007-2008 on the AUDJPY:
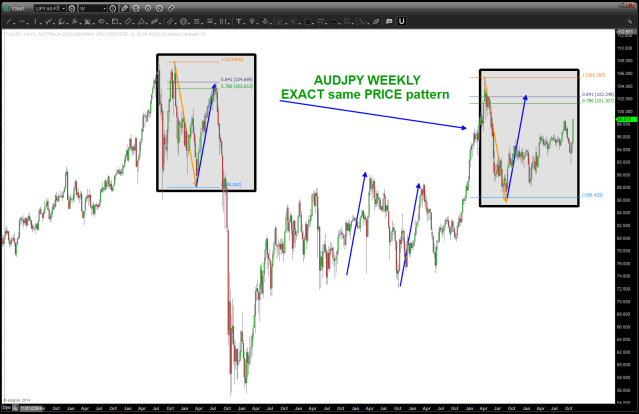
here’s the result:
Why is this important to the US Equity Market? Here’s a chart showing the $NYA overlaid on the AUDJPY. Note the close correlation that occurred in the early 2000’s. Since then it’s been highly correlated.
So, is the “correction” in the AUDJPY and the EQUITY markets over? Using Fundamentals (which I don’t) I can tell you I don’t have a clue. However, we do have a PATTERN that is crucial to the overall direction of the equity markets.
so here we go …
IF the AUDJPY can stay above the crucial 81.90 level THEN equity markets should rally.
IF AUDJPY loses this level (81.90) THEN equity markets will continue to slide lower.
NOTE: the yellow boxed area contains ALL of the current AUDJPY moves. It’s also a region of 4 years of resistance. Note, the red trend line coming from the Jul 2011 top into current market price. We spiked thru it but are still above it – watch that closely.
thanks for reading and let me know if you have any questions.
rock on, ok?
B
the Dollar Index as of March 13, 2016
Posted on March 13, 2016 Leave a Comment
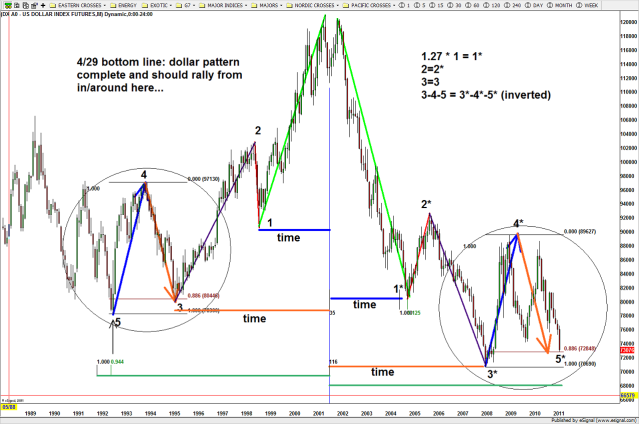
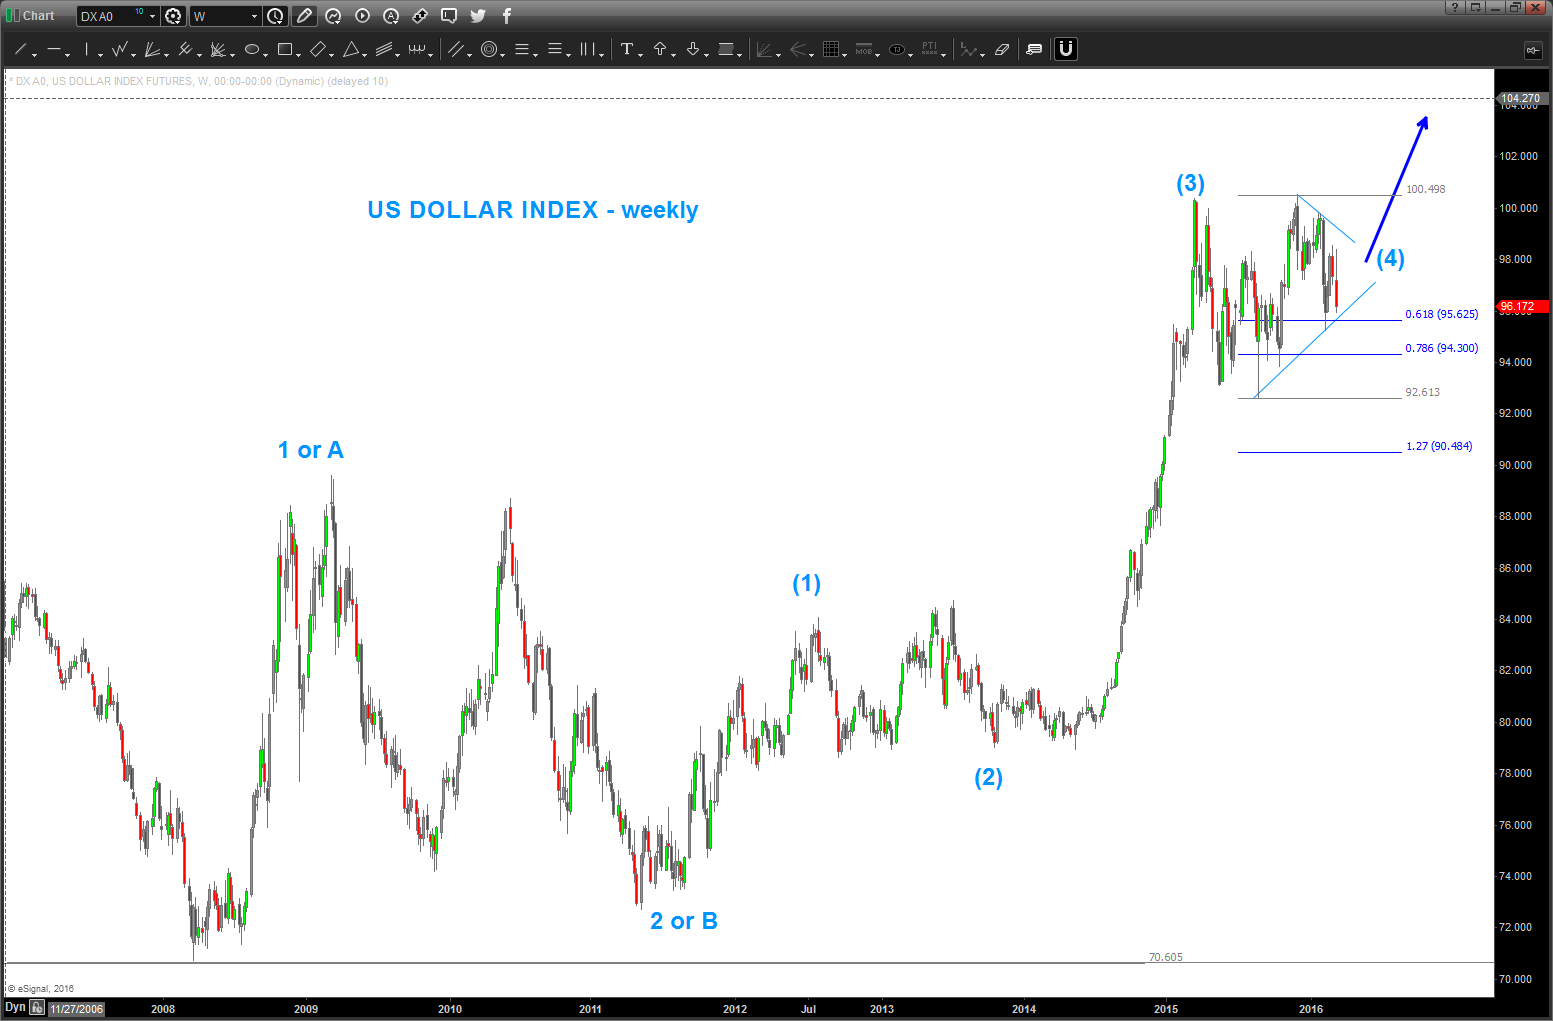
here’s the near perfect pattern that began this monster advance in the dollar:
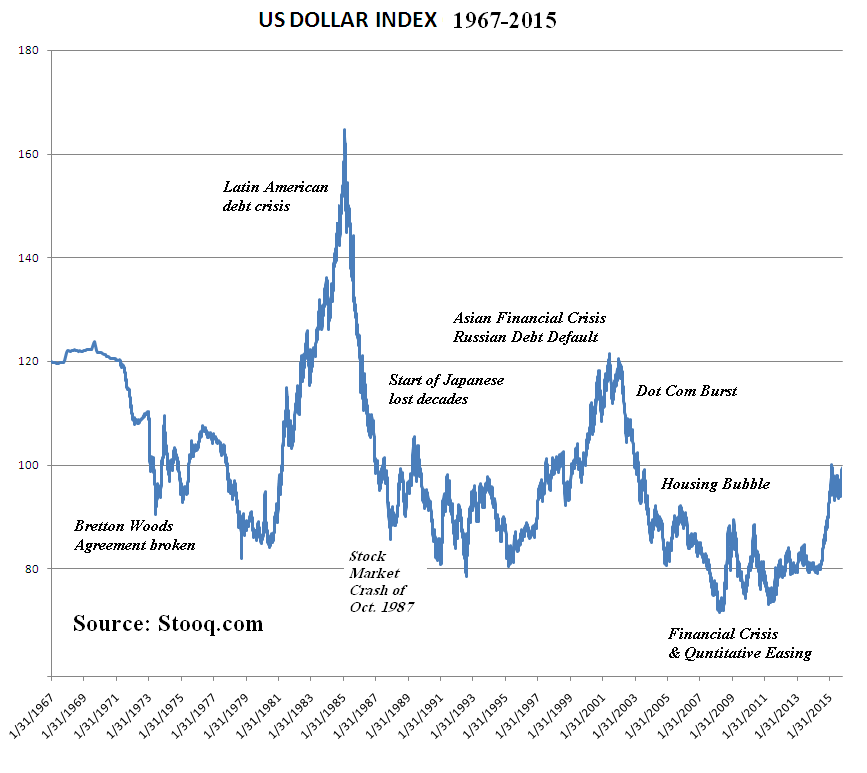
additionally here is a very long term chart of the USD Index:
I put my own levels on it below …
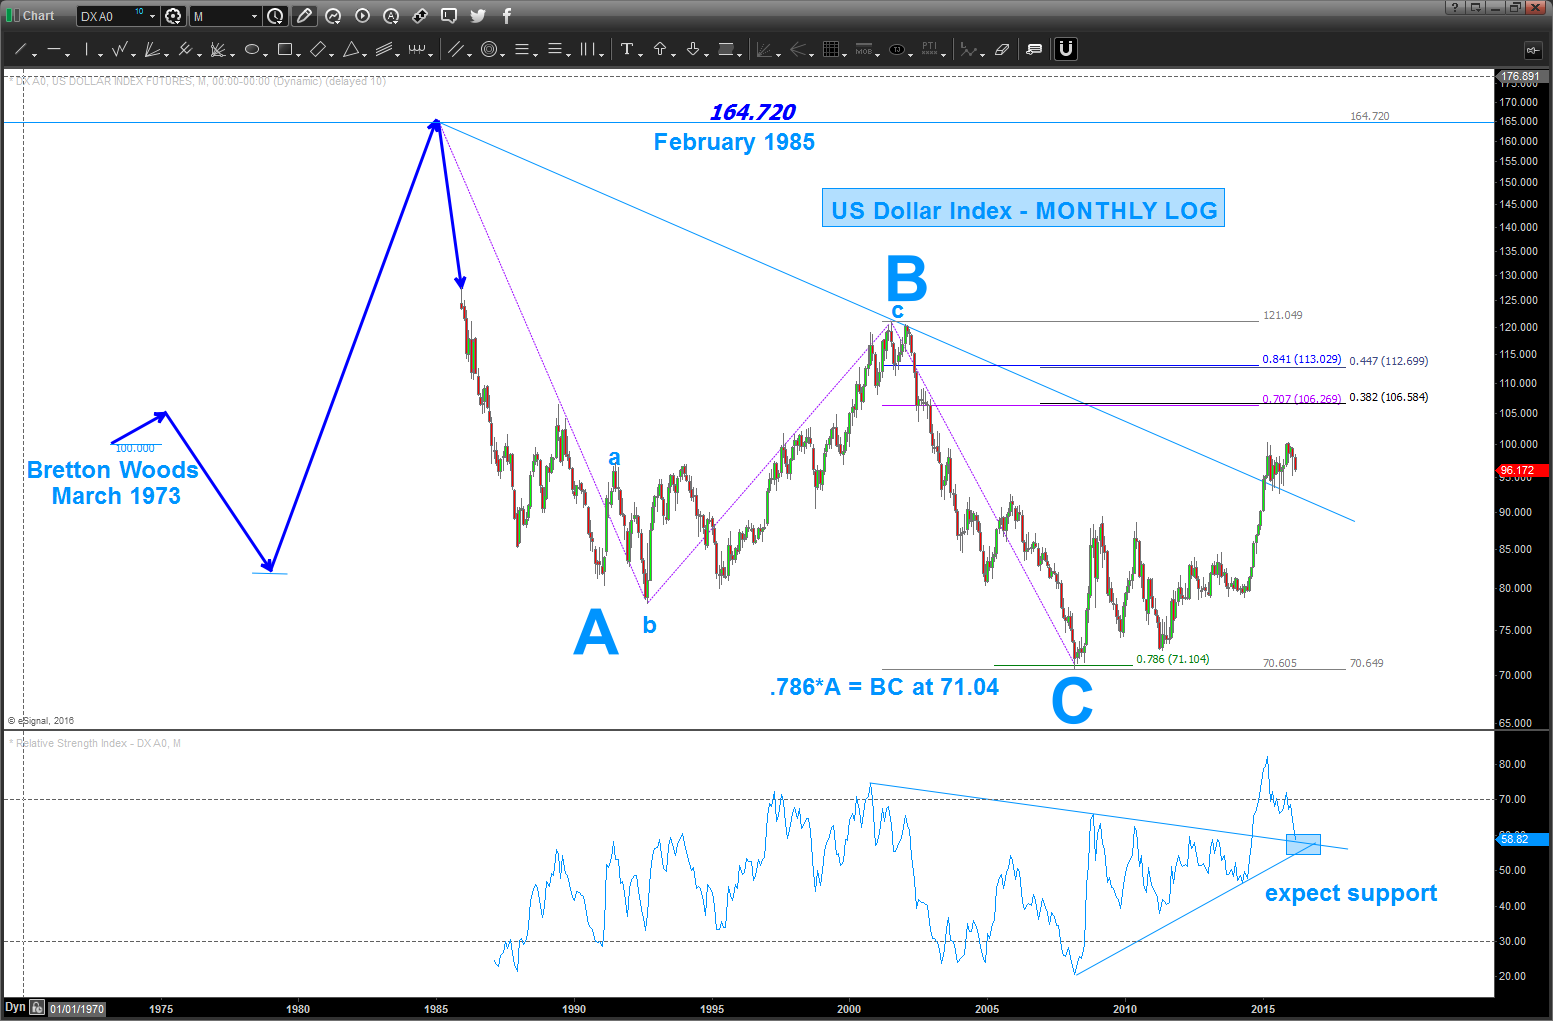
some things to note:
- even in the midst of this monster rally – we still haven’t hit a .382 retracement from the all time high
- the low was – almost exactly a .786 price projection
- note the RSI – we blew thru the old resistance and note how the “log” trendline that acted as resistance was most recently support.
- also, note the trend line connecting the highs on the RSI … believe we should/will find support in/around here and the Dollar should start a new move.
here’s where I think we are …
this one is tough … we have the ECB last week and now the FED upcoming. Believe we will see the move occur next week. It’s almost a year since the high was made in 15.
EURO … is the fat lady singing or not?
Posted on March 12, 2016 Leave a Comment
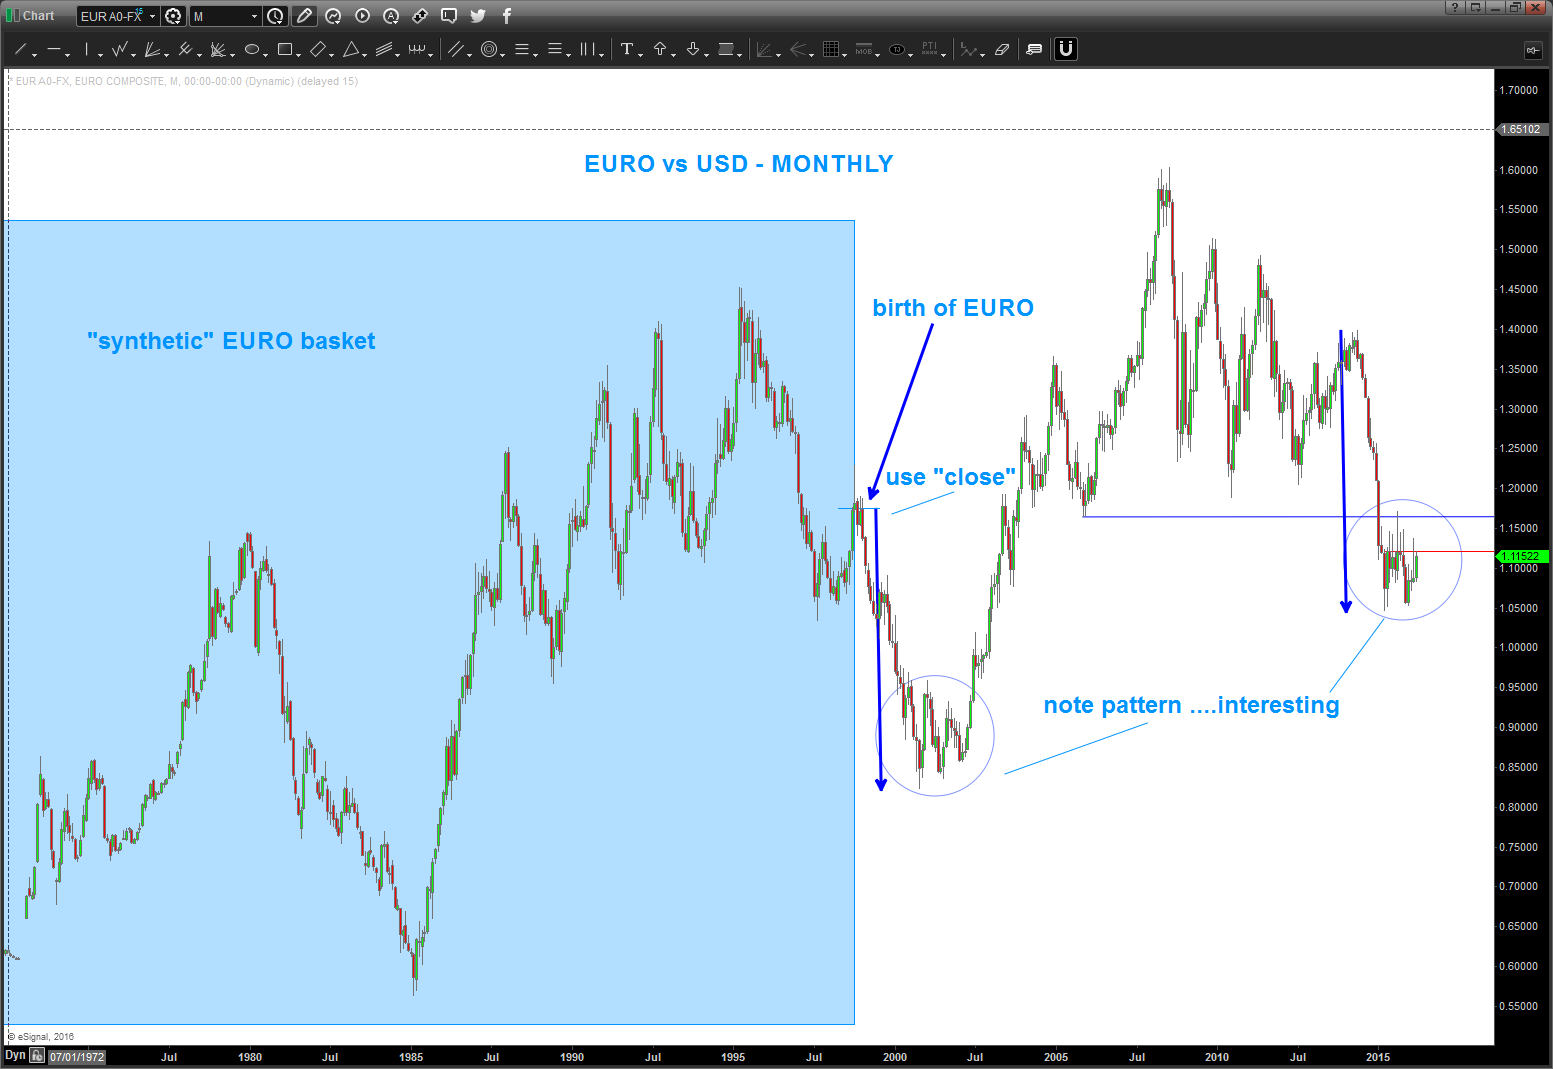
Look at this very very BULLISH PATTERN for the EURO:
- note the move down into the low of 2000-2001. If we use the “close” during the birth month of the EURO then we have completed the same move – exactly.
- also, note, see the triangle like pattern that is emerging?
- I know, sounds crazy, but just calling them like I see em’
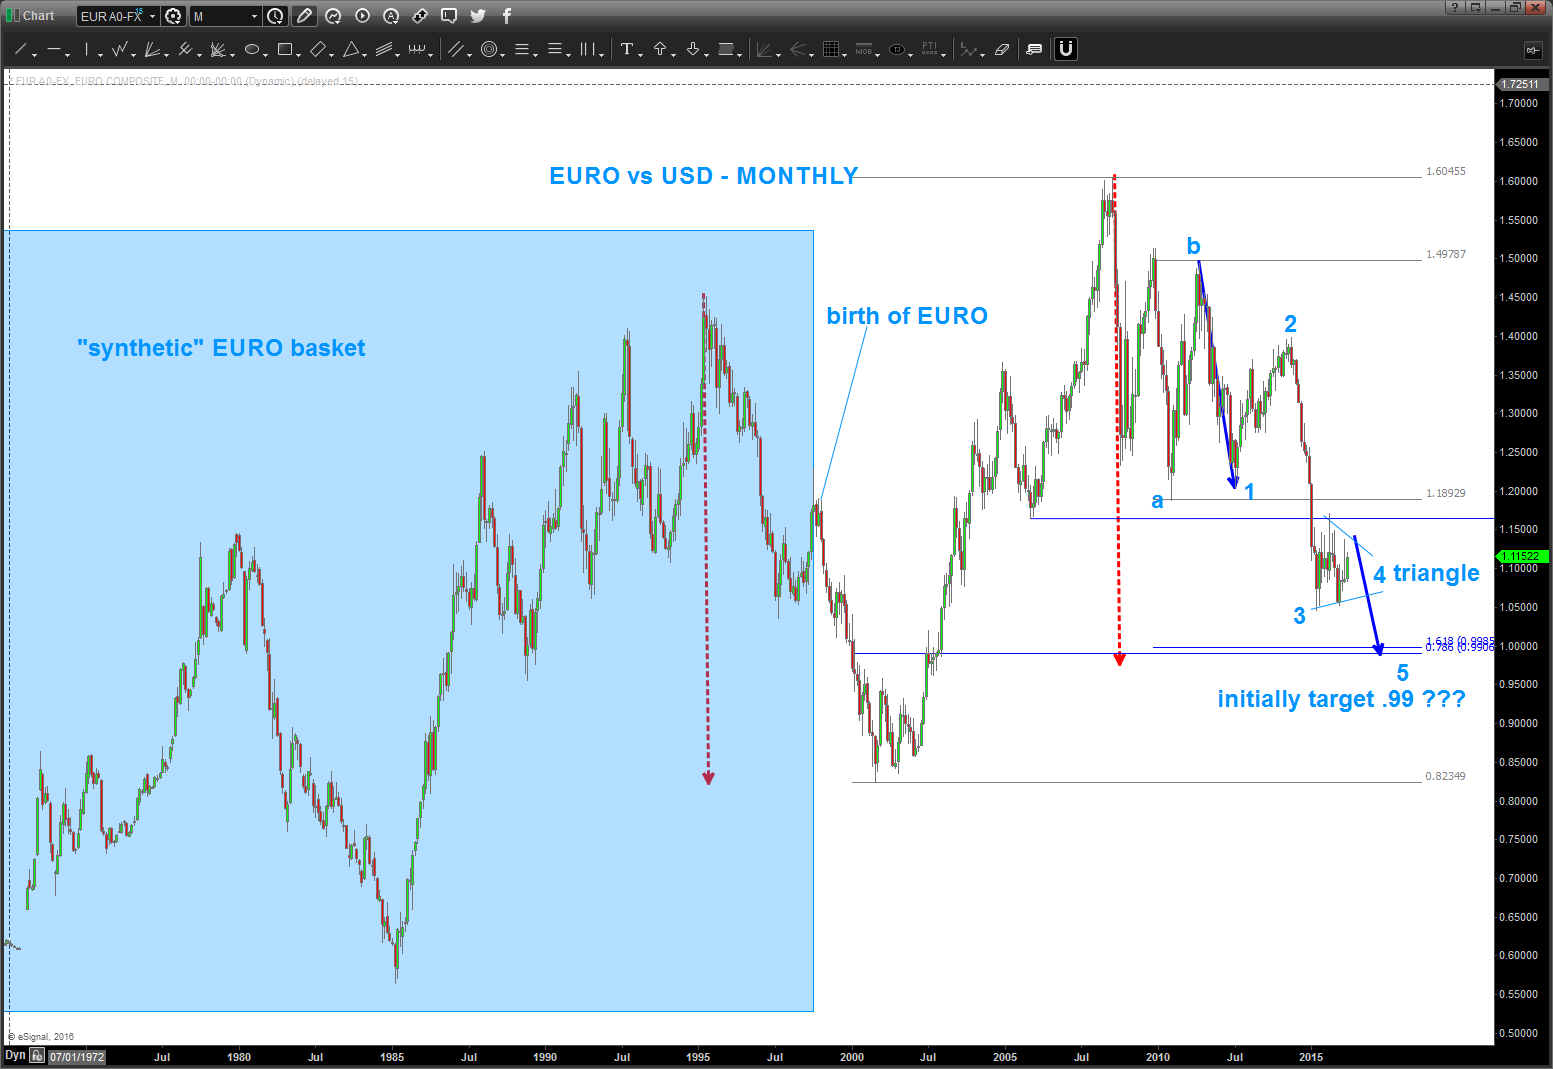
If the fat lady is singing .. i.e. the Euro is about to go night night then I think it’s working this count.
NOTE WE HAVE NEVER HAD A MONTHLY OPEN/CLOSE ABOVE 1.122. THAT IS THE LEVEL TO WATCH (SEE BELOW)

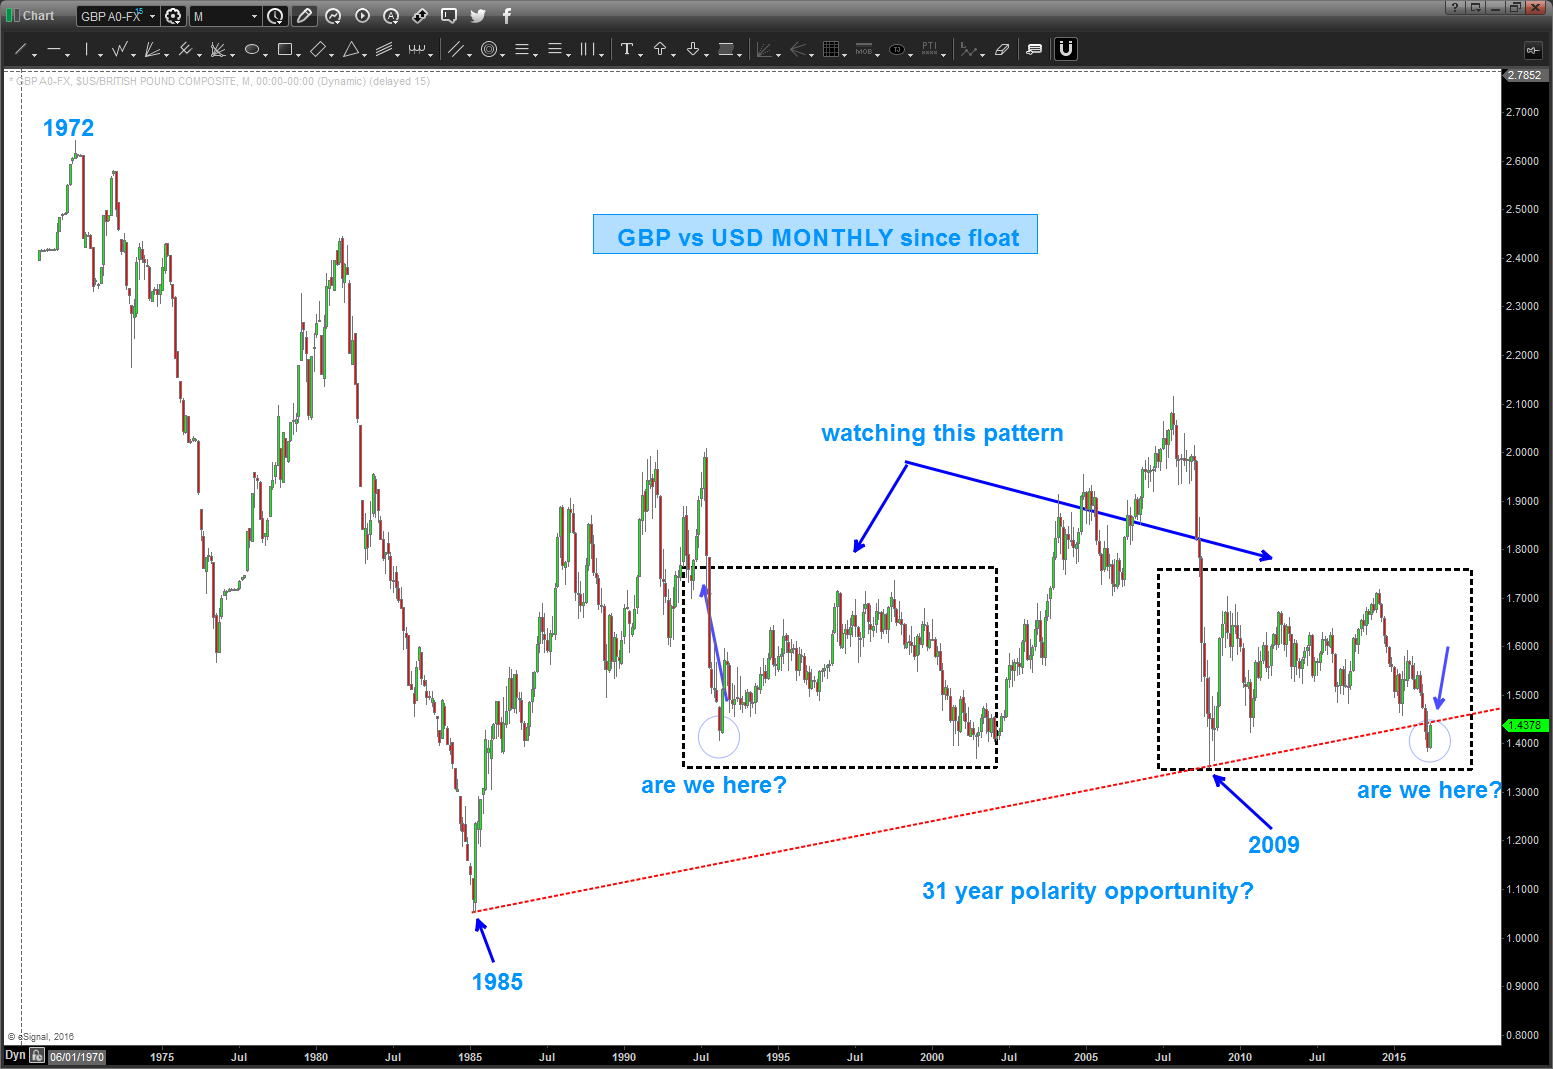
31 year polarity principle about to be tested …
Posted on March 12, 2016 Leave a Comment
support becomes resistance / resistance becomes support: polarity
31 year polarity principle about to be tested on the USD vs POUND.
USD vs LOONIE – critical juncture
Posted on March 11, 2016 Leave a Comment
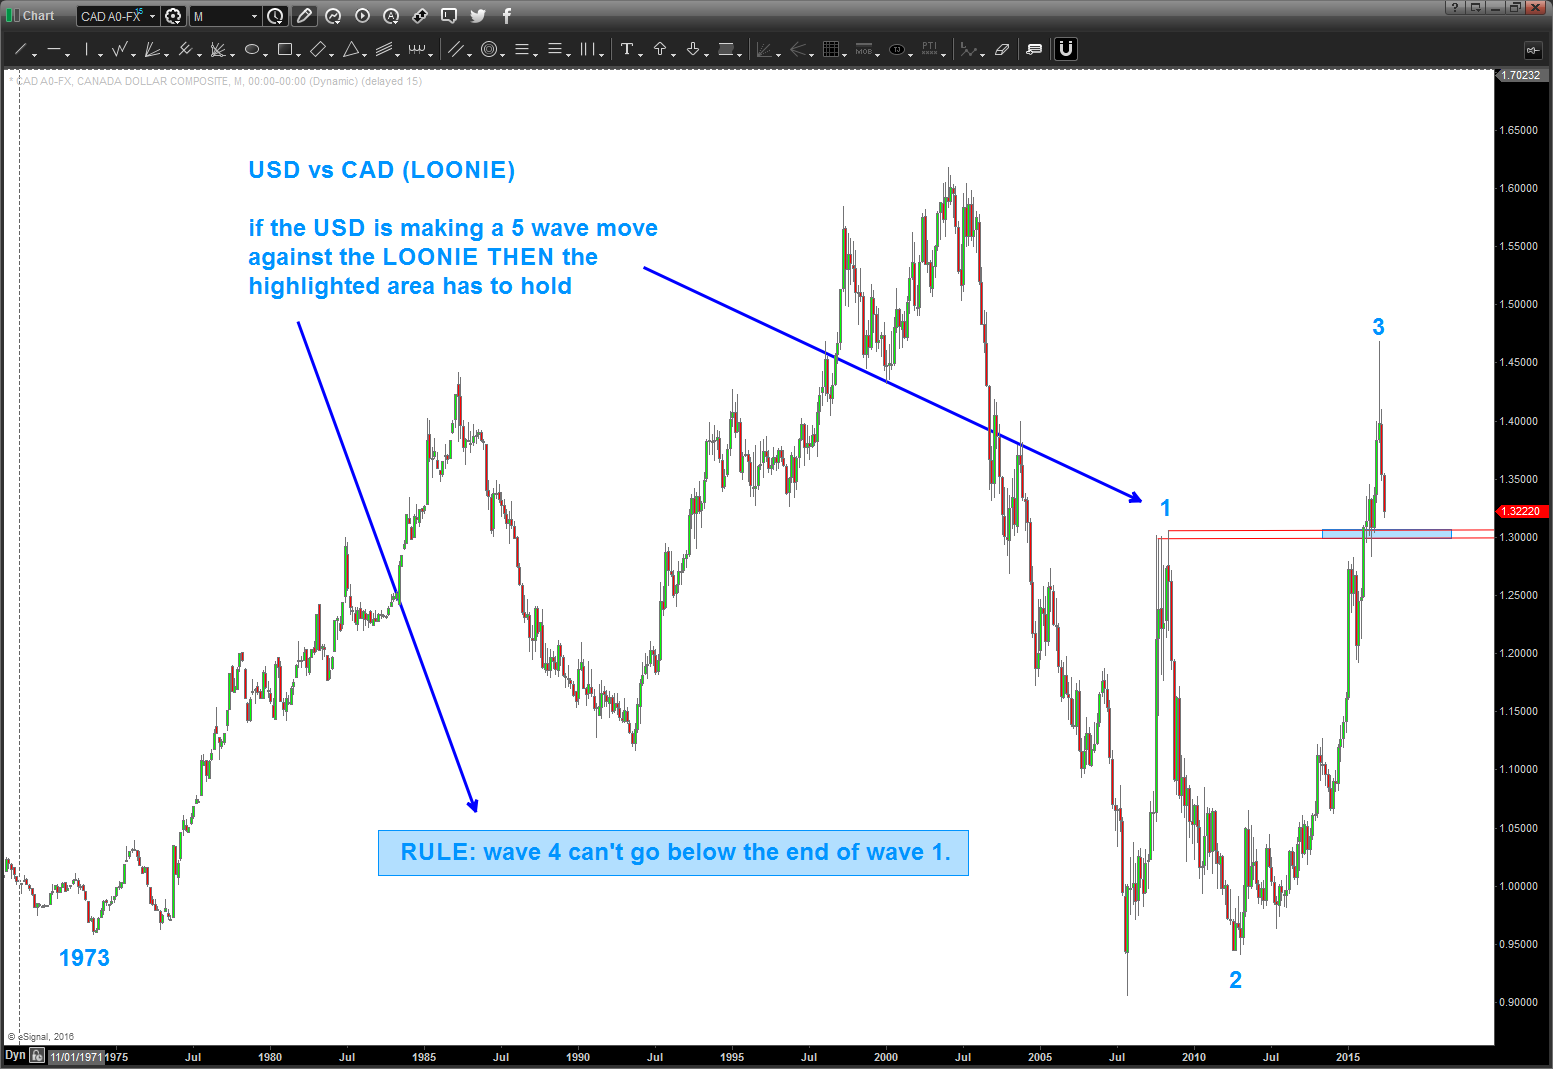
I’m going to keep this post easy and just show the potential for a 5 wave count in the USD vs LOONIE. I’m not showing anything else to just make it “easy” so to speak.
Here’s the deal – note the highlighted rule in the chart above. IF we are doing 5 waves in the USD vs LOONIE then the highlighted levels needs to hold. It’s that simple.
Bart
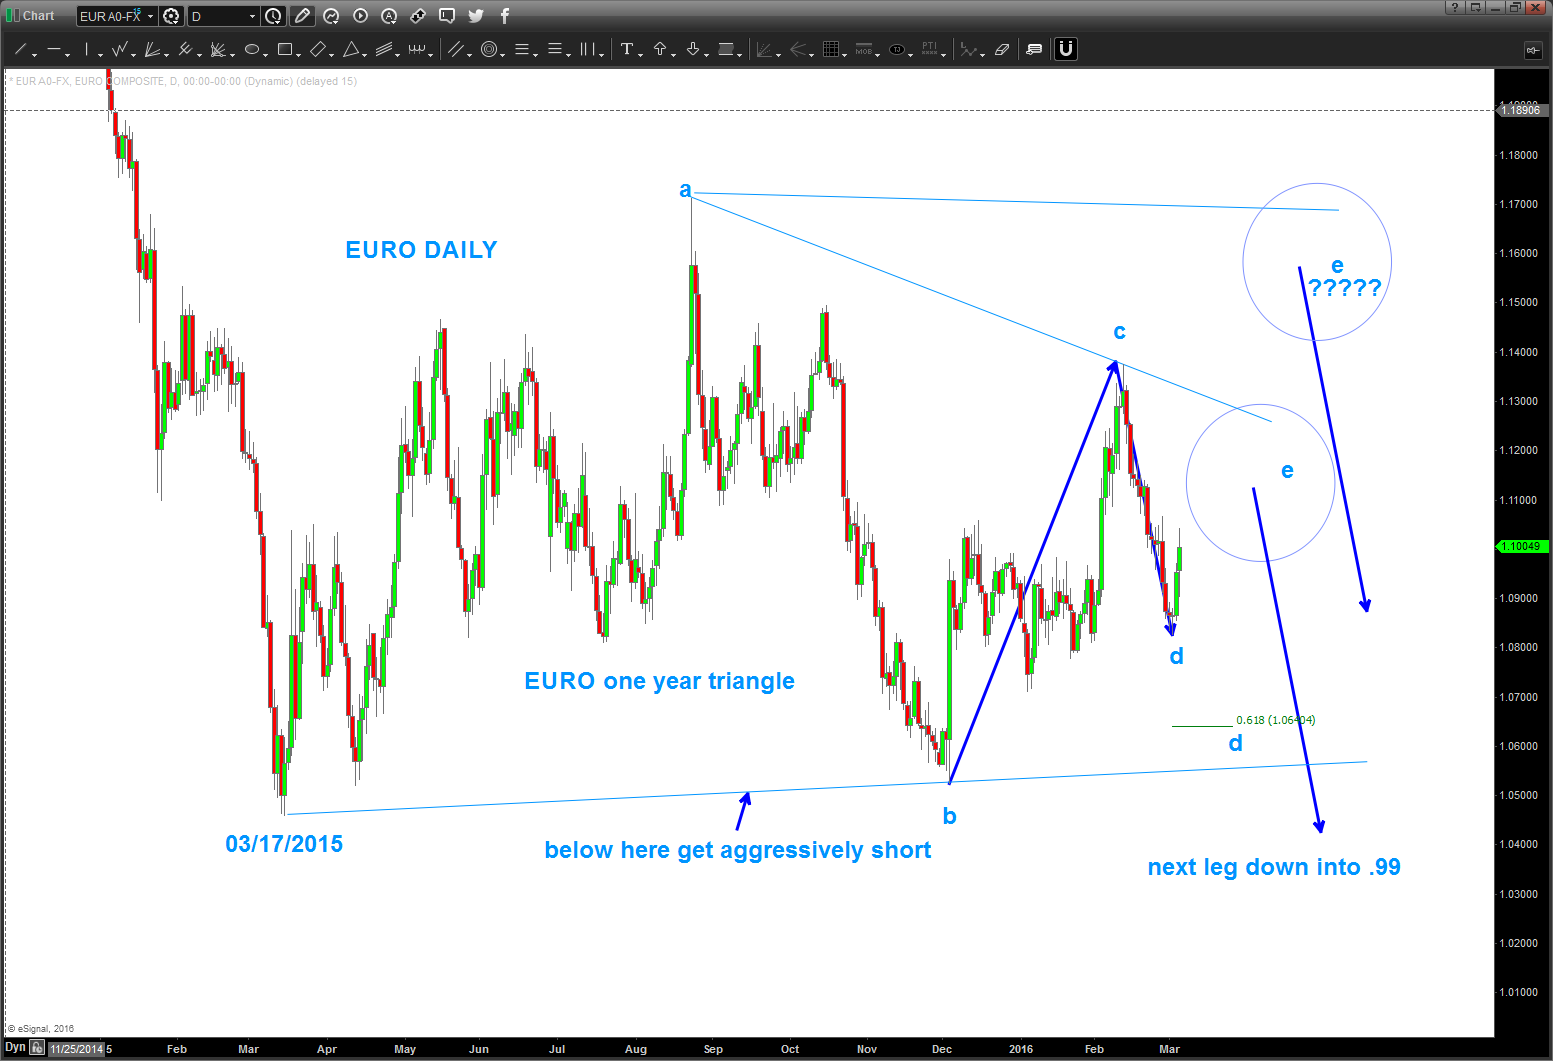
EURO Gameplan
Posted on March 6, 2016 Leave a Comment
olks, it’s been almost a YEAR since the EURO made new lows … and, in the process I have literally, looked to long or short multiple times but it just never felt “right.” so around Dec 2015 and early Jan 2016 it appeared … this puppy is doing a year long triangle.
so, know a triangle unfolds in 5 waves a=b=c=d=e and knowing that it usually occurs after a strong move I see the most current action as “e” and the final wave to complete the triangle.
so, this is where it gets tough … “e” could end in as shown in a couple places. and “e” should unfold in 3 waves.
so it’s still maturing … but we now have some clarity in the potential next move.
remember, it’s hard to catch the break from the upper or lower end of the triangle boundaries because they are swift moves higher or lower.
this move, should, take the EURO into the .99 area.
EMR
Posted on March 5, 2016 Leave a Comment
a bud asked me to take a look at $EMR for him … it shows the “classic” 3 waves to a new low which then results in the classic C wave Up (in this case) and then the trend down should continue (which says “rates” should rise OBTW)
if you want to see the “expanded flat pattern” in work real time on a long long scale take a peak at this move in Dr. Copper:
Again, folks, all of this was REAL time w/ no “could have would have should have” type of stuff. Pure patterns … and math, and music, and vibrations and I digress. Read the above to “see” the PATTERN (Expanded Flat – tip off was a 3 wave to a move high) and the resulting C wave that was very bearish but the PATTERN foreshadowed a TREMENDOUSLY BULLISH MOVE for COPPER to NEW HIGHS and then, well, night night.
Bart

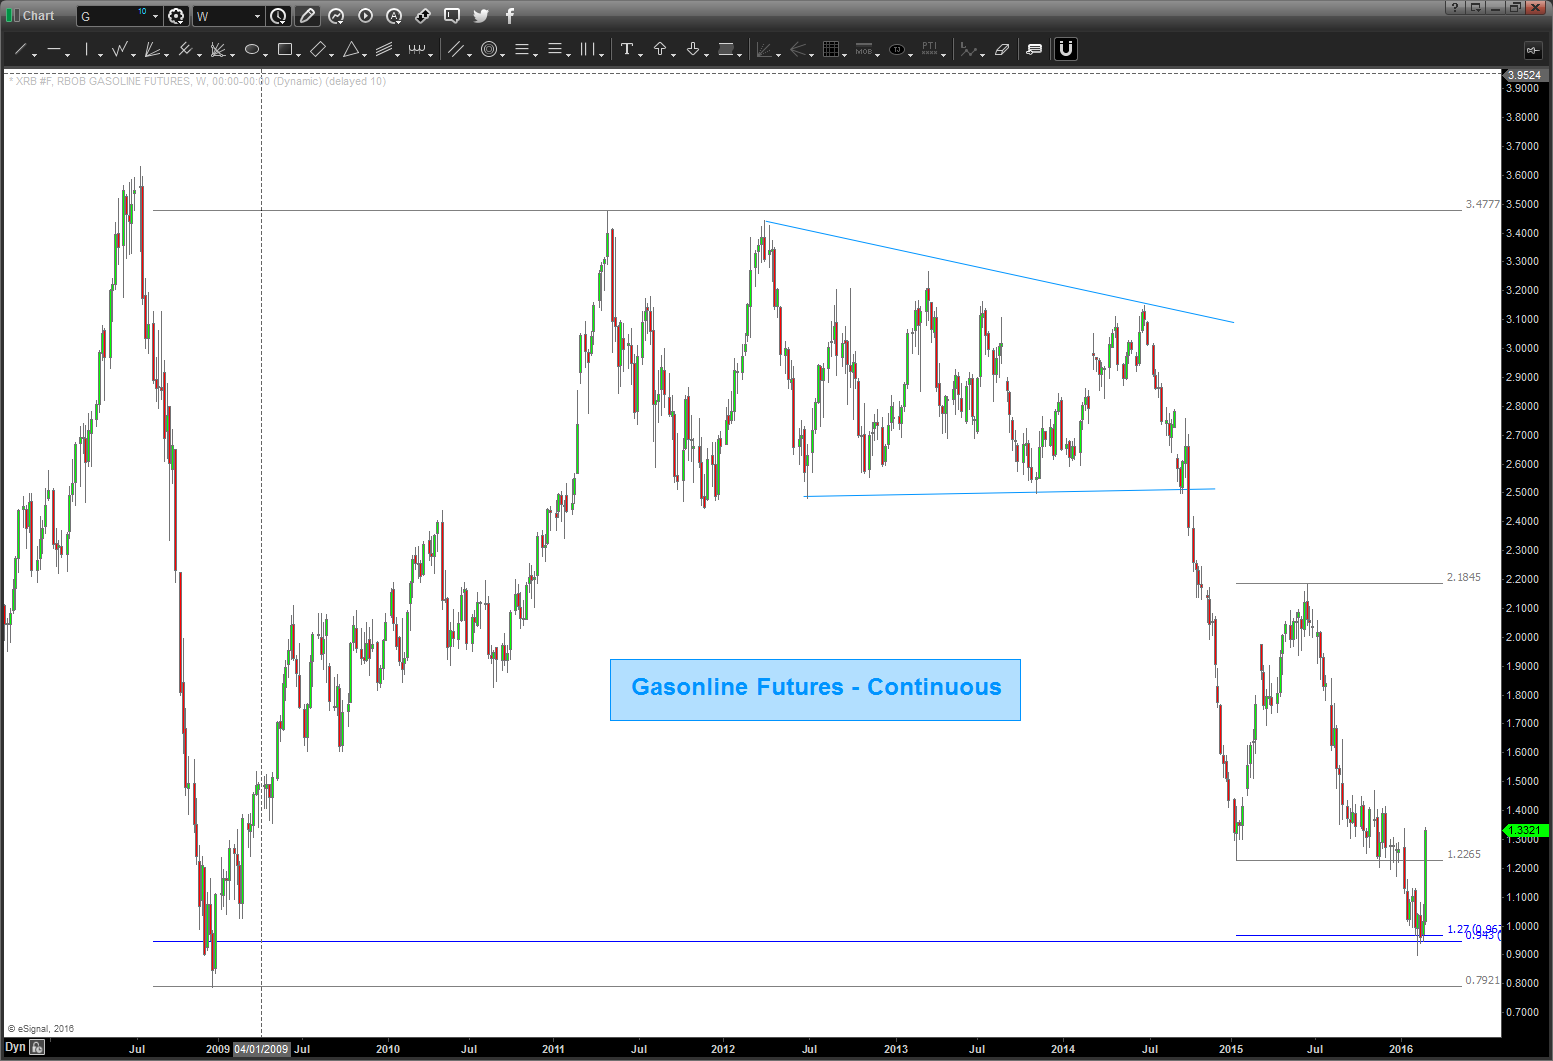
Gasoline Futures, the Aussie and Audioslave …
Posted on March 4, 2016 Leave a Comment

at a certain point you have to ask yourself – are you going to listen to everyone or do the work yourself.
if you want to “feel the Bern” then let him “show you how to live …”
come on man, do the work:
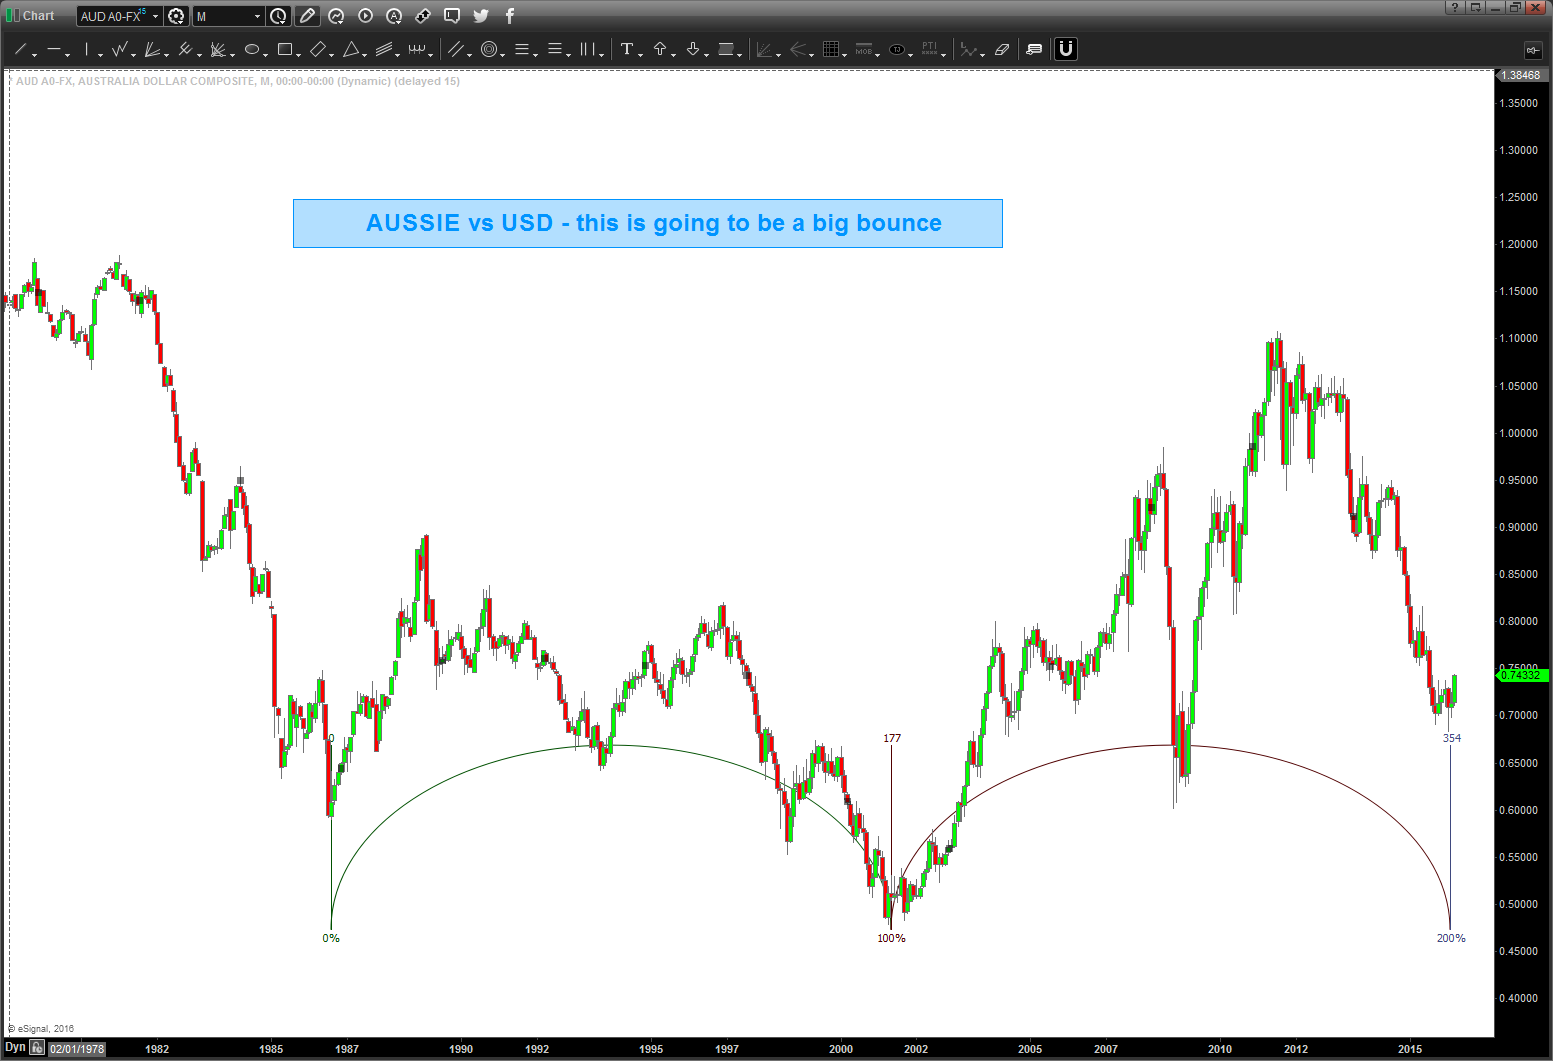
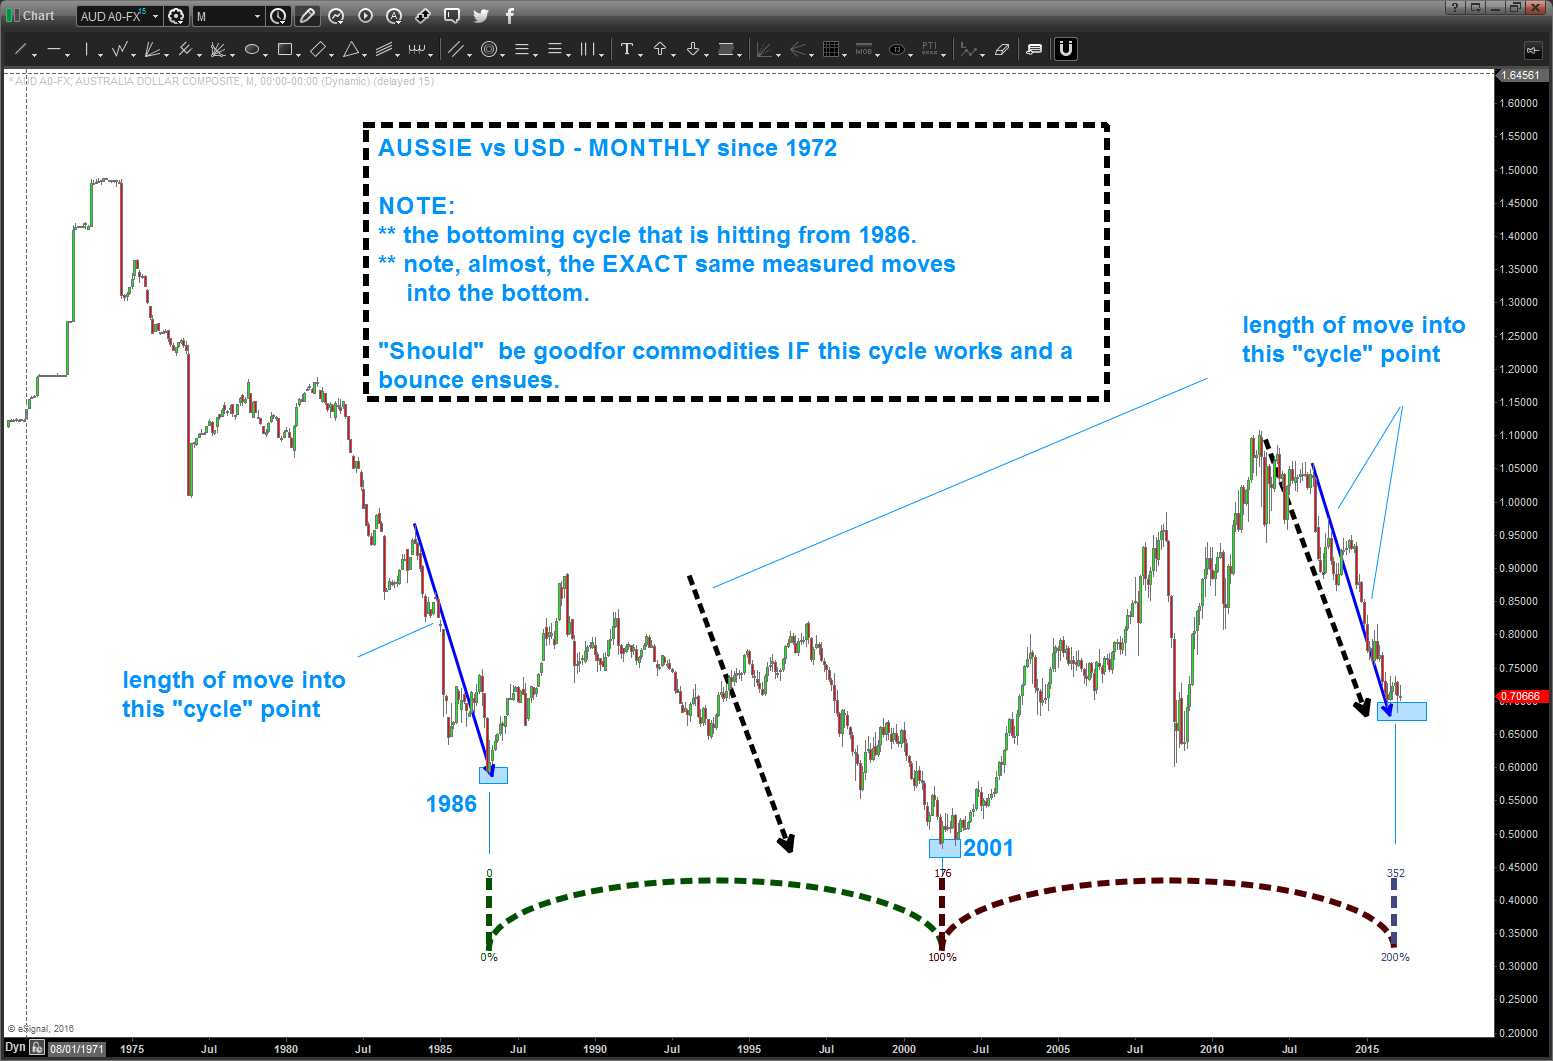
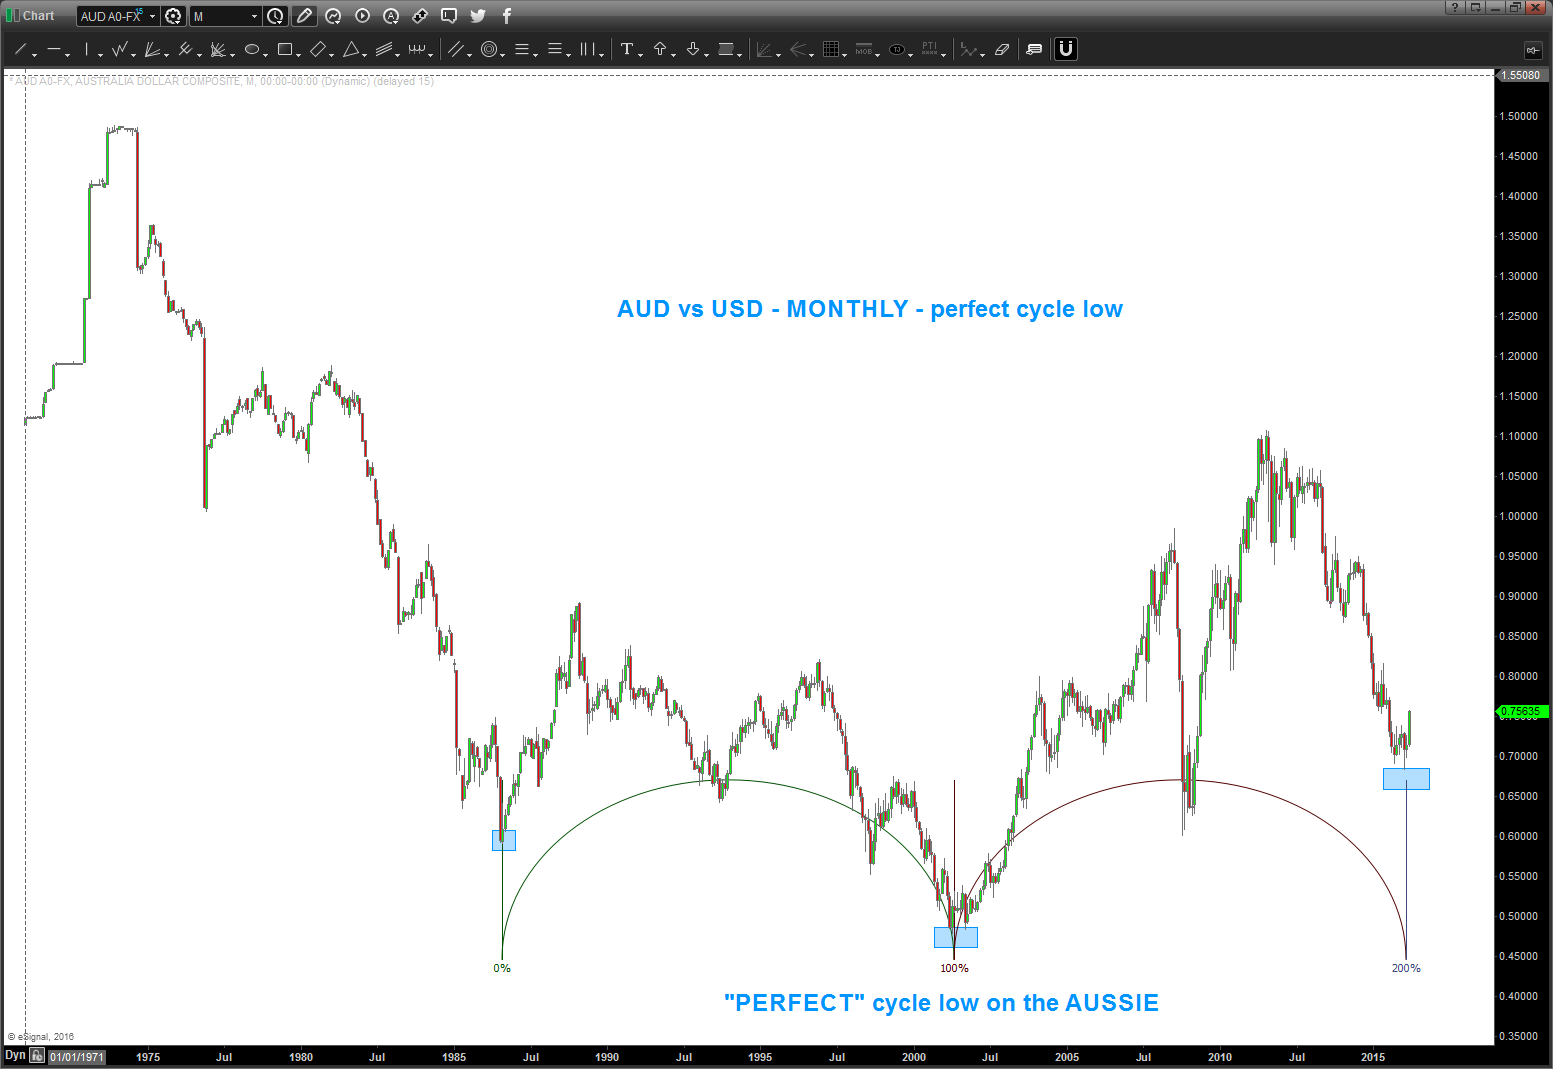
AUSSIE
- monster cycle hitting this month from 1986 on Aussie.
- take note of the “measured moves in price” coming tino the 1986 and 2001 low .. they are the same footprint
- very oversold w/ bullish divergence
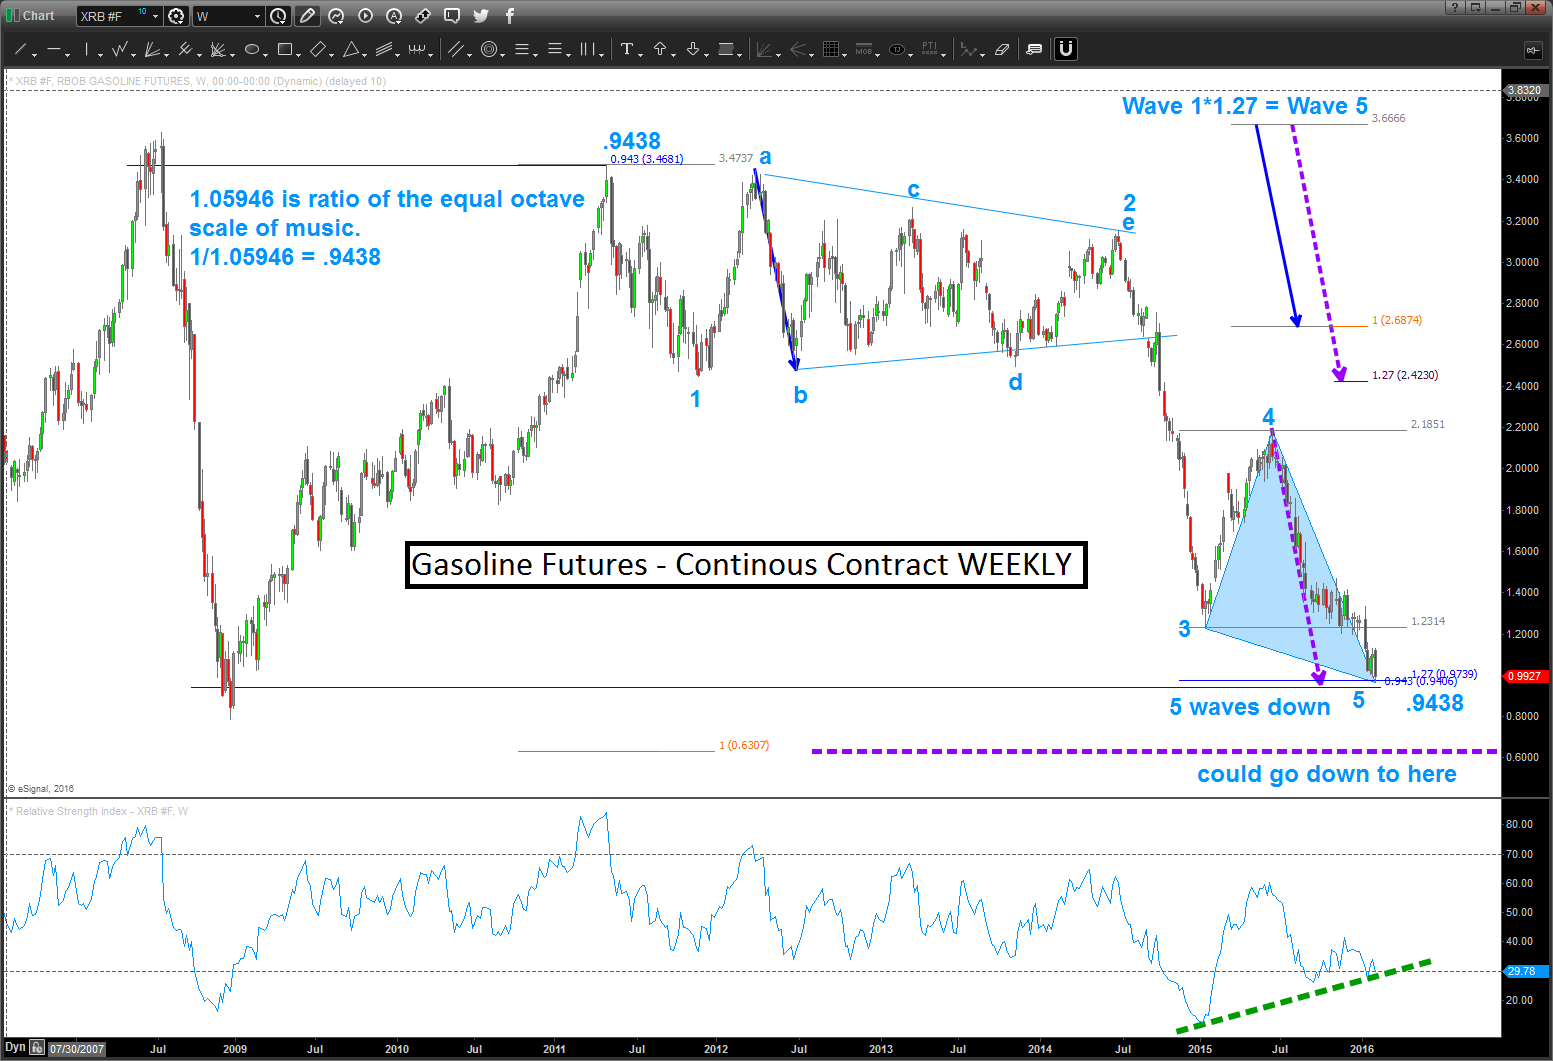
GASOLINE FUTURES
- note, 5 waves down on natural gas
- .9438 symmetry
- 1.27 extension
- 1.27 wave 1 = wave 5
- monster bullish divergence …