XLP / NYA update – heads up and pay attention
Posted on March 30, 2016 3 Comments
03/30/2016
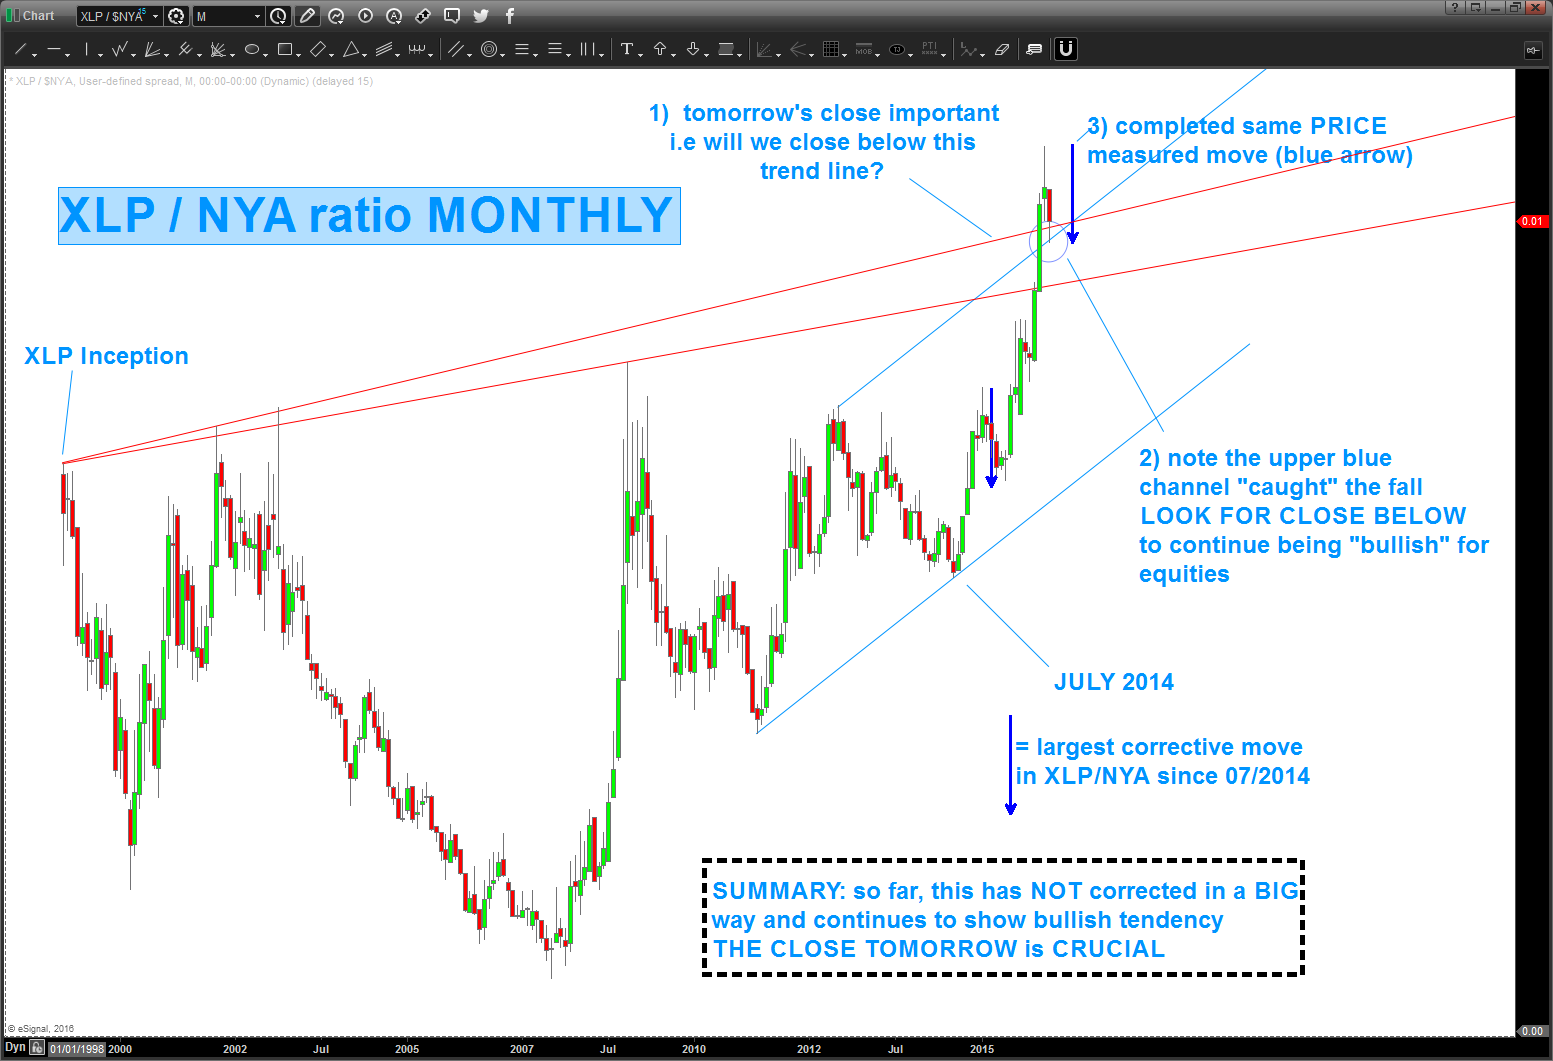
see chart below and let me know if you have any questions .. some things to think about. VERY NICE POP since this post …
let’s not get cocky … trade what you see.
B
so based on the above – certainly could put this into the potential’s out there. just saying …
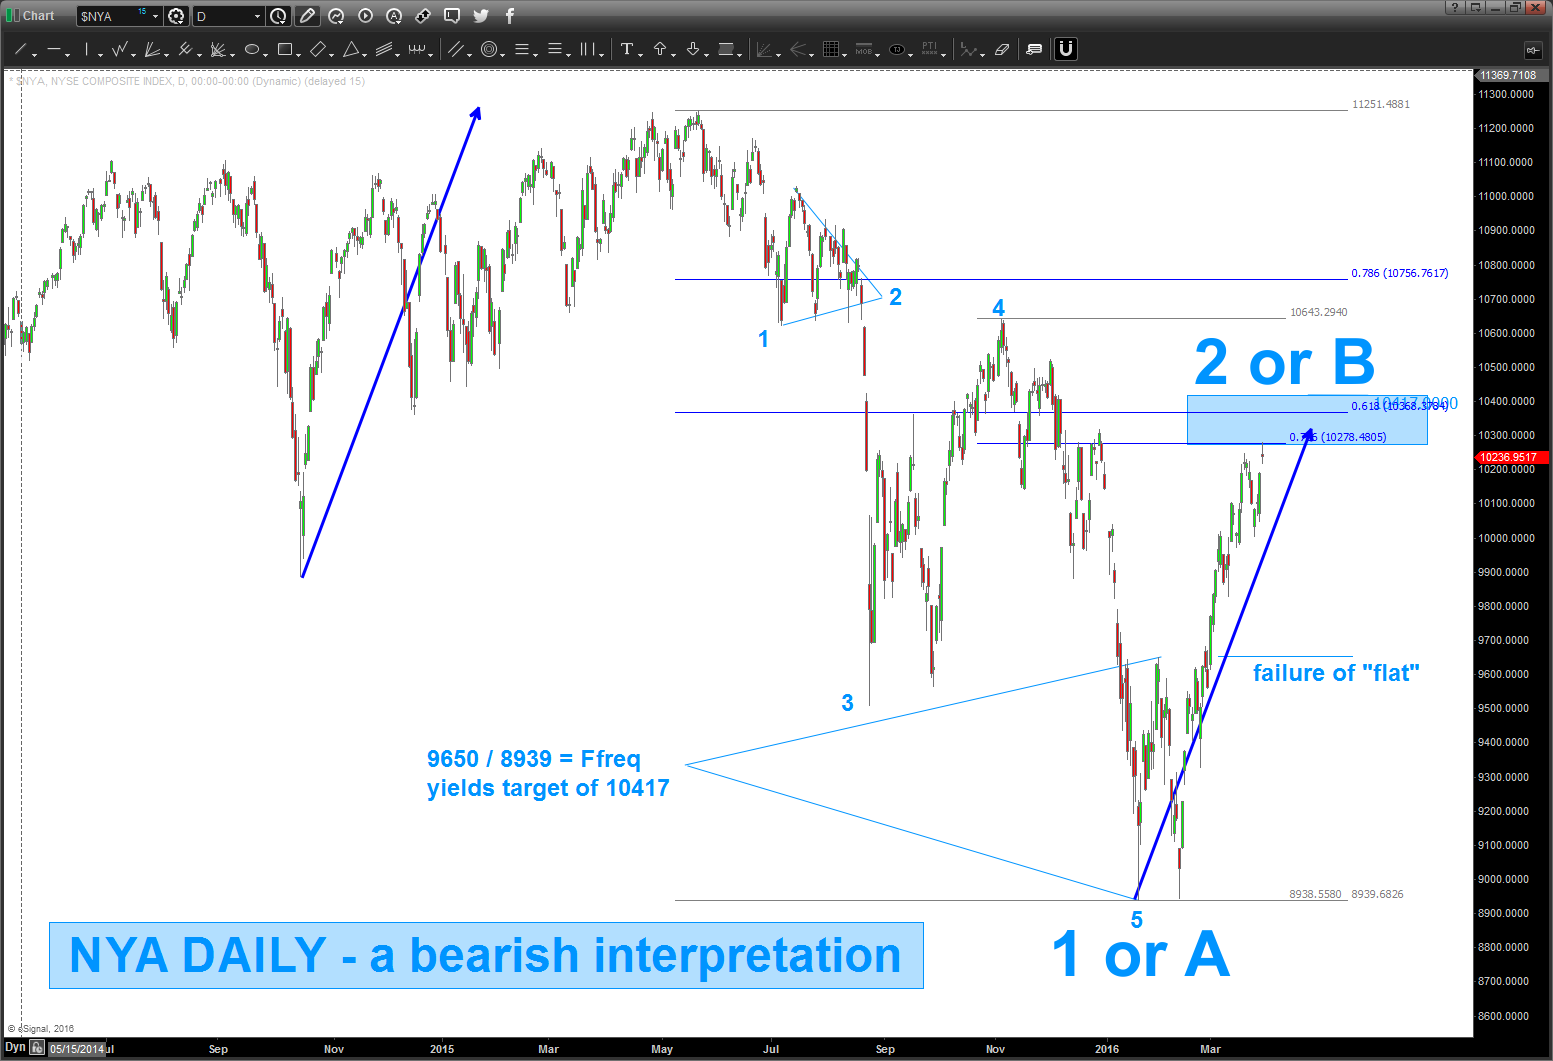
note the $NYA chart below ….
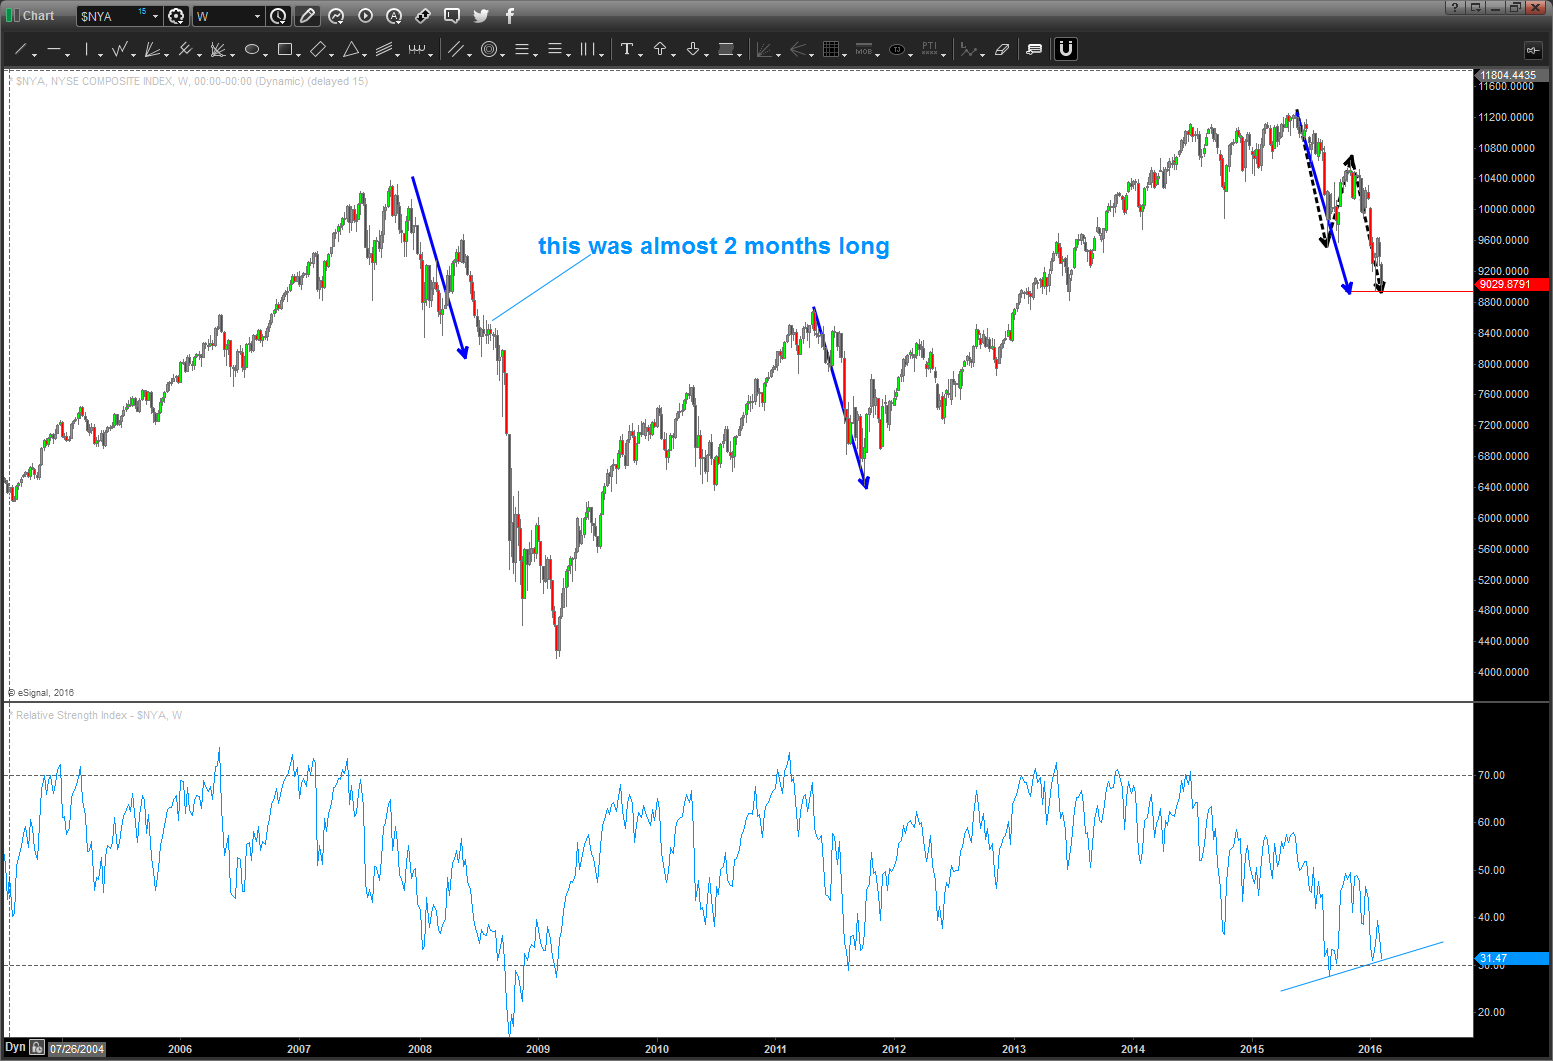
- blue arrows represent the largest corrective move since 2009
- in the 2007-2008 financial panic this measured move held the market at bay for almost two months
- can you imagine the talking head pundits on CNBC BS’ing about that for two months … blah blah blah.
- we also see the dashed black arrows projection to the exact level as the measured move
- we have weekly bullish divergence present on the RSI
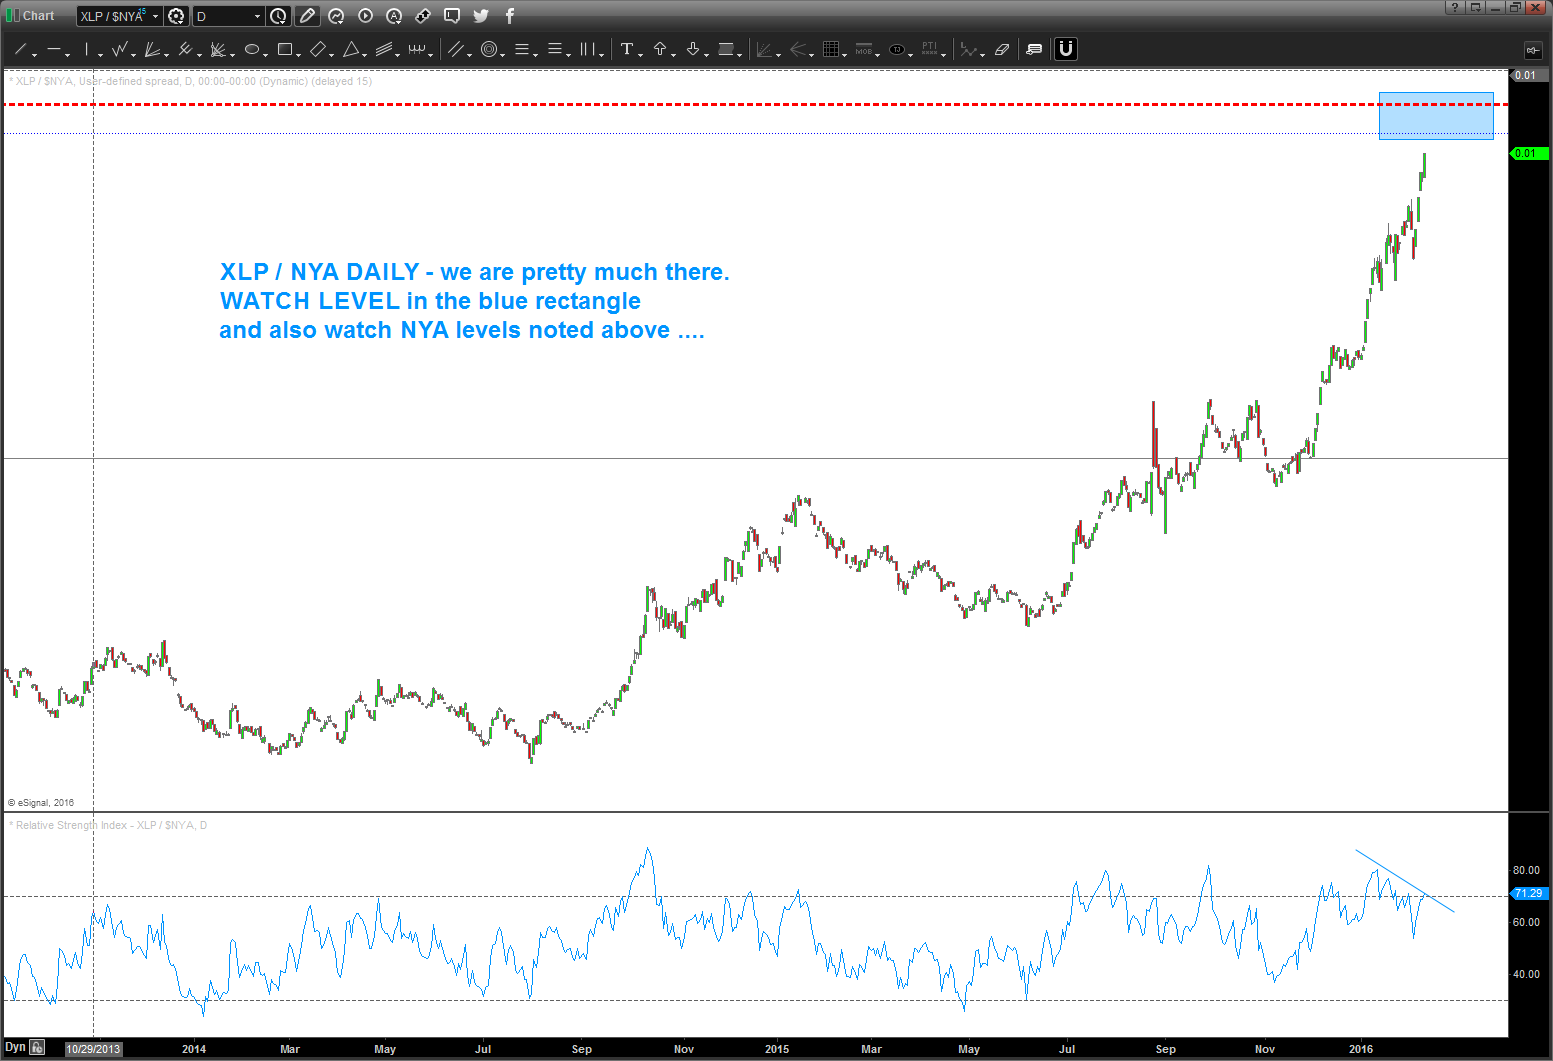
- plus, we are a couple ticks shy of the XLP / NYA ratio in an arena of overbought more than 2009.
so, if were going up … sure looks like it’s about time for that to happen.
here we go …
$HAL ’bout them apples … LOL
Posted on March 30, 2016 Leave a Comment
BOOM …
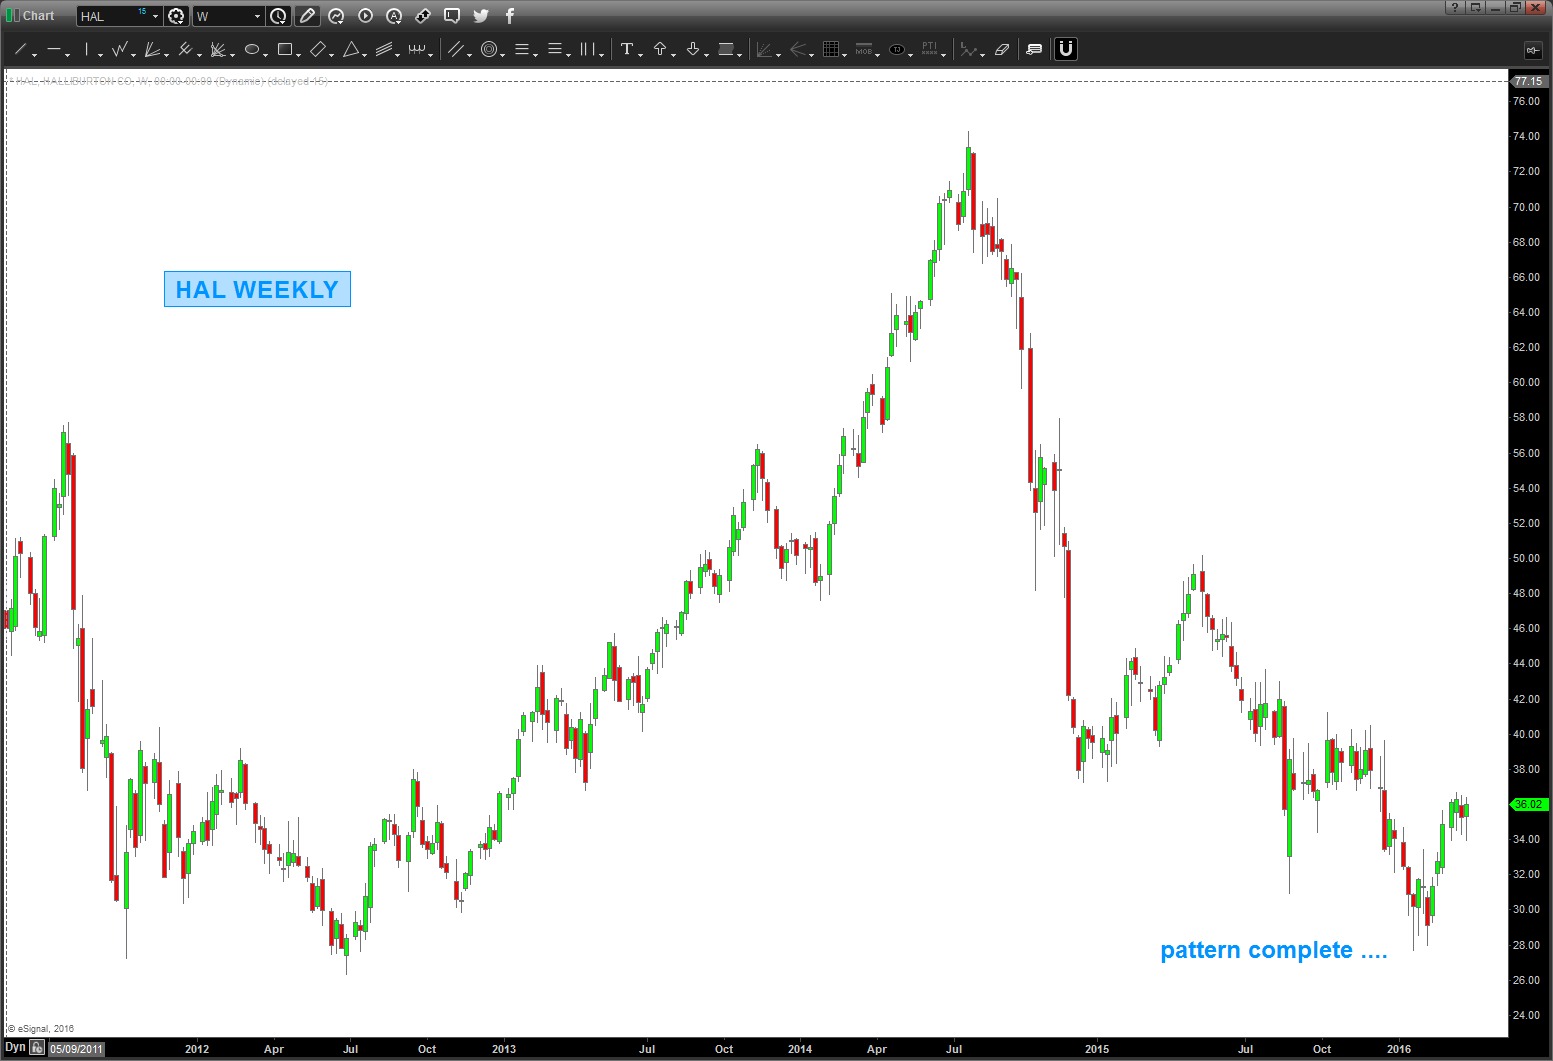

MATH, nothing more nothing less
- measured move (blue arrows)
- .618 retrace from roughly the all time low at 1$/share
- WEEKLY cycle from 2008
- 3 drives to a bottom into .618 retracement
- bullish divergence
- wrong w/ daily close below recent lows
I do know that Dick Cheney had something to do with it …that’s all I know.
Bart
theory and background charts for my talk ..
Posted on March 29, 2016 6 Comments
thought you guys might to take a look .. I’ve tried to make 10 charts equal 20,000 hours plus studying the geometry and music of the market.
perhaps, perhaps not.
give me some feedback if you have the time.
giving a talk http://www.markettechnicians.org in a couple weeks.
first time I have done this in a long time, hope they don’t kick me out or throw tomatoes at me.
Bart
this, never gets old .. Bladder of the Fish and Soybeans
Posted on March 28, 2016 Leave a Comment
03/28/2016 – am prepping for a presentation I will be giving at http://www.markettechnicians.org and it’s about the math of the great pyramids, Stonehenge and Music. I’m trying (really I am trying) to walk slowly thru the progression of why square roots are important and I had to include an example of the Vesica Pisces (bladder of the fish) and I remembered this post … I’m going to use one of the charts in my presentation so I figured what the hell, just repost it.
B
had a “google hangout” w/ JC today and we zipped thru, easily, 6 different asset classes from stocks, commodities, single stocks and currencies in roughly 10 minutes.
“check this out – boom boom boom” and “blah blah blah” – and we were done.
question .. how long do you think it would take non-chartists? hours …? just saying.
anyway, we took at look at long term soybeans and what we need to focus on is the POWER of a MEASURED MOVE on a long term chart. in the chart below you’ll see blue and orange arrows. they represent the MAXIMUM correction of Soybeans on this 40 year old chart.
folks, when you have a LONG TERM measured move that sits right on a .618 retracement – you have high probability. If you don’t believe me … just look at the chart.
every major correction has either been a blue or orange arrow …
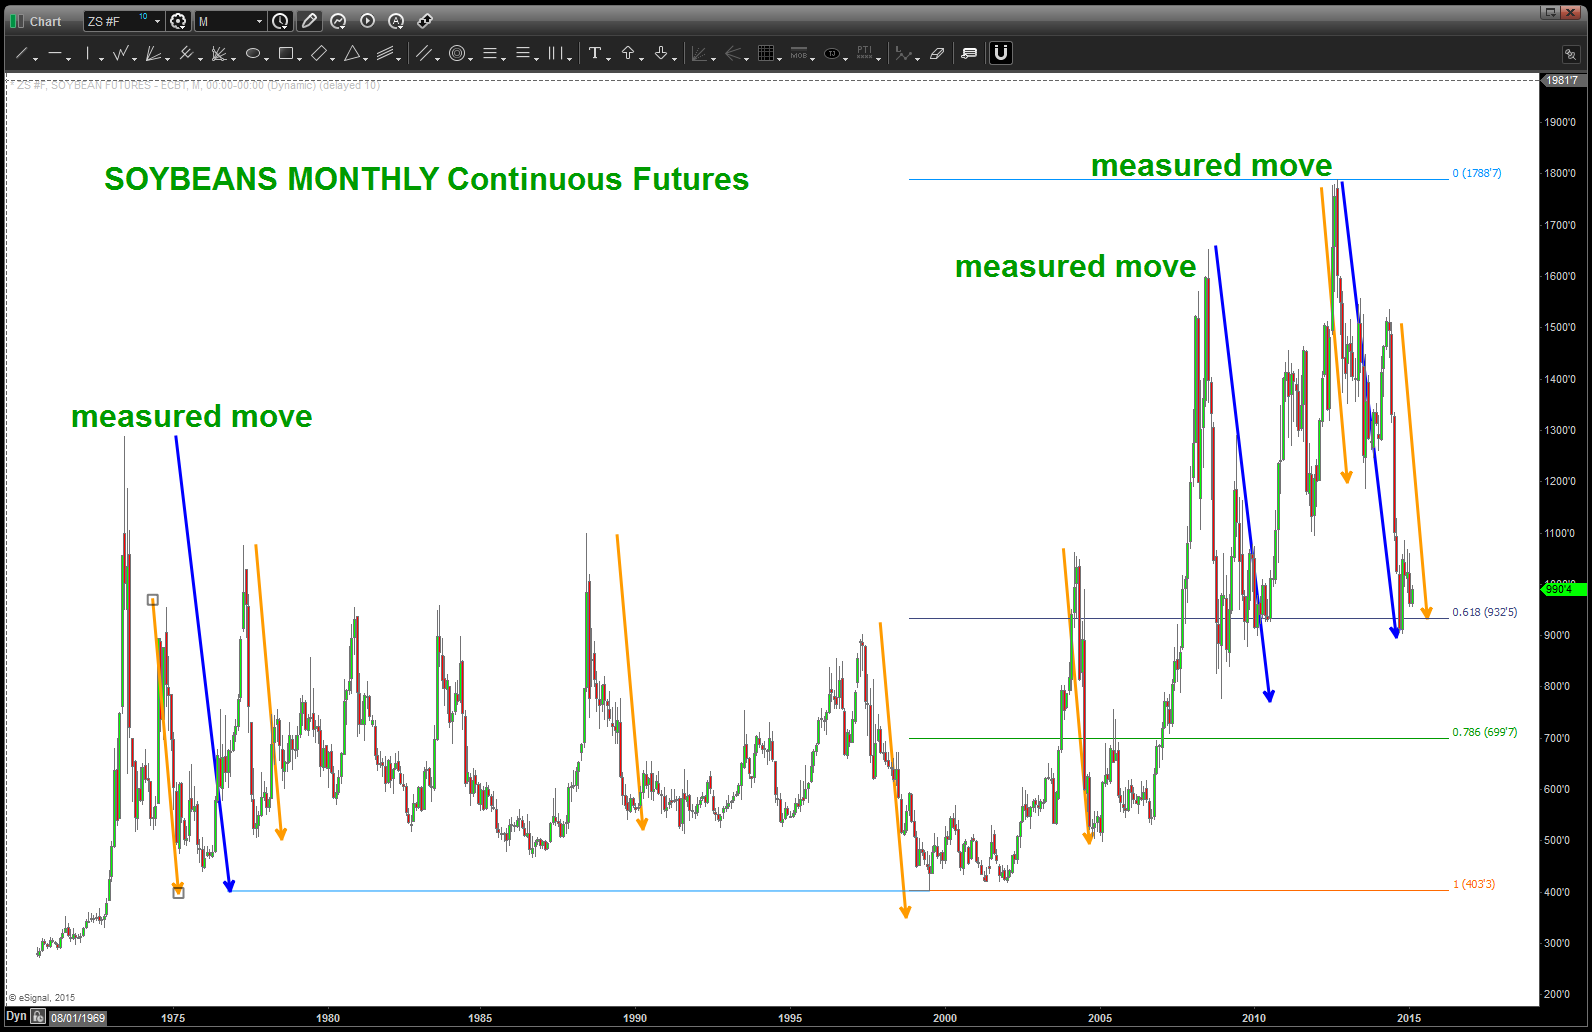
measured moves of Soybeans
W H Y ?
the Vesica Piscis of course (the bladder of the fish)
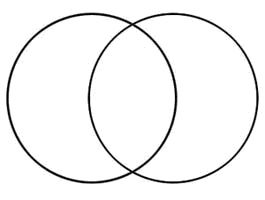
Vesica Pisces
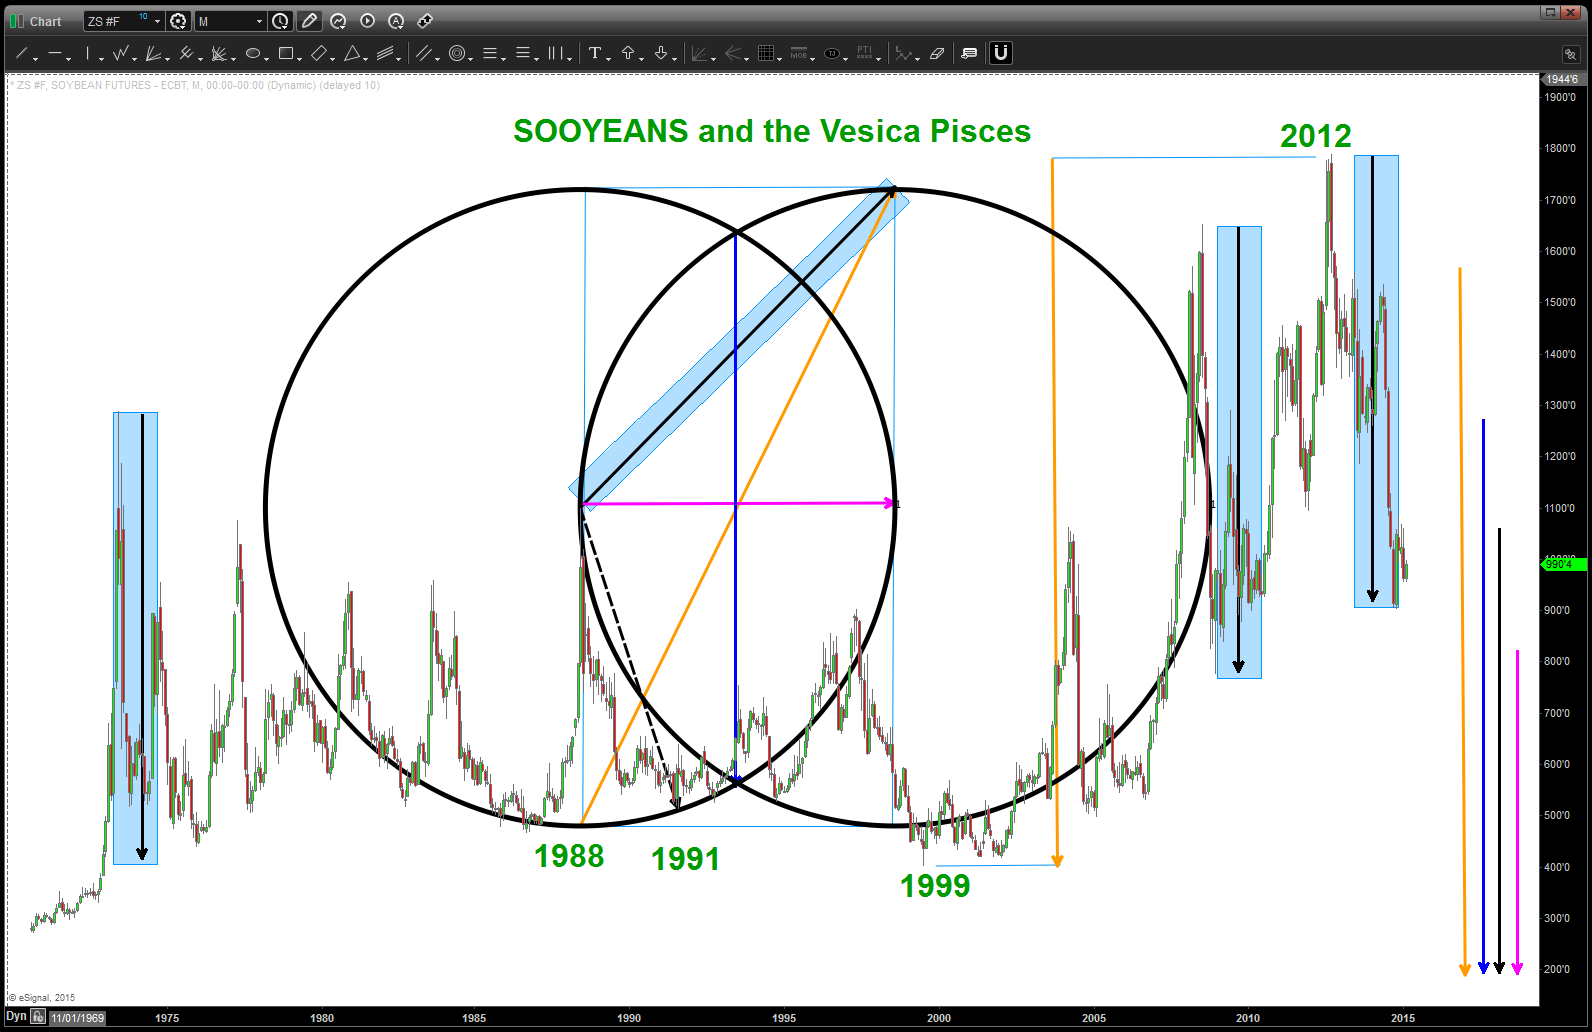
so, look folks, you can believe me or not … but – HONESTLY – I chose the black dashed move to being the construction of the Vesica Pisces for this long term soybean chart. And, because I believe in my edge – and w/ full disclosure I had NEVER done this for Soybeans I constructed the VP from that one corrective move from 1988-1991.
as you can see below I built the picture above and then ….. use sacred geometry to measure the fractals of the square roots of 2,3,4,5 which are represented by pink/black/blue/orange arrows and then transposed them to PRICE in the lower right hand corner.
and, guess what … see that black arrow? THAT is what created the measured moves above … and, additionally, as you can see, I used the orange arrow from the low in 1999 to the EXACT high in 2012.
now, believe it or not, you can use any major swing .. they are all related from a proportions and fractal point of view. I trusted my eye and looked at where this correction was occurring and trusted my “hunch” that this was the right vector to use as the seed.
if you get the chance … use the vectors as time. (hint hint)

the bladder of the fish and the Vesica Pisces
SPOILER ALERT:
The mathematical ratio of the width of the vesica piscis to its height is the square root of 3, or approximately 1.7320508… (since if straight lines are drawn connecting the centers of the two circles with each other and with the two points where the circles intersect, two equilateral triangles join along an edge). The ratios 265:153 = 1.7320261… and 1351:780 = 1.7320513… are two of a series of approximations to this value, each with the property that no better approximation can be obtained with smaller whole numbers.
21:11 Simon Peter went up and drew the net to land, full of large fish, a hundred and fifty-three and although there were so many, the net was not torn.
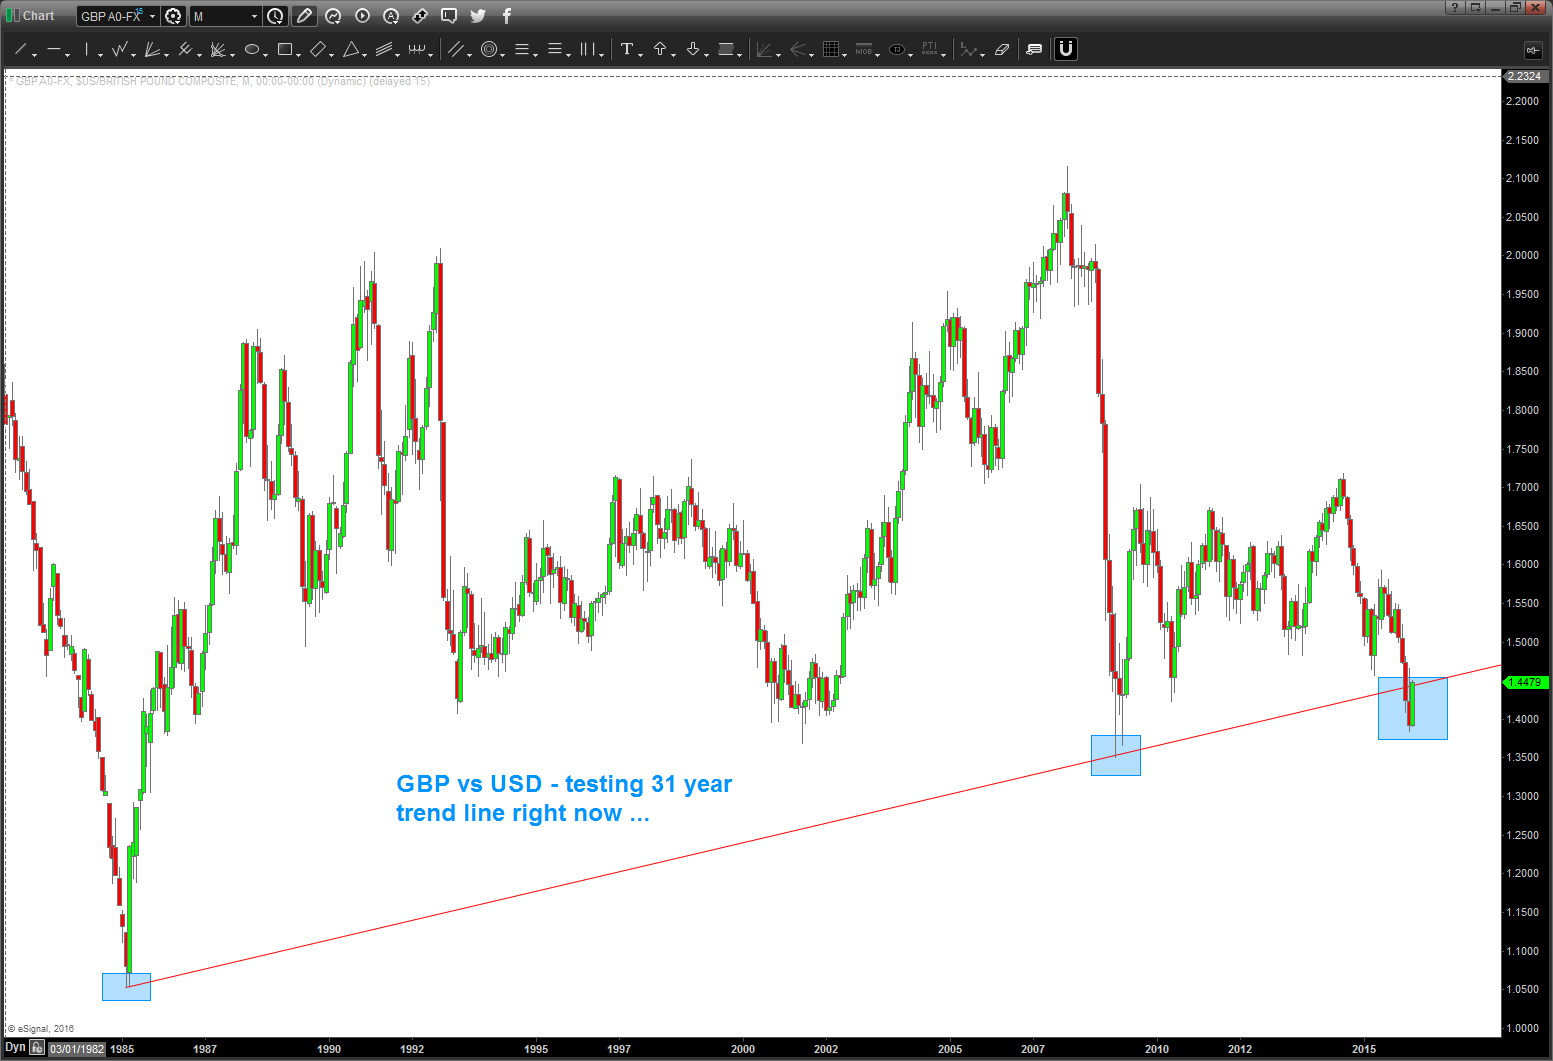
really need to pay attention here … POUND is flirting w/ a BIG OLD HEAD AND SHOULDERS
Posted on March 22, 2016 Leave a Comment
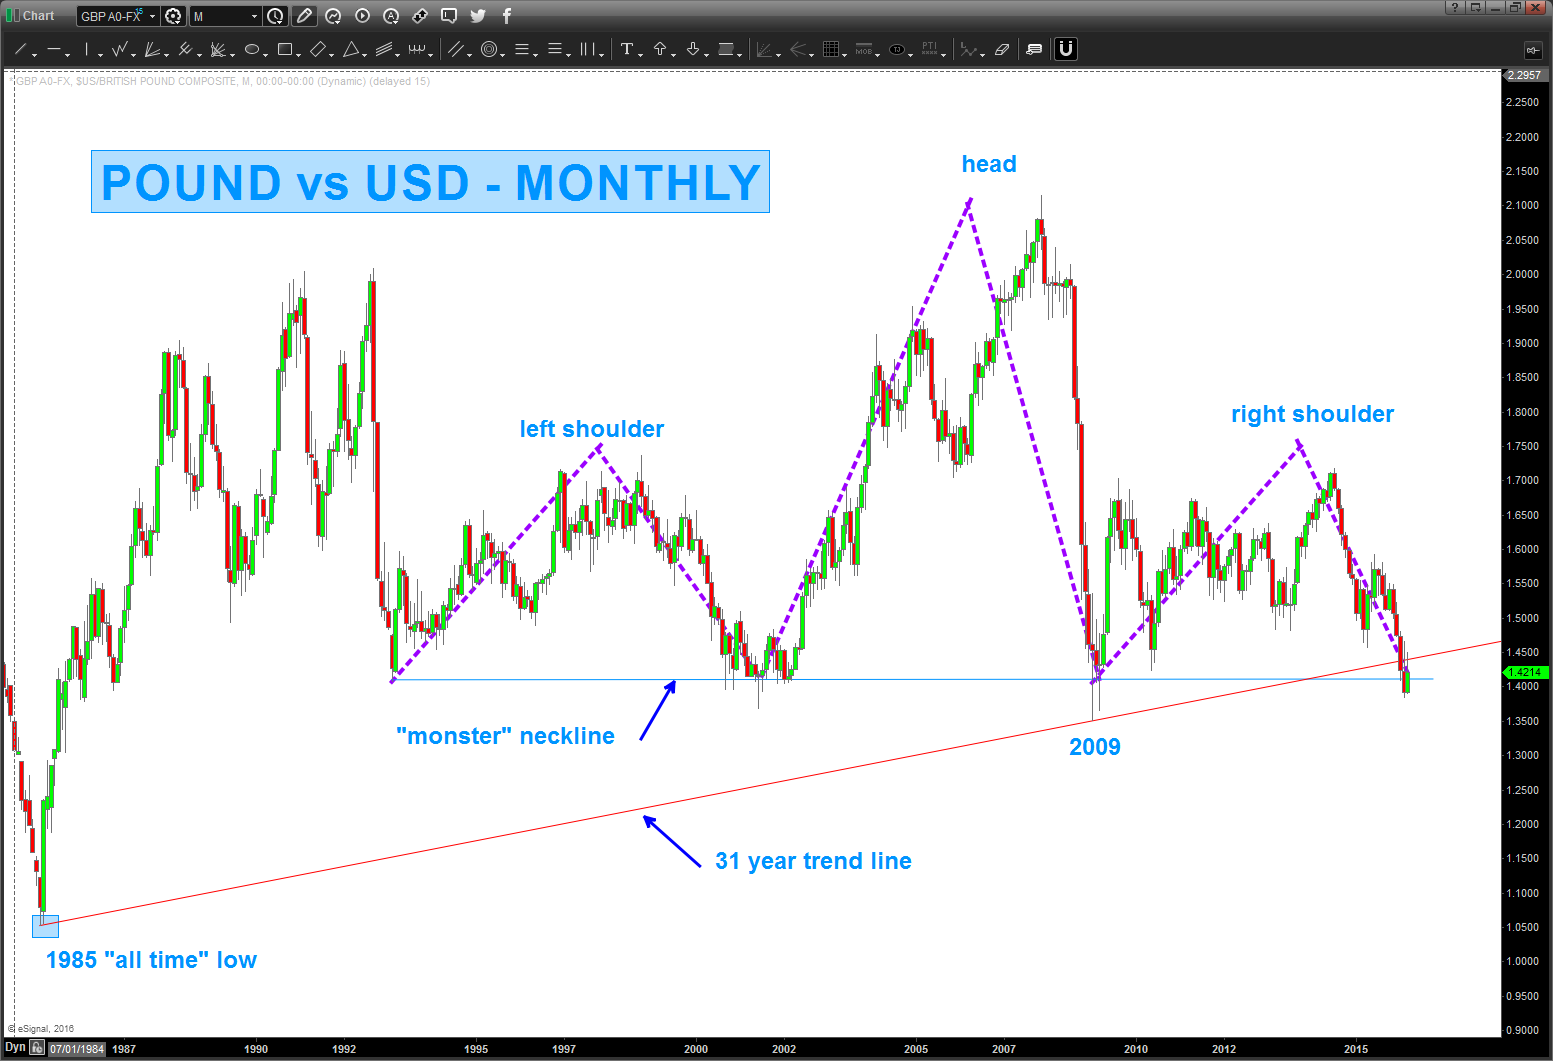
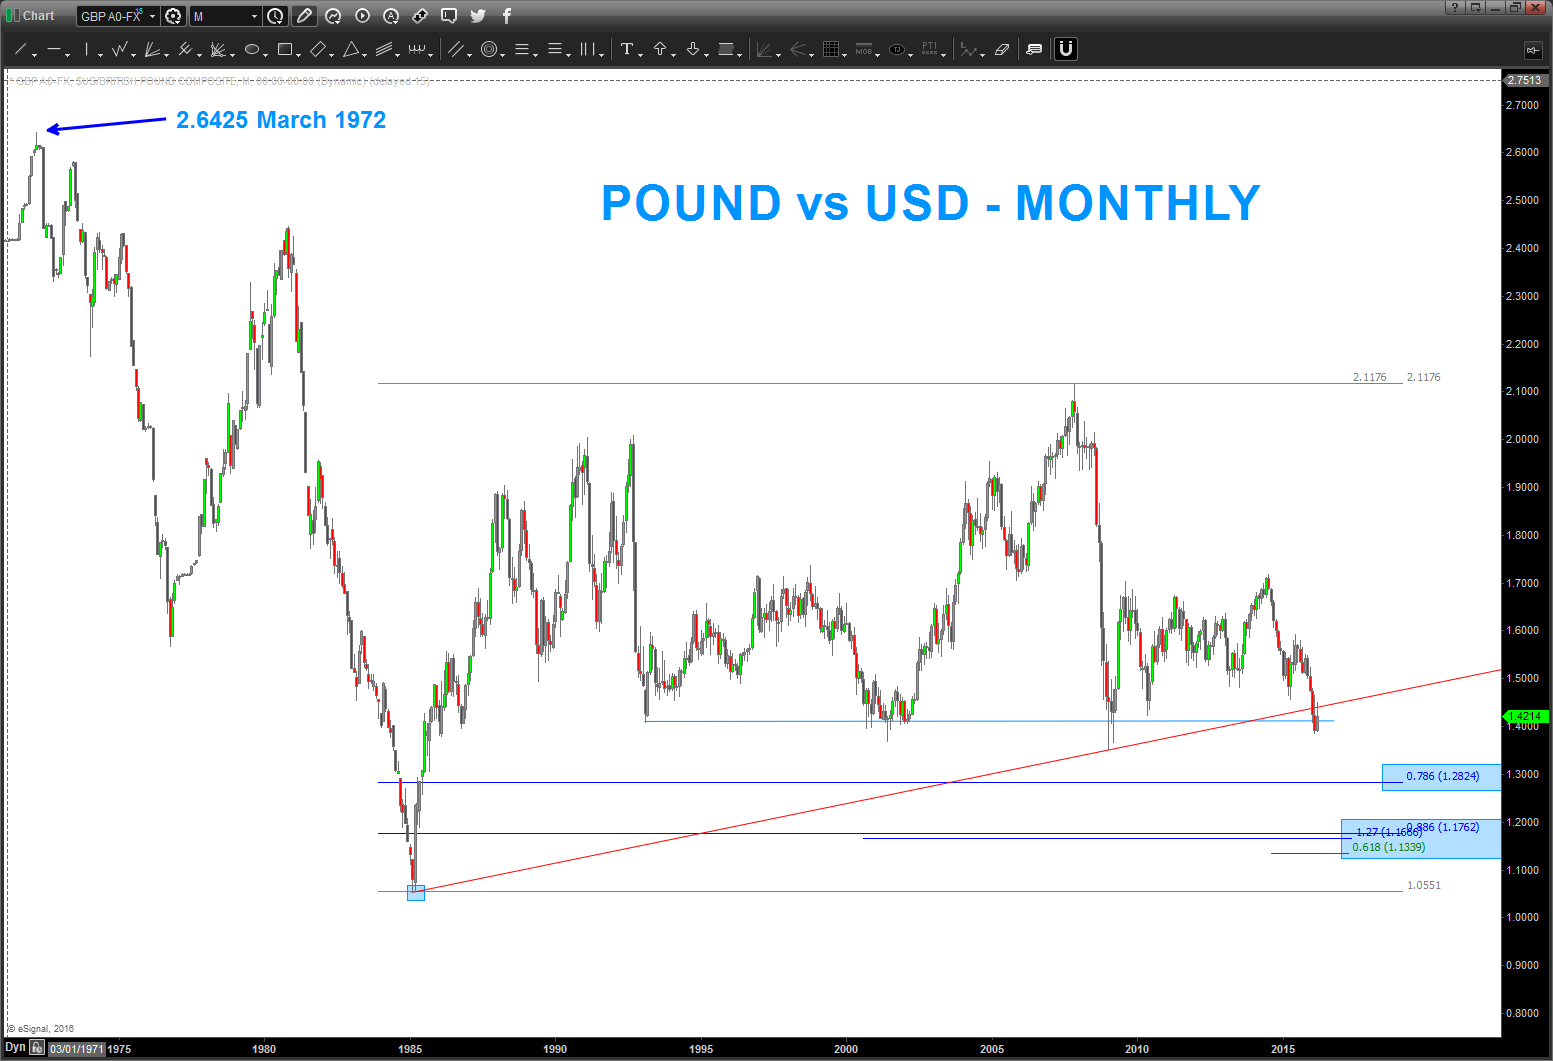
Folks, this ranks up there as a “big deal” so watch this one carefully as theirs a potential the POUND busts wide open and moves 3000+ pips if we have a MONTHLY closing below the neckline.
Bart
Super Size Me … $MCD
Posted on March 21, 2016 Leave a Comment
So, here’s another AMAZING run by a company that really has it down. Let’s face it – everybody has gone to $MCD every once in a while – hugh? People buy Burgers man ….
But when I look at this chart I see the “Sir Isaac Newton” parabolic takeoff. So, starting from scratch were going to have some fun w/ geometry.
Exhibit 1: chart of $MCD
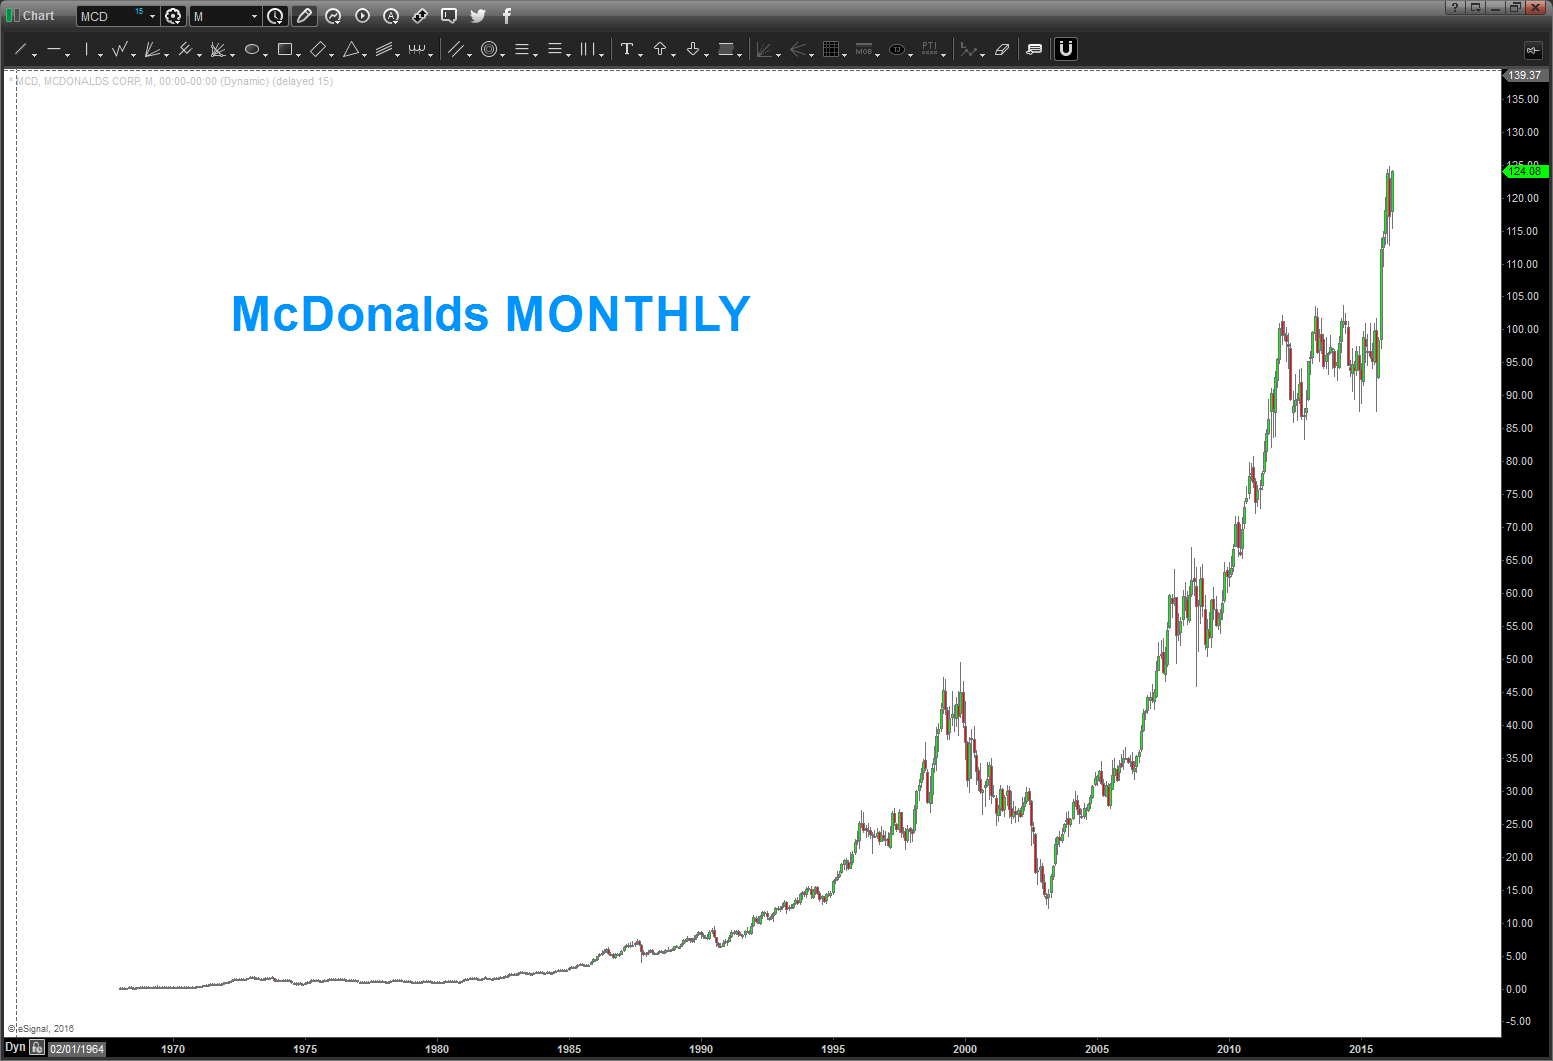
Exhibit 2: what does the LOG scale and RSI look like?
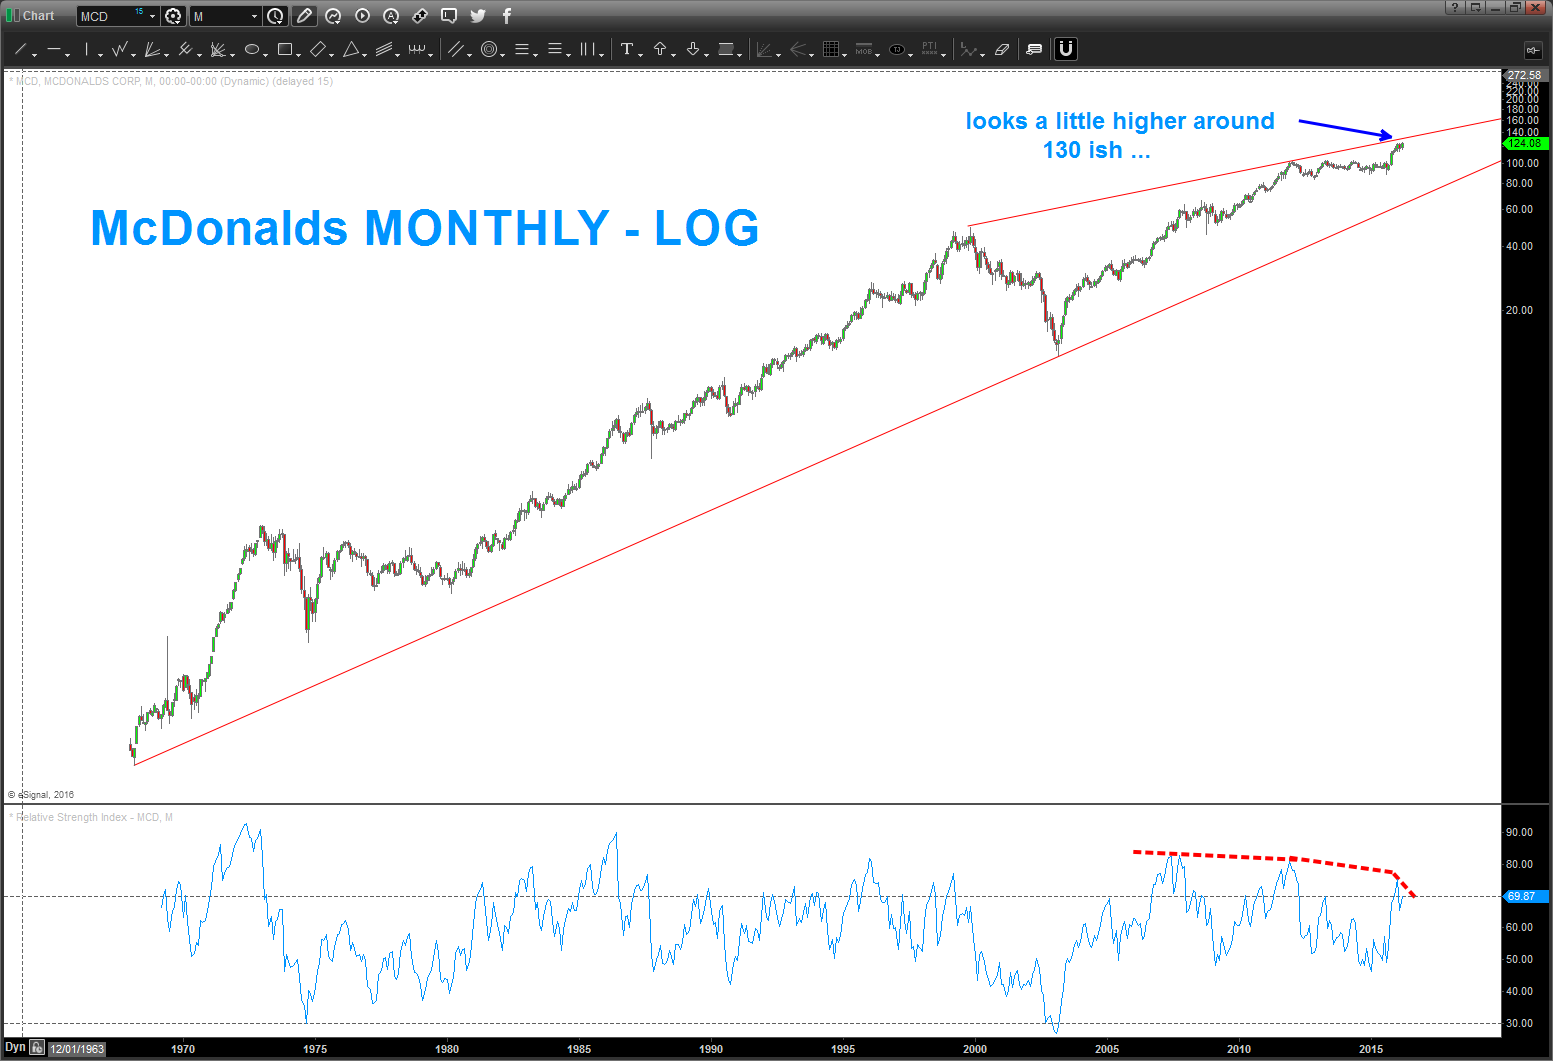
- the “top to top” trend line looks like it wants to go a little higher – 130 ish?
- note the “bearish divergence” in that $MCD makes new highs BUT the RSI doesn’t …important.
What about Volume? (are people buying it up here?)
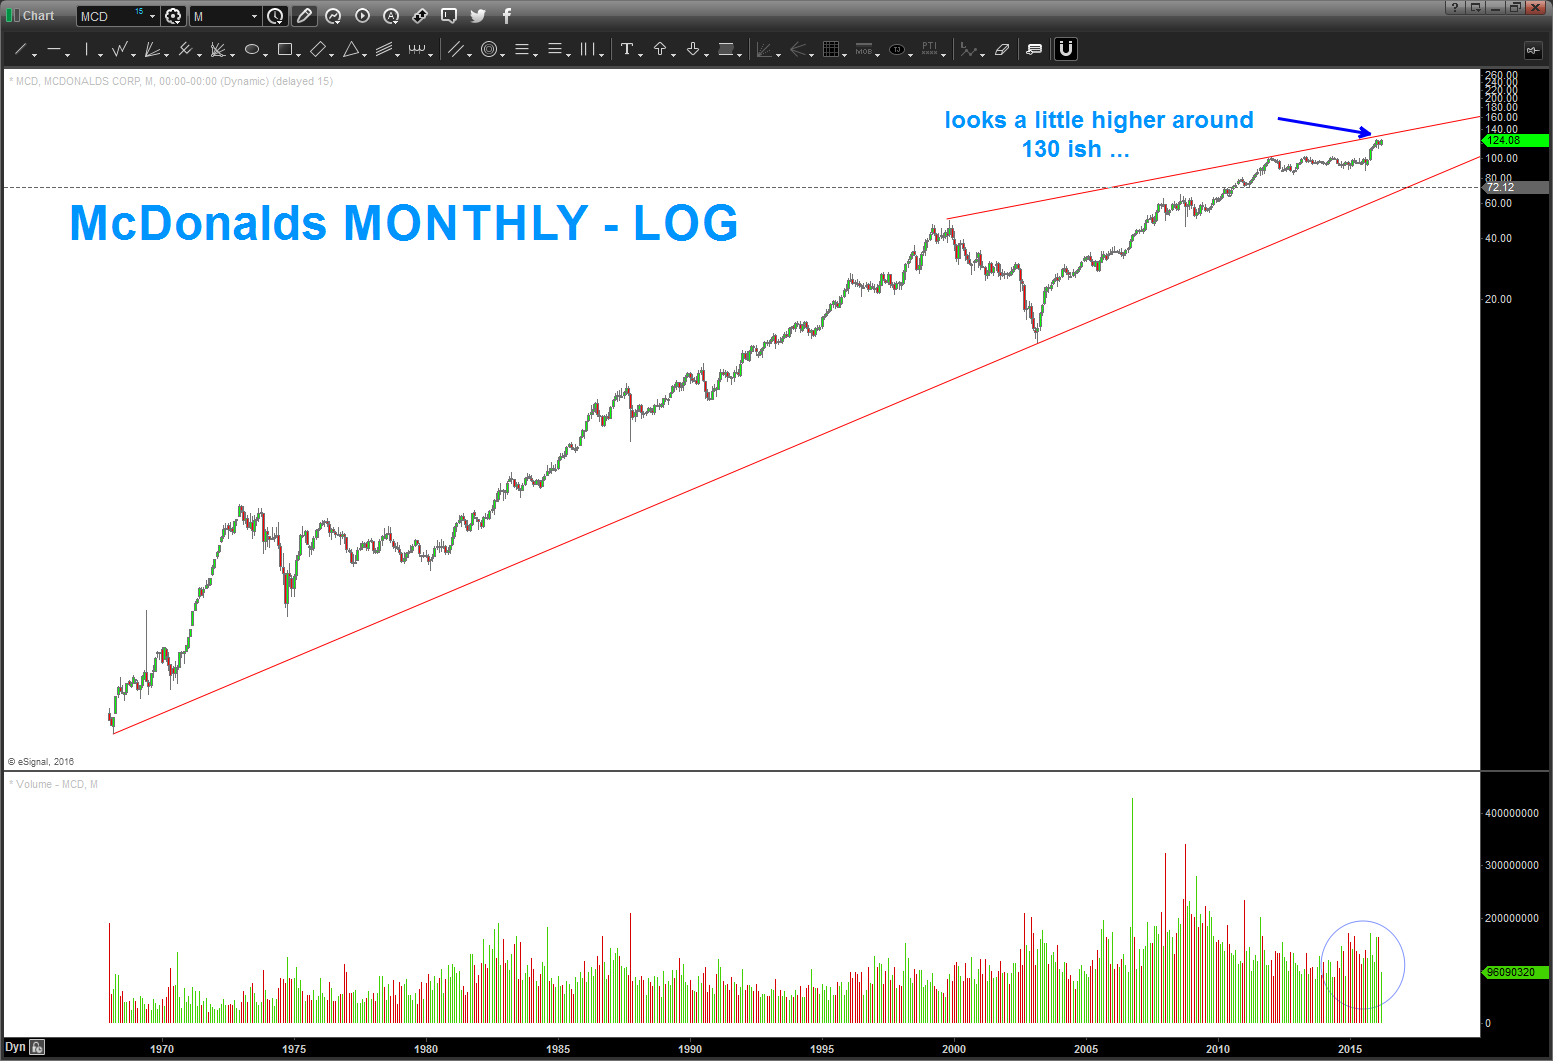
I’m going to chalk it up to …nothing too crazy. Volume is “good”
Now, EVERYTHING, I “Really Need to Know I learned in Kindergarten” (I actually mentioned this during my CMT talk at the convention a couple years ago). But, seriously, I want to make mention that what you see below is 1) real time (I didn’t do it and then publish it – it just looks parabolic) and 2) simply based on geometry we learned back in Elementary School.

Let’s take 3 points and figure out how to make a circle ….? OK?
http://www.mathopenref.com/const3pointcircle.html
Here’s the end result for $MCD:
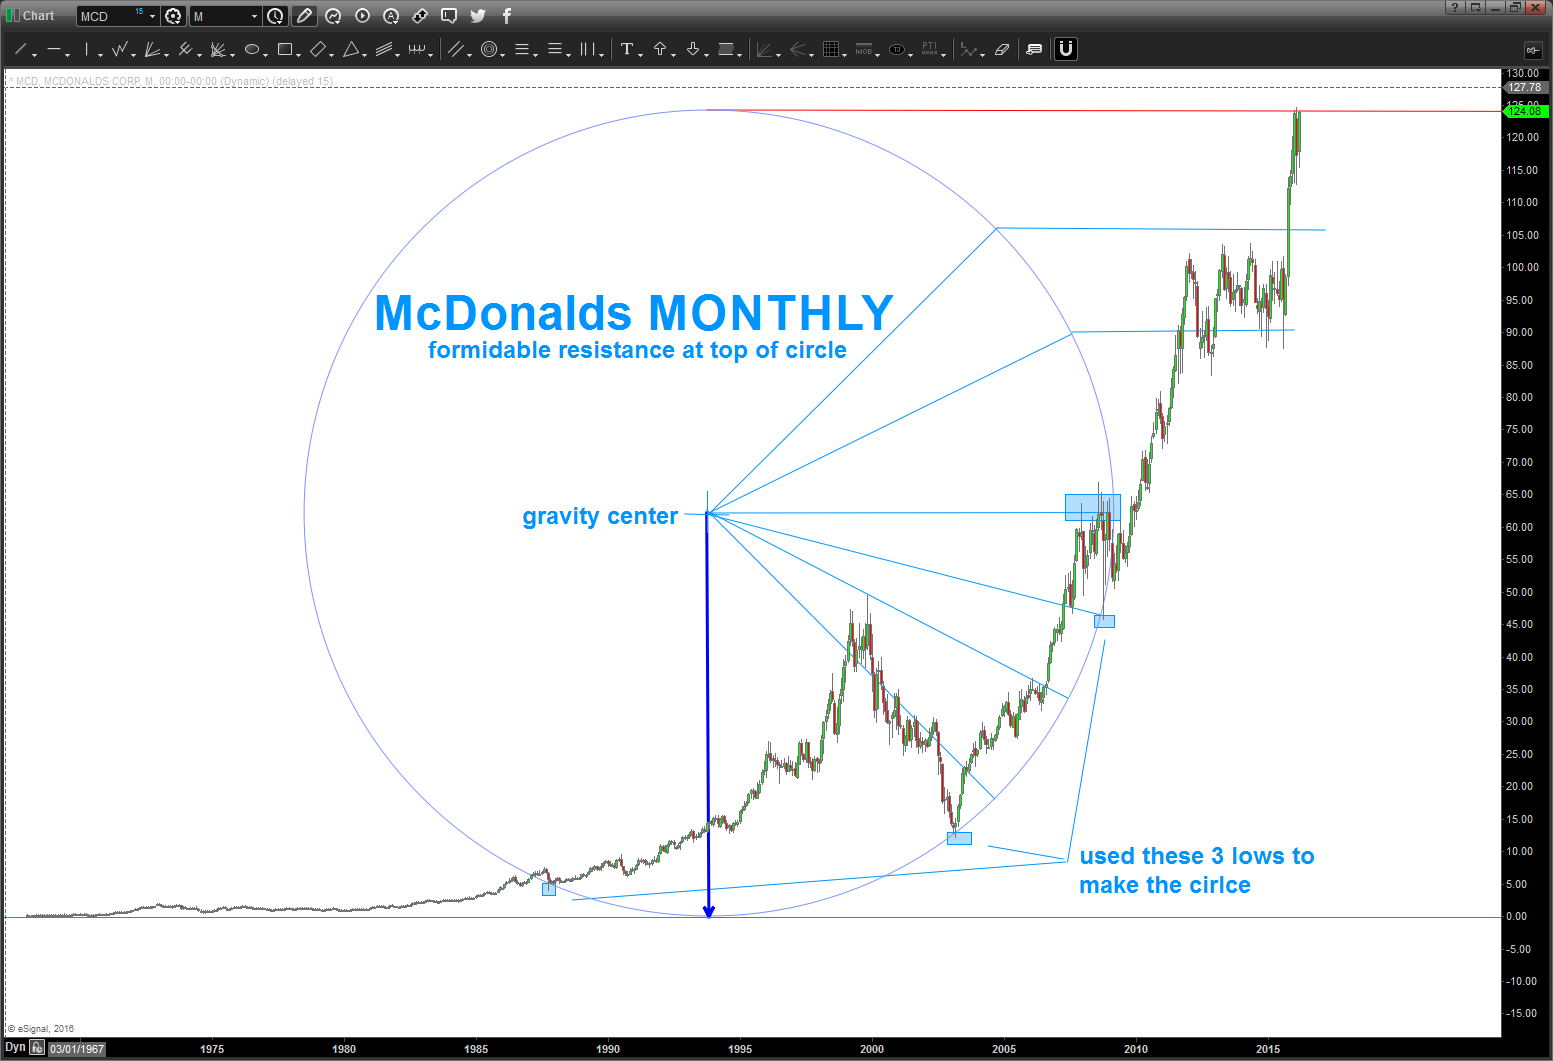
Again, if your a first time or new reader of the blog you’ll think “I curved fit this” or “did it first and then published it”. For those of you who know me – you know I wouldn’t do that. So, I didn’t …
What is going on here? Well, do you think, for one moment, that all the circles, squares, triangles, pyramids, etc. were built and created for the heck of it? OR, possibly, they were using these angles and natural order to convey higher, powerful but very simple truths?
If you study this chart, you’ll see that I drew “Gann Angles” (musical angles) from the gravity center and where the lines intersected the circle we had horizontal prices support or resistance and vertical time components.
Anyway, were tapping against the top of THE circle and w/ the bearish divergence present believe it might be time to have “one last” super size and step aside. WOULD NOT SHORT THIS STOCK UNTIL WE HAVE A MONTHLY/WEEKLY SIGNAL REVERSAL CANDLE. (the low of the high candle is taken out by a daily, weekly or monthly CLOSE below)
B
the importance of 3 waves …
Posted on March 19, 2016 2 Comments
I have had the unique opportunity to train under Connie Brown of http://www.aeroinvest.com. Frankly, she’s probably one of the best technical traders/analysts out there. She also told me to never count a wave again …! and if your going to count – just learn the corrective moves and look/watch for them.
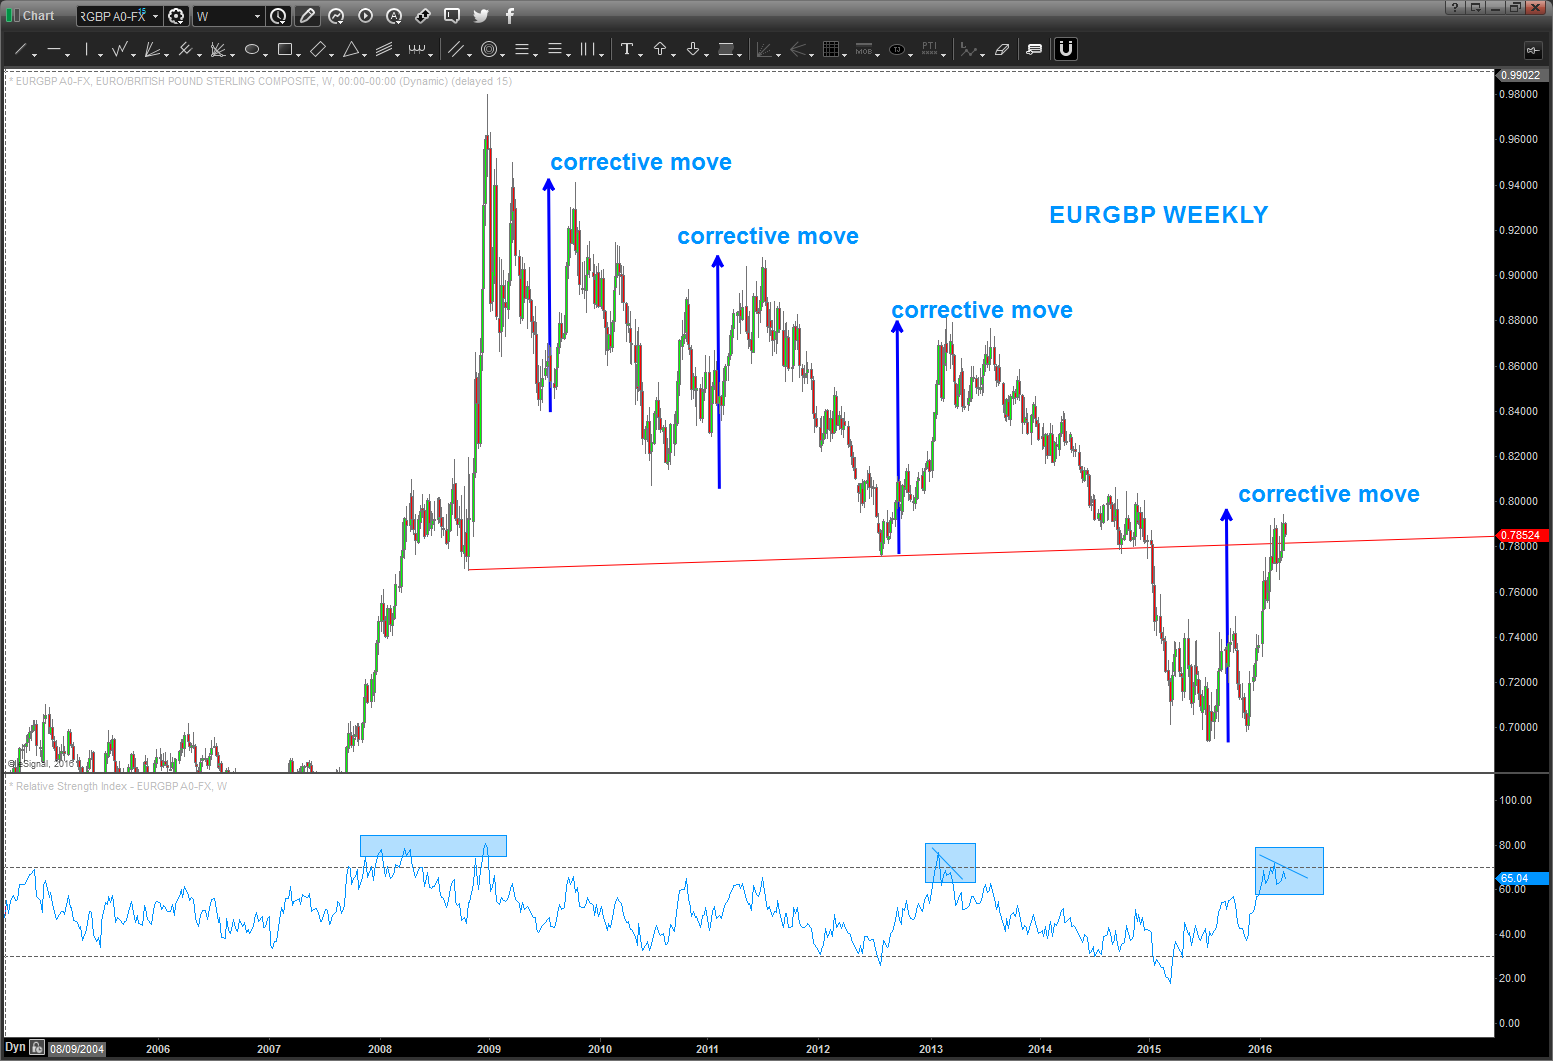
folks, that’s where the importance of 3 waves comes into play. particularly in the YEN and the EURO vs USD.
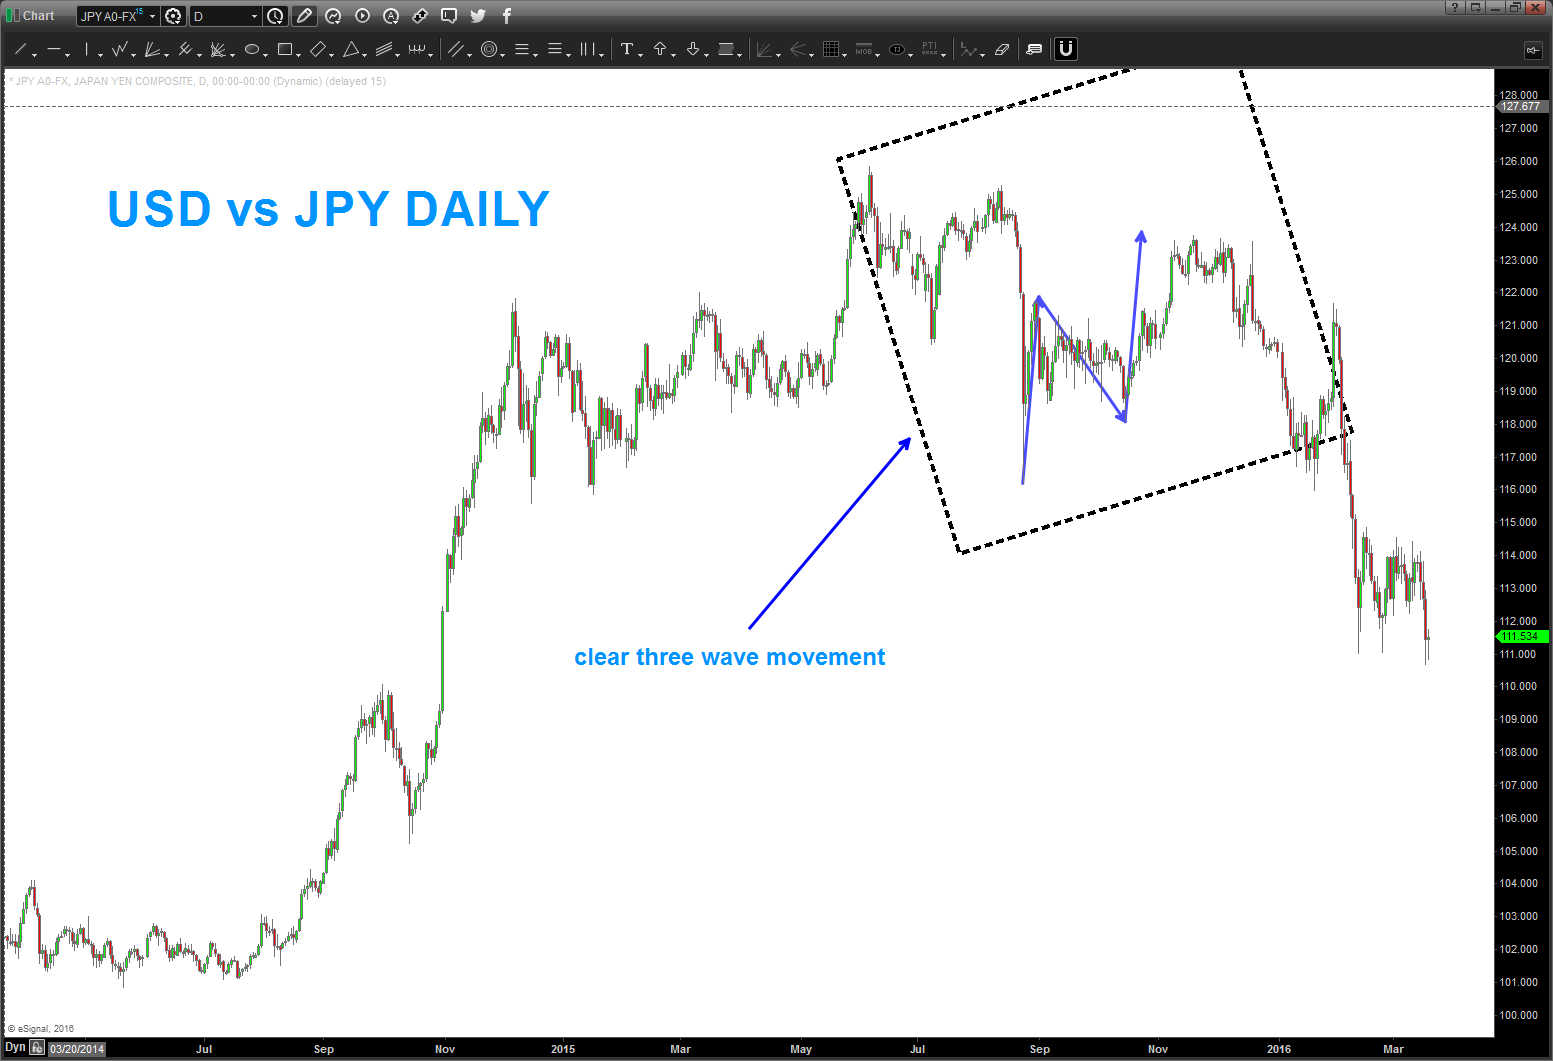
Here’s the YEN:
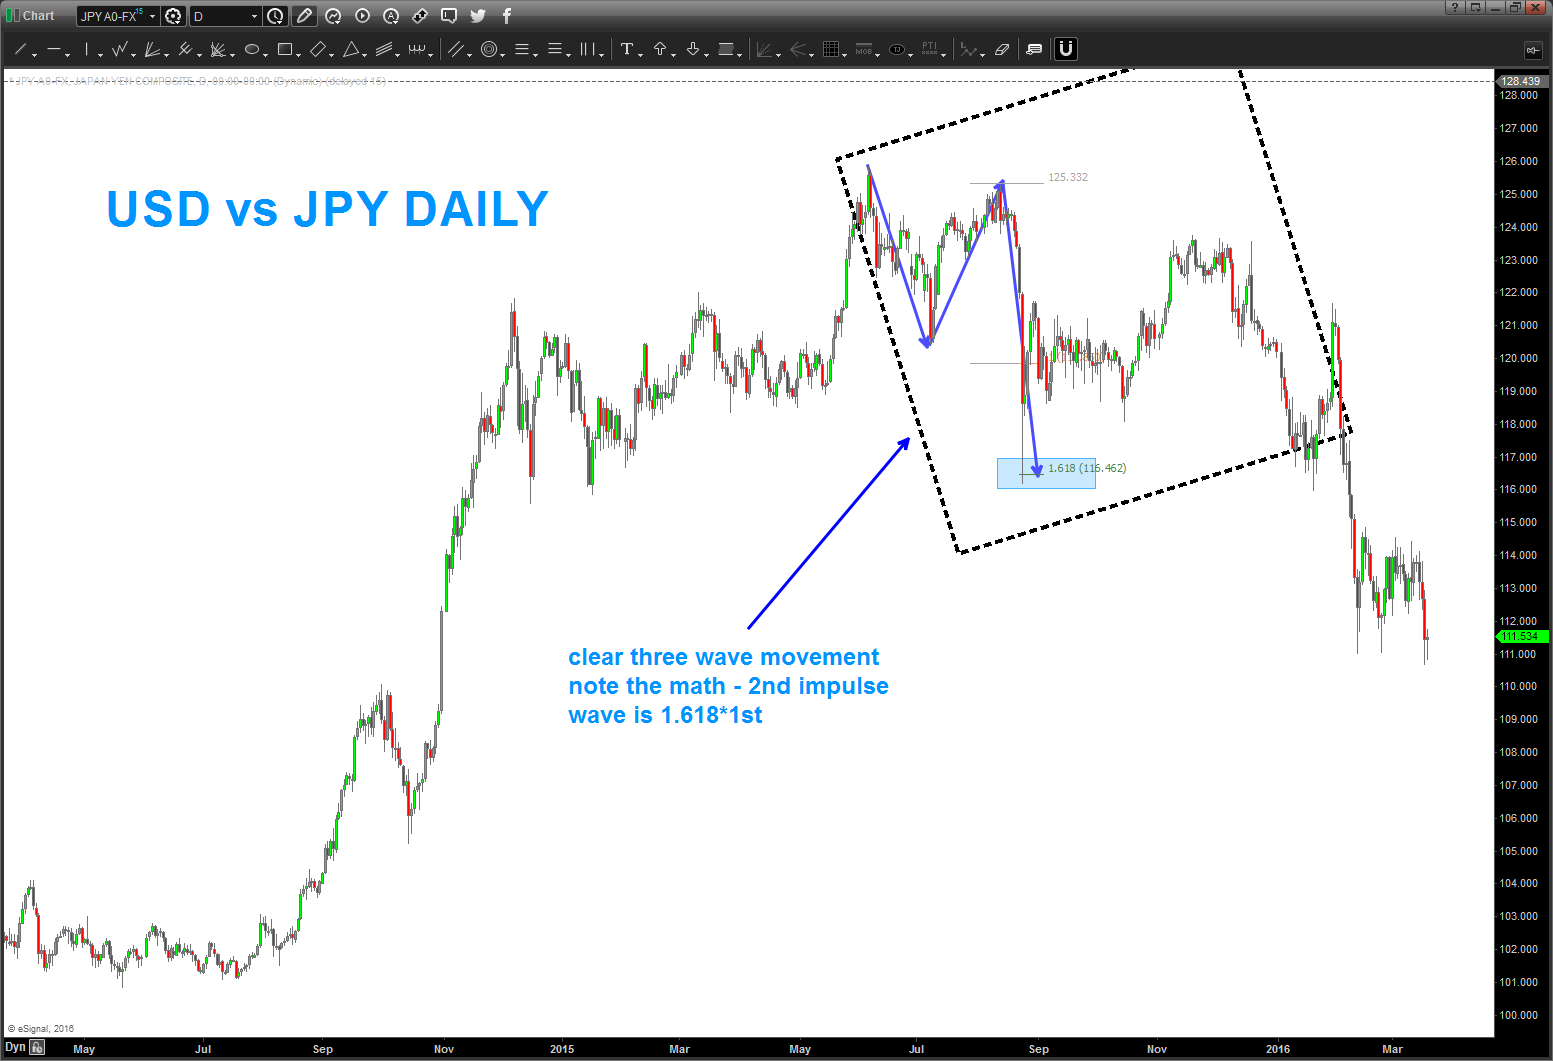
followed by another 3 wave movement – in this case the waves were symmetrical an exactly the same:
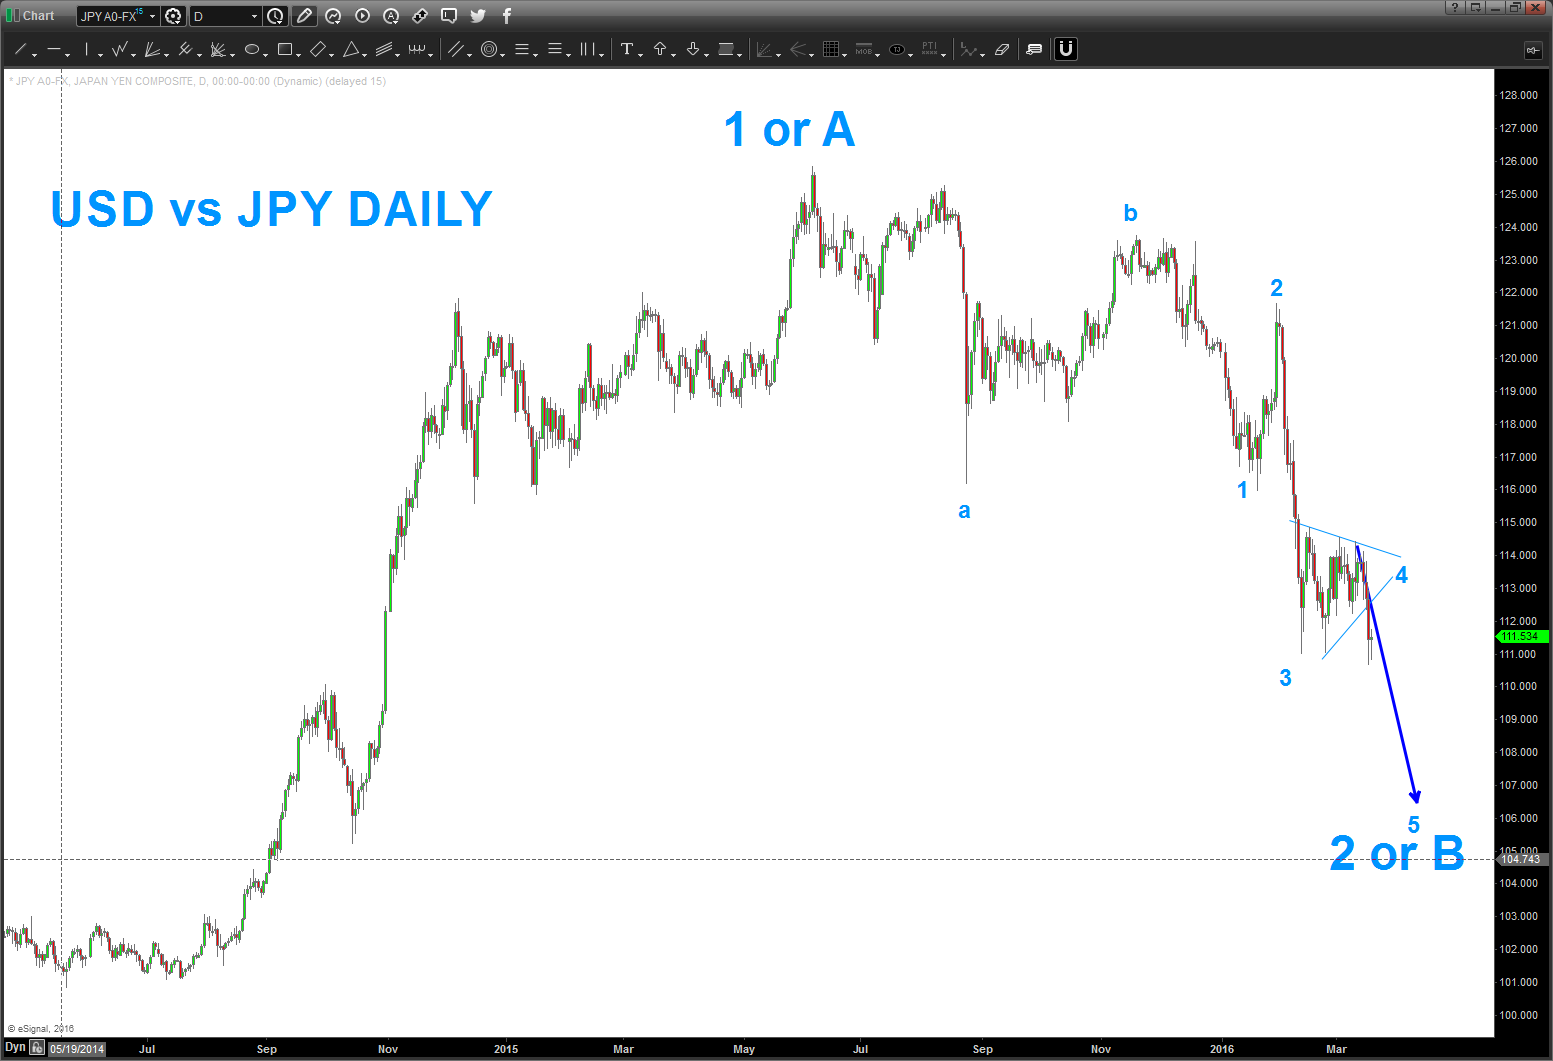
 so now we have carved out a 3-3-? correction. The “?” mark is for the last wave of this sequence. we have finished “a” in 3 waves and we have finished ‘b’ in 3 waves so now “c” HAS TO BE 5 waves ….it appears we broke down from the triangle a-b-c-d-e for 4 and we are in the 5th and final wave of this correction which I am labeling 2 or B and then off the $$$ goes against the YEN.
EURO vs USD – here’s the triangle look:
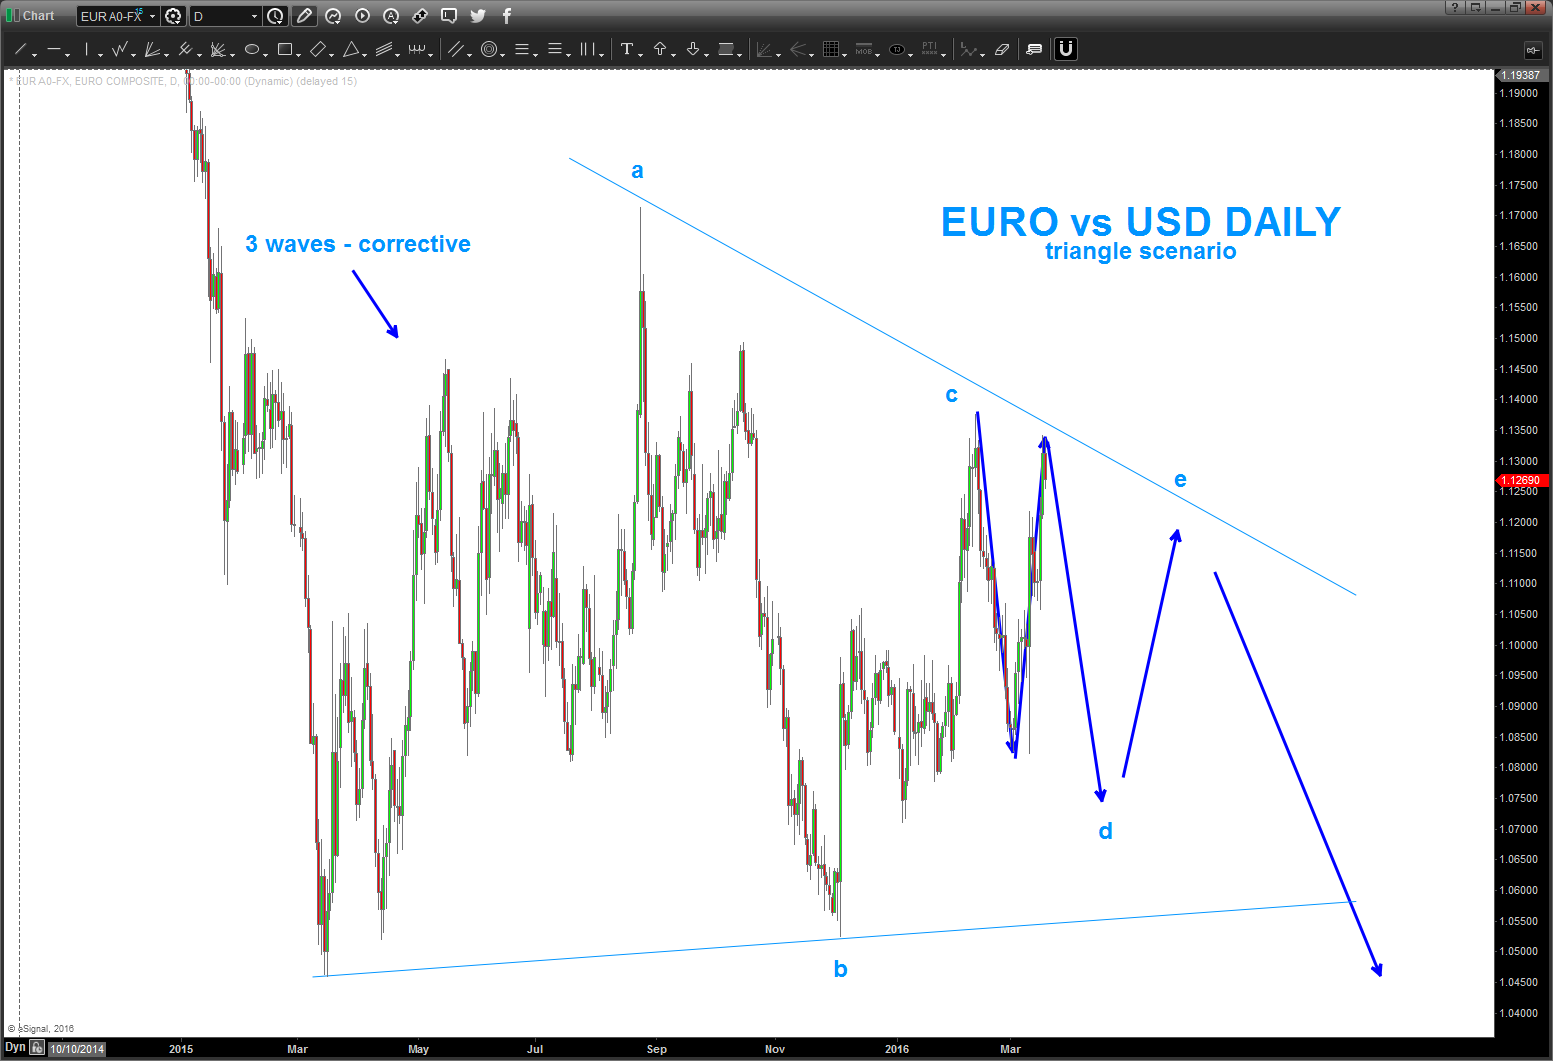
else – we have a more complex FLAT working ..
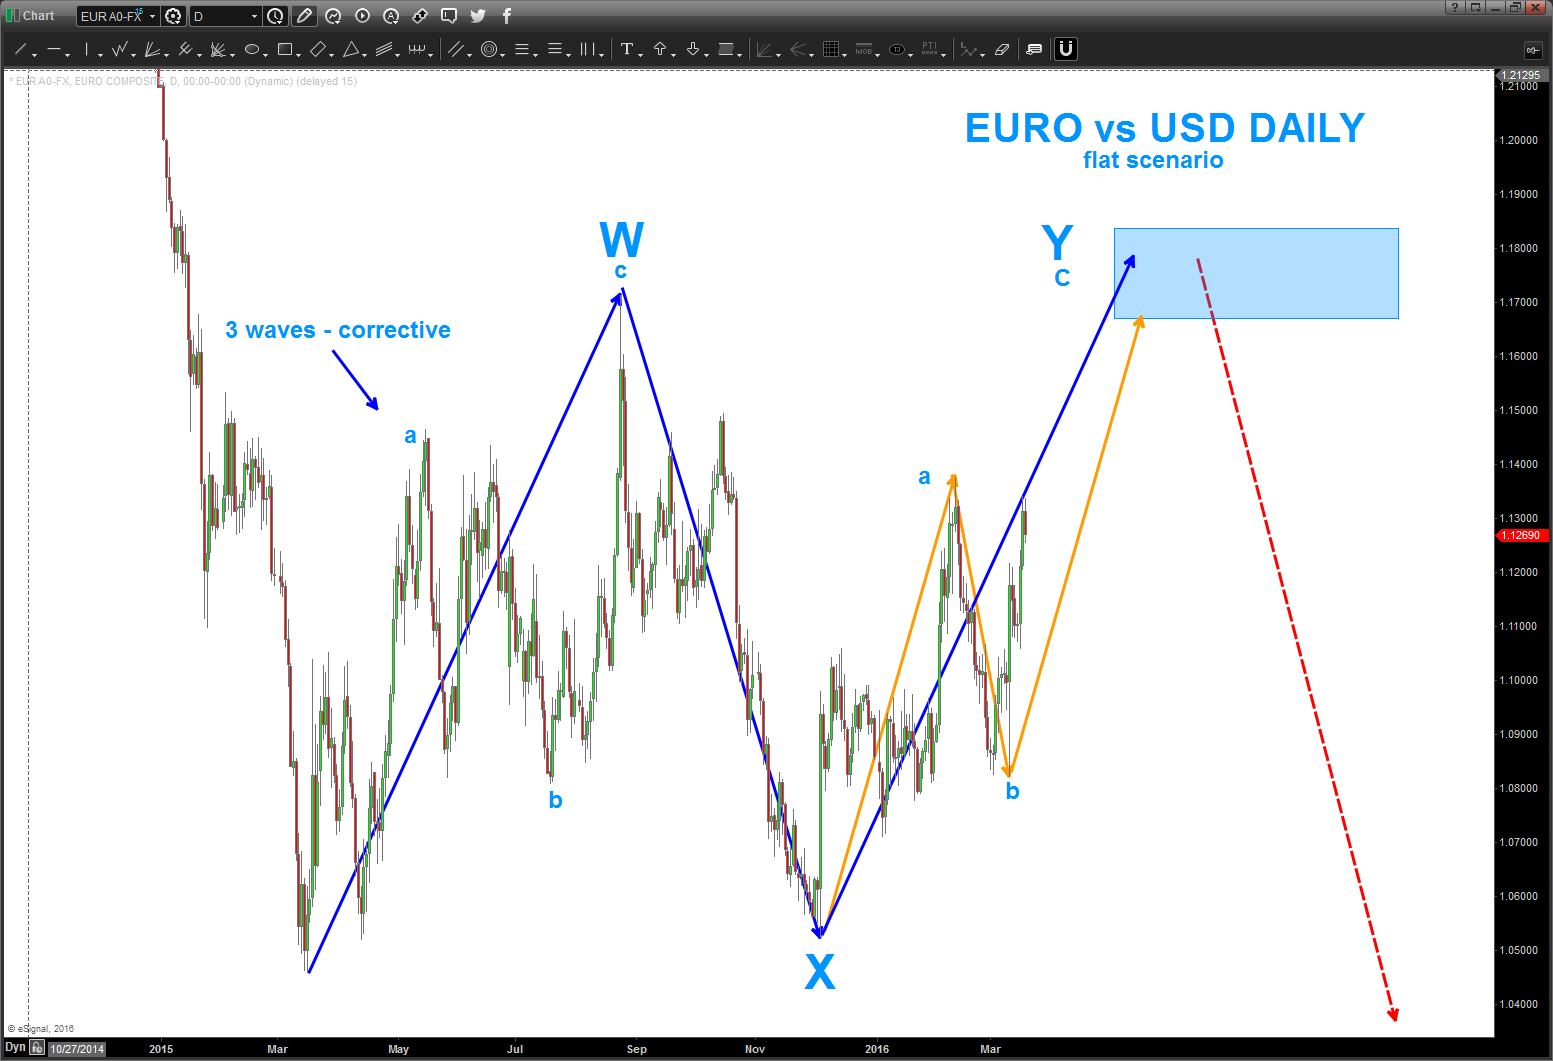
again, either way, I think that the EURO is STILL bearish and this complex correction is coming to an end …
the POUND is testing the 31 year trend line polarity – right now.
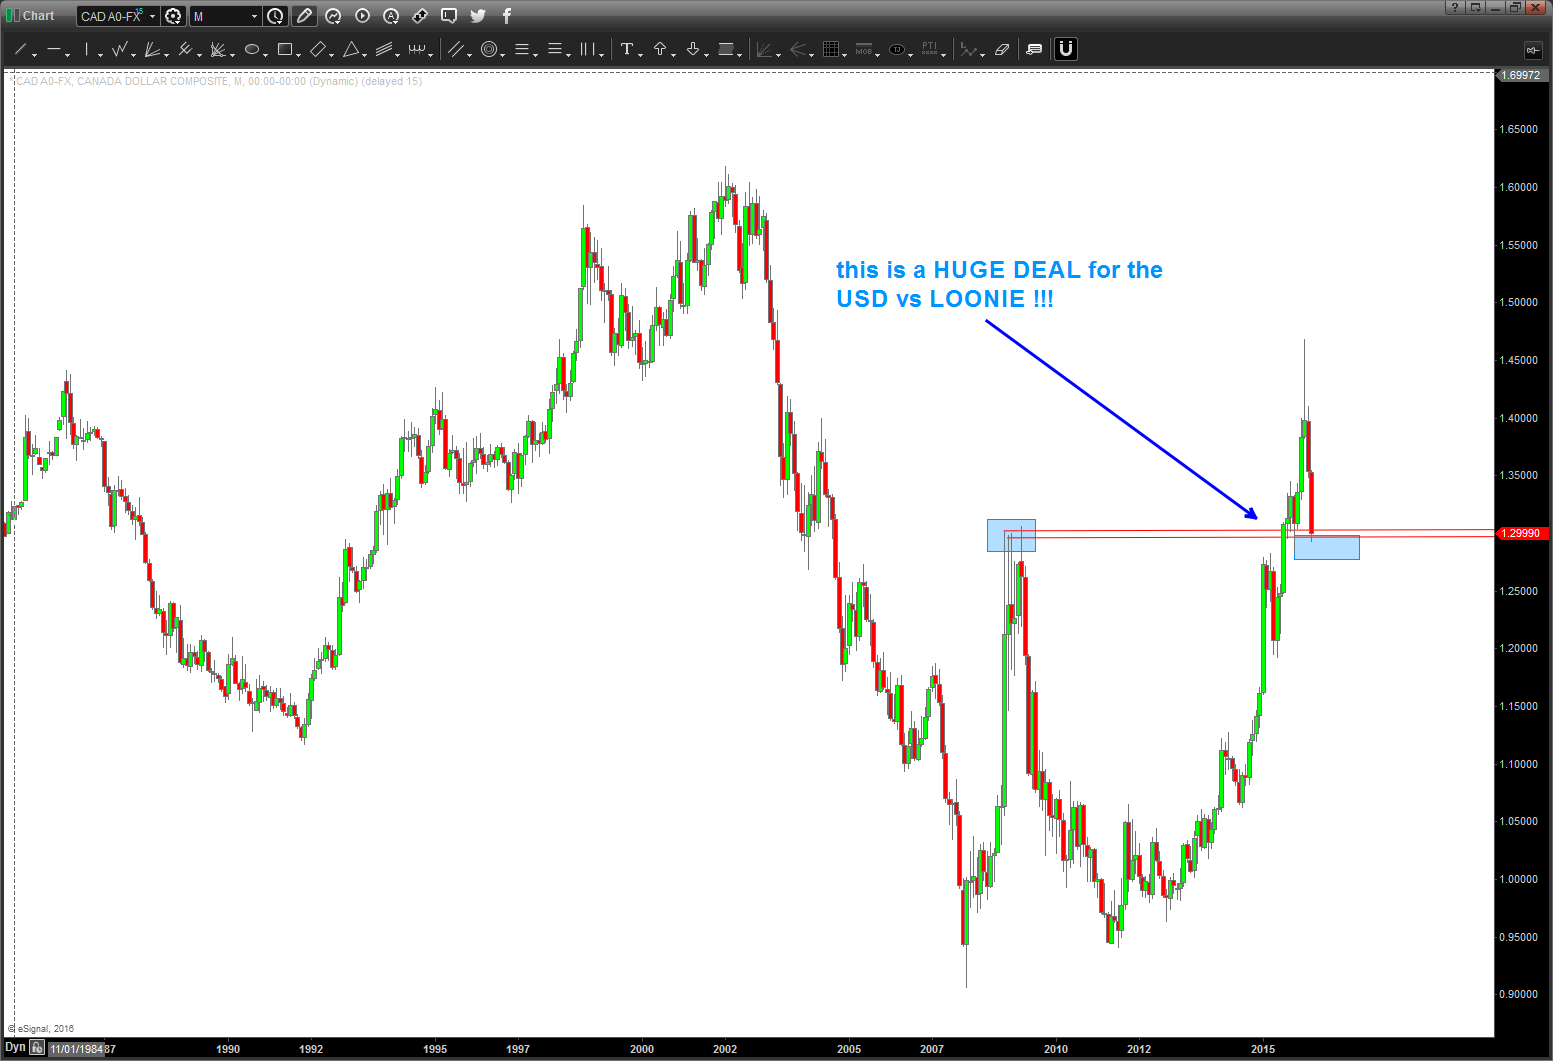
also, remember to watch this level on the LOONIE!
Aussie has been a monster …no pullback to even get in it, yet.
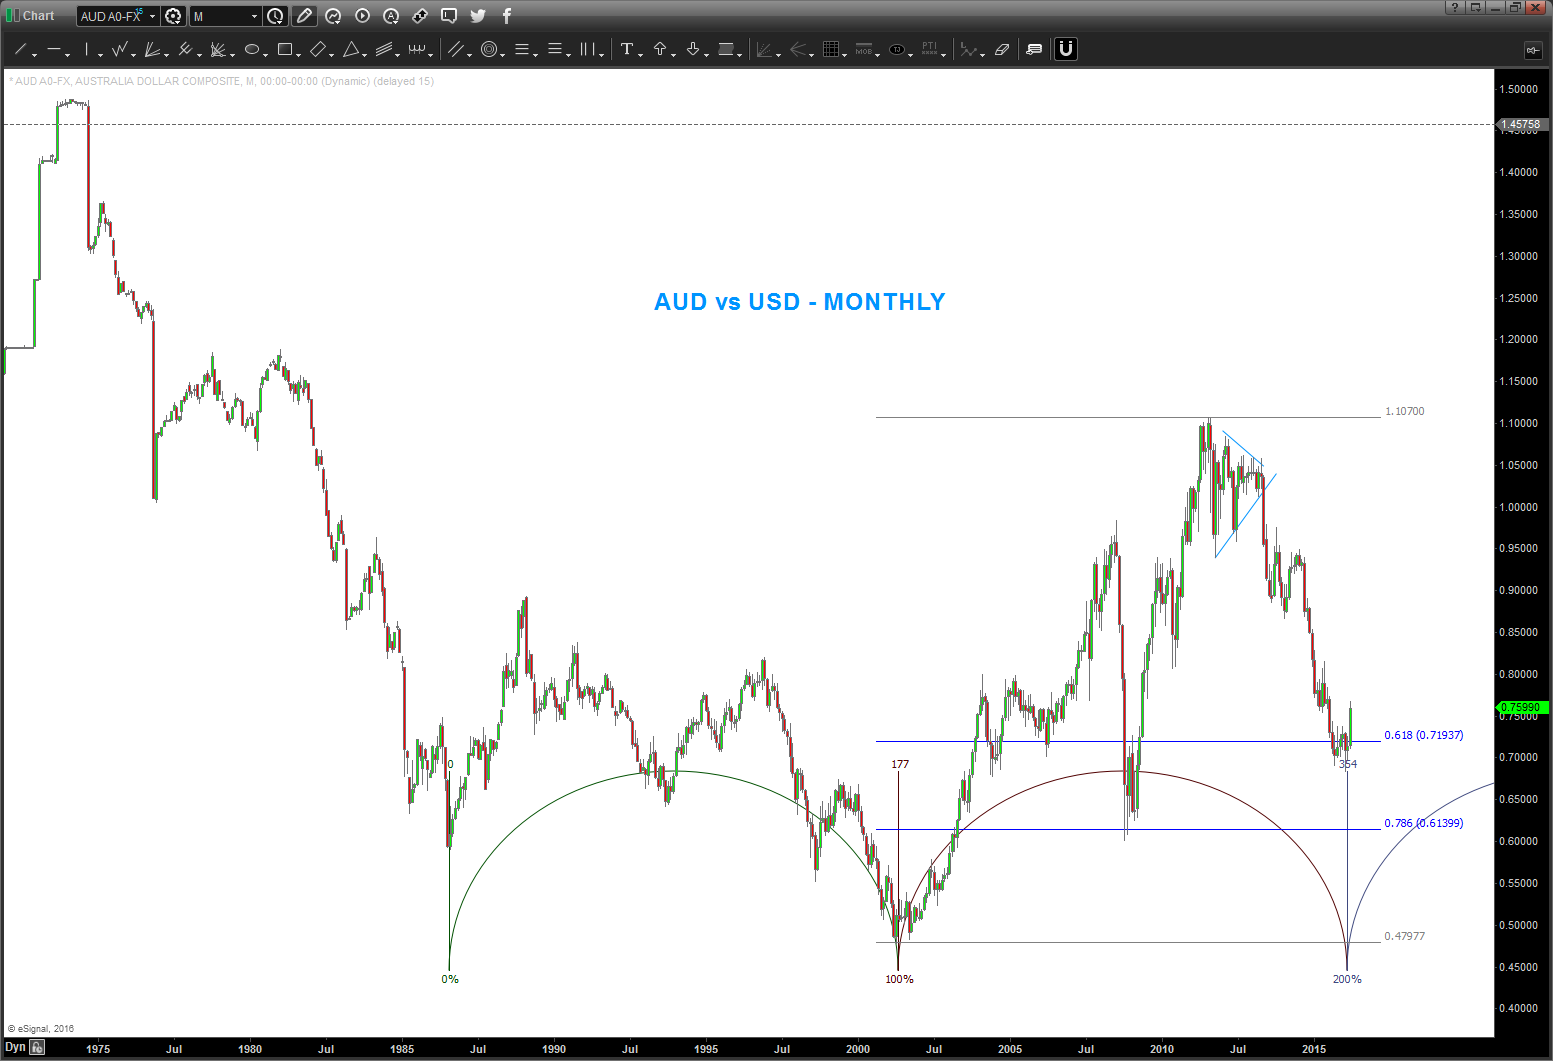
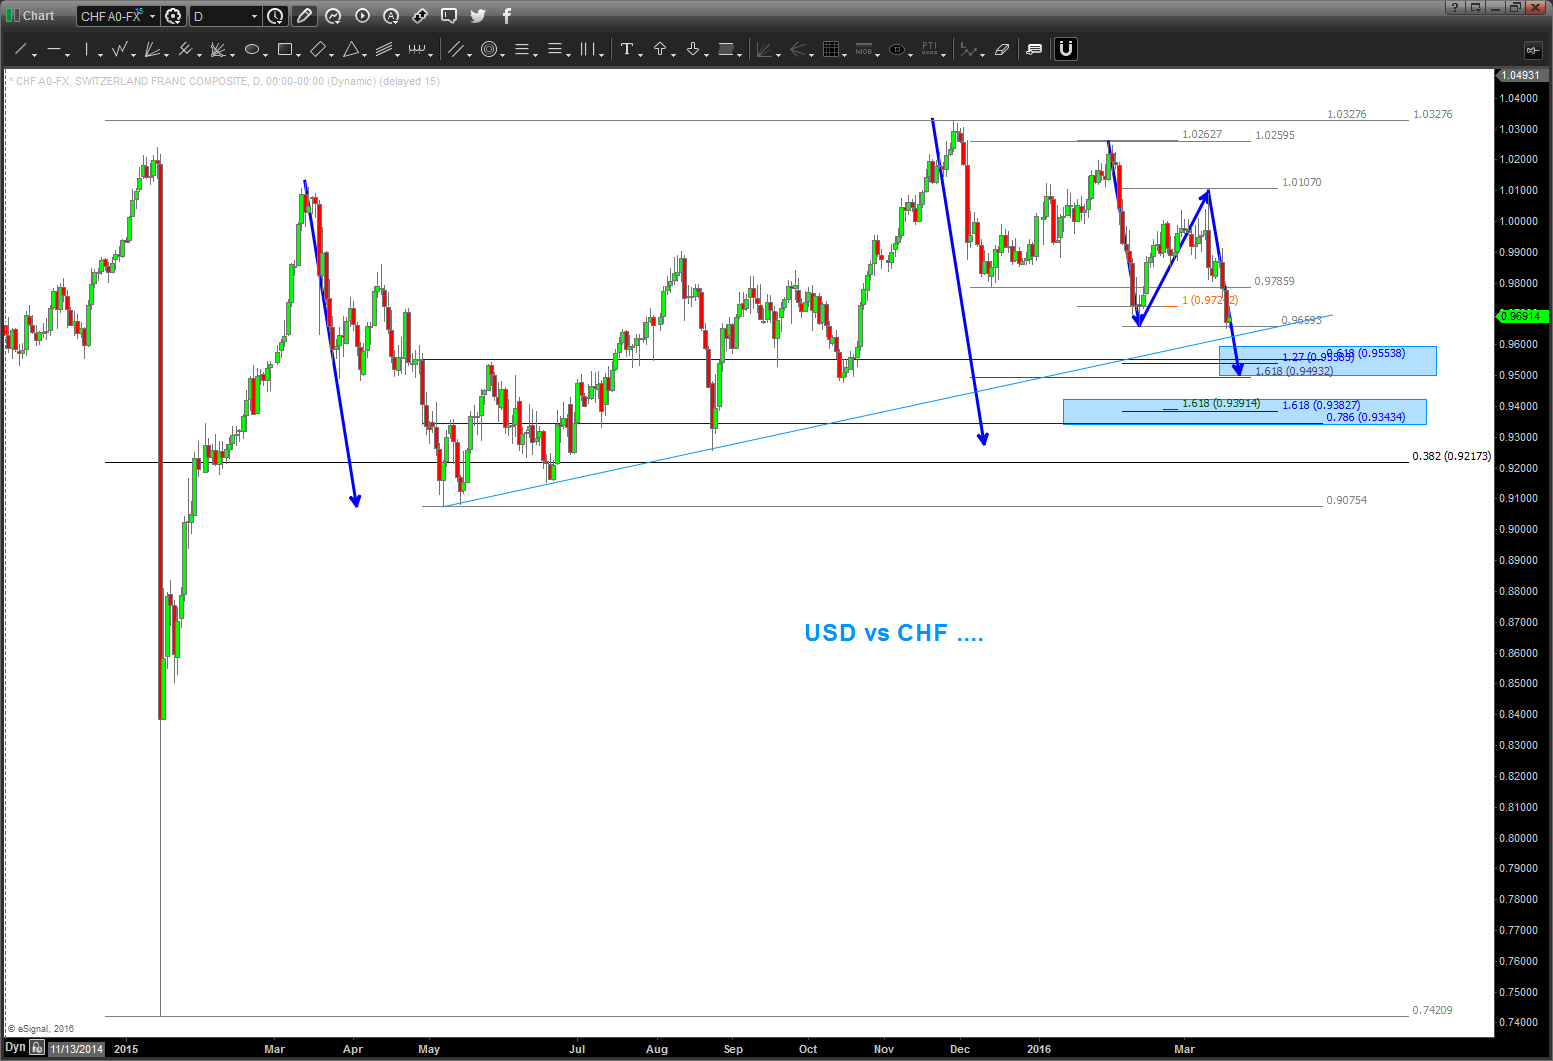
but here’s the issue … look at the 3 waves UP and then 3 waves down and then a near exact 1.618*a=c wave relationship that shows an expanded flat pattern. We’ve “bounced” almost a 1000 pips … but is that it and the down trend resumes?

so, as you can see, the USD is at a very critical juncture. IF all these patterns WORK then a dollar rally should begin – soon. Else, we have more dollar weakness coming.
