POUND PATTERN and ramifications
If you search my blog for ‘pound’ you’ll see that I’ve been scouting the 1.3932 level for a while.
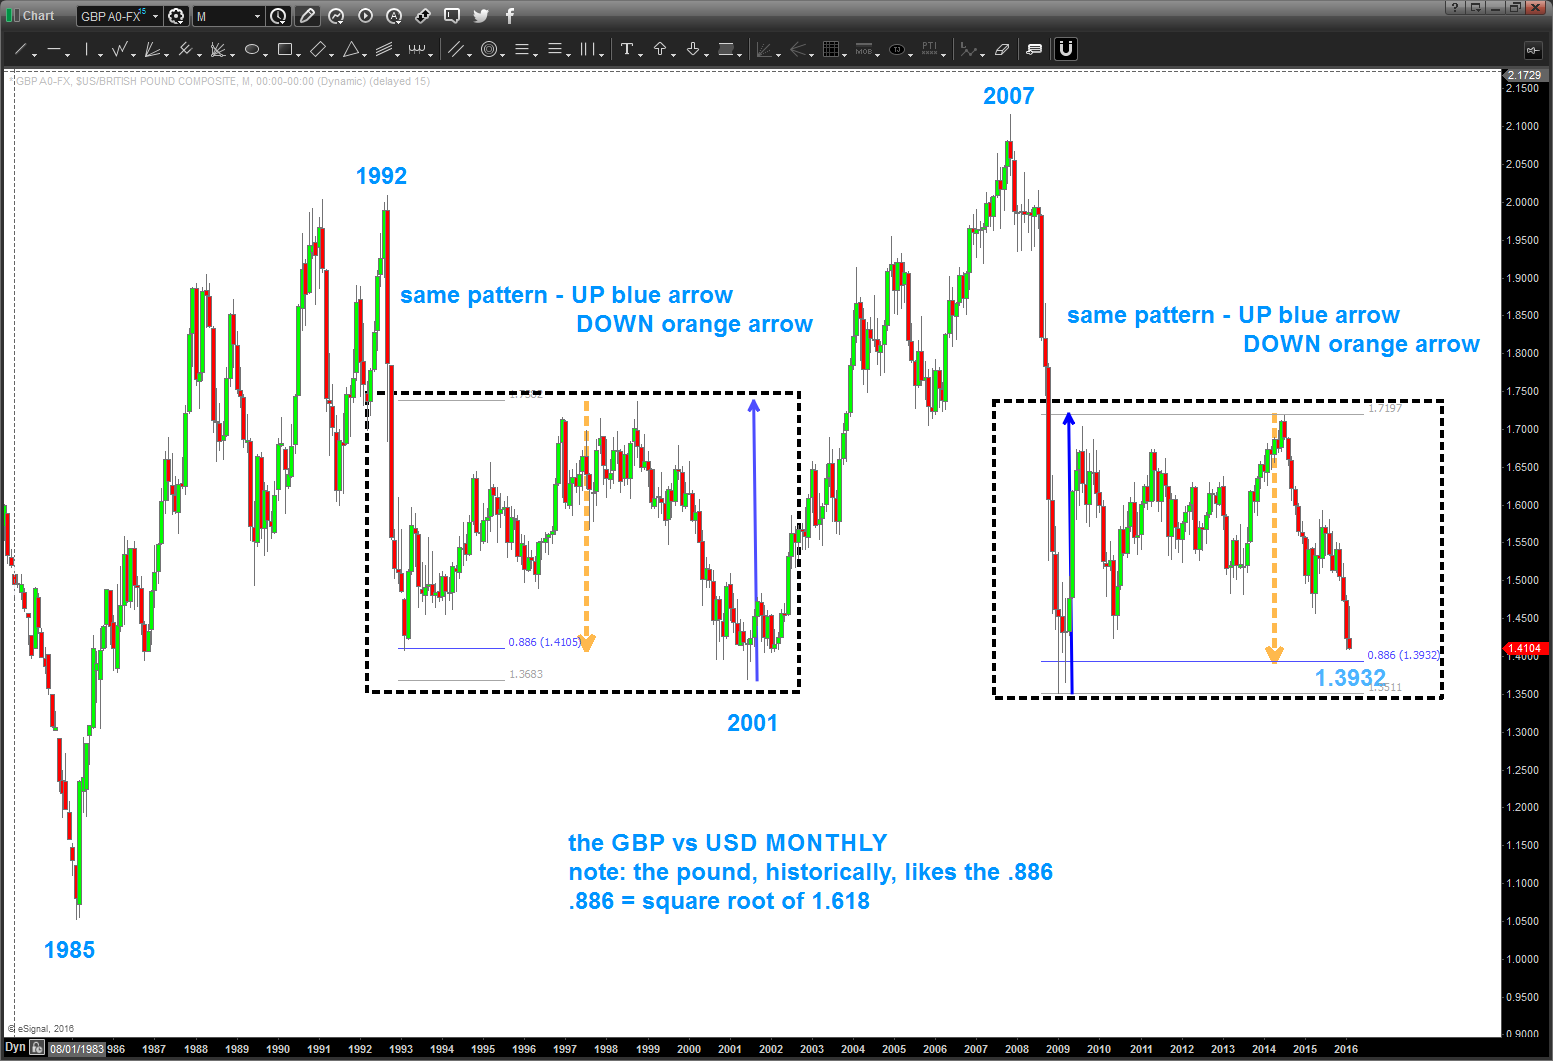
the first chart below is the PATTERN at play ….folks it’s all numbers and geometry. the Pound went UP the same amount (blue arrows) and now it’s approaching the same amount down (Orange Arrows). that’s it … nothing about exiting the EURO Zone or PMI or any of that other stuff.
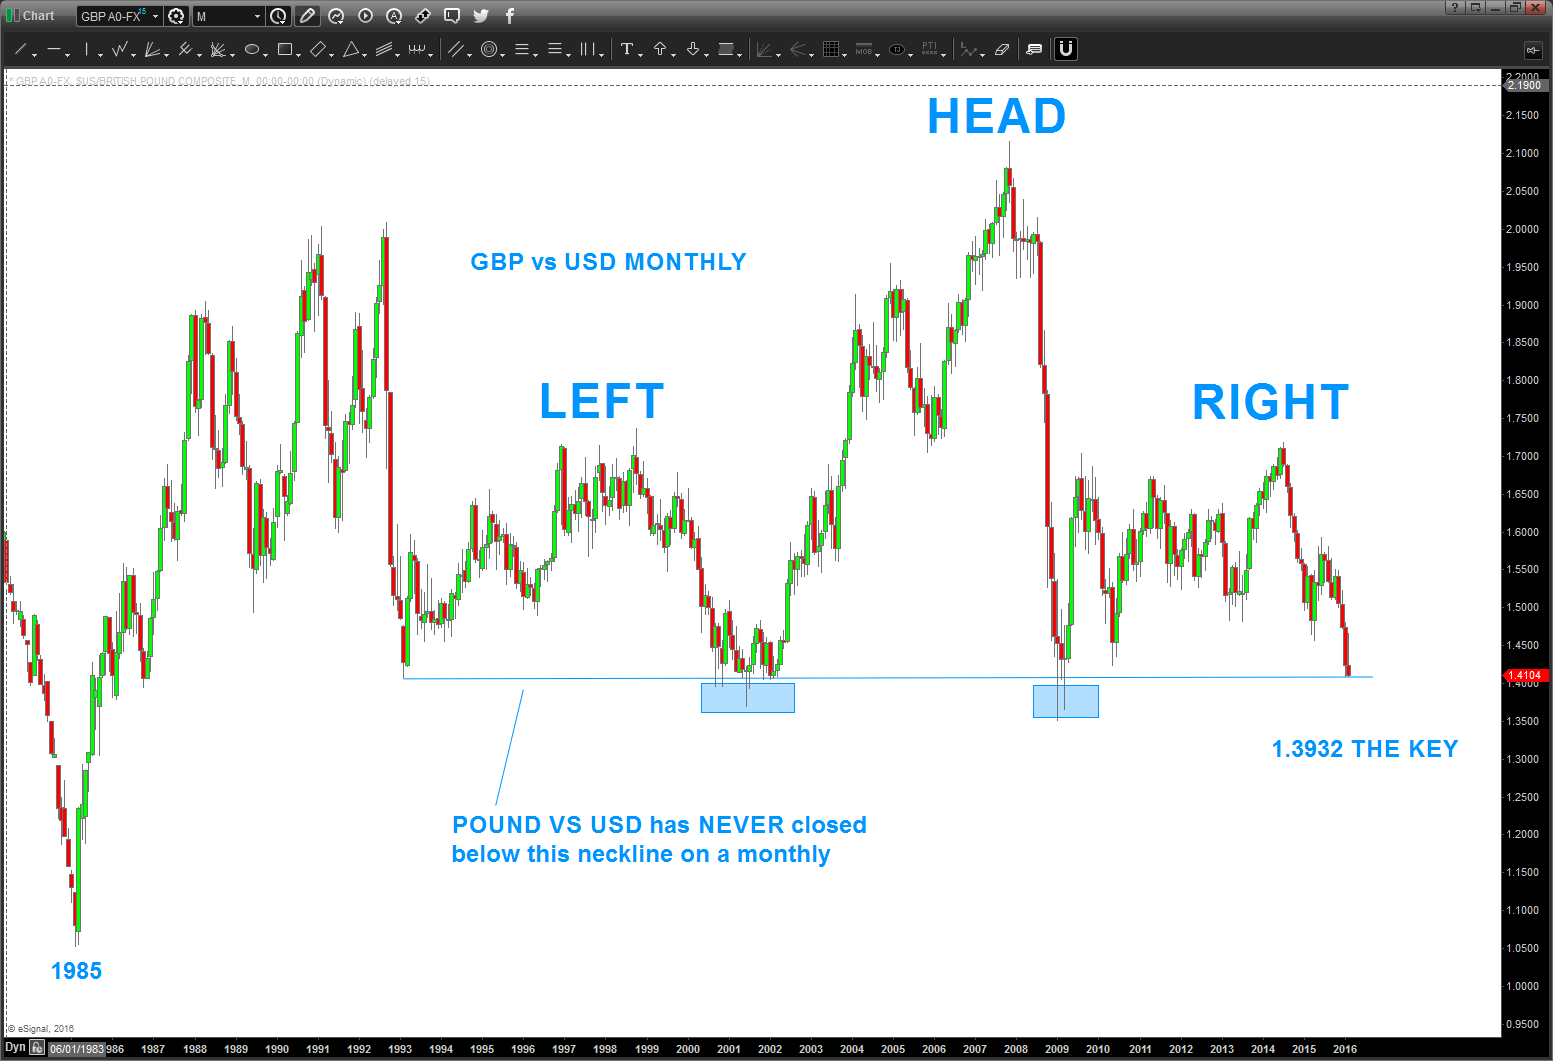
the ramifications, shown in the second chart – are big. As you can see, we have a neckline (horizontal light blue line) that has NEVER had a monthly close below. It certainly “tried” 6 times (folks that’s about 6 months worth of time) in 2001-2002 and then in the financial panic it spiked below a couple times but, ultimately, it held.
make no doubt, if we close thru the PATTERN level (1.3932) and have thrust and close below the neckline on a monthly basis (that’s the key) then things could get really ugly over in England.