TWTR angles …and Jupiter
Posted on February 28, 2016 Leave a Comment
it’s a common practice – an a good one – to draw “trend lines” from high to high or low to low.
essentially, trying to connect highs and lows. it does work …but if you stop and think about it, what are trend lines?
they are points in PRICE and TIME that the market balances and either bounces off of them OR goes thru them and, as a chartist, you hit erase and get back to work. you never know “which” one is going to be the “best” or “work” but they do work.
so I like to play around w/ trend lines …
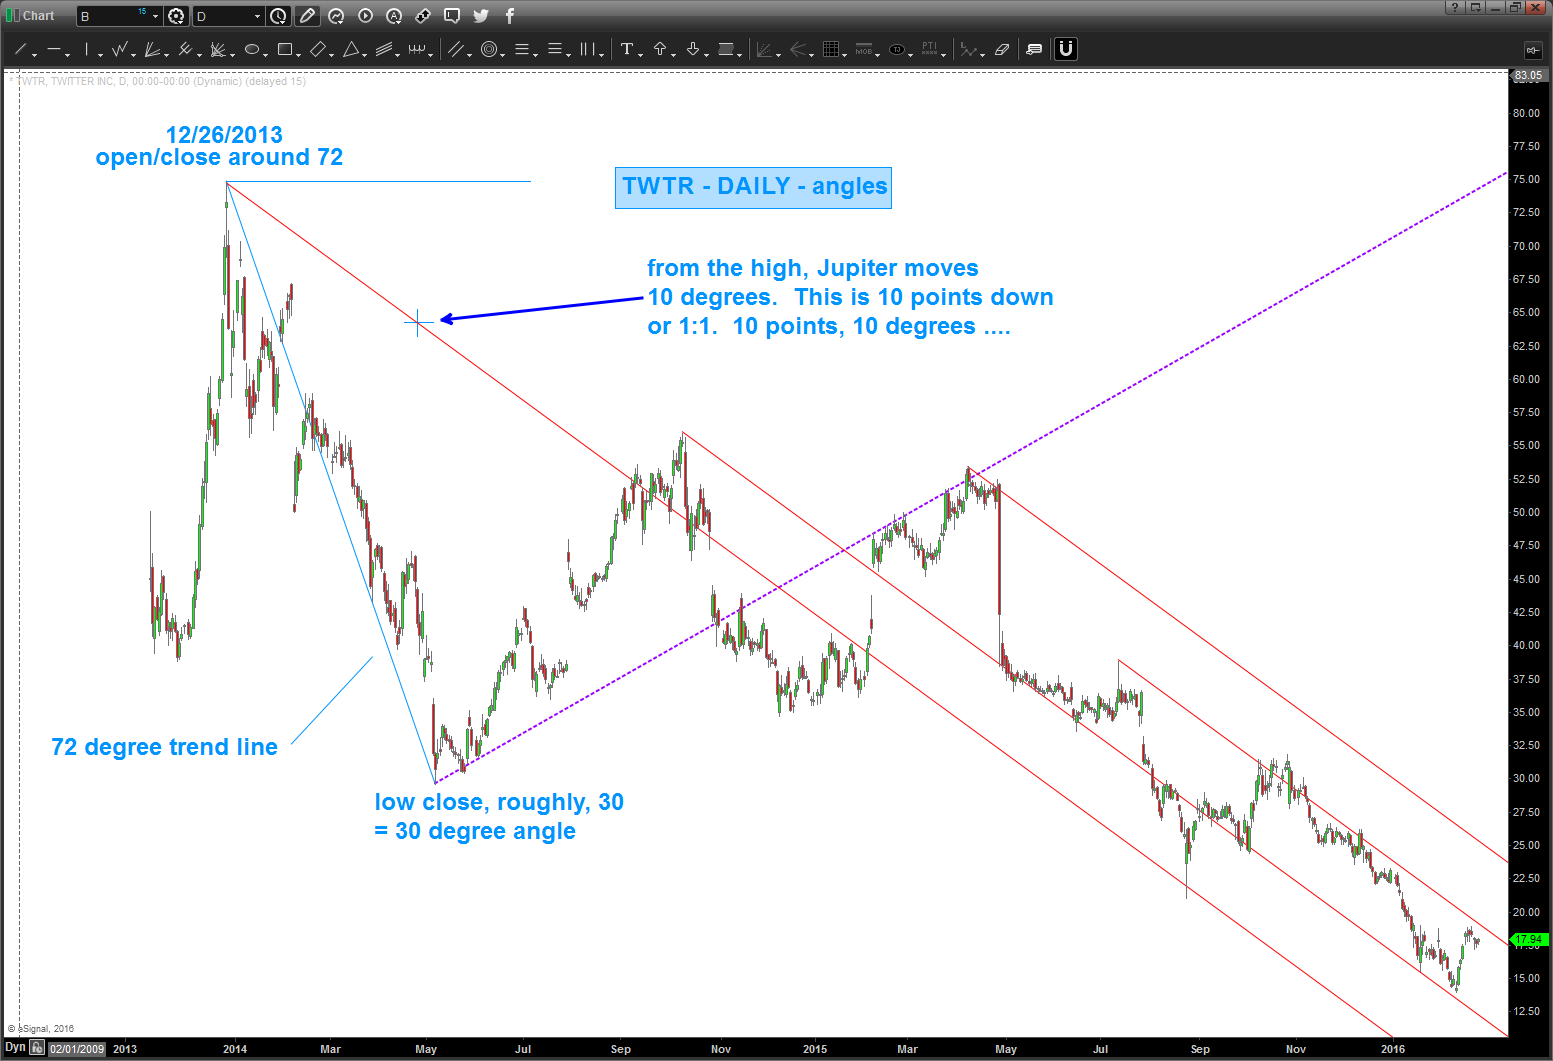
- if Twitter, on 12.26.2013 topped (O/C) around 72 bucks and started down THEN how about a 72 degree trend line down?
- if Twitter then bottomed around 30, how about a 30 degree trend line up …?
- if the market vibrates ( I believe it does and truly DO NOT CARE if you do – just saying what if) then energy foot prints from the planets might leave a signature? perhaps?
- so, using HELIOCENTRIC (sun centered) movements what if we did a 1:1 correspondence of “points moved to distance traveled?”
- let’s use easy numbers like – say 10.
- so, move Jupiter 10 degrees helio and move price 10 degrees and draw a trend line thru that …?
- might be crazy but that Jupiter Helio constant movement give us a nice slope, doesn’t it?
again, it’s a sunday morning and I’m just messing around …
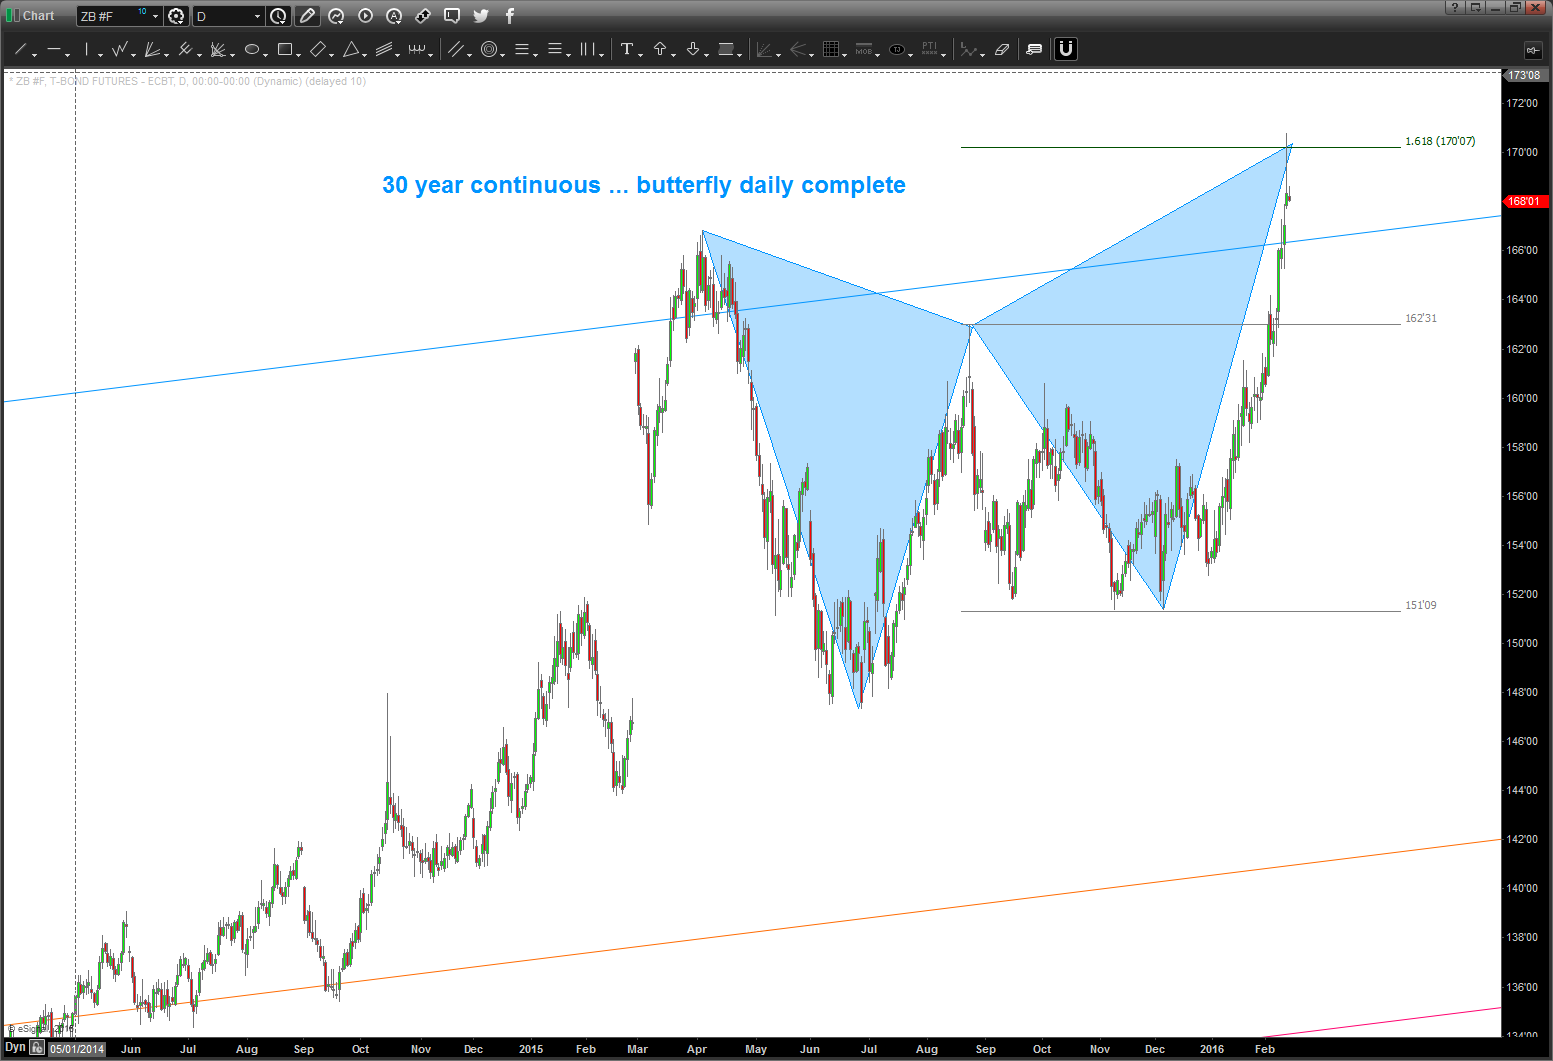
update to TLT and 30 year continuous futures …
Posted on February 27, 2016 2 Comments
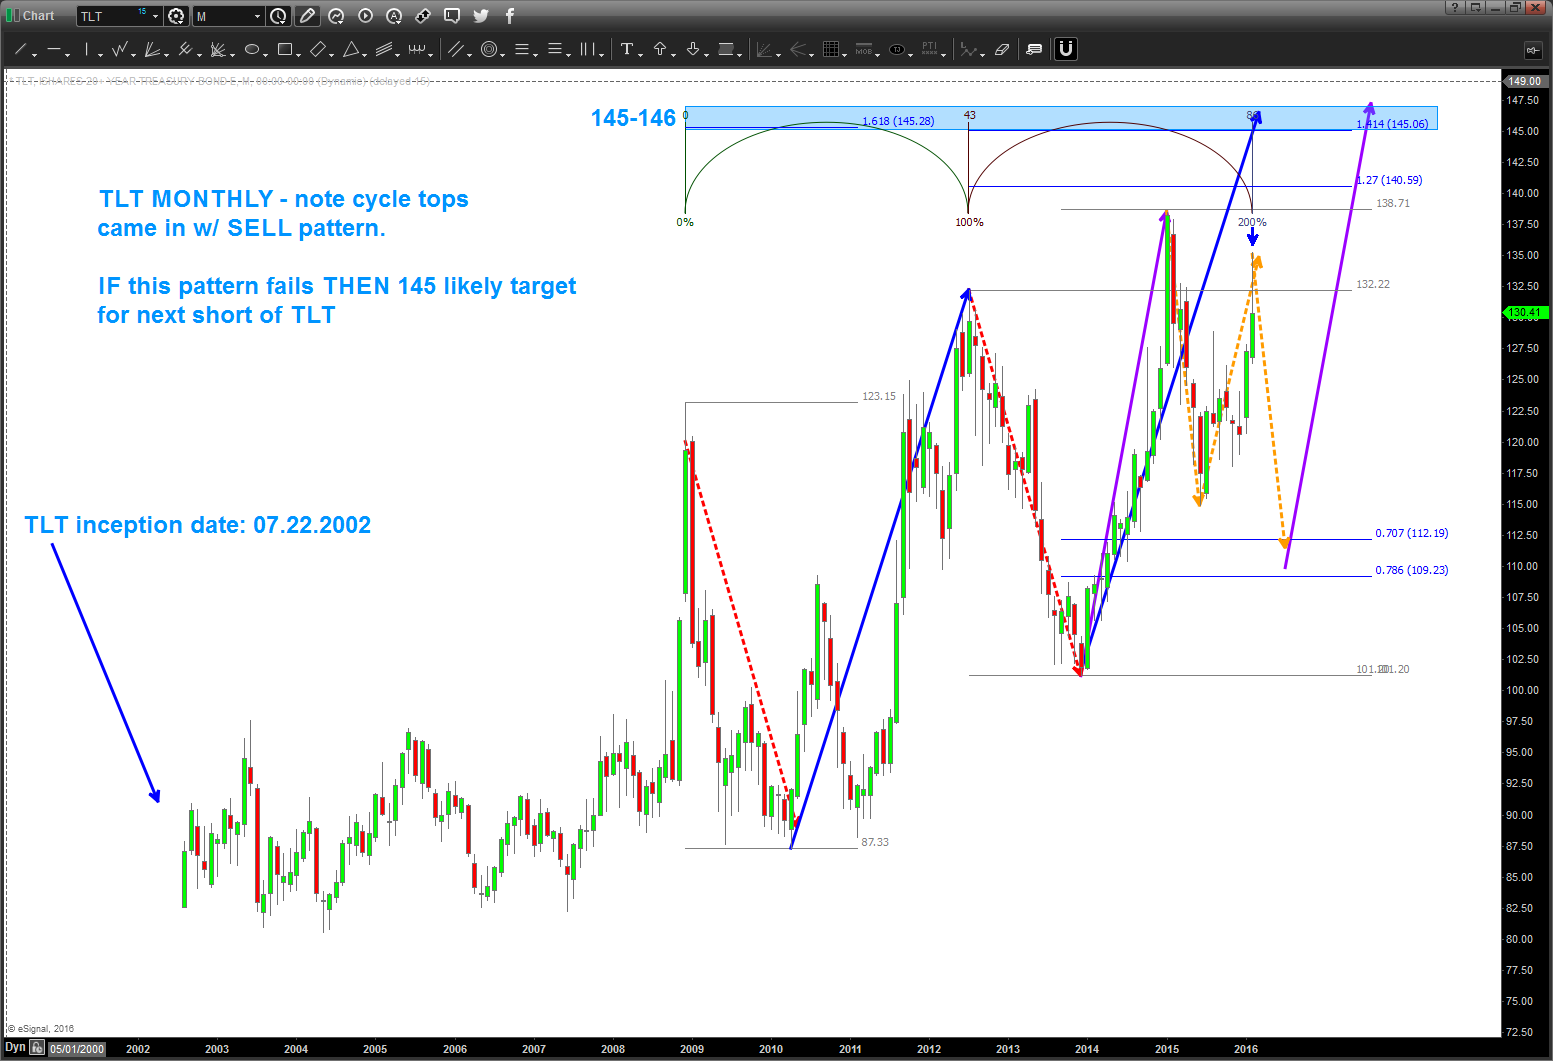
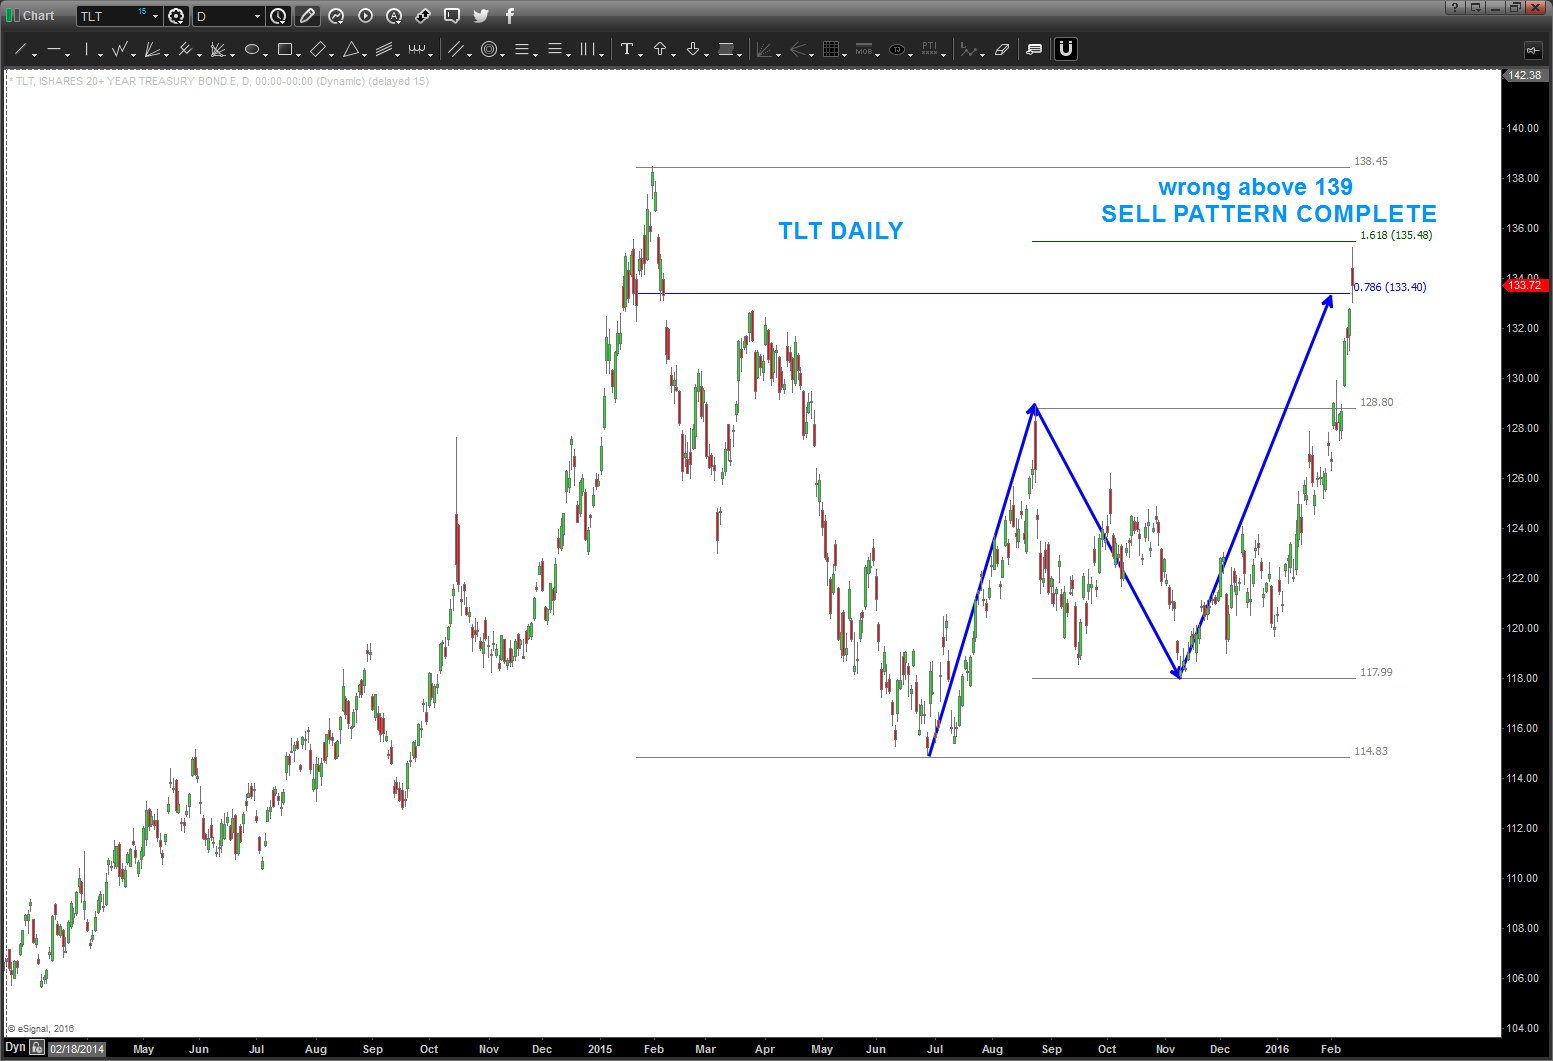
02/27/16 – TLT, if correct, should be losing steam over the coming days/weeks. Initial target appears to be 109-111.
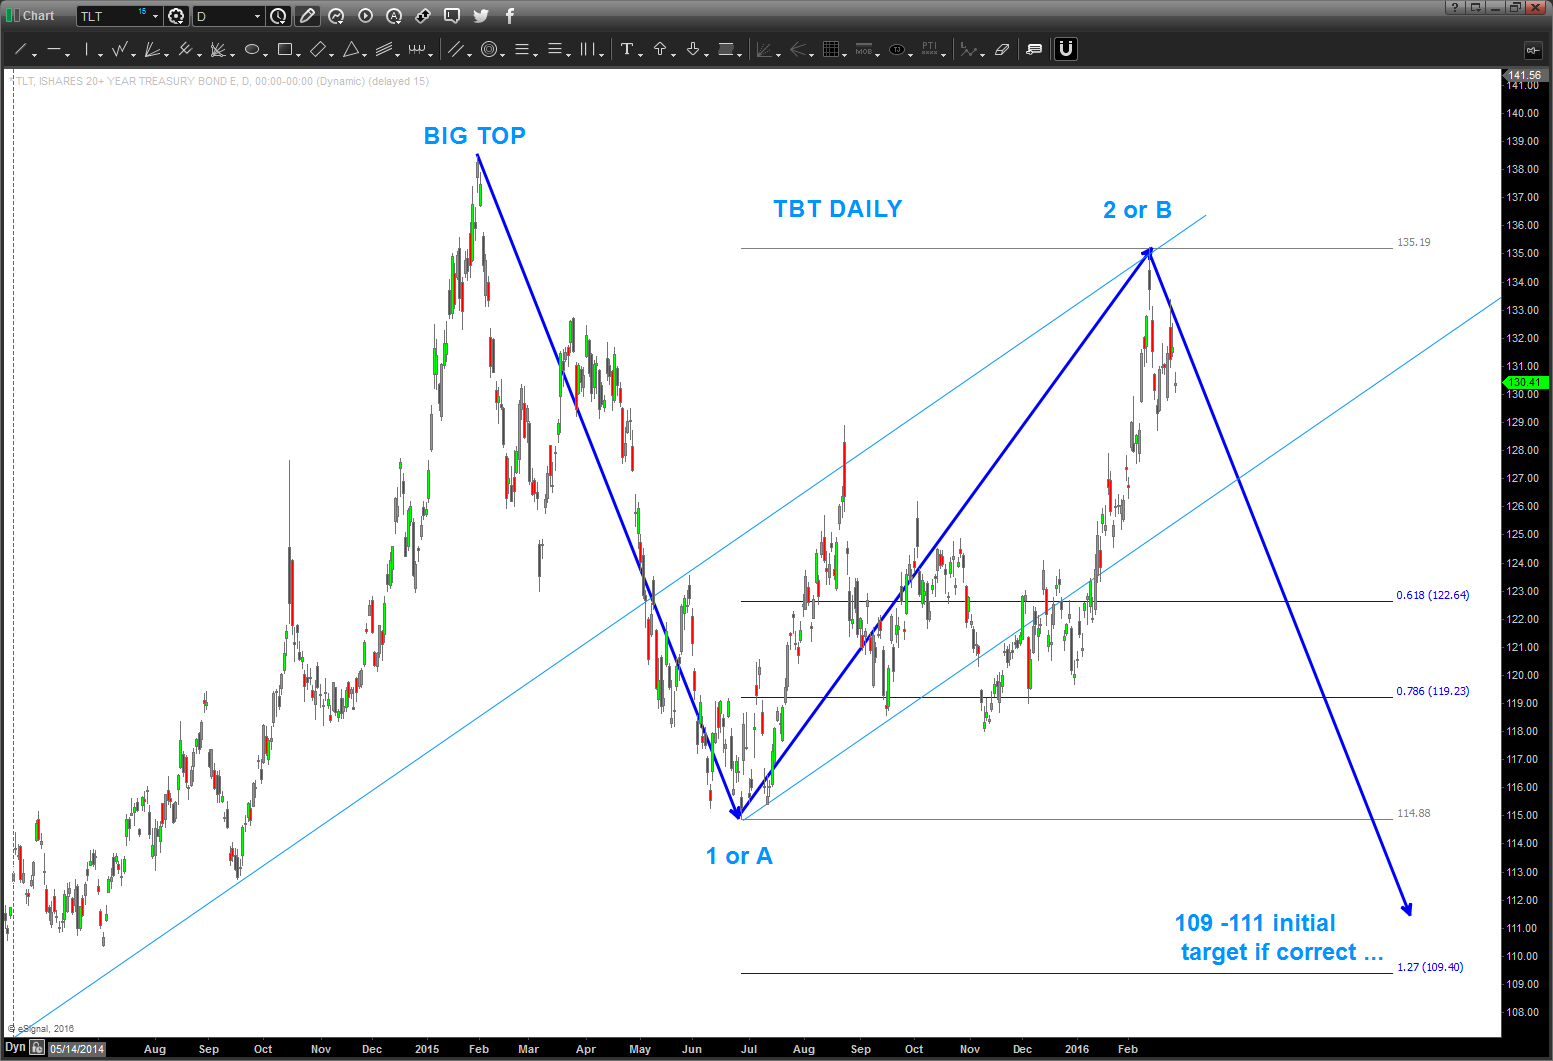
note, if this pattern fails, then 145 is a very strong target as shown below. also note, the cycle top times came in w/ pattern completion. right now, favor the short side into the 109-111 area but do want to show possibilities.
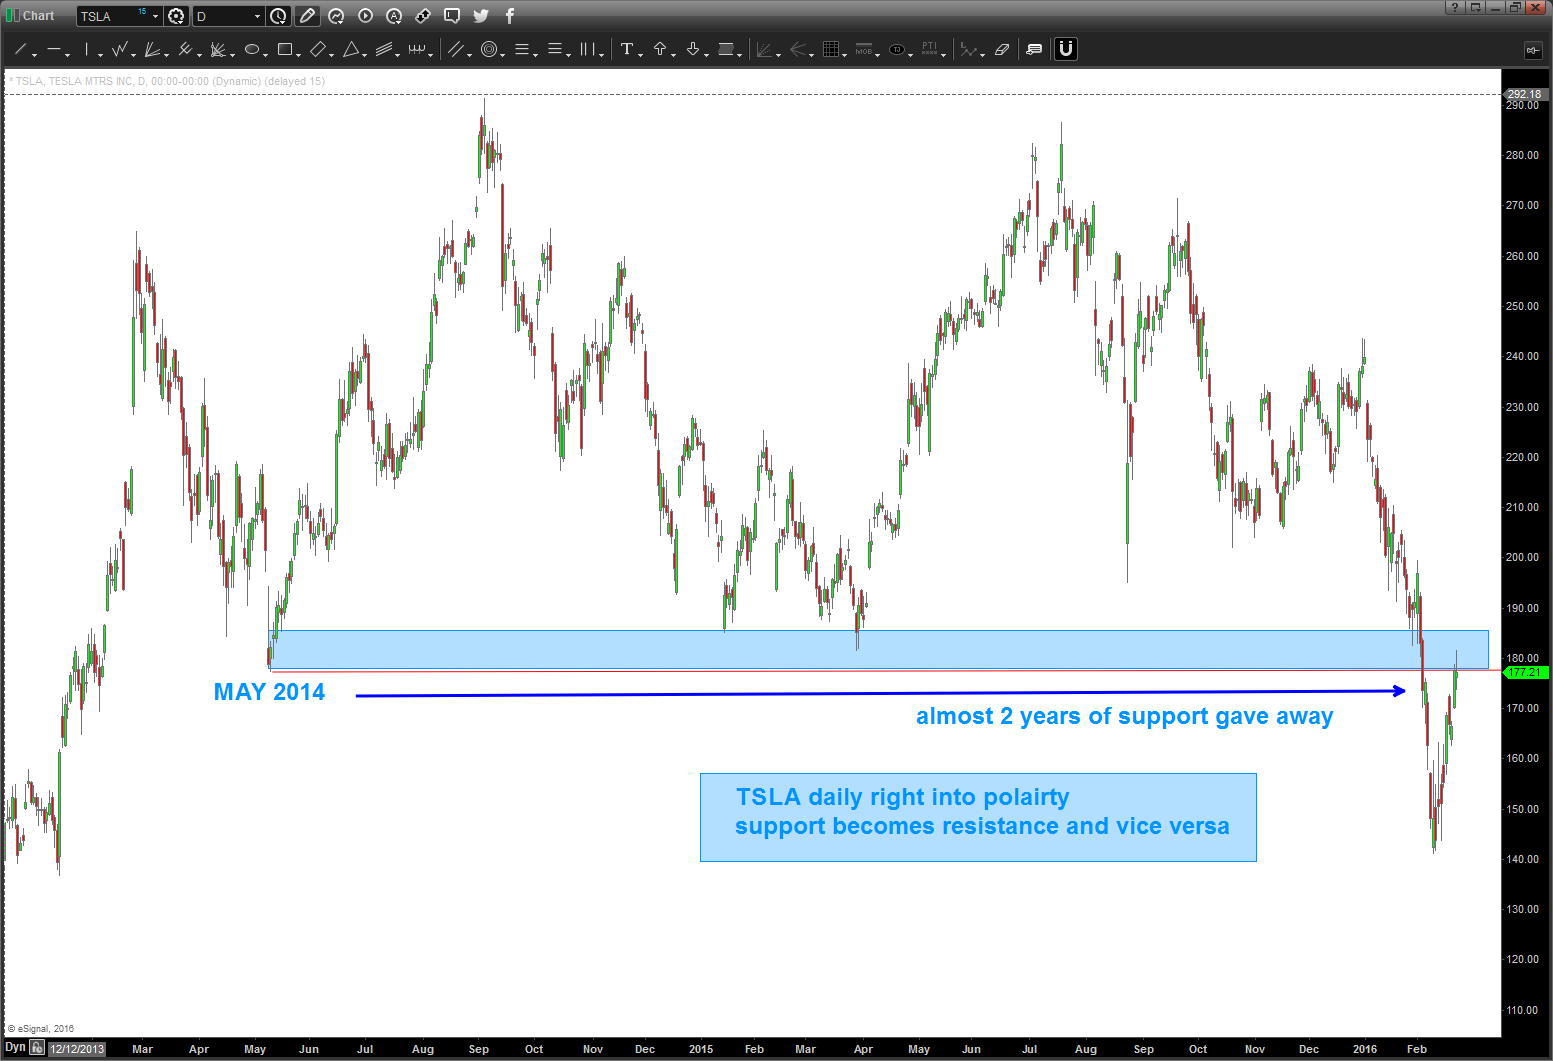
$TSLA polarity …
Posted on February 23, 2016 Leave a Comment
if you have been reading my blog you’ll find that $TSLA has had it way w/ the patterns … in fact I blogged that $TSLA took me to the octagon.
so, take this post w/ a grain of salt …
Polarity is powerful … when support fails it becomes resistance AND/OR when resistance fails it becomes support.
we have a 2 year area of support that failed and should now act as resistance.
POUND PATTERN and ramifications
Posted on February 22, 2016 Leave a Comment
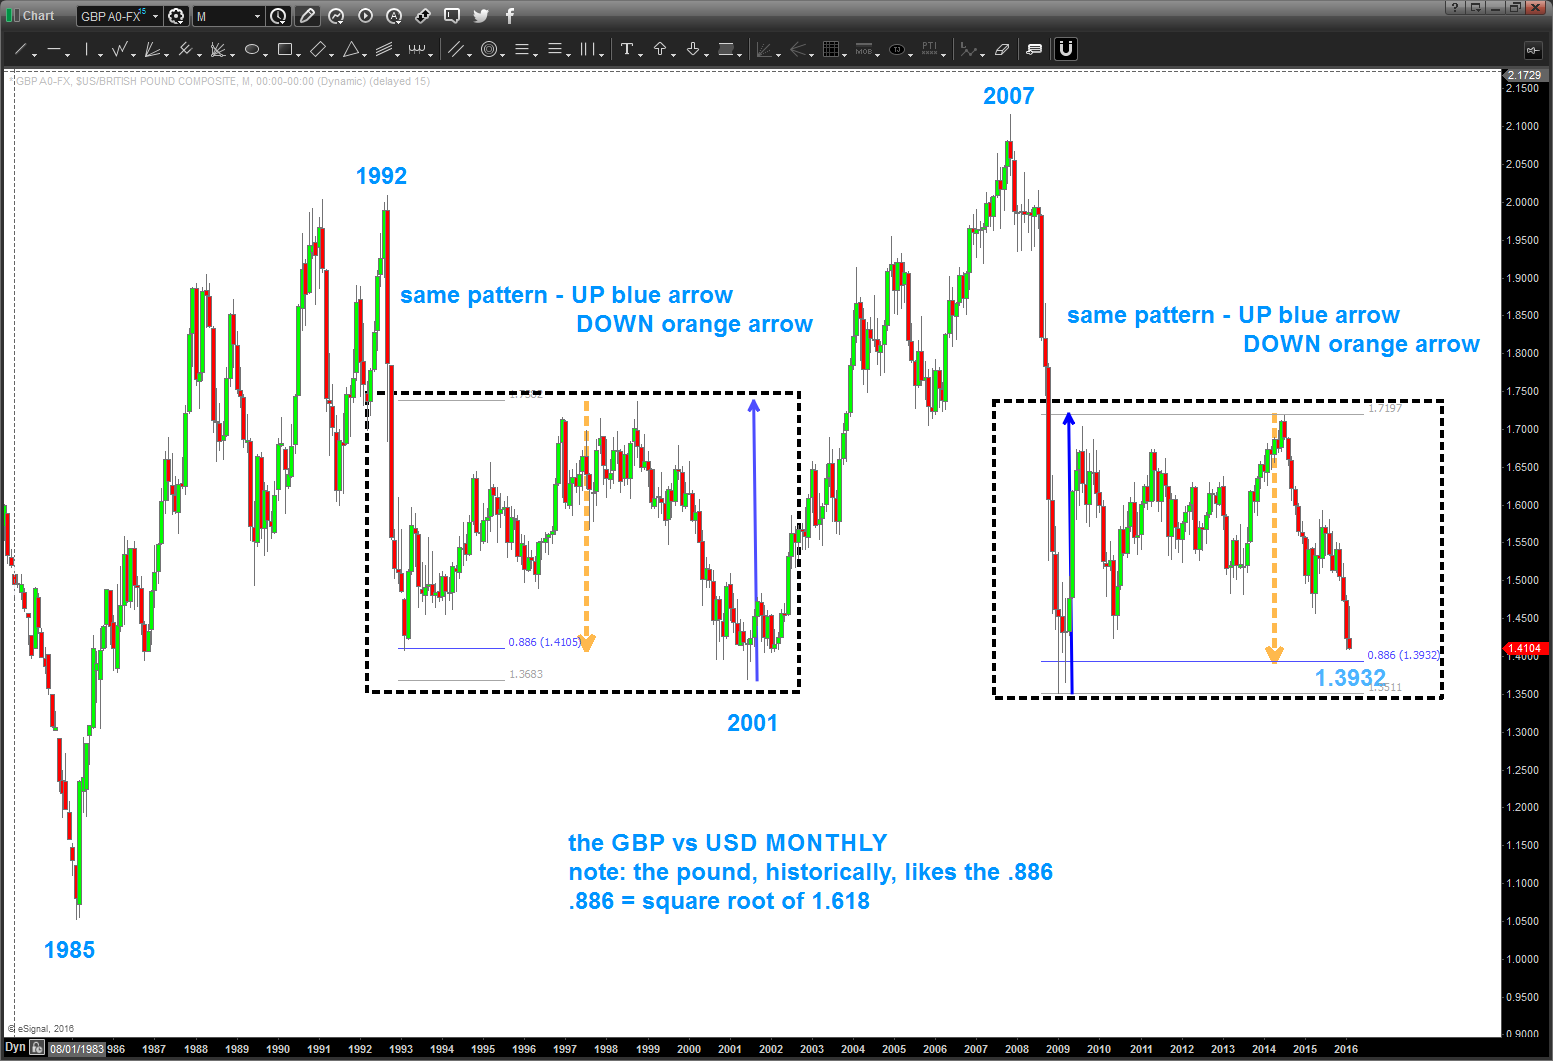
If you search my blog for ‘pound’ you’ll see that I’ve been scouting the 1.3932 level for a while.
the first chart below is the PATTERN at play ….folks it’s all numbers and geometry. the Pound went UP the same amount (blue arrows) and now it’s approaching the same amount down (Orange Arrows). that’s it … nothing about exiting the EURO Zone or PMI or any of that other stuff.
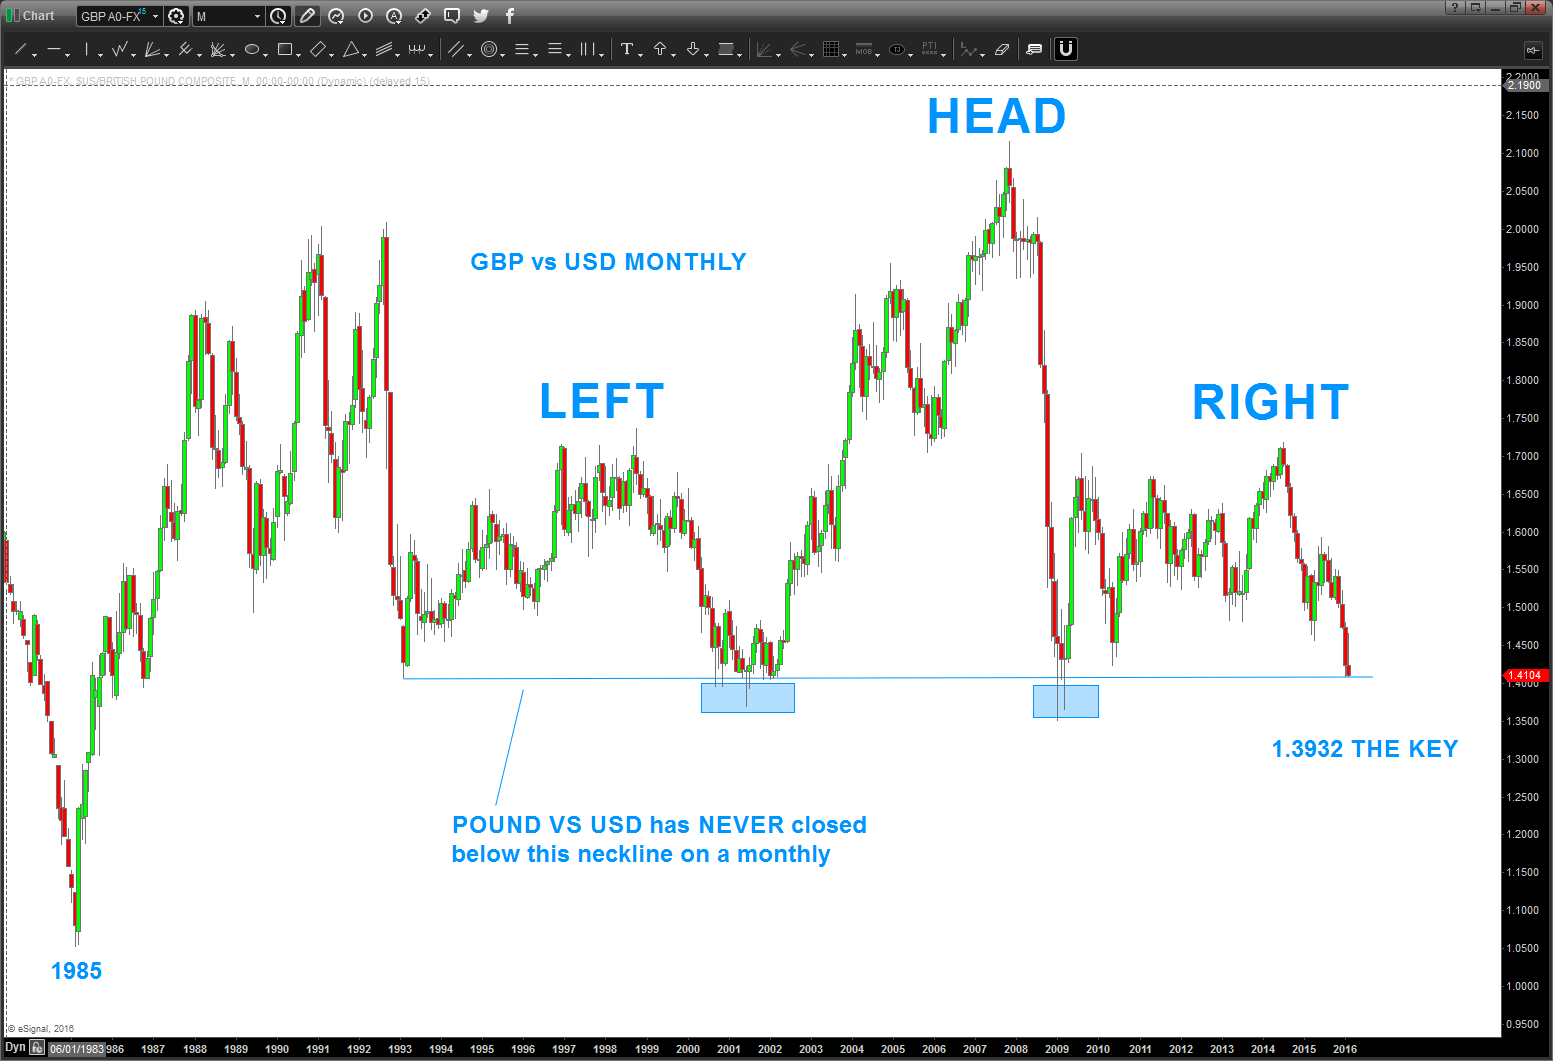
the ramifications, shown in the second chart – are big. As you can see, we have a neckline (horizontal light blue line) that has NEVER had a monthly close below. It certainly “tried” 6 times (folks that’s about 6 months worth of time) in 2001-2002 and then in the financial panic it spiked below a couple times but, ultimately, it held.
make no doubt, if we close thru the PATTERN level (1.3932) and have thrust and close below the neckline on a monthly basis (that’s the key) then things could get really ugly over in England.
interesting Sunday afternoon ….POUND gap down during “inter bank” trading
Posted on February 21, 2016 Leave a Comment
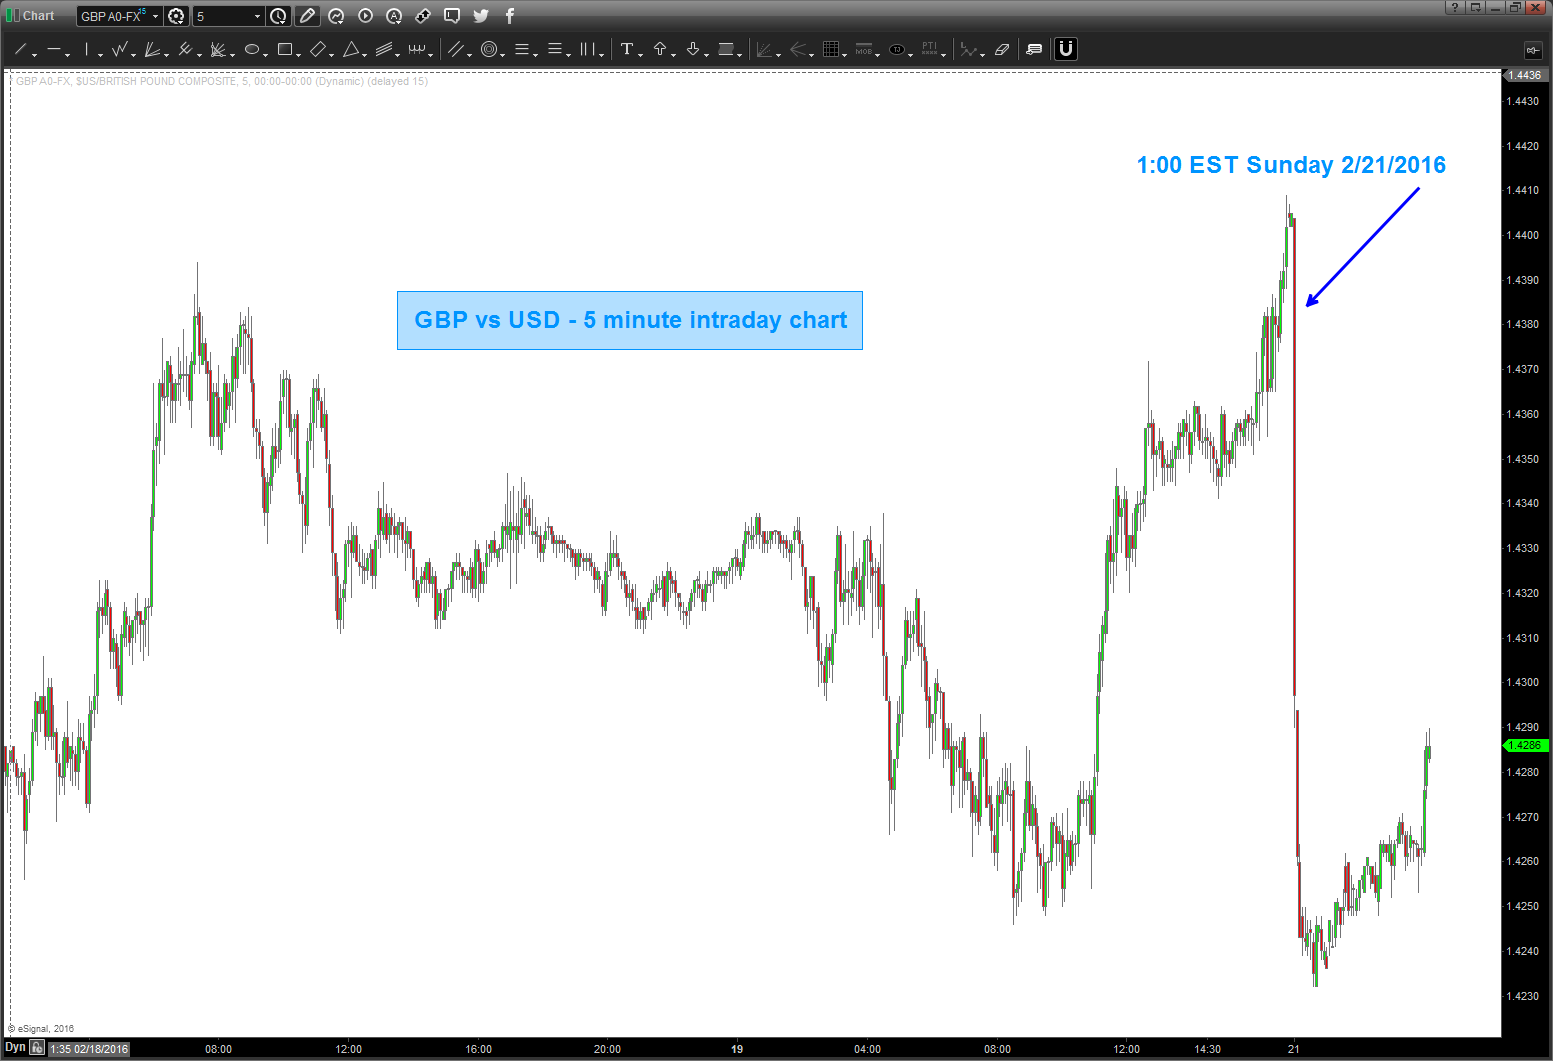
for the retail folk like you and I the “spot FX” market doesn’t open for trading till 5:30 EST – however, the banks and big institutions start rolling around 1-2 EST. If you have a good charting package, you can see these moves occurring even though you can’t actually trade them. Normally, the market will shuck and jive and hardly anything happens during this timeframe and then perhaps you’ll see some movement once Japan comes into the scene around 8 EST.
anyway …was going thru my chart set up for the week and when I opened up the GBP vs USD I noticed a 130 point gap down in the inter bank flow … that’s odd. some big institution dumped POUNDS … watch the Pound and watch London this week. Just a hunch …
when the big boys eat soup volatility rises ….update 2/20/2016
Posted on February 20, 2016 Leave a Comment
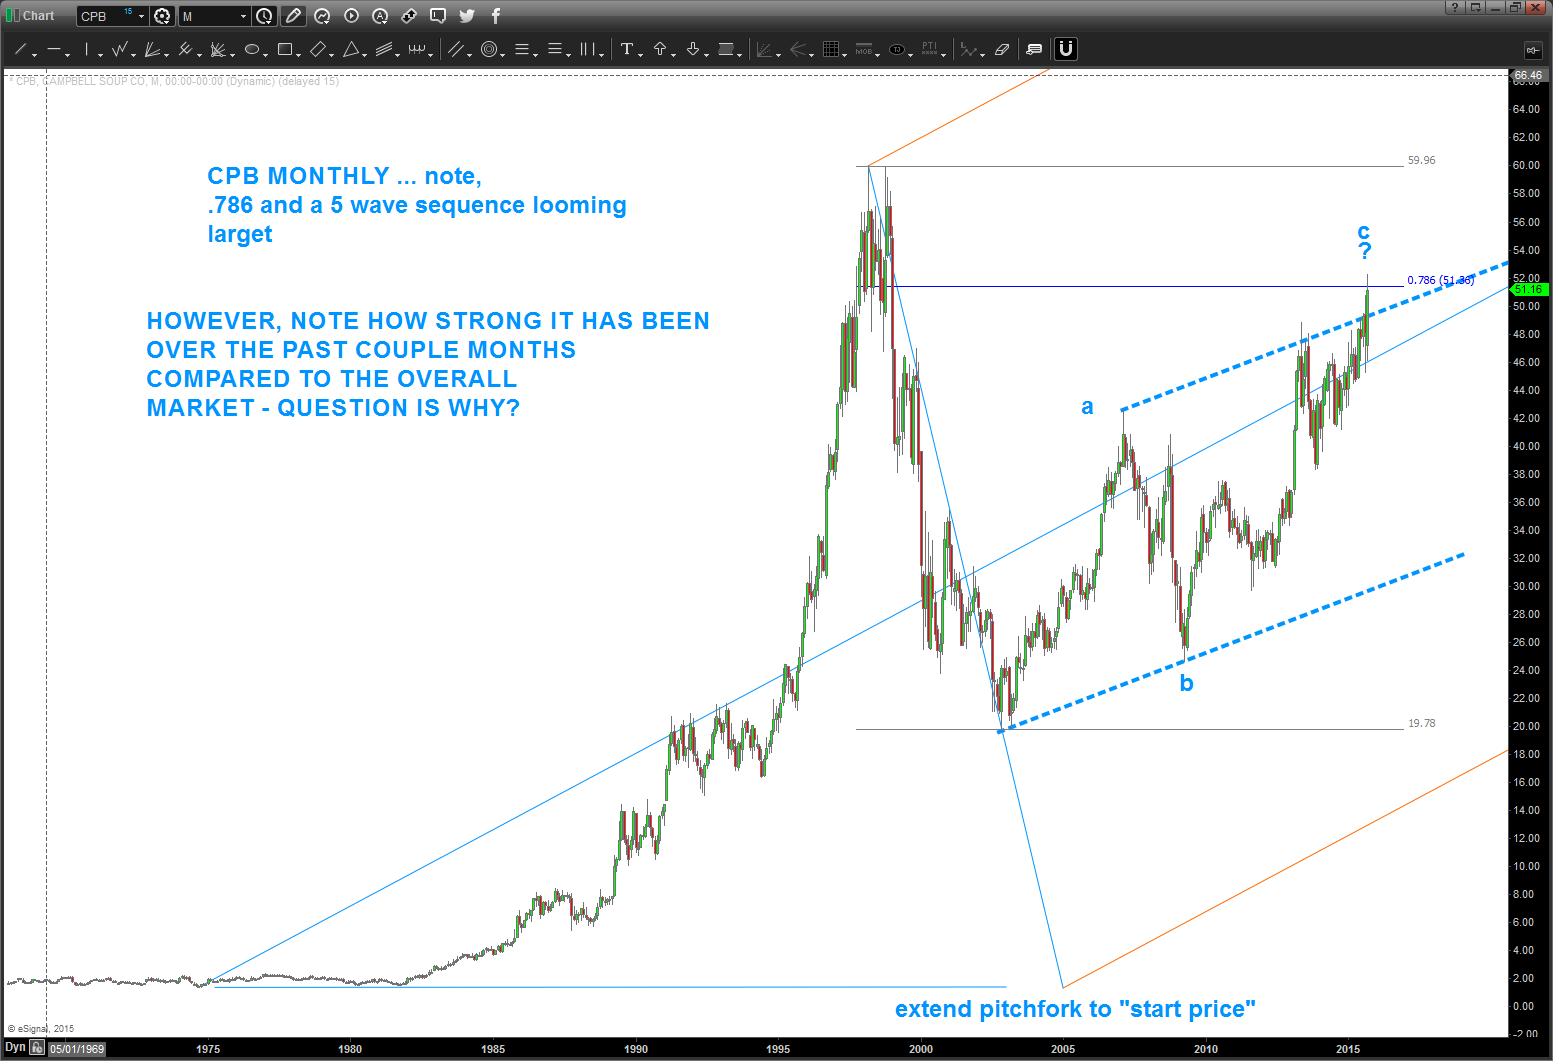
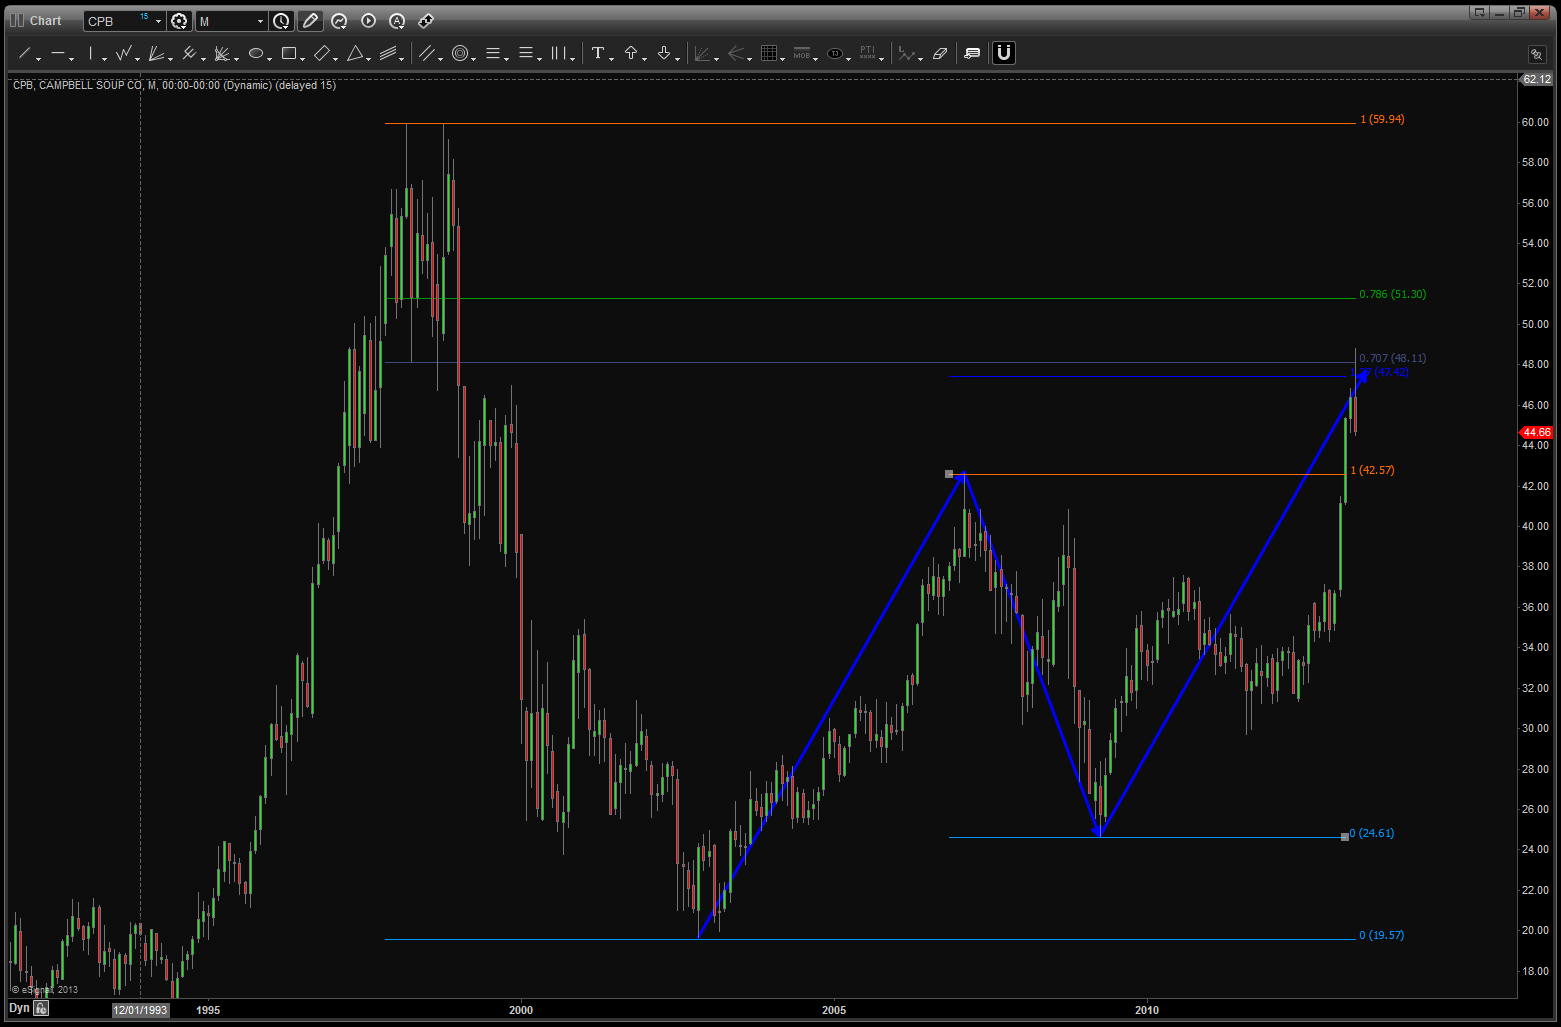
2/20/2016 Campbell’s soup has made new highs, shattering the pattern discussed below. Now, that pattern did hold for 7 months and resulted in a 20% decline. However, when a monthly pattern that’s so nice in PRICE/TIME hits, one would expect a little more of a corrective move. But, we live in a world of probability, so it worked a little then failed. Reminds me of the pattern on GOOGL that held for about the same time and then gapped and ran … why is $CPB so strong? Well, it goes back to the entire concept of RISK ON/RISK OFF and what the “big guys are doing.”
so, an update here for CPB, CPB/NYA, and the comparison of CPB vs VIX.
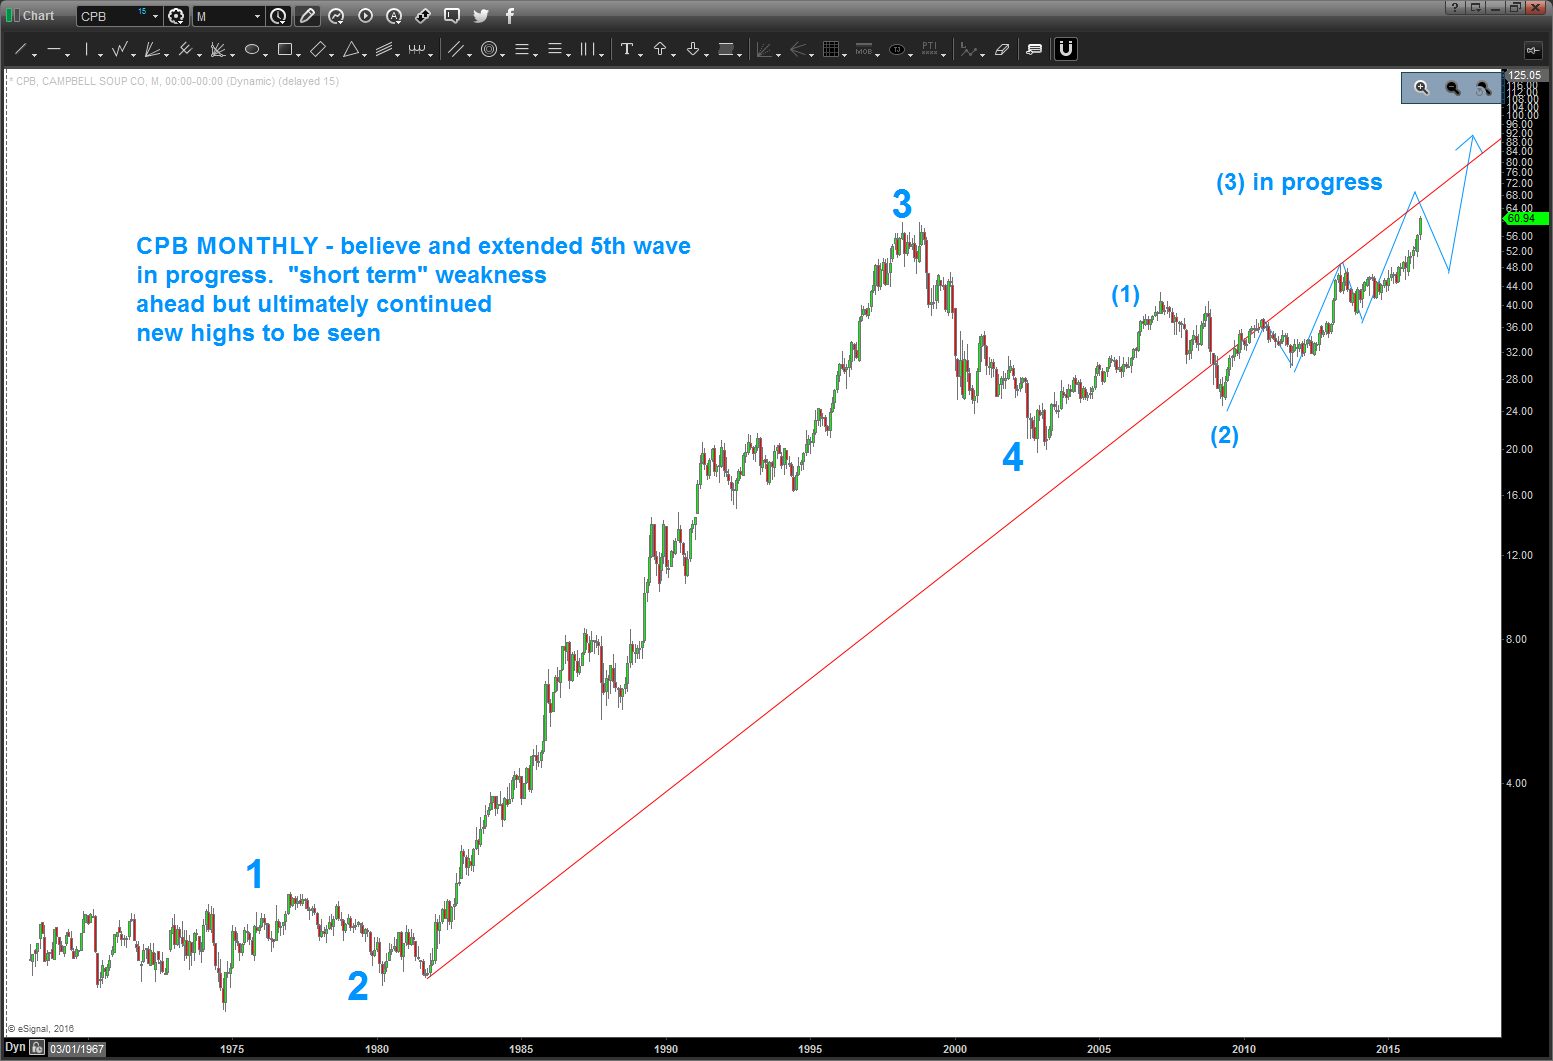
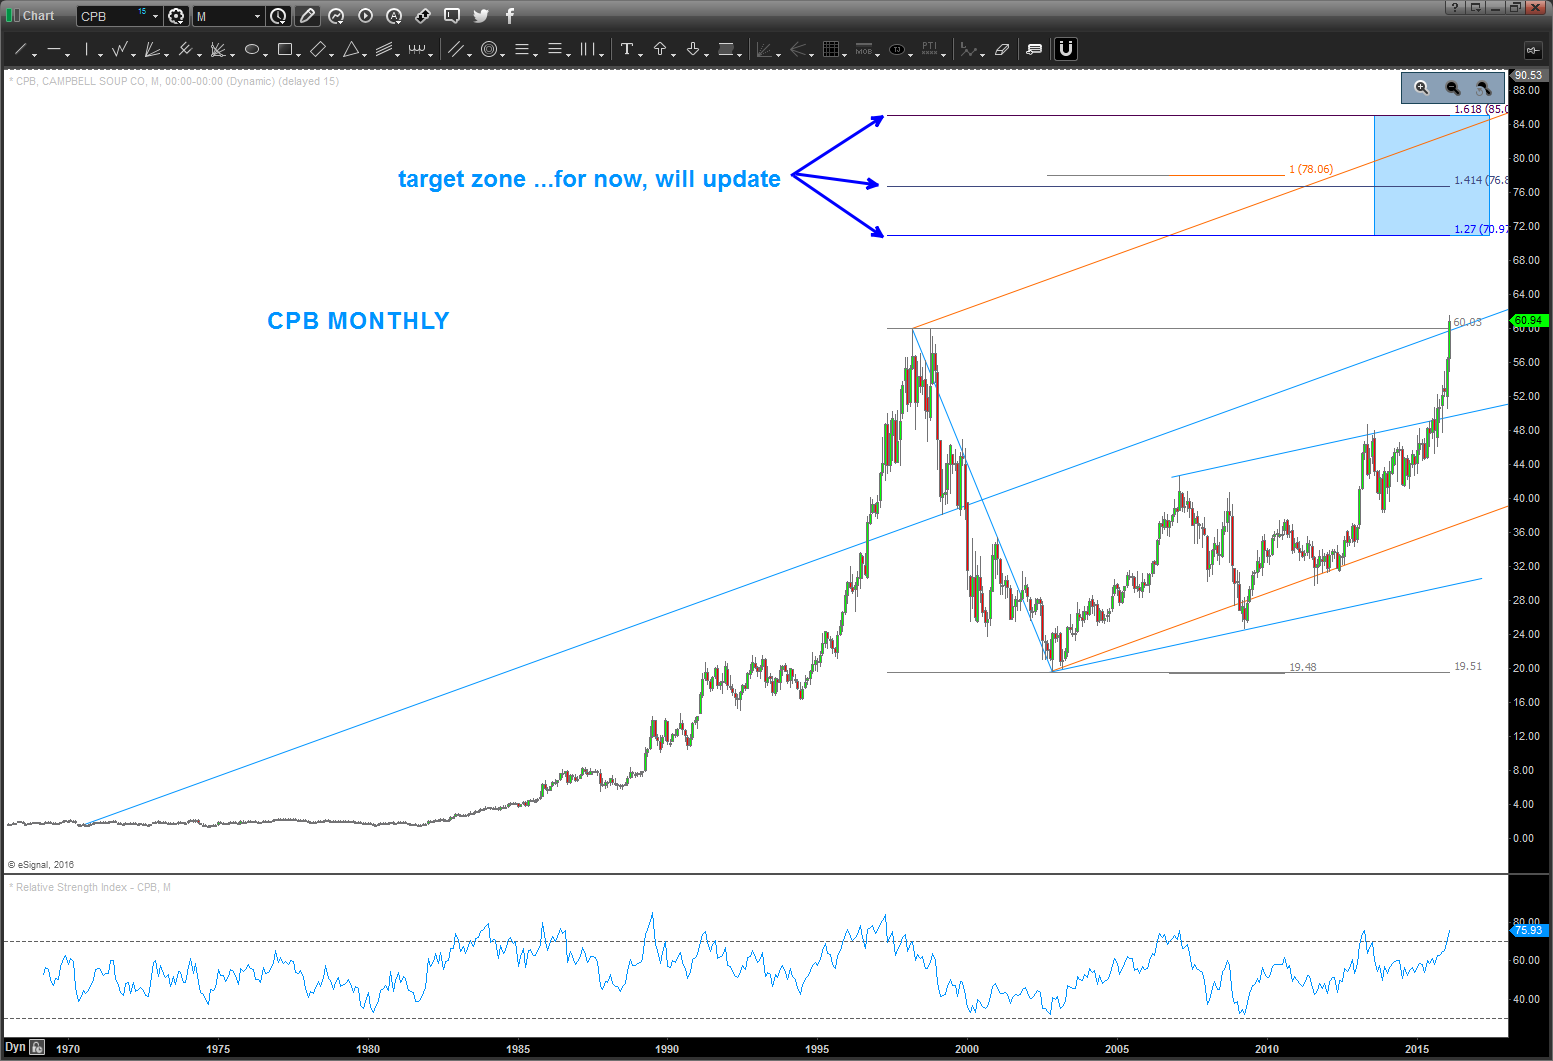
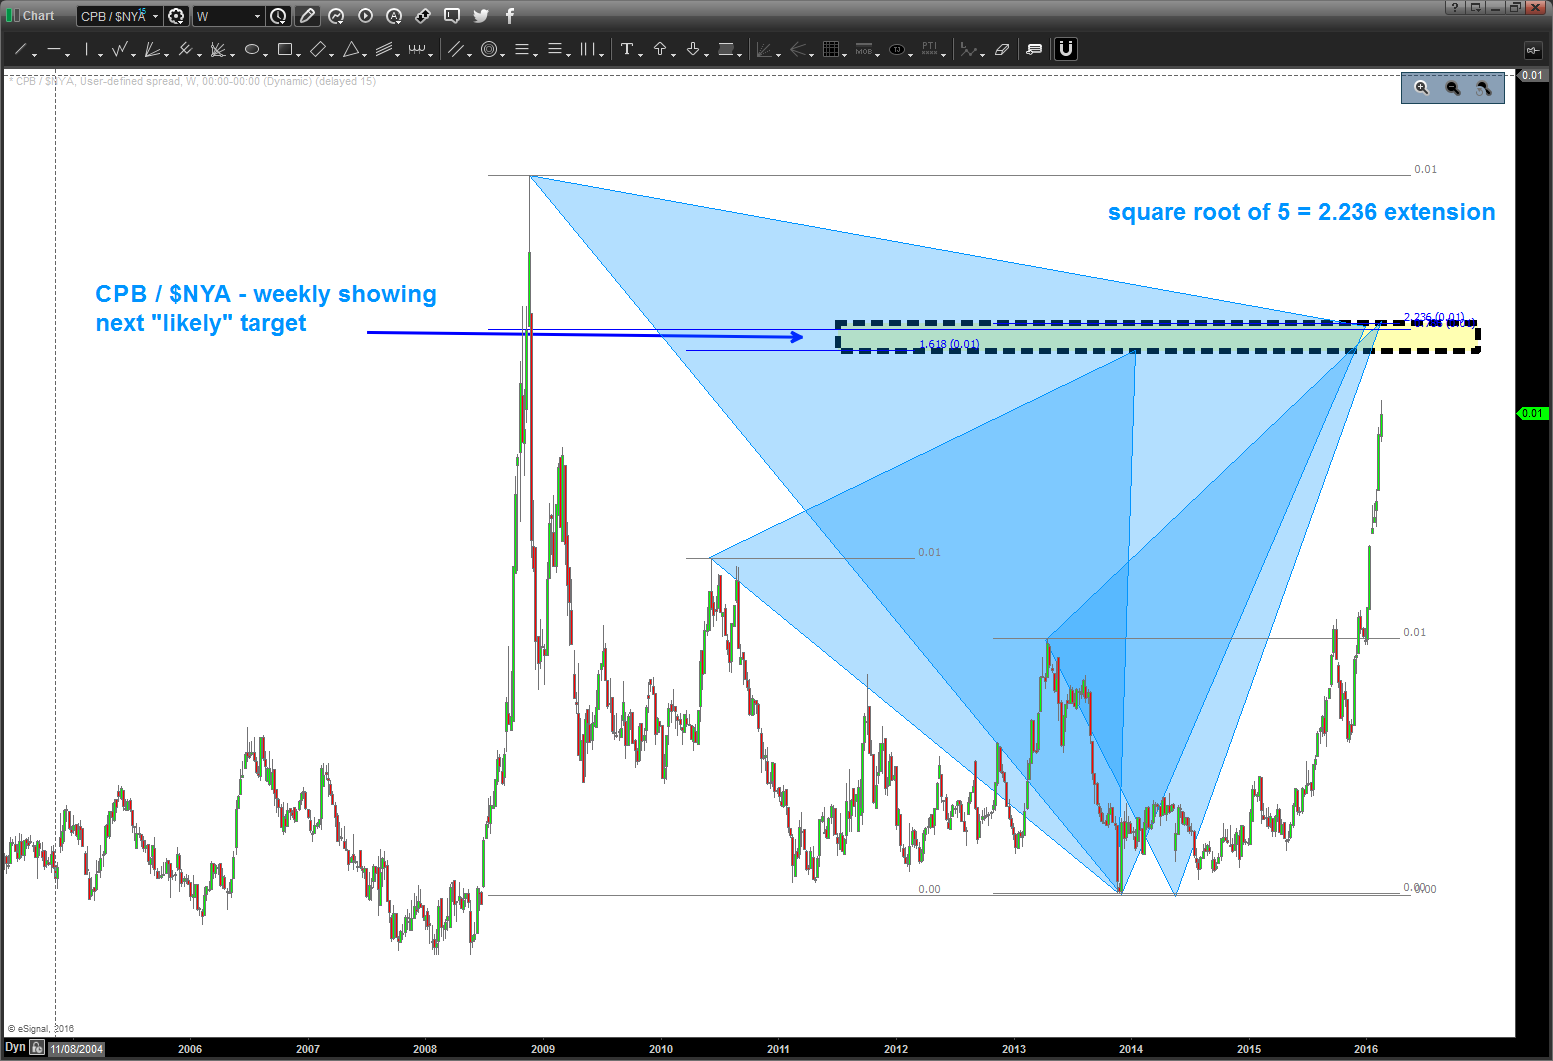
- CPB: certainly looks like we are in an extended 3rd wave w/ a slight correction to follow and then continued move up into target zone shown. The monthly candle, as of this writing is strong.
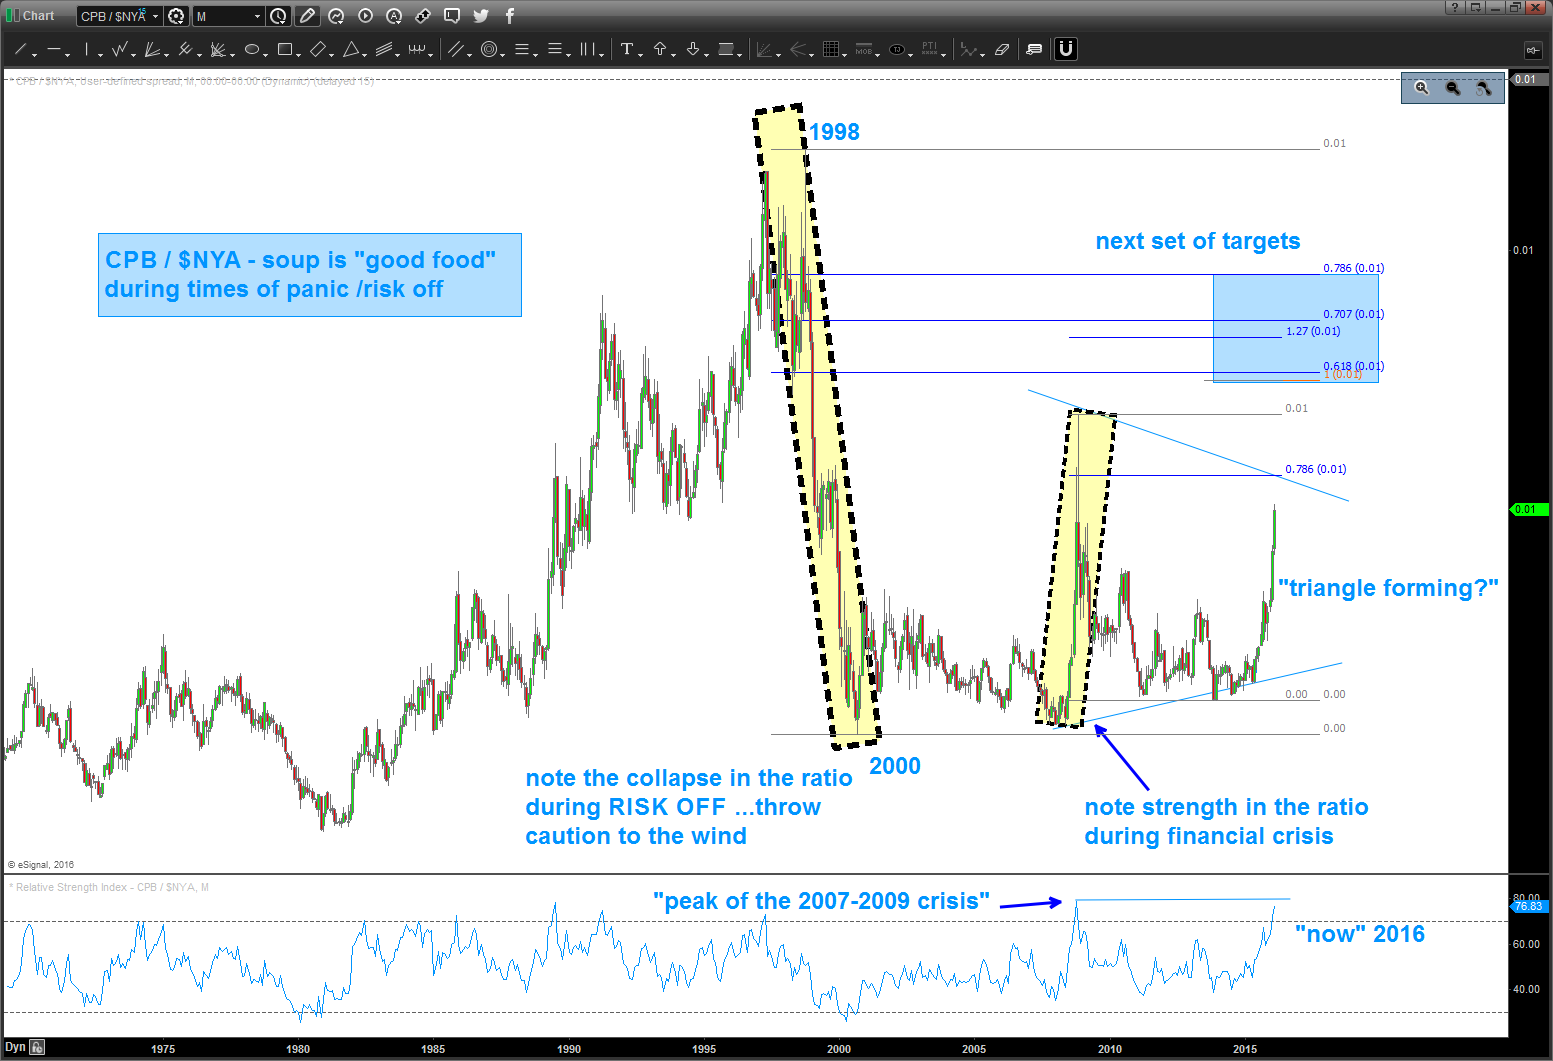
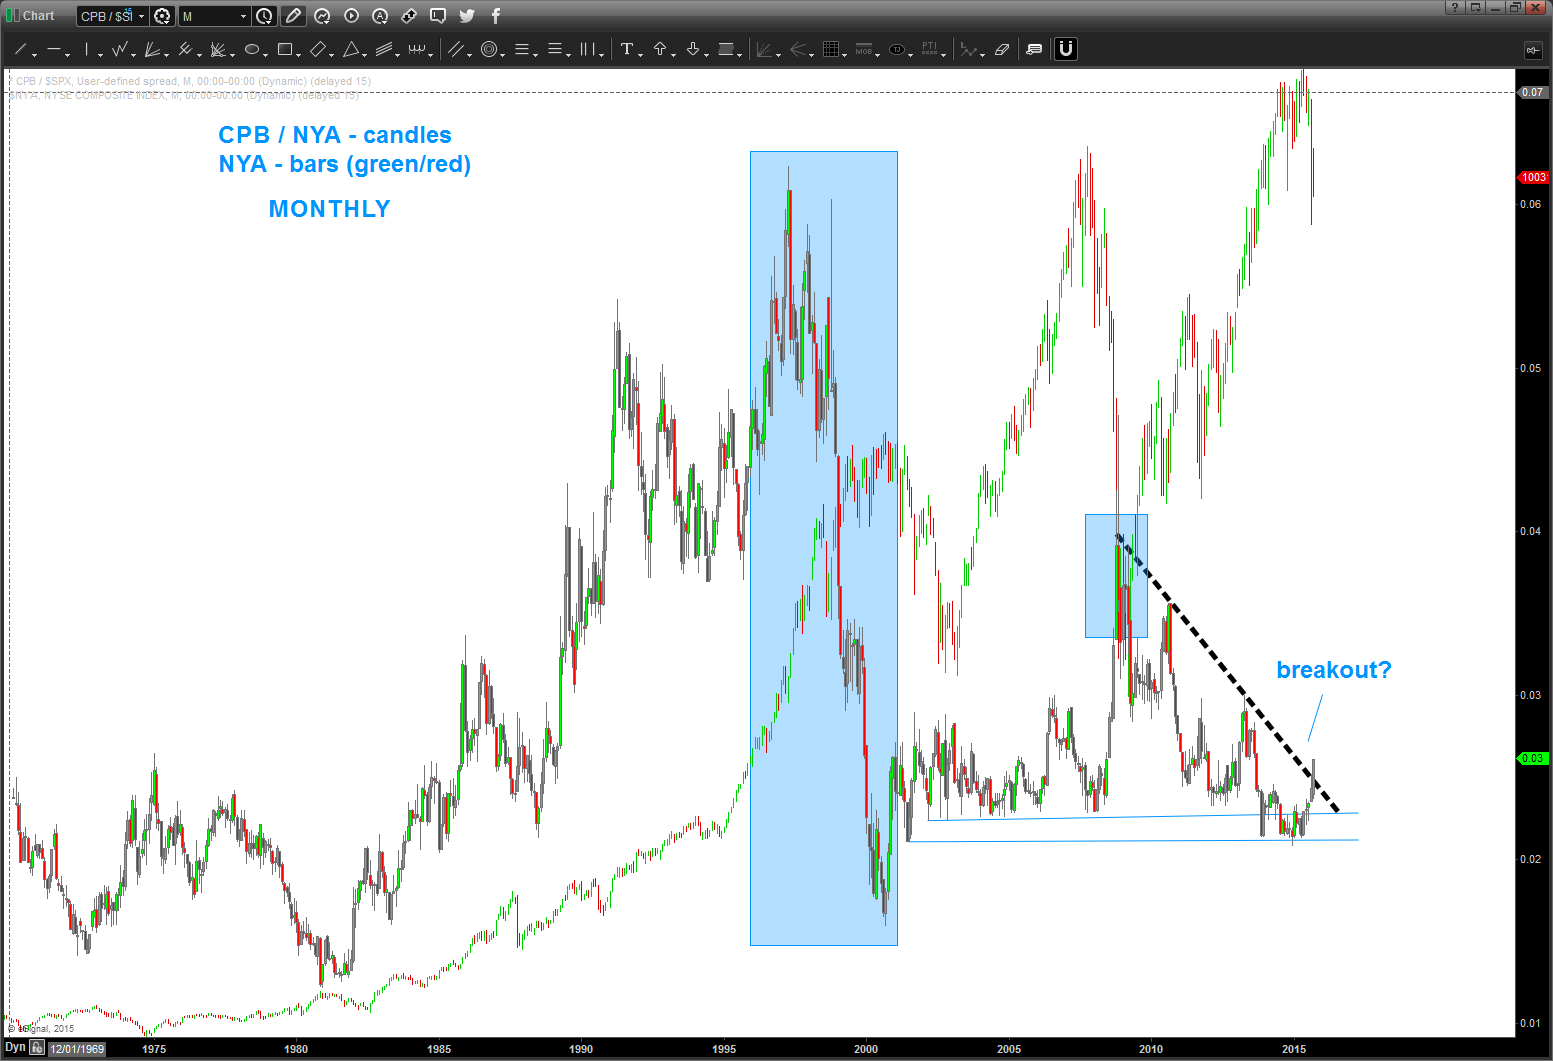
- CPB/NYA: note the RISK ON/RISK off nature of this ratio. It’s showing strength – risk off – but has some upper targets ahead. If your looking to be long equities, I would monitor XLP/NYA and CPB/NYA. Any signs of weakness (weekly signal reversal sell candle) would be a good indication to get LONG equities. (the dow seems natural as it DID NOT make a new low)
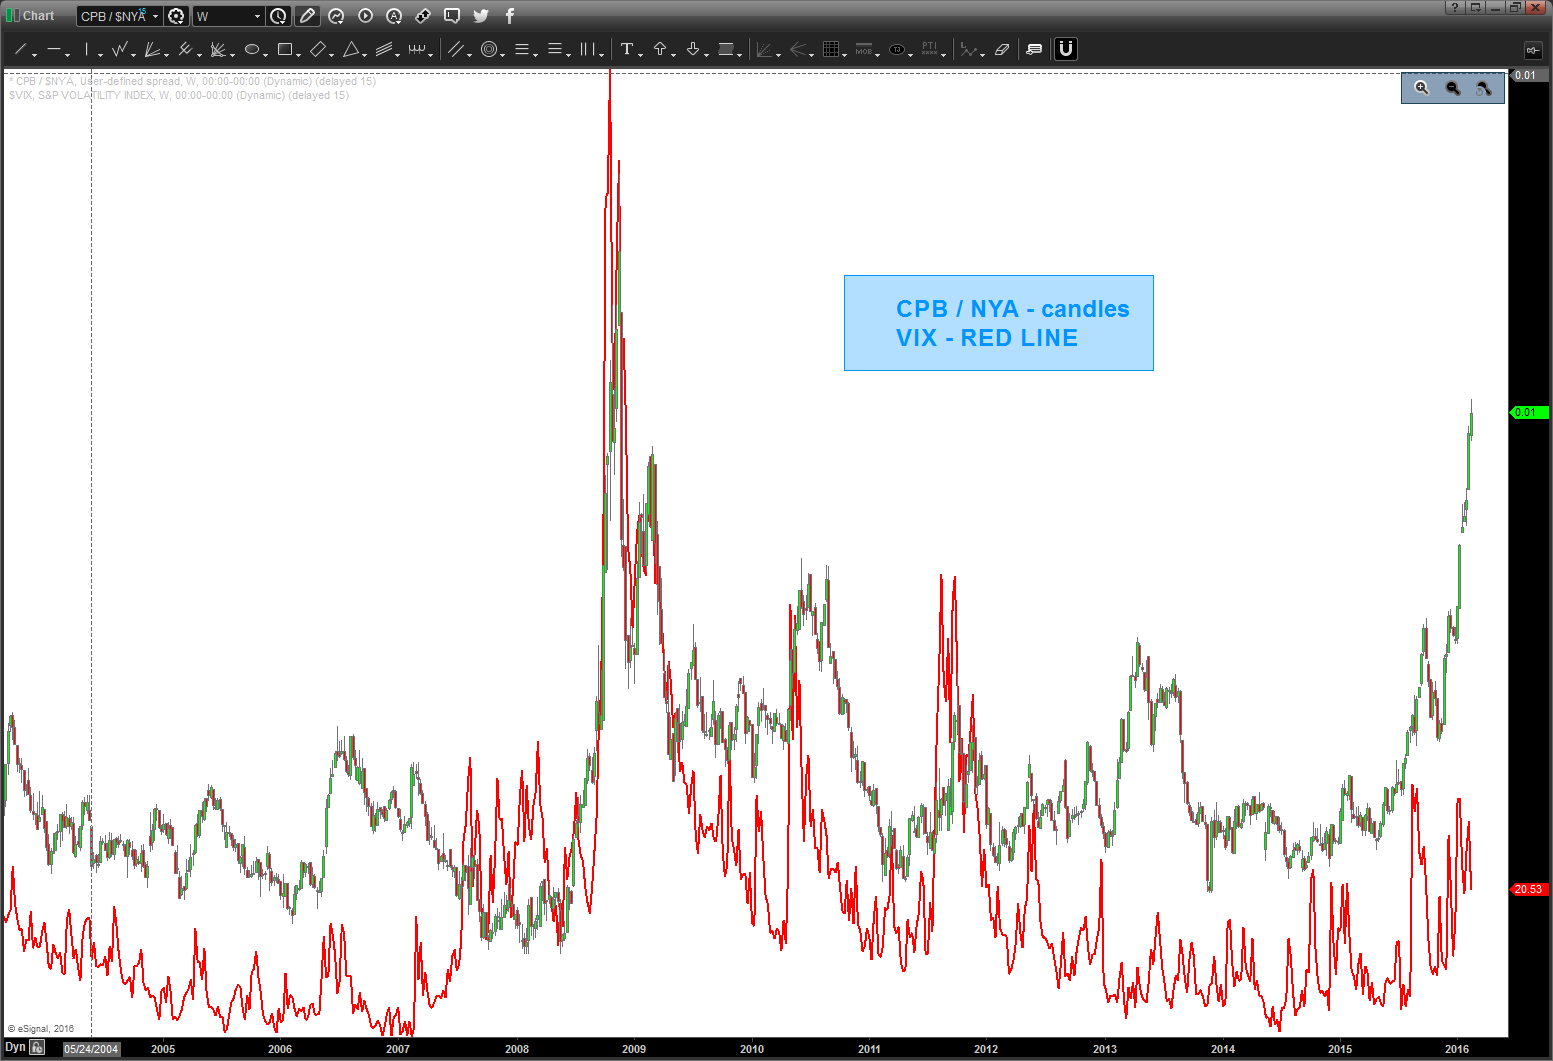
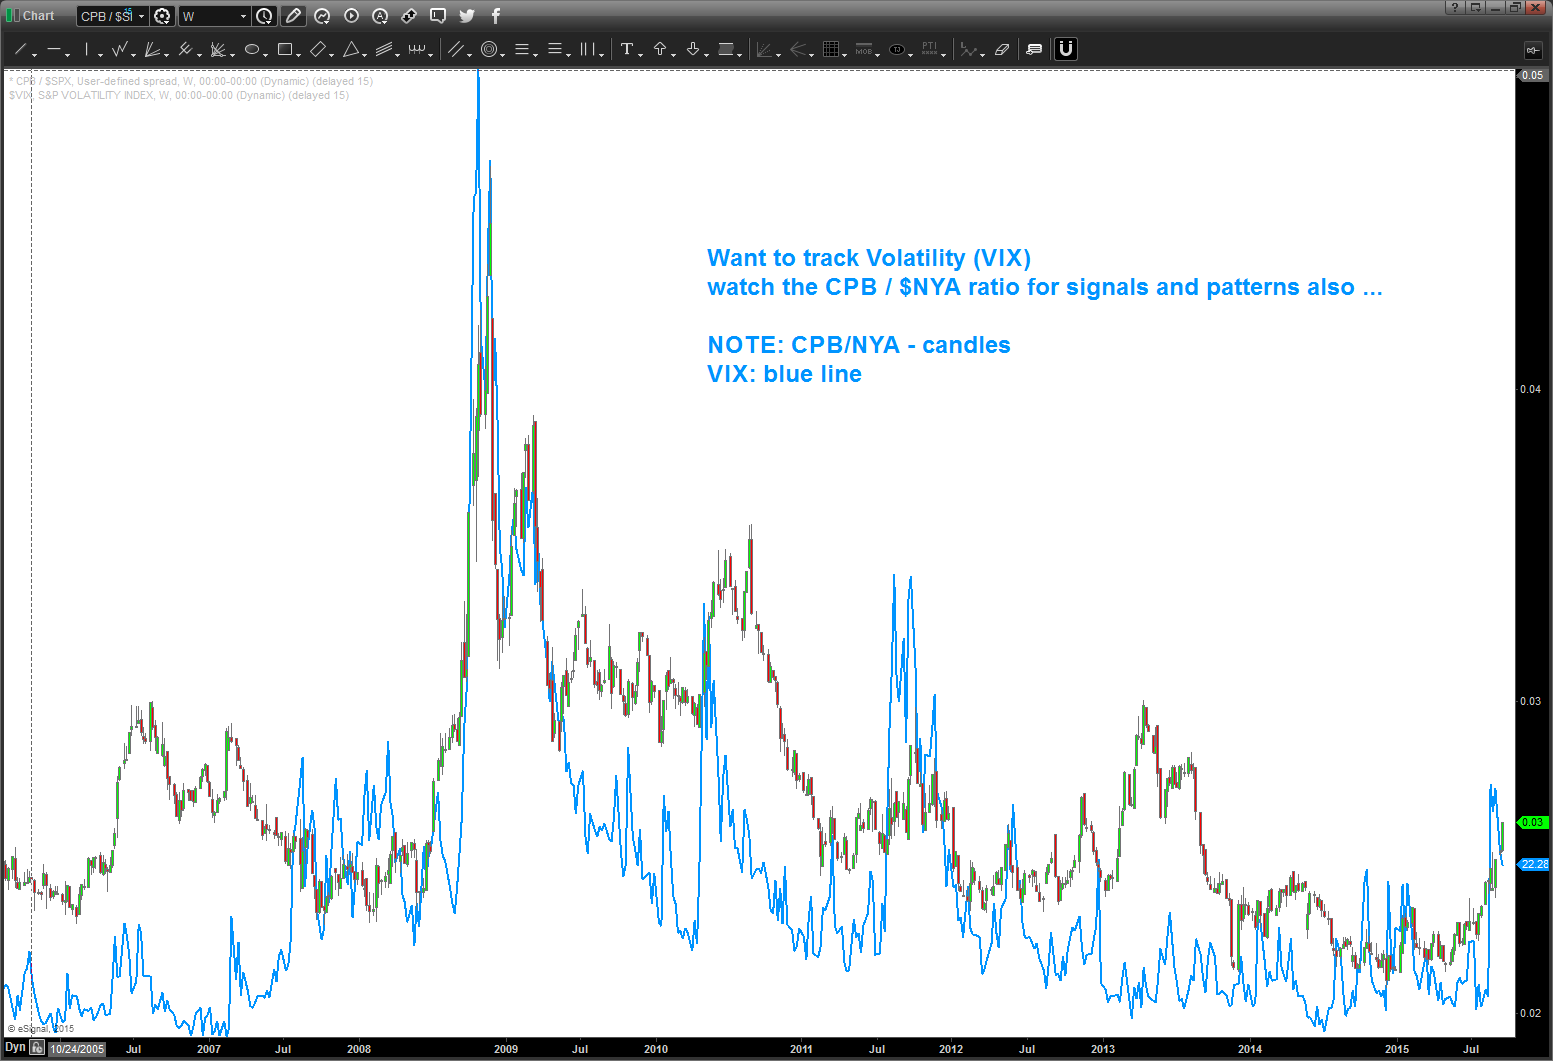
- CPB vs VIX – folks, right now, they are near mirror images. again, think about it in terms of the institutions.
- when they don’t like the risk .. they roll into conservative plays (CPB perhaps) and that causes volatility to RISE.
- when they feel like taking risk, they cut and run w/ CPB and roll into FB (or something else like SHAK or some other crazy glamour name) and the RATIO underperforms and and goes DOWN which causes volatility to lower …
- so, if you play volatility, look for BUY/SELL signals on the ratio to confirm a potential rise/decrease in volatility.
hope this all make sense … pretty amazing that the CPB/NYA from 10/18 bounced on cue per the chart. I know, I know, it’s a “self fulfilling prophecy” and ‘technicals don’t work’ and ‘patterns are fictitious.’ Ummmm, yup! 🙂
let me know if you have any questions, charts should be self explanatory.
make it a great weekend.
Bart
October 18 2015: note, the CPB/NYA ratio has been straight down but it running into potential support a little lower. The thesis is during times of “risk off” institutions roll into the staples and stuff like toilet paper, toothpaste, food, soup, etc. has stronger relative strength. Keep an eye on this next week as support for the ratio “should” work it’s way into more volatility and be bearish for the overall equity picture.
Below the two dashed lines is a post that I did 2 years ago – almost to the day. Pretty amazing …some would call it synchronistic. I’ll just leave it at that …
Personally, I enjoy my Saturday and Sunday morning’s w/ a cup of coffee. Nothing going on, put a little Pandora on the headset and just “chill” and enjoy the amazing fall weather in VA. Little Bird said – “hey Bart, how about CPB soup?” So I took a look and – BAM – I was surprised.
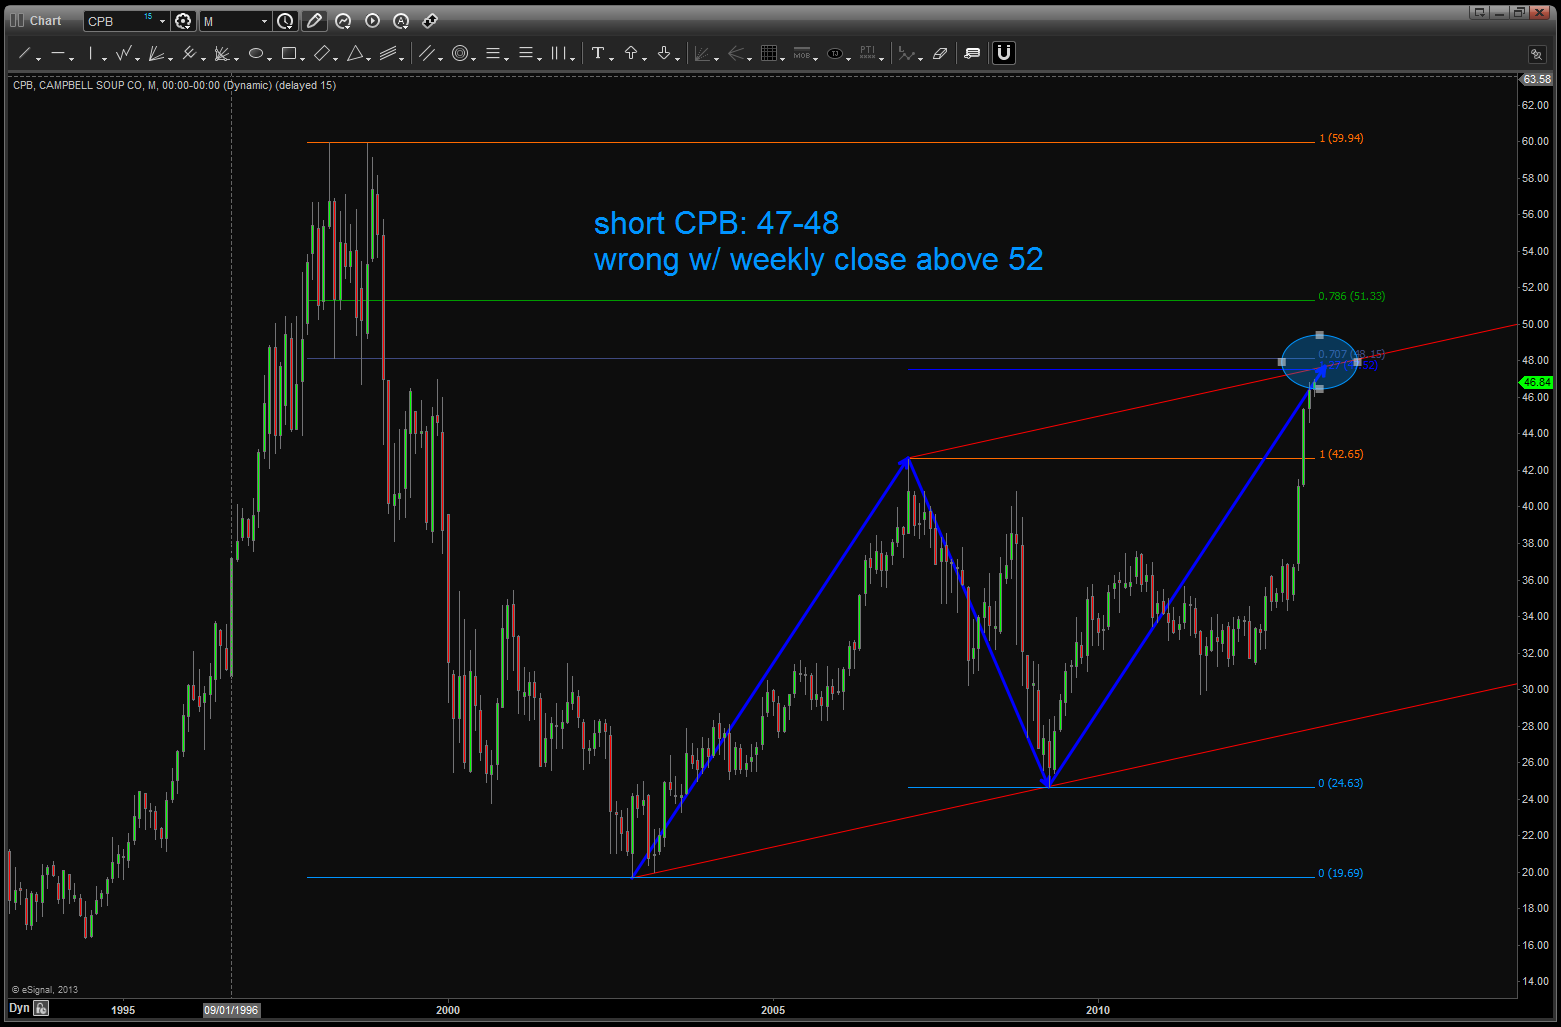
If you go all the way back 2 years ago you’ll see that we had a nice pattern forming and it hit – to a tee at 48.
The market pulled back about 10 bucks and then started to march back up … a slow grind but it did go up.
As you can see above 52 and it was considered a failed pattern.
This week we went up and touched that level and, while I can see a 5 wave count up into this area and seeing an a-b-c type of correction what REALLY made me go hmmm is, of course the relative strength of CPB compared to the NYA. Why? STAPLES BABY …. a couple posts ago I mentioned we should be watching the XLP / $SPX for strength to signal more market weakness. Soup is a staple – period.
So, couple things of note:
- CPB is strong compared to the overall market.
- It has closed, on a weekly basis, the trend channel defined by the blue dashed line.
- there is a 5 wave count into the 52 area so warrant caution here if going to play on the long side.
- the short side is also a play, but would wait for the 48 level to be broken to the downside on a weekly close.
here’s what really has me interested in the RELATIVE STRENGTH OF CPB vs NYA
Points of Interest
- from the 1980’s CPB “outperformed” (the ratio went up) the overall market.
- the ratio TOPPED in 1997. the overall market didn’t top until 2000.
- but when the market did, eventually, top, the relative strength of CPB / NYA bottomed exactly the same time
- think about it for a moment .. the ratio CRASHED going into the top in 2000. Folks, that’s irrational exuberance. throw caution to the wind and get in, get in, get in and then ….ouch.
- while not as dramatic, the same thing occurred in the 2007-2009 period.
- the ratio bottomed as the market topped.
- presently, we do have some strength taking off and we have closed above the black dashed trend line.
- is that a signal that a strong move in the ratio is coming? Potentially, so monitor closely and do not be lulled to sleep. Strength in this ratio is not good for the overall health of the equity market.
one last folks … let’s not try to “fundamentalize” this last chart. that’s for the really smart people .. but take a look at the CPB/NYA ratio and the VIX. It’s a near perfect match.
When the institutions start eating soup … expect volatility to rise.
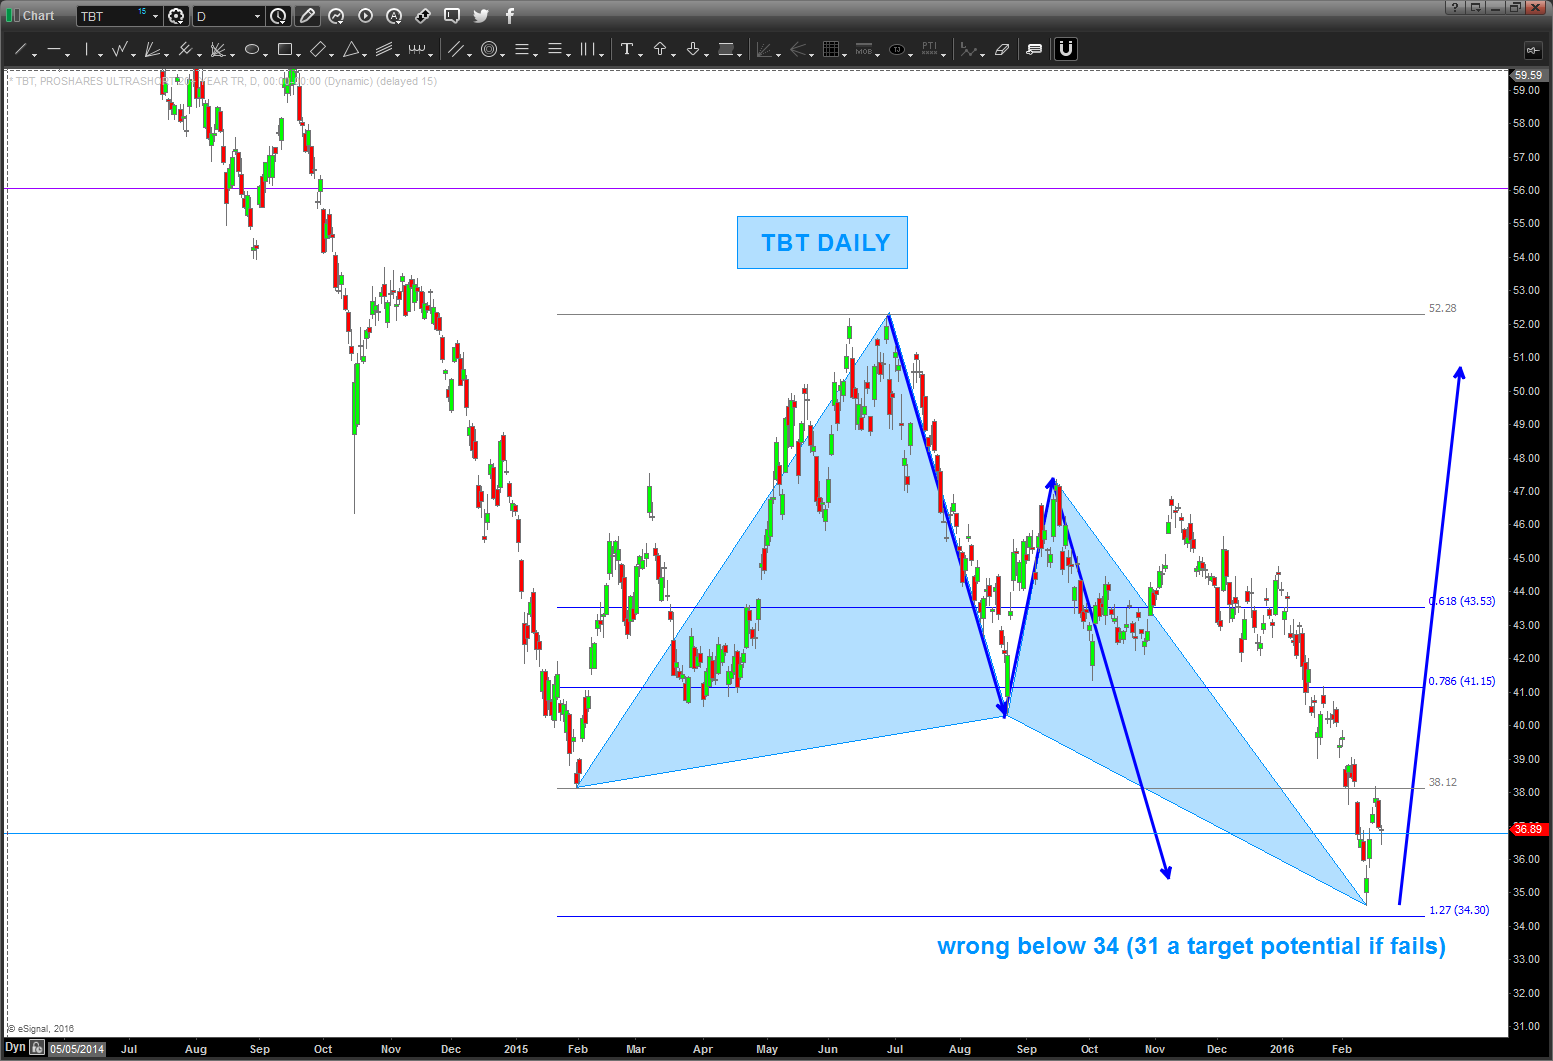
swings on this puppy have been extremely nice ….charts below.
just follow the bouncing ball …
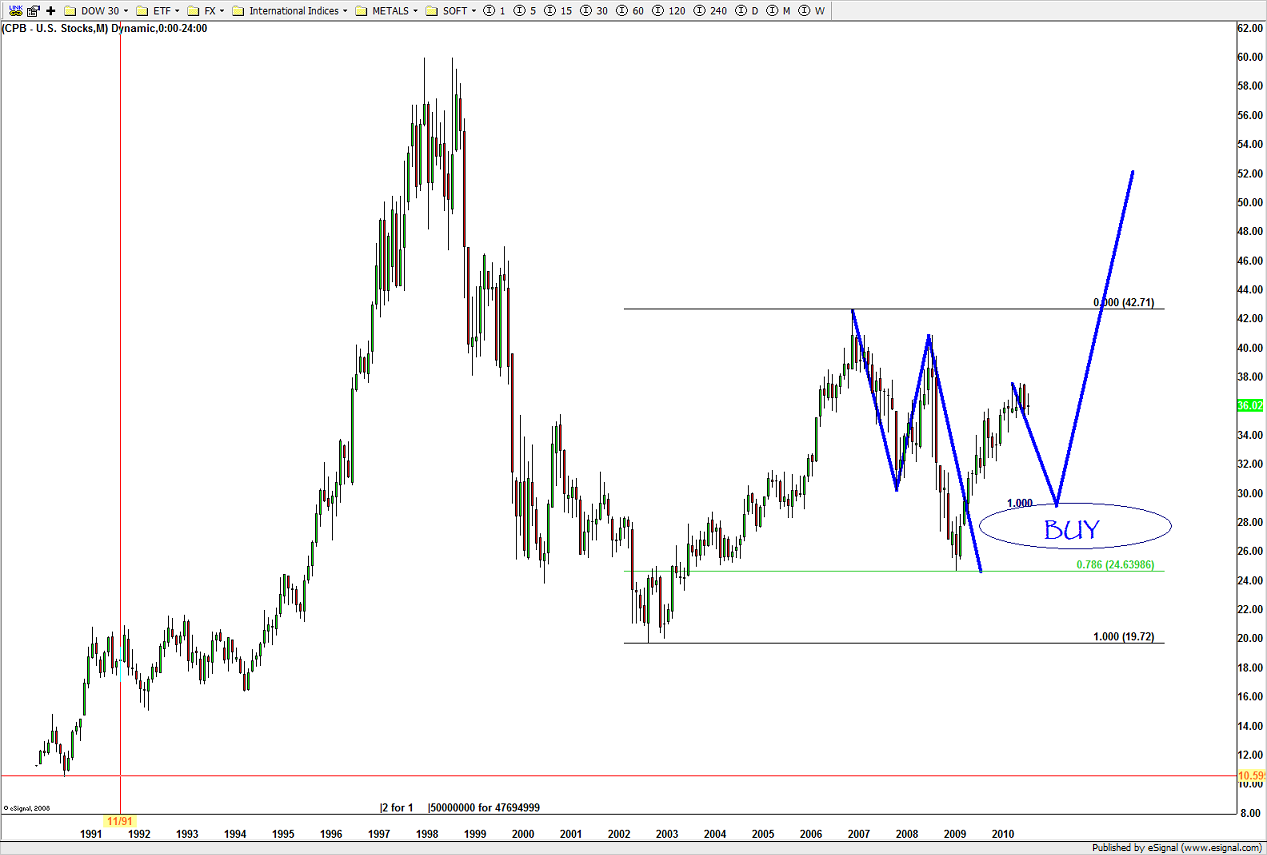
nice BUY pattern emerged at level forecast …
long term pattern came into play. good pattern/good defined risk …
level being hit ….
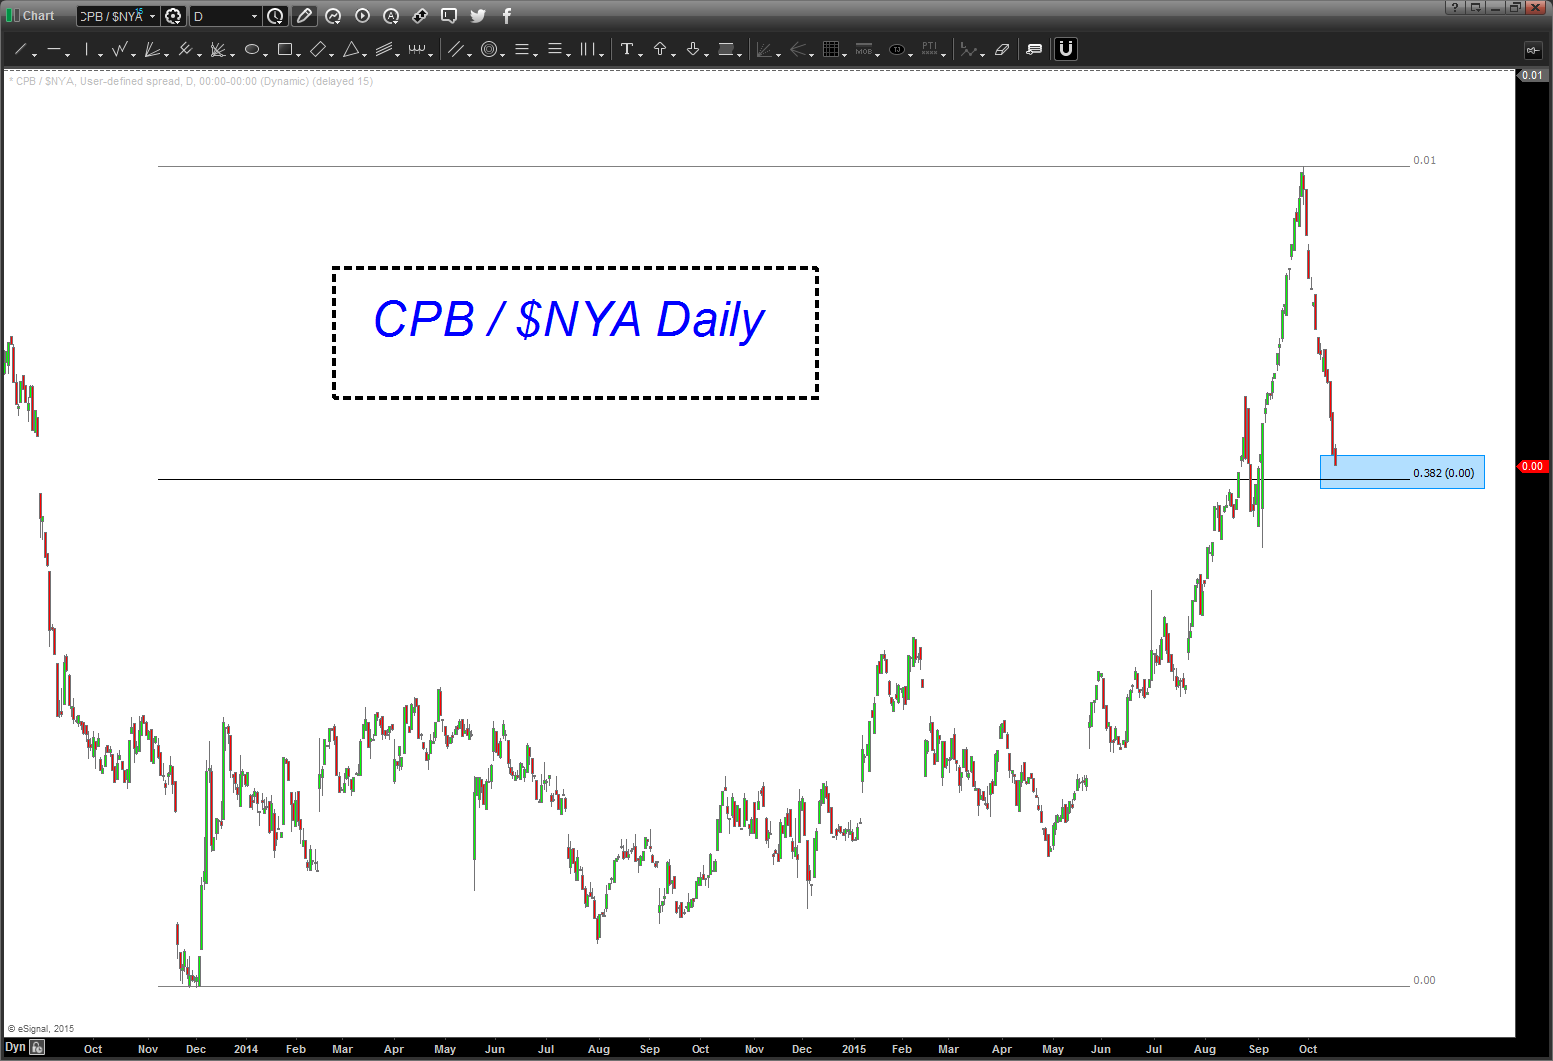
note, now we have completed the equality of swings and the level held at/around 41.
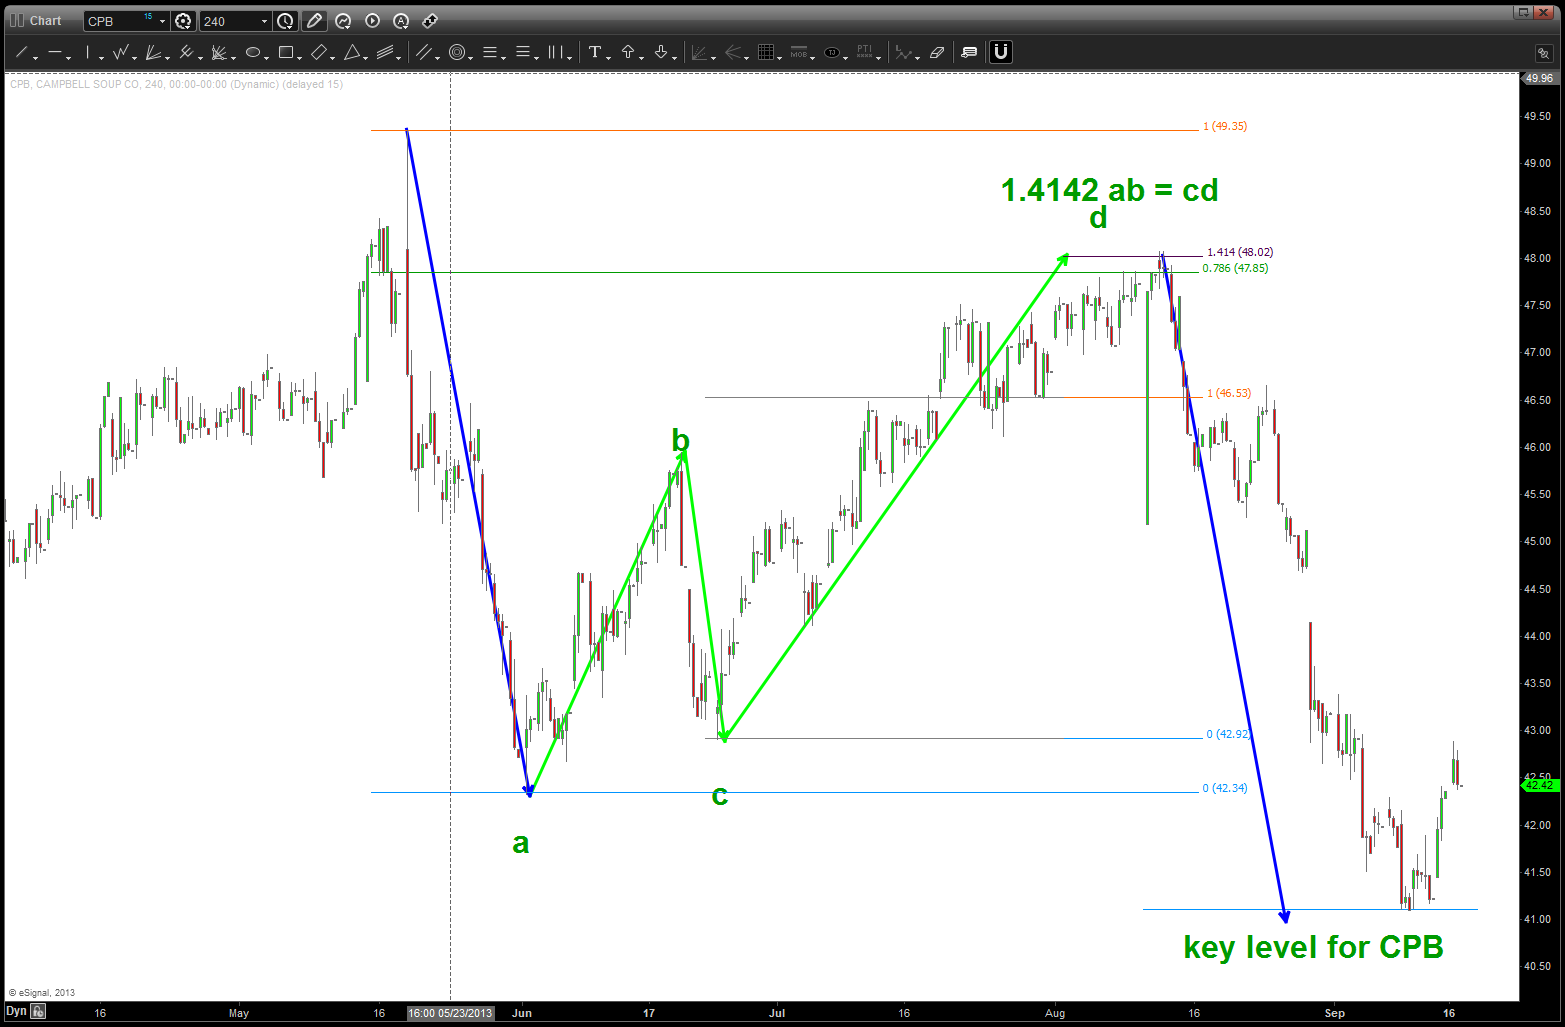
watch the lower level on CPB … if we break it, selling could really come in ….
meanwhile, in other news … $ABX continues higher (still cool that the low close was 6.18)
Posted on February 19, 2016 Leave a Comment
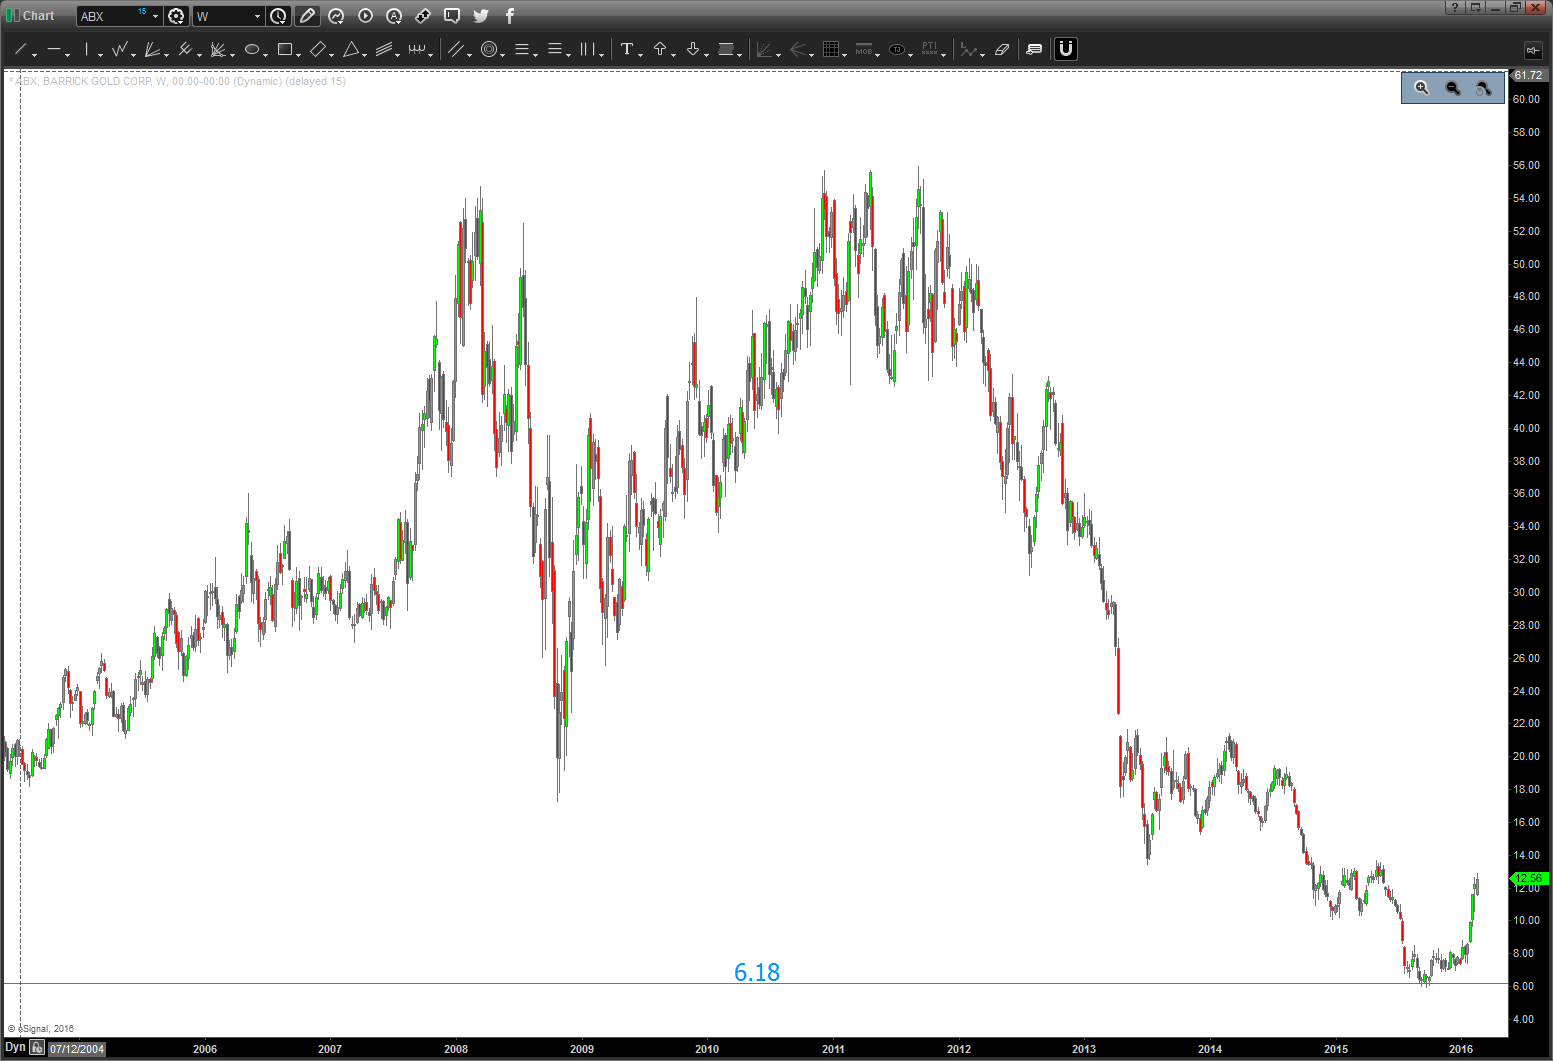
going back in time, here was the set-up.
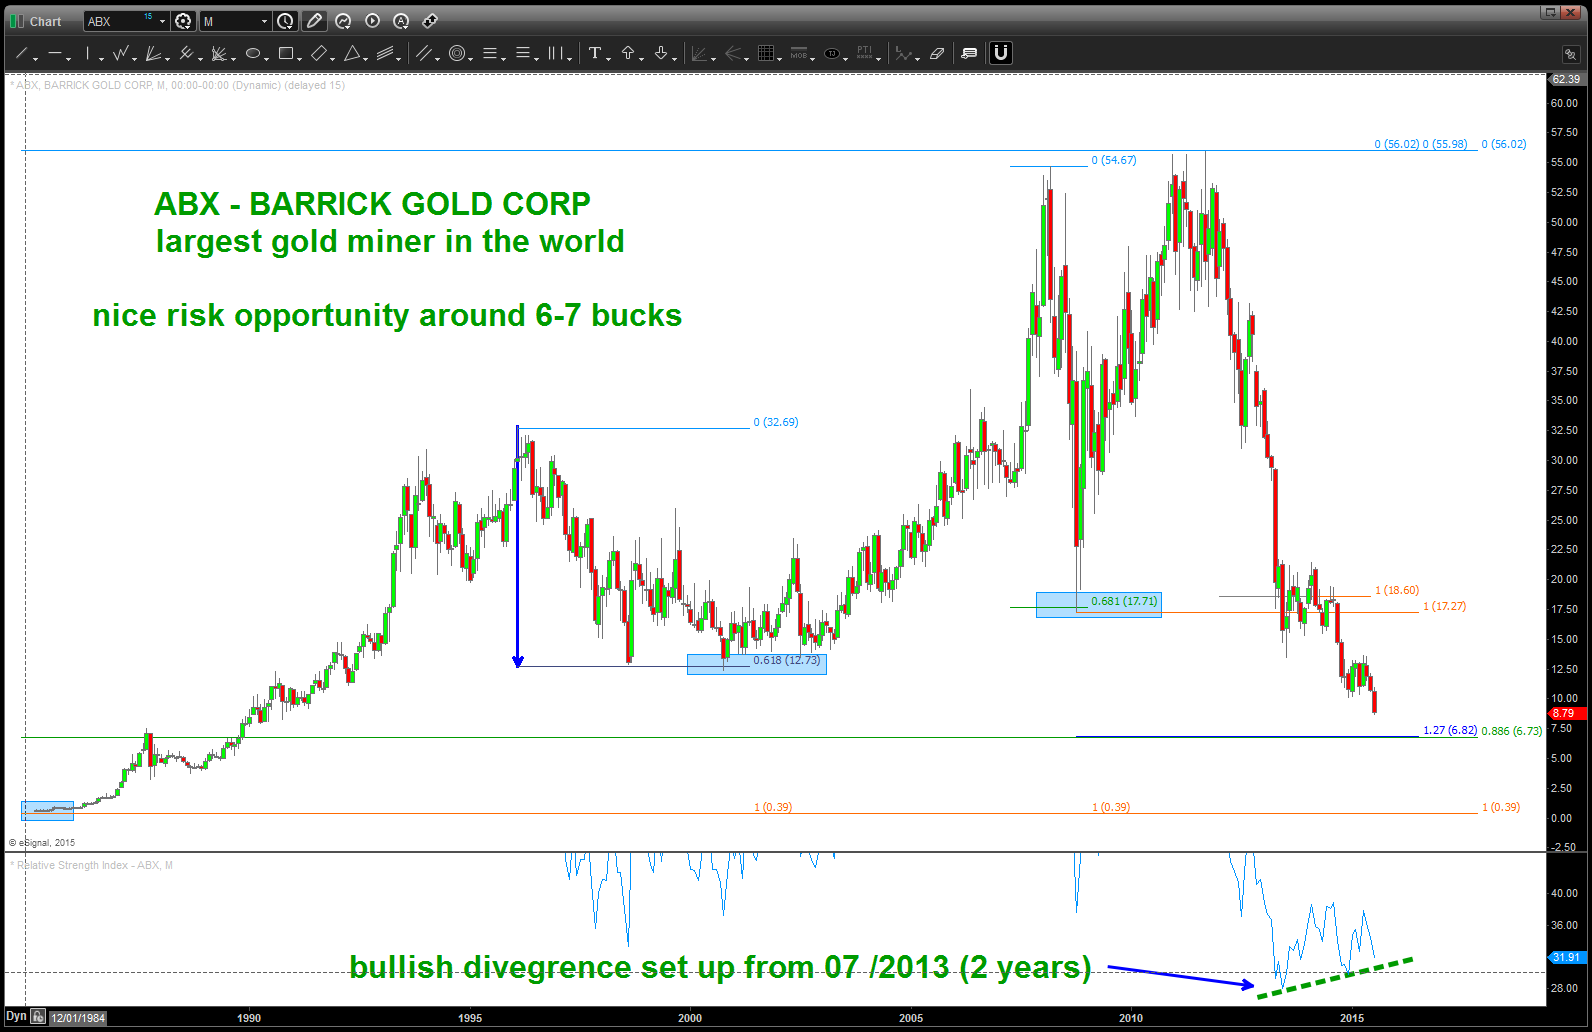
$ABX – NOTE the bullish divergence 2 years in the making
So, again, PATTERNS fail and PATTERNS work and it’s all about managing the risk. NOTE – it went below the “actual” pattern by 60 cents or so but “ultimately” close right at 6.18 (.618) It’s a Friday and, frankly, I’m too tired to figure out “why” it stopped where it did … but, trust me, there is a reason.
have a good weekend …
B
PS — note, looks like a we are in a 3rd of a 3rd so a pullback “could be coming … believe 18-20 dollars is a very nice target to shoot for. Will watch over the coming weeks.
