TWTR angles …and Jupiter
it’s a common practice – an a good one – to draw “trend lines” from high to high or low to low.
essentially, trying to connect highs and lows. it does work …but if you stop and think about it, what are trend lines?
they are points in PRICE and TIME that the market balances and either bounces off of them OR goes thru them and, as a chartist, you hit erase and get back to work. you never know “which” one is going to be the “best” or “work” but they do work.
so I like to play around w/ trend lines …
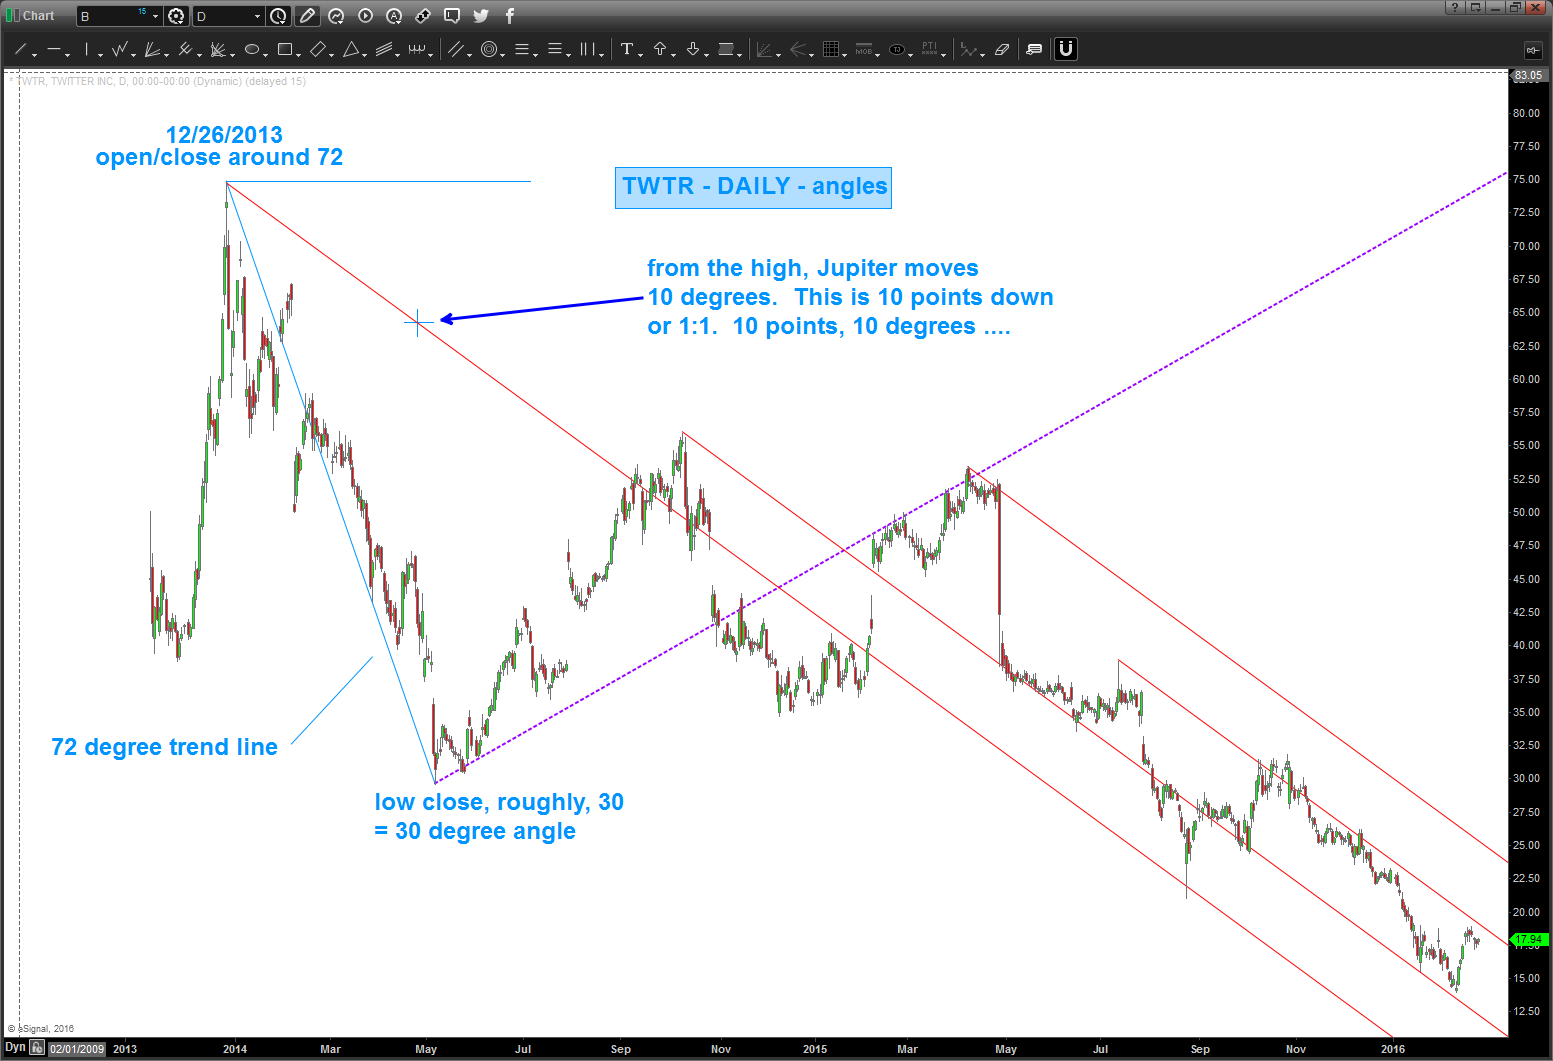
- if Twitter, on 12.26.2013 topped (O/C) around 72 bucks and started down THEN how about a 72 degree trend line down?
- if Twitter then bottomed around 30, how about a 30 degree trend line up …?
- if the market vibrates ( I believe it does and truly DO NOT CARE if you do – just saying what if) then energy foot prints from the planets might leave a signature? perhaps?
- so, using HELIOCENTRIC (sun centered) movements what if we did a 1:1 correspondence of “points moved to distance traveled?”
- let’s use easy numbers like – say 10.
- so, move Jupiter 10 degrees helio and move price 10 degrees and draw a trend line thru that …?
- might be crazy but that Jupiter Helio constant movement give us a nice slope, doesn’t it?
again, it’s a sunday morning and I’m just messing around …