if you want to know what’s going to happen, read this post.
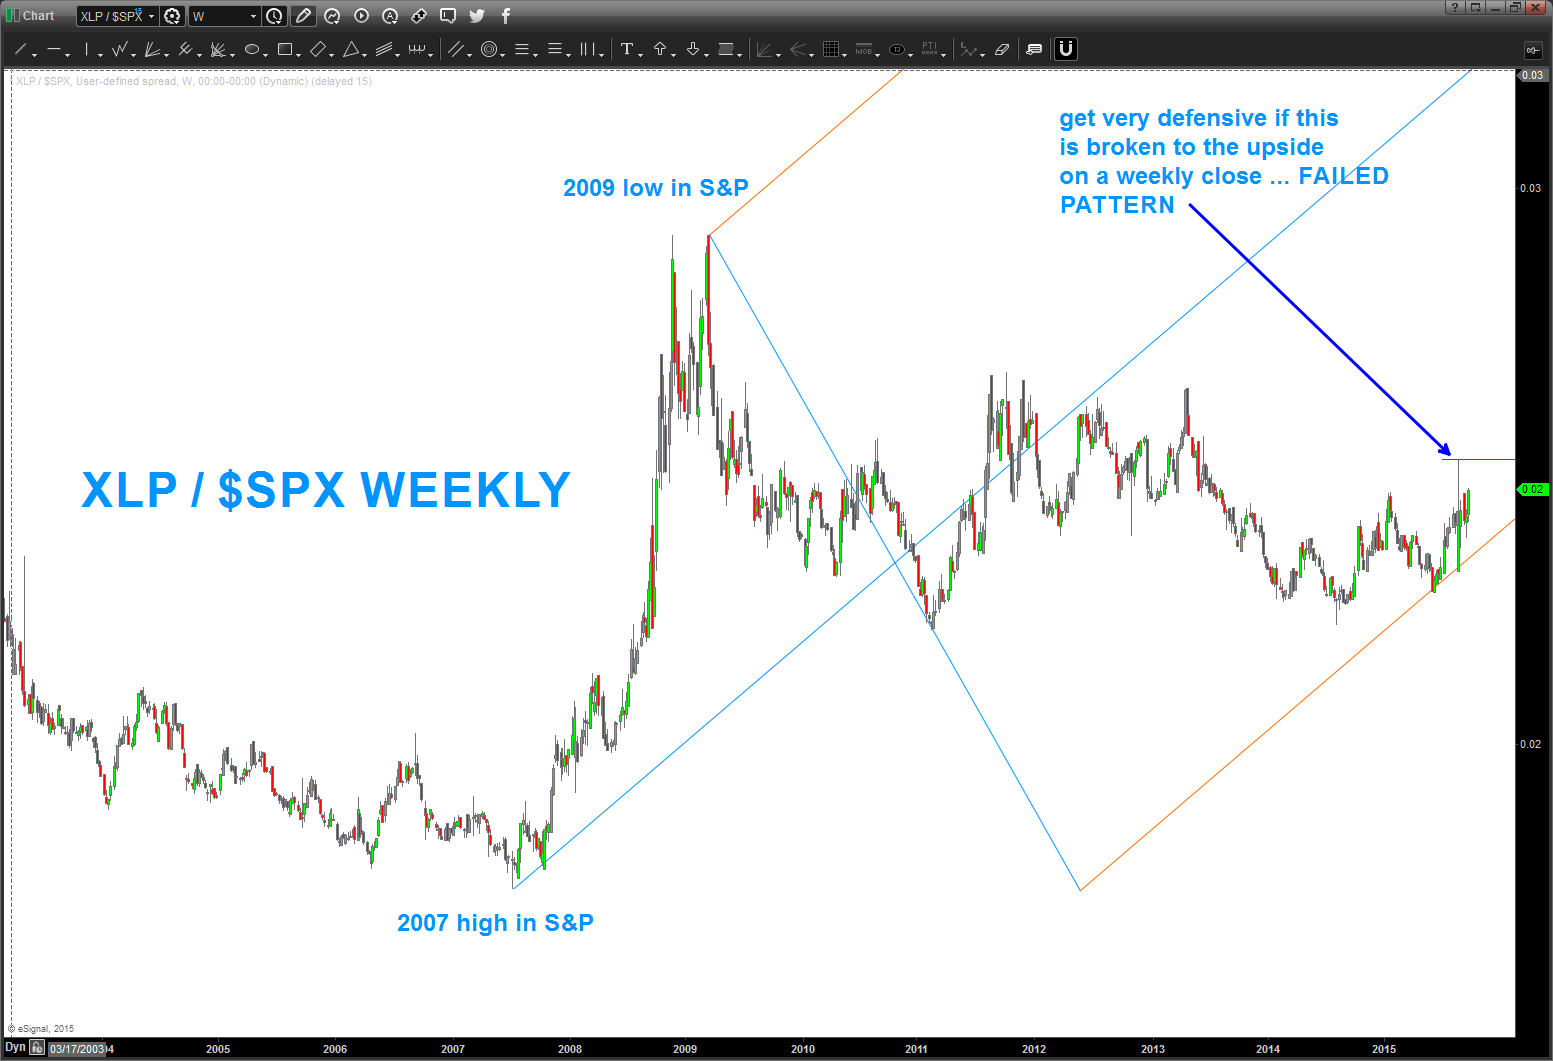
update as of 9/26/2015 – so far we have not taken out the high of the pattern on the XLP/S&P ratio. if we close above the level indicated on a weekly basis, then become very defensive in the coming days/weeks.
so many people are talking about the FED … who cares, really. I have no idea how they set rates, no idea of PPI and CPI and no idea about any of the fundamentals. nope .. I just know patterns and when combined w/ ratio analysis I don’t need anything else.
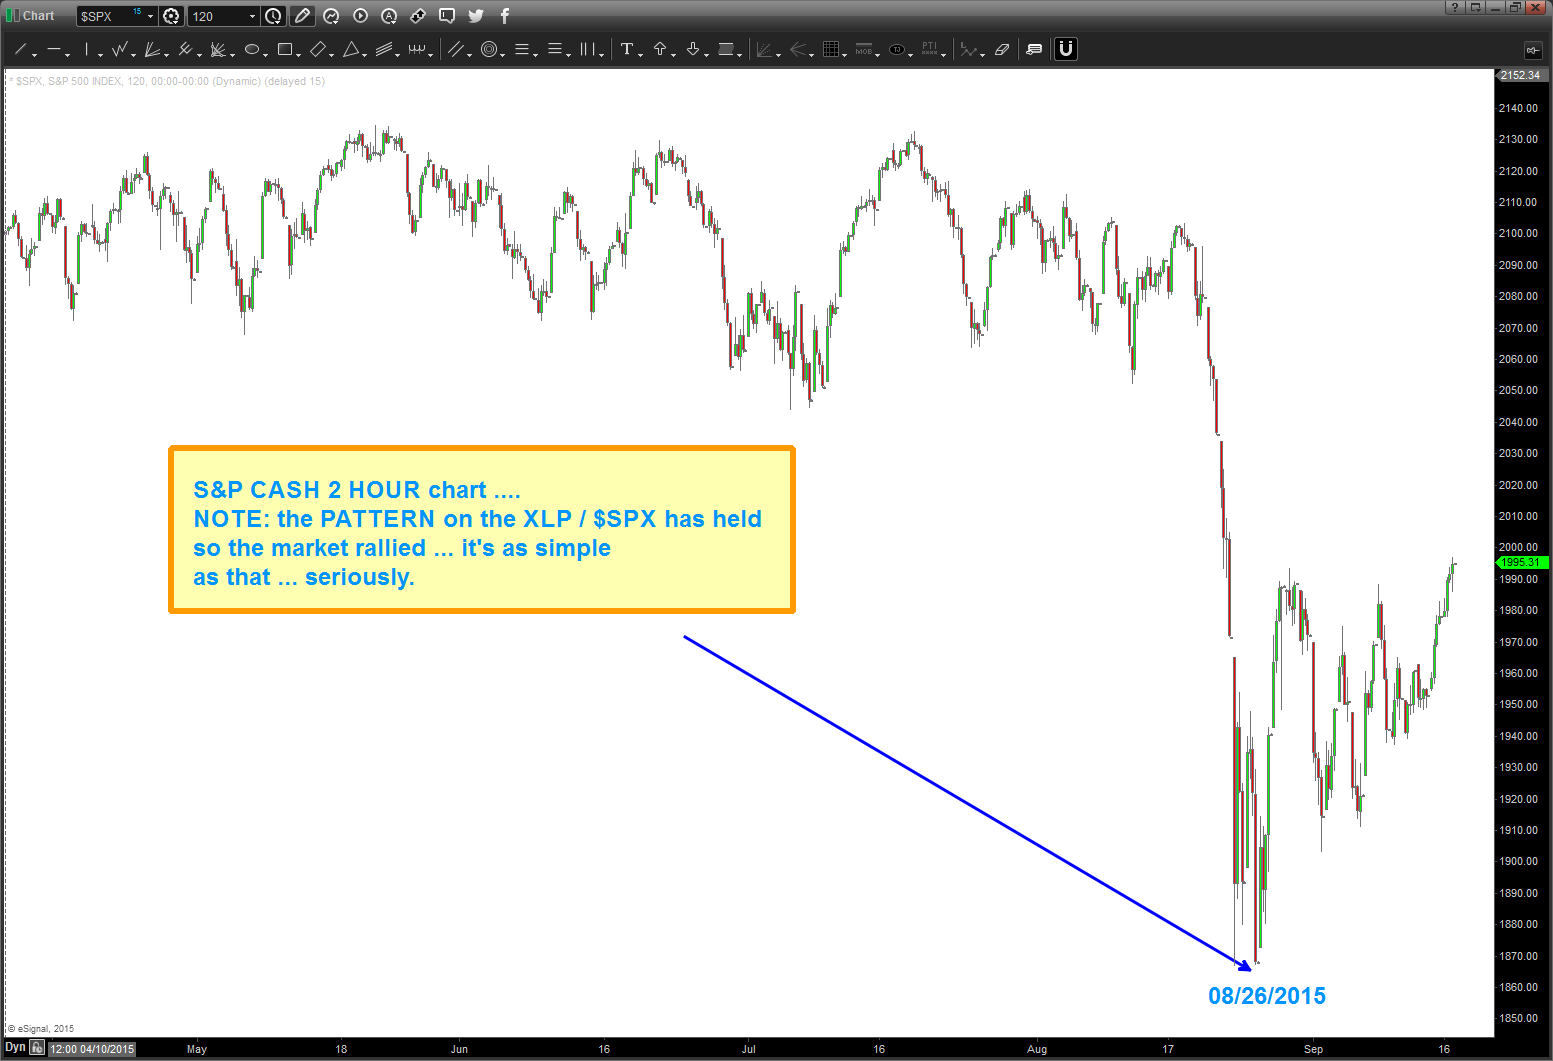
this is an update of a post that I put out on 8/26/2015
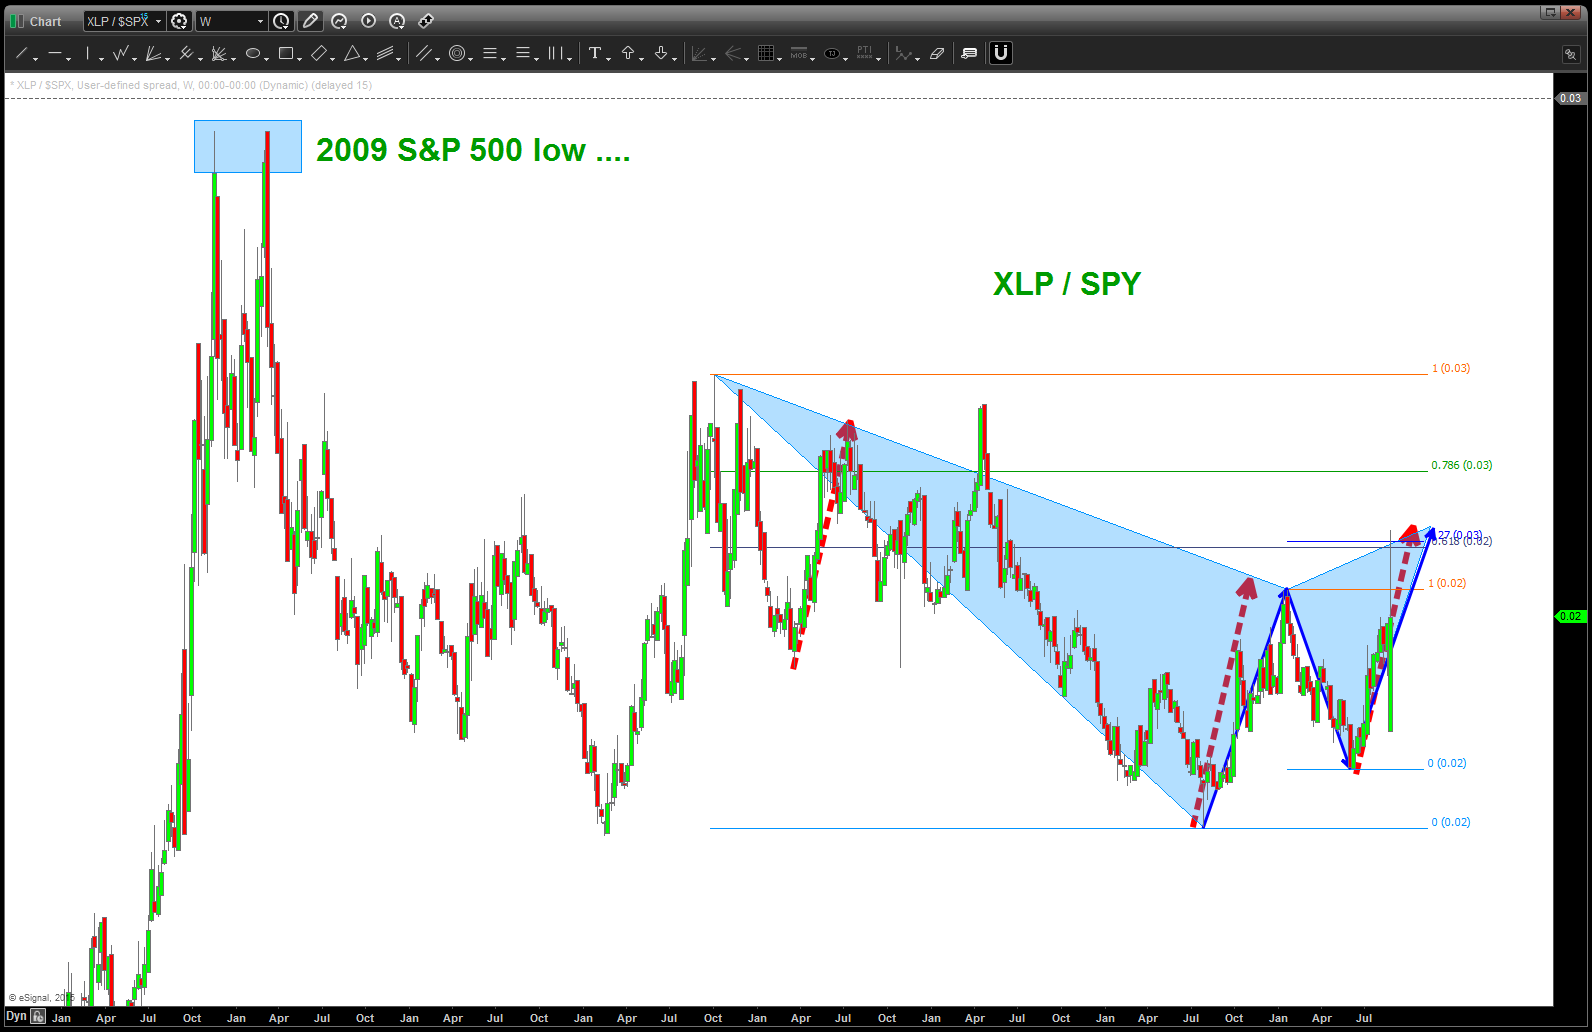
As people were jumping up and down saying CRASH and saying BUY this pullback I was simply looking at patterns. This beautiful SELL pattern worked – perfectly. In the ratio analysis – when the chart goes up the Staples are outperforming which means – institutional rotation out of risk and into, well, staples.
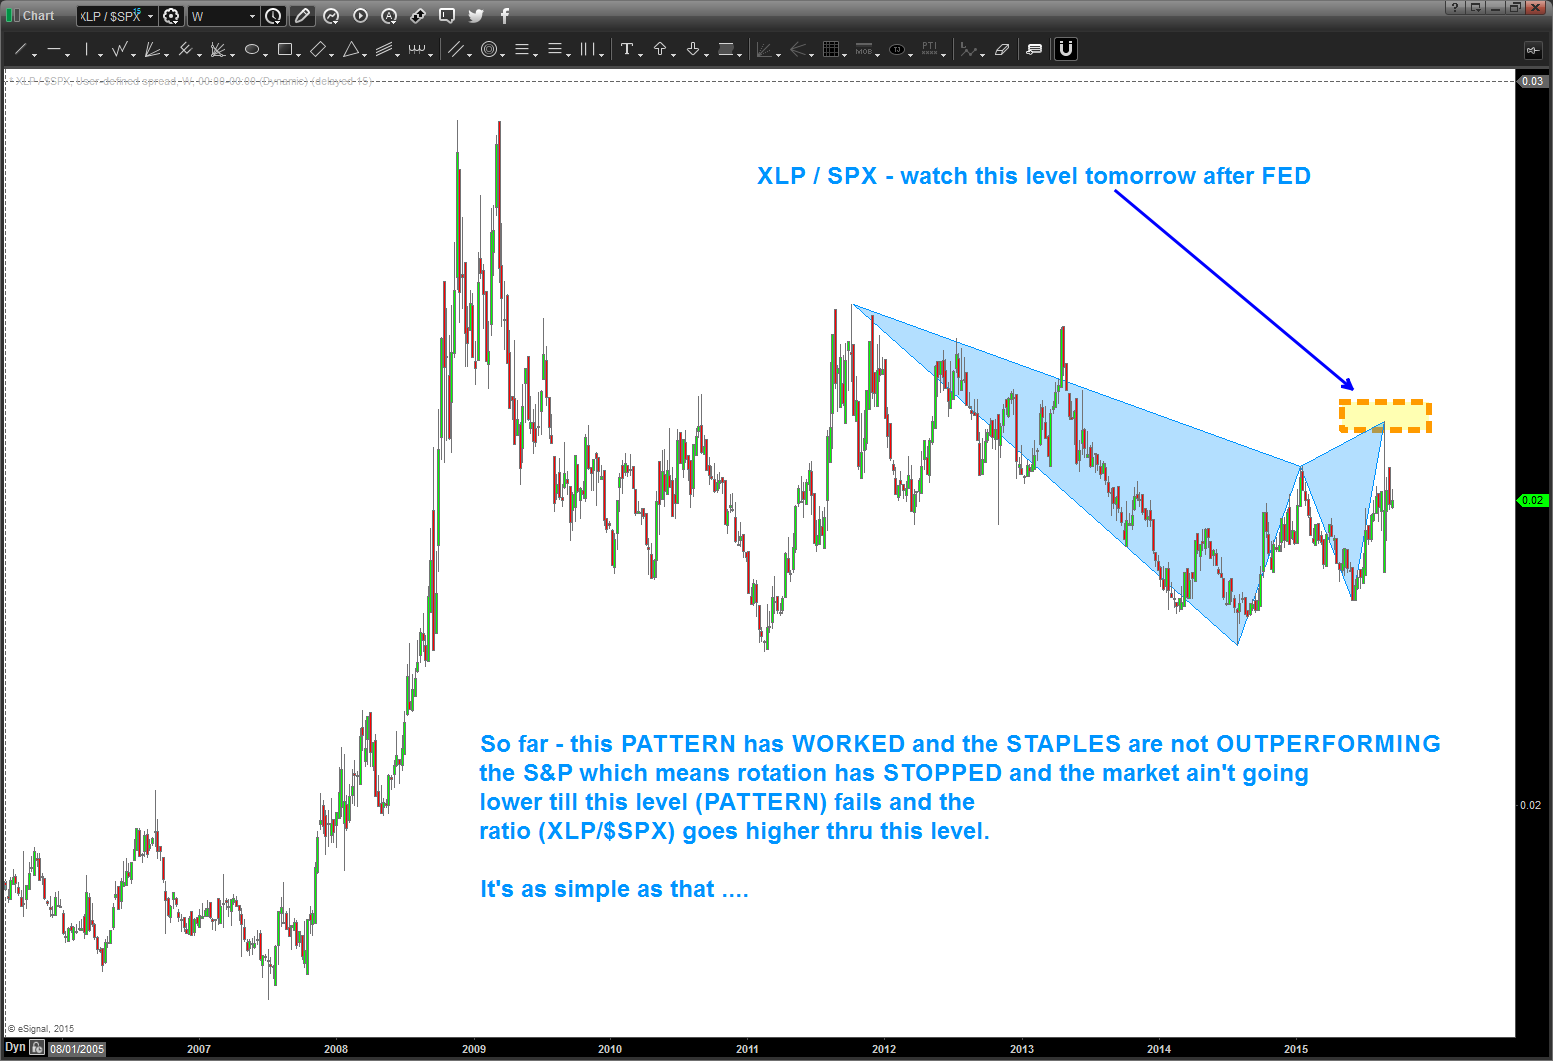
here’s the updated chart as of the close today – it hasn’t sold off tons but it certainly hasn’t closed above this level …
so, in the world of ‘if-then’ lets work thru this …
IF the ratio closes (daily) above the SELL PATTERN then the market is going lower, potentially much lower.
IF the PATTERN holds and the ratio stays below the PATTERN level THEN the market isn’t in chaos mode …
it’s that simple, folks.
if you want, search the site for ratio analysis .. it works and the key is it really gives you a feeling for how the big boys are moving the money around … this move isn’t about “Mom and Pops” folks, it’s about institutional money flow …
we’ve done this before but here it is again:
- if volatility rises XLP (staples) outperforms the overall market
- when volatility goes away rotation out of XLP occurs.
today’s move to be expected … a monster SELL of the XLP/SPX ratio occurred.
now, the key will be this level and what happens in around it in the next few days.
B