TBT update
Posted on January 8, 2021 Leave a Comment
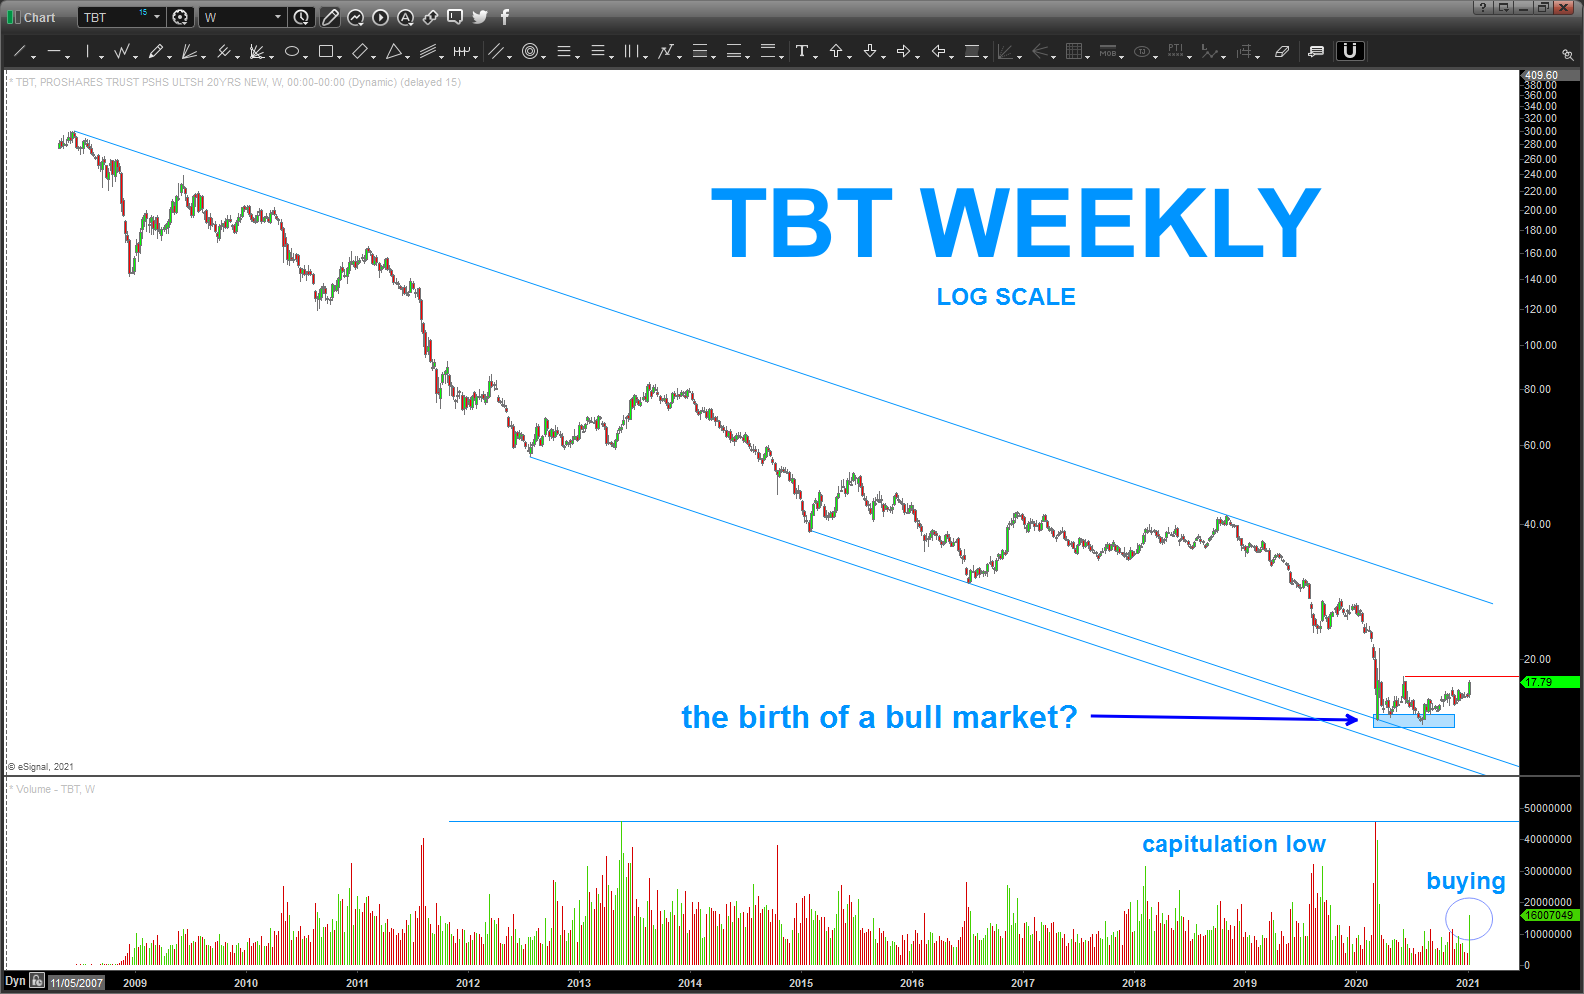
the last time blogged about TBT was here: https://atomic-temporary-44460632.wpcomstaging.com/2020/03/08/tbt-buy-no-im-not-crazy/
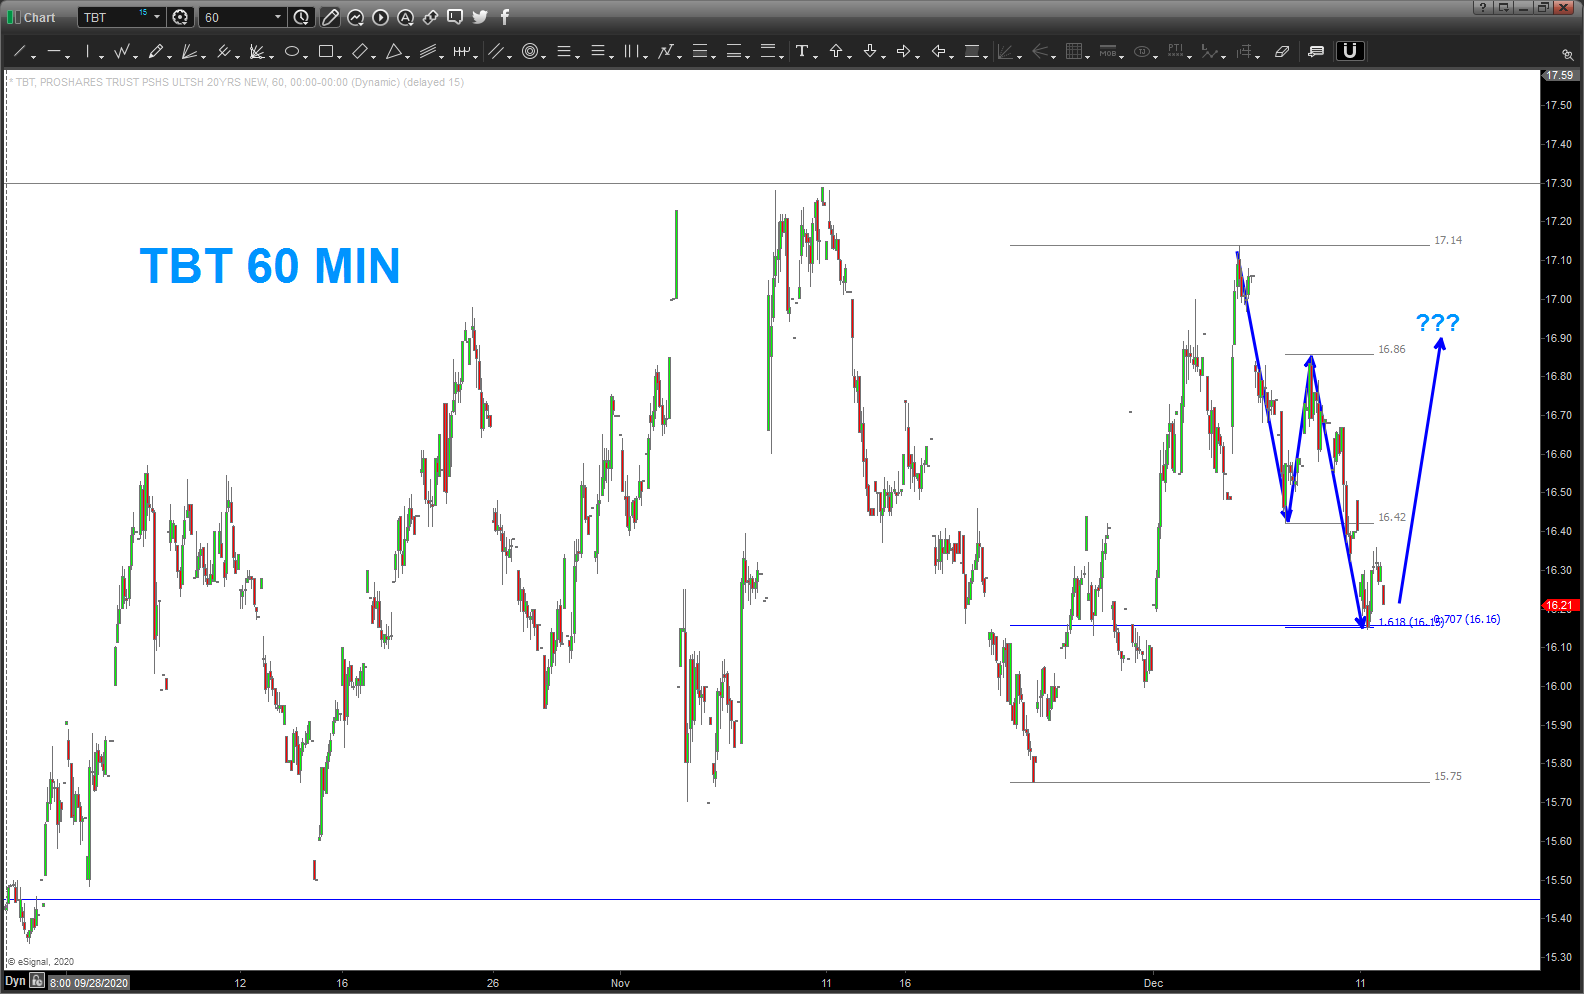
doing an update as we can see the well defined downtrend that has been in place since, pretty much, inception in 2008.
if you followed some of the other Bond work on the site then you would know our thesis is there is a MAJOR HIGH in bonds (TBT is the inverse) so, we could be, perhaps, looking at the very beginning of a BIG run in TBT.
yes, interest rates to rise and, potentially, rise VERY fast …. hang on.
Bonds …time to pay attention
Posted on December 11, 2020 Leave a Comment
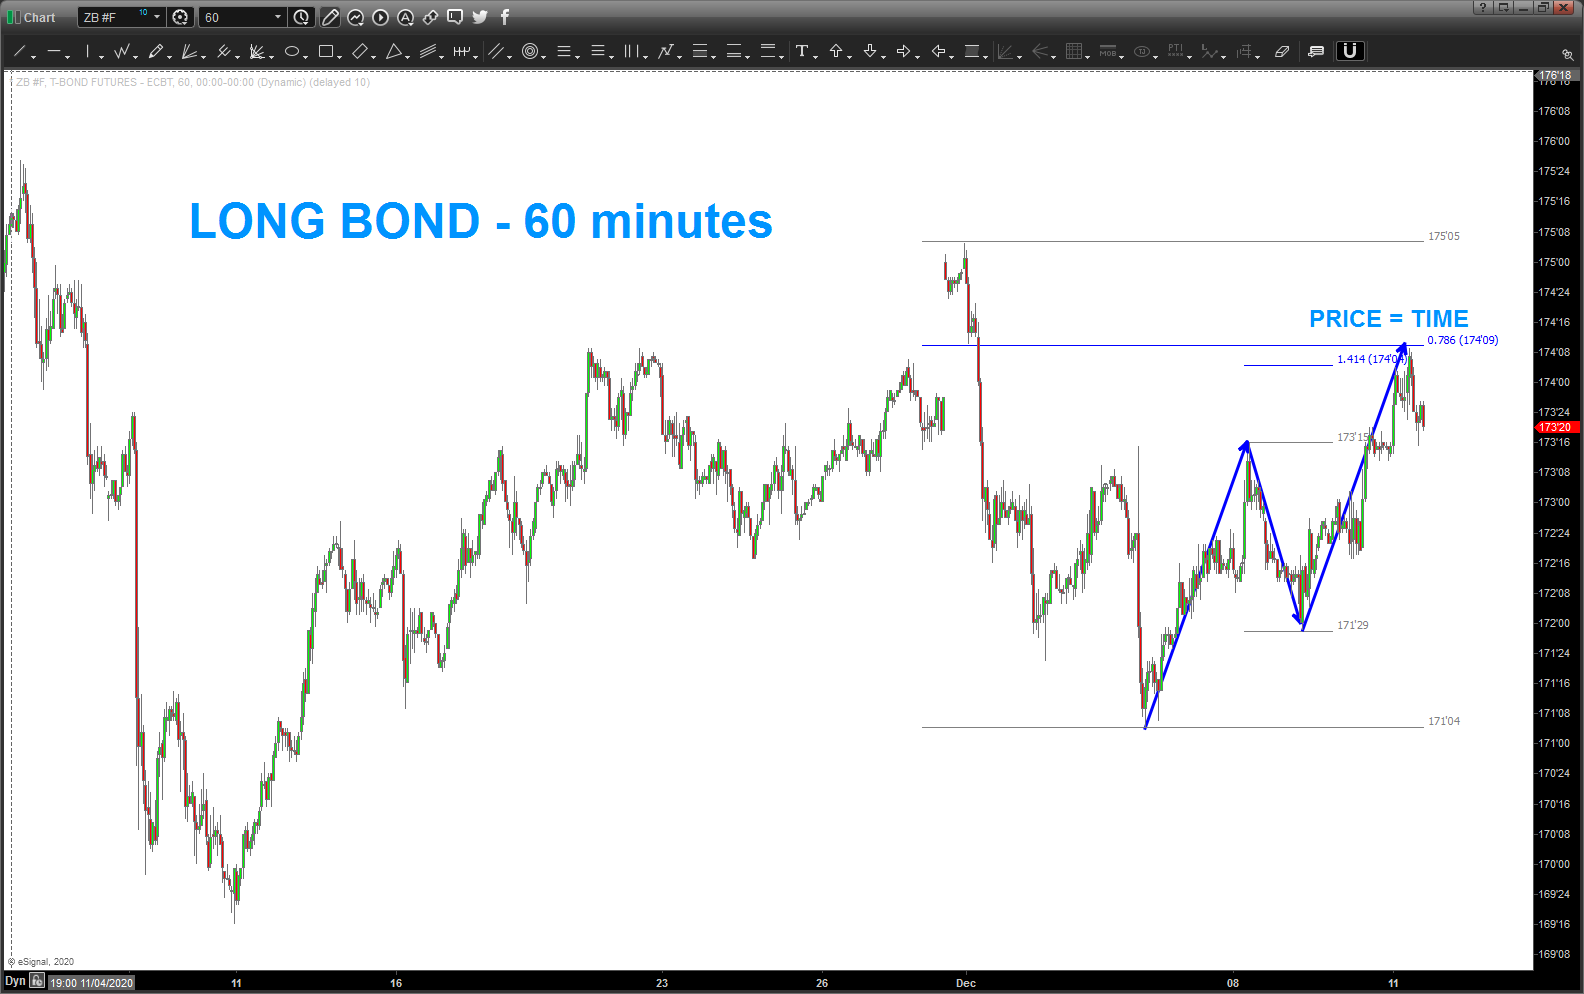
perfect TIME and PRICE patterns were hit today and, IF (a really big if) the count is correct we are on the verge of a very powerful move in the bonds ….
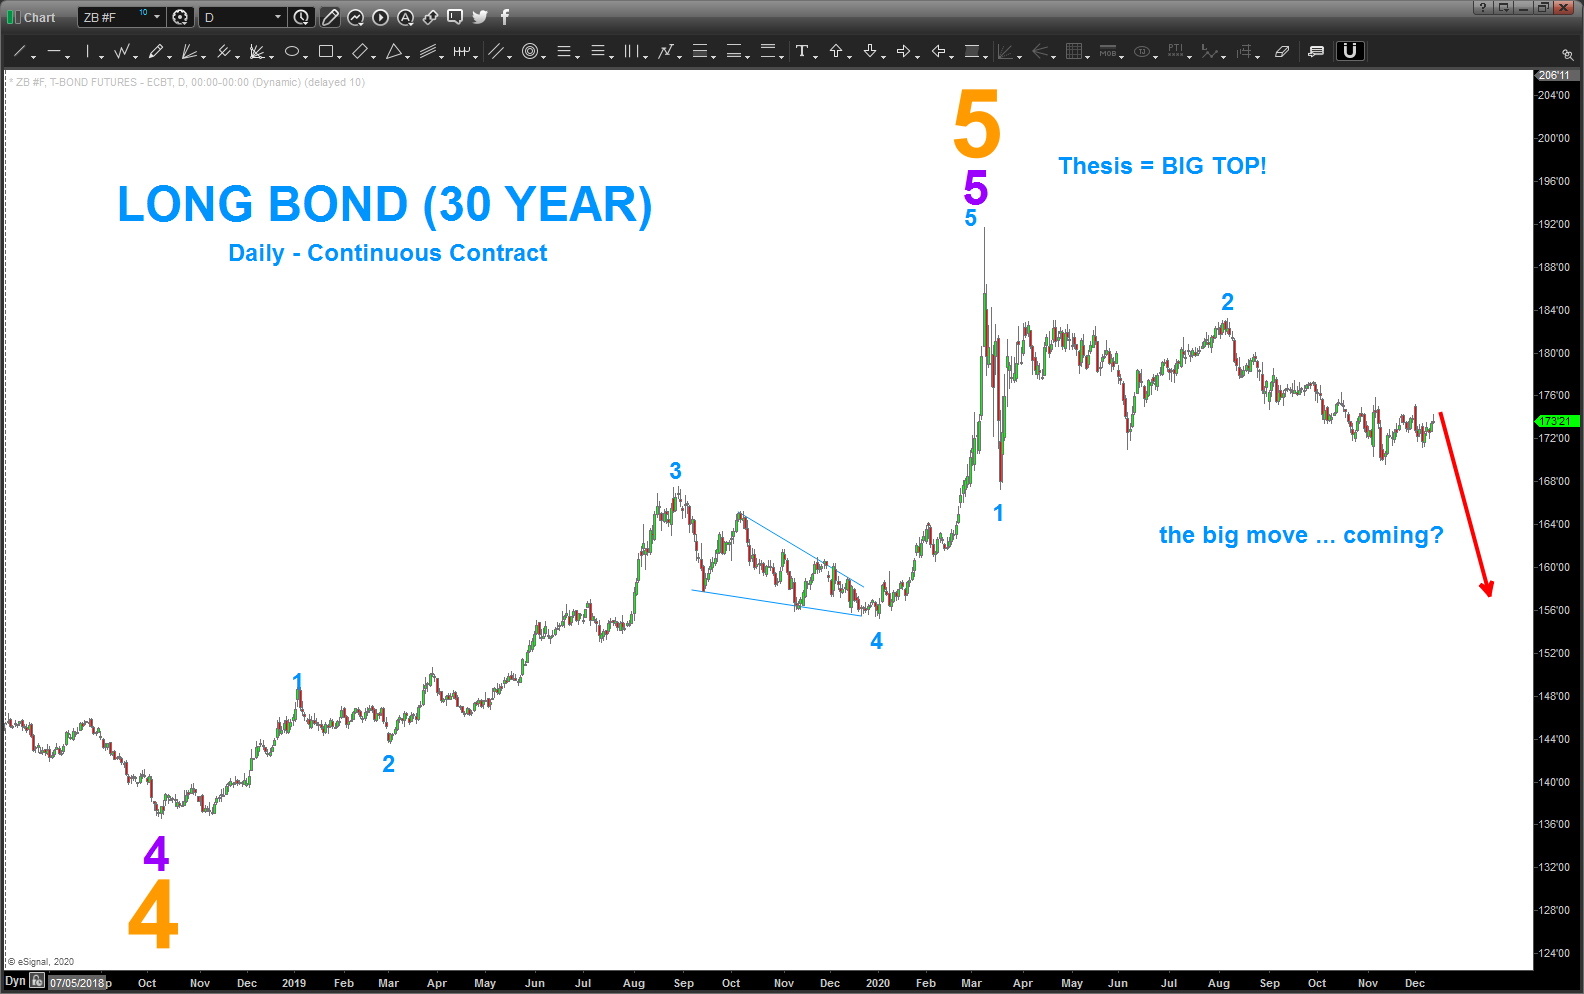
the thesis was that we had a VERY VERY large top in March of this year at multiple waves of degree. the pattern that hit today was one of those text book sell PATTERNS and the price reacted. here we go?
Natural Gas and UNG
Posted on December 3, 2020 1 Comment
if you search for Natural Gas on the blog, you’ll see for almost 3 years – yes 3 years, I’ve been flirting w/ a low (big low) on Nat Gas and looking for the pop … back in 2017 we ID’d a pop but it quickly got run over. Wrong …and, since then, I’ve really just dropped it off my radar.
two of my really good virtual (unfortunately) friends from the Academy, Rugby, flying and blah blah and me trade texts back and forth. they act all smart like they are finance guys about the news and the P&E (did I spell that right) and fundamentals .. I just look at PATTERNS.
they asked about Nat Gas. “Great,” I thought “I can go back and visit my old nemesis. and, I would be an idiot to forget what now President Biden said about energy, right? One would think it would be falling out of the sky. EXACT opposite.
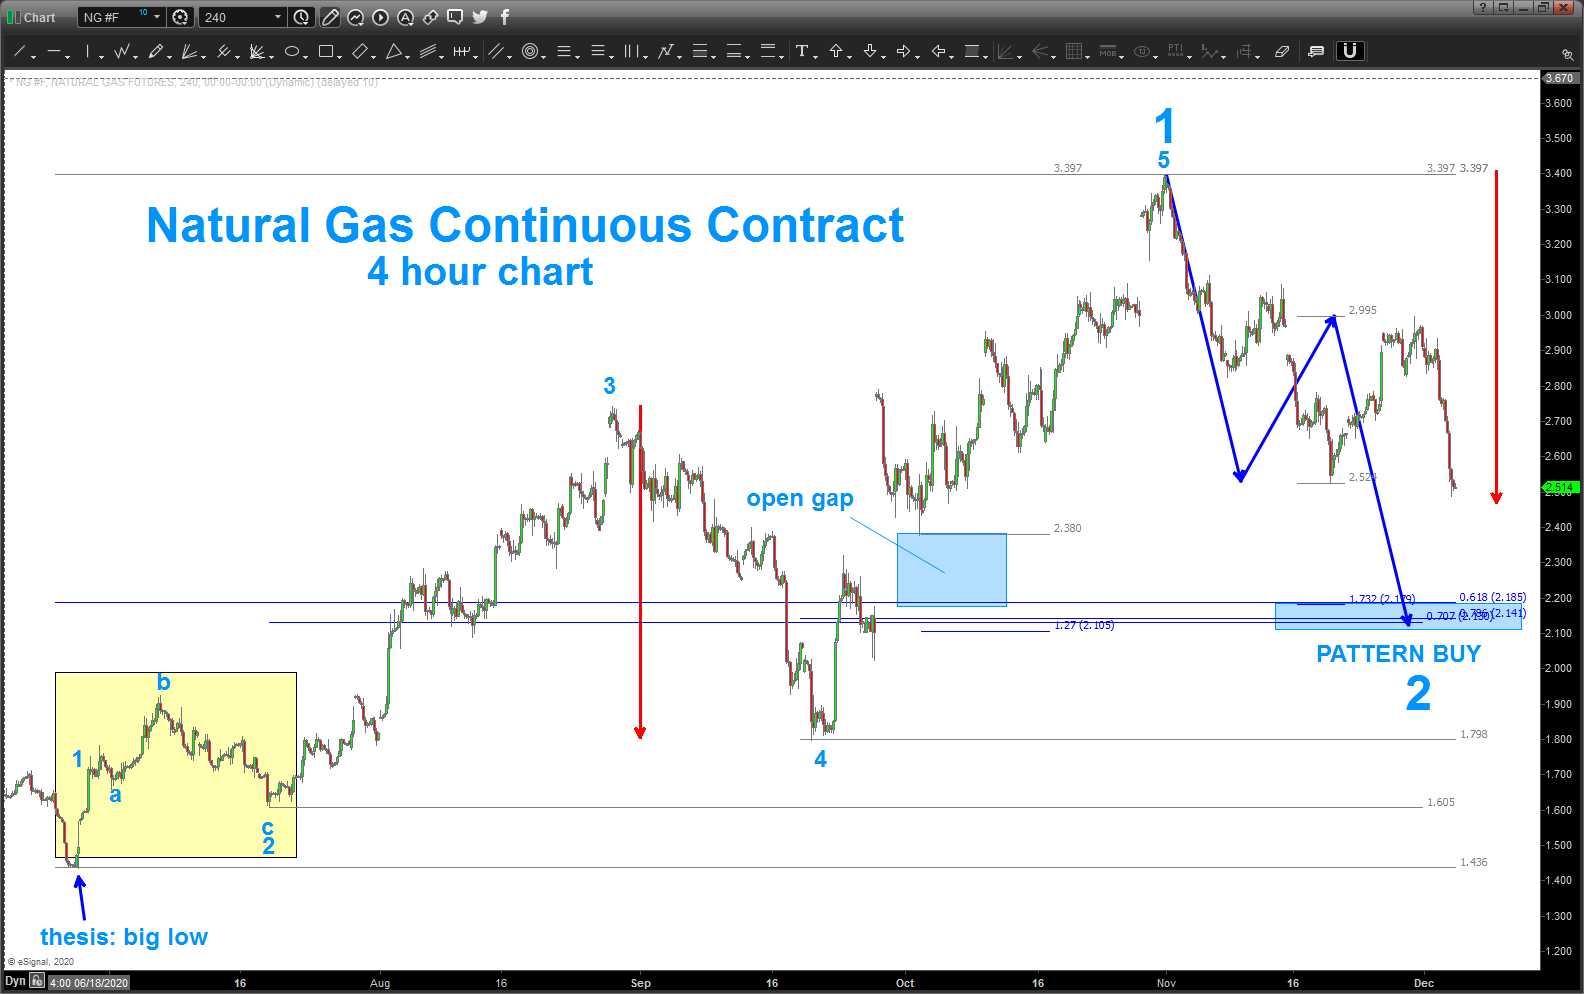
I believe it made a VERY big low in July, it just finished a 5 wave move up from an “ending diagonal” and we have 5 ratio’s (retracements, extensions, measured moves, projections) all coming in at 2.2.
I do want you take note of the yellow area at the left of the screen .. on a daily, this area looks like an expanded flat. however, when you drill down to a lower time frame (here a 4 hour) it sure looks like I’m curve fitting – which I might be, just being honest. I’m putting a bias into the fact that I’m right on the thesis: BIG LOW. that changes things somewhat because wave 4 CANNOT go below the end of wave 1 (or above if going down). sometimes you can dirty your purist mindset and maybe go w/ a CLOSE below 1 and if there is a daily wick or two right around the end of 1 you can curve fit and the count continues. folks, in this case 4 was below for almost 10 days … that’s a broken rule and an invalid count. see how fun Elliott Wave can be …?
one last, if you look at where the “PATTERN BUY” level is at that 2.1-2.2 zone one will see that the PATTERN completely closes the gap left on the 4 hour chart … nice.
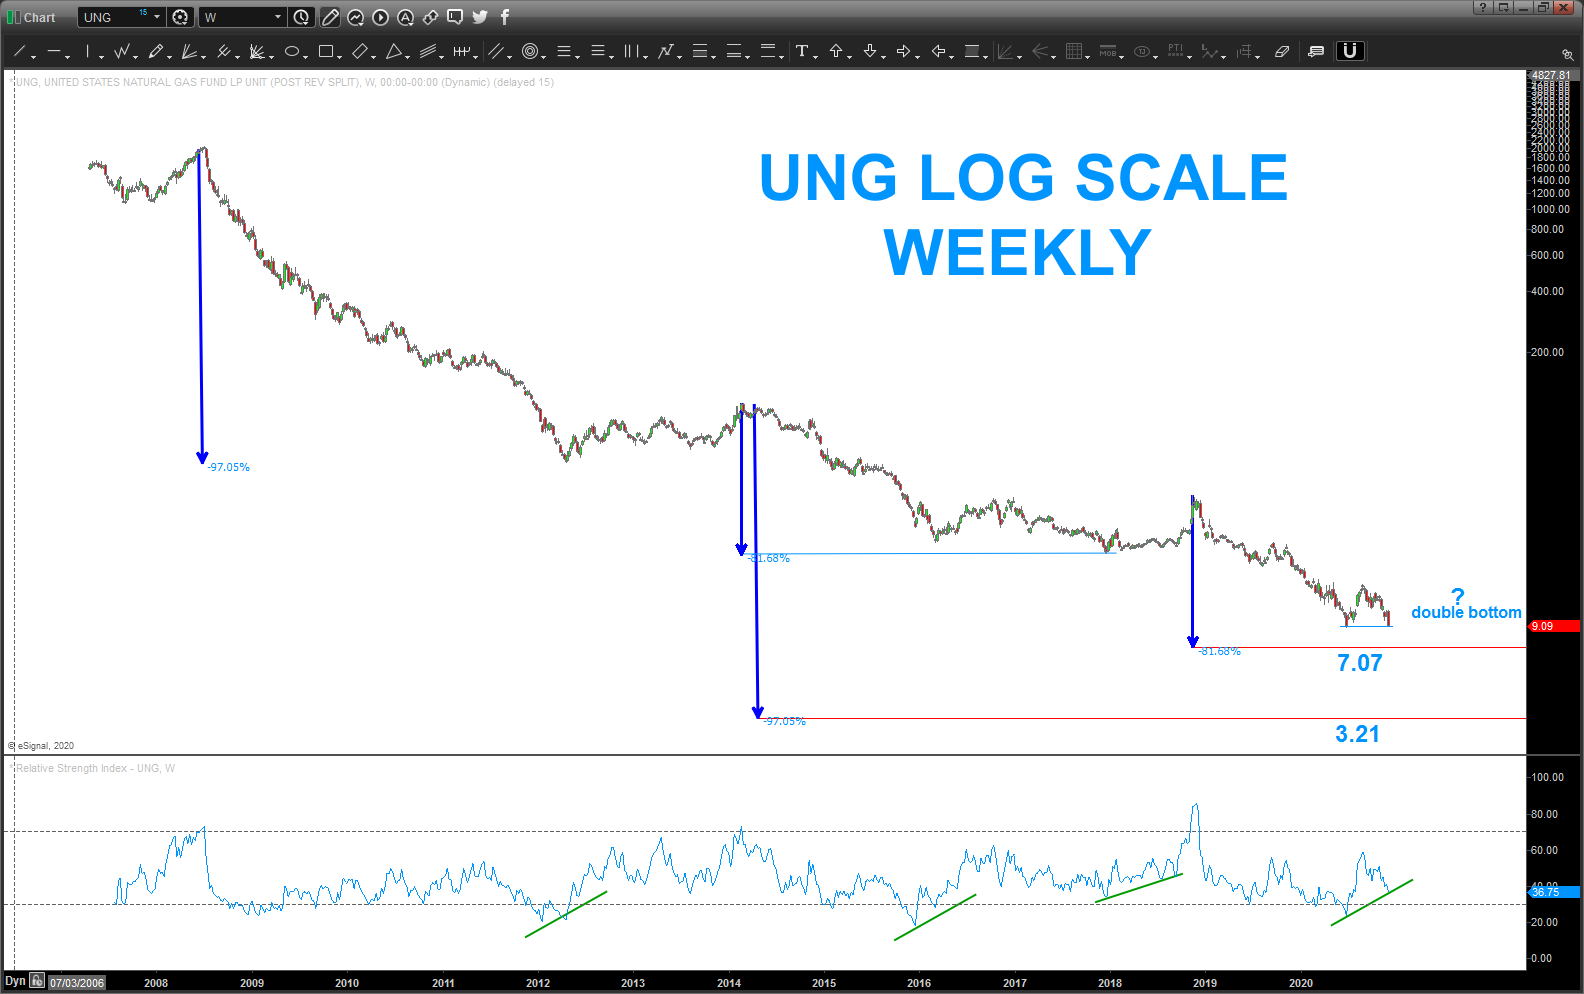
If you look at UNG, it hasn’t budged so if your going to play the ETF/Fund side of the house, I would recommend that you wait to BUY until Nat Gas hits 2.2 on the continuous futures contract.
UBER
Posted on December 2, 2020 1 Comment
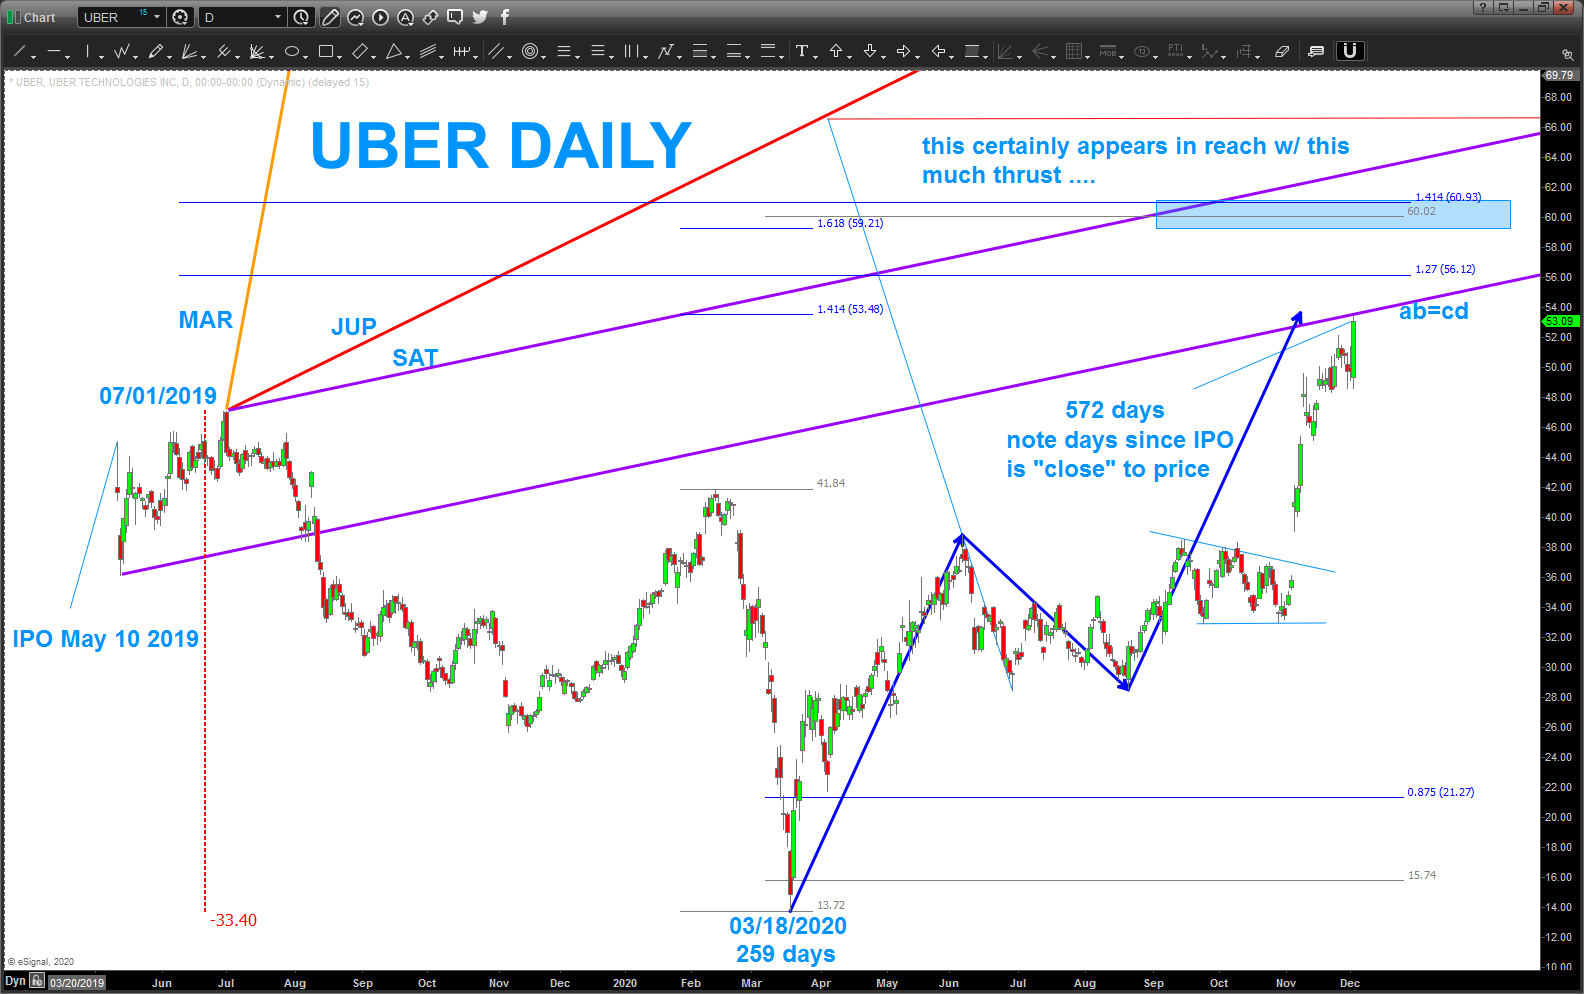
lot’s going on here … I’ve told peeps before “I’m a musical technician that uses crayons!” 🙂 I enjoy sitting down and seeing what the chart will tell you. it’s relaxing.
Uber popped into my mind after the mind boggling pop I heard about today. no other reason than that … anyhoo, you’ve seen me use most of these techniques before, so just hit me back or IM me and we can discuss.
bottom line … perhaps a pause here but this is impressive thrust so I would HOLD or be a buyer of dips looking to scoot into the low 60’s …
Bart
Dr. Copper – UPDATE
Posted on November 30, 2020 Leave a Comment
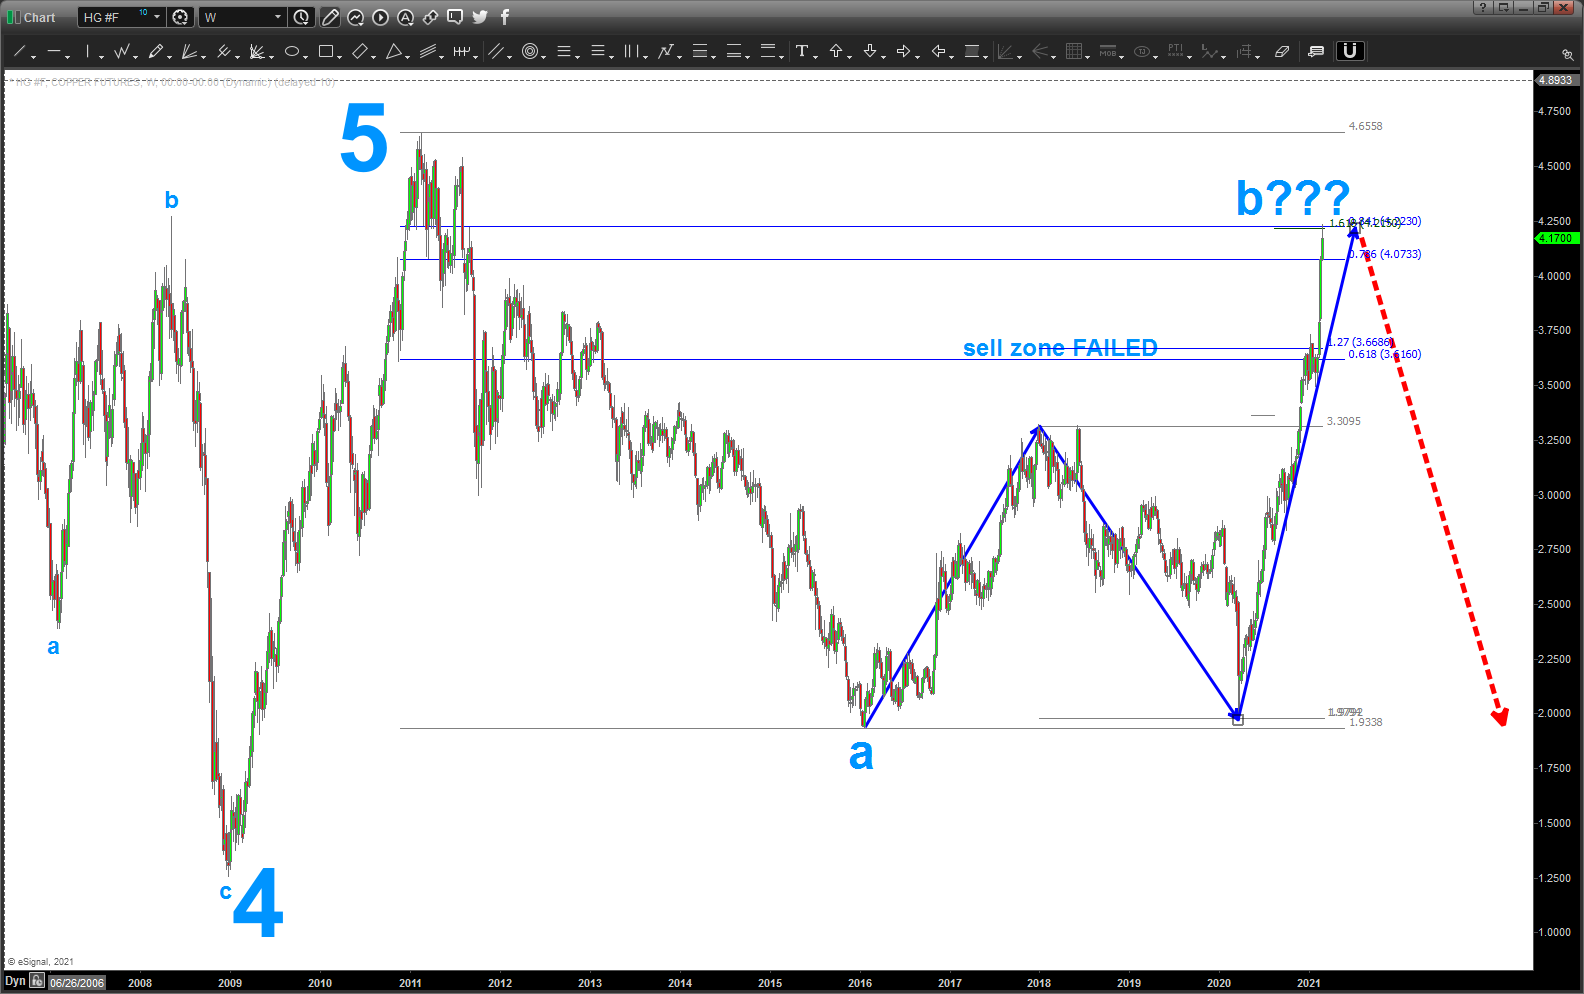
Update 02/23/2021 – the “sell zone” failed but, if you do look at the chart it basically held copper at bay for approximately 7-8 weeks, then exploded higher, just like the stock market. the past couple days I’ve been posting a LOT of 5 counts and took a peak at copper and smacked right into another higher target … yes, we have some strong thrust into this zone it’s something to take notice of ….. why? If the 5 counts are actually ending then this current level is what should hold copper, it’s that simple. If copper explodes higher, which it most certainly can, then I am hard pressed to find a reason for the equities to go down.
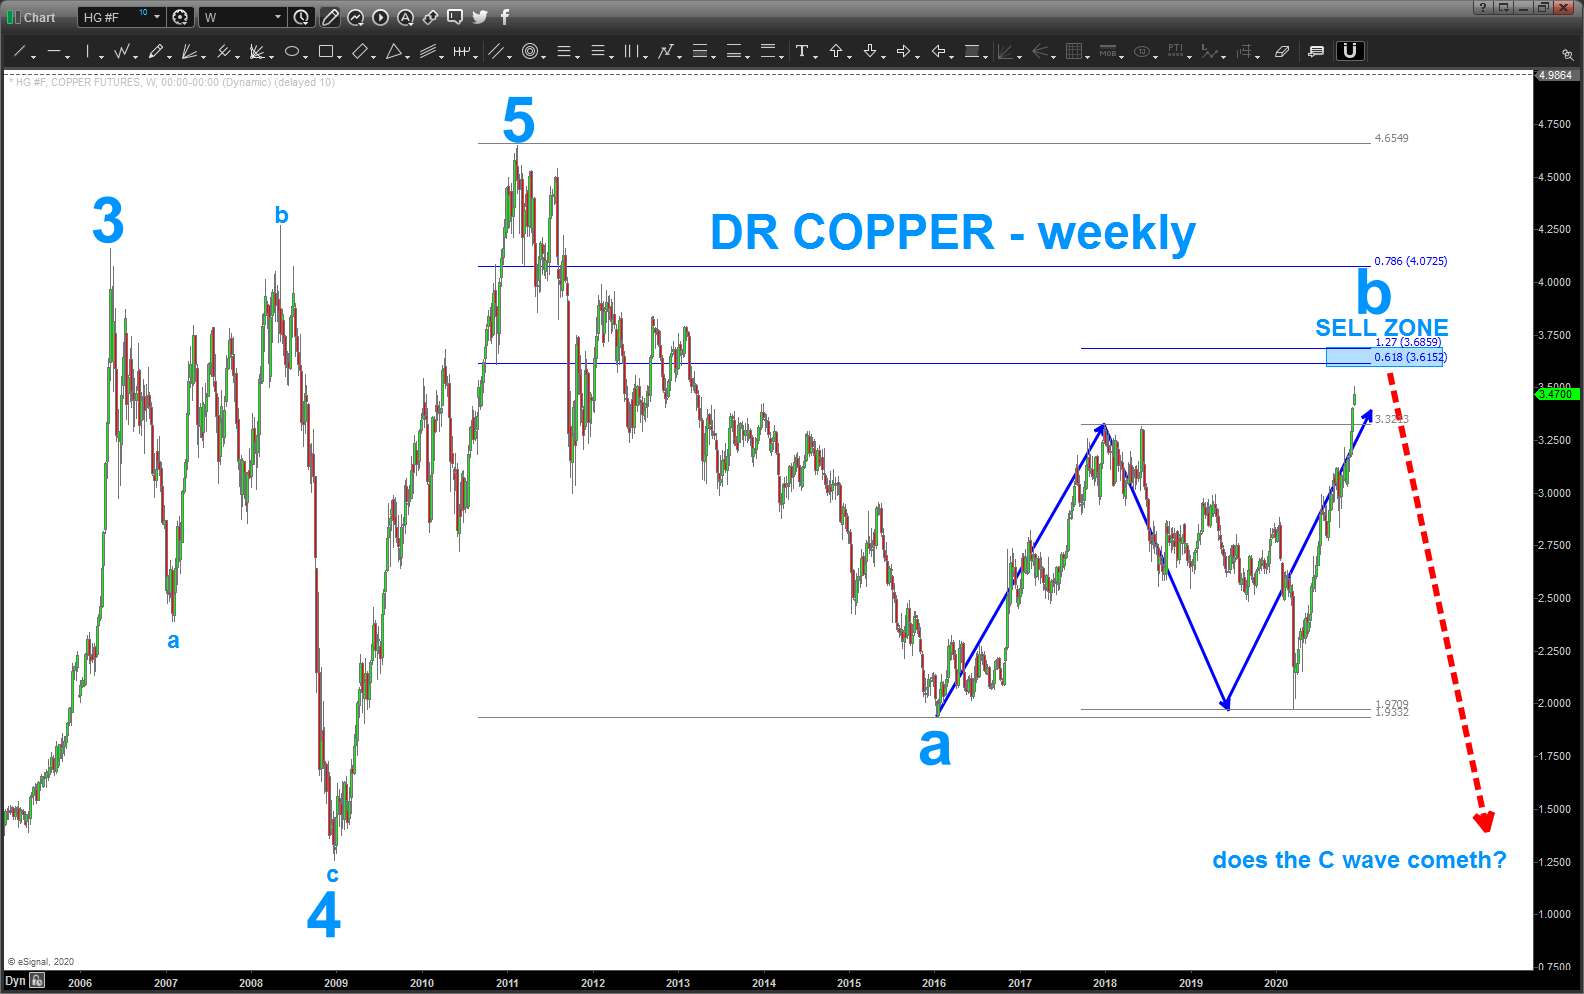
note – WATCH THIS COPPER LEVEL!
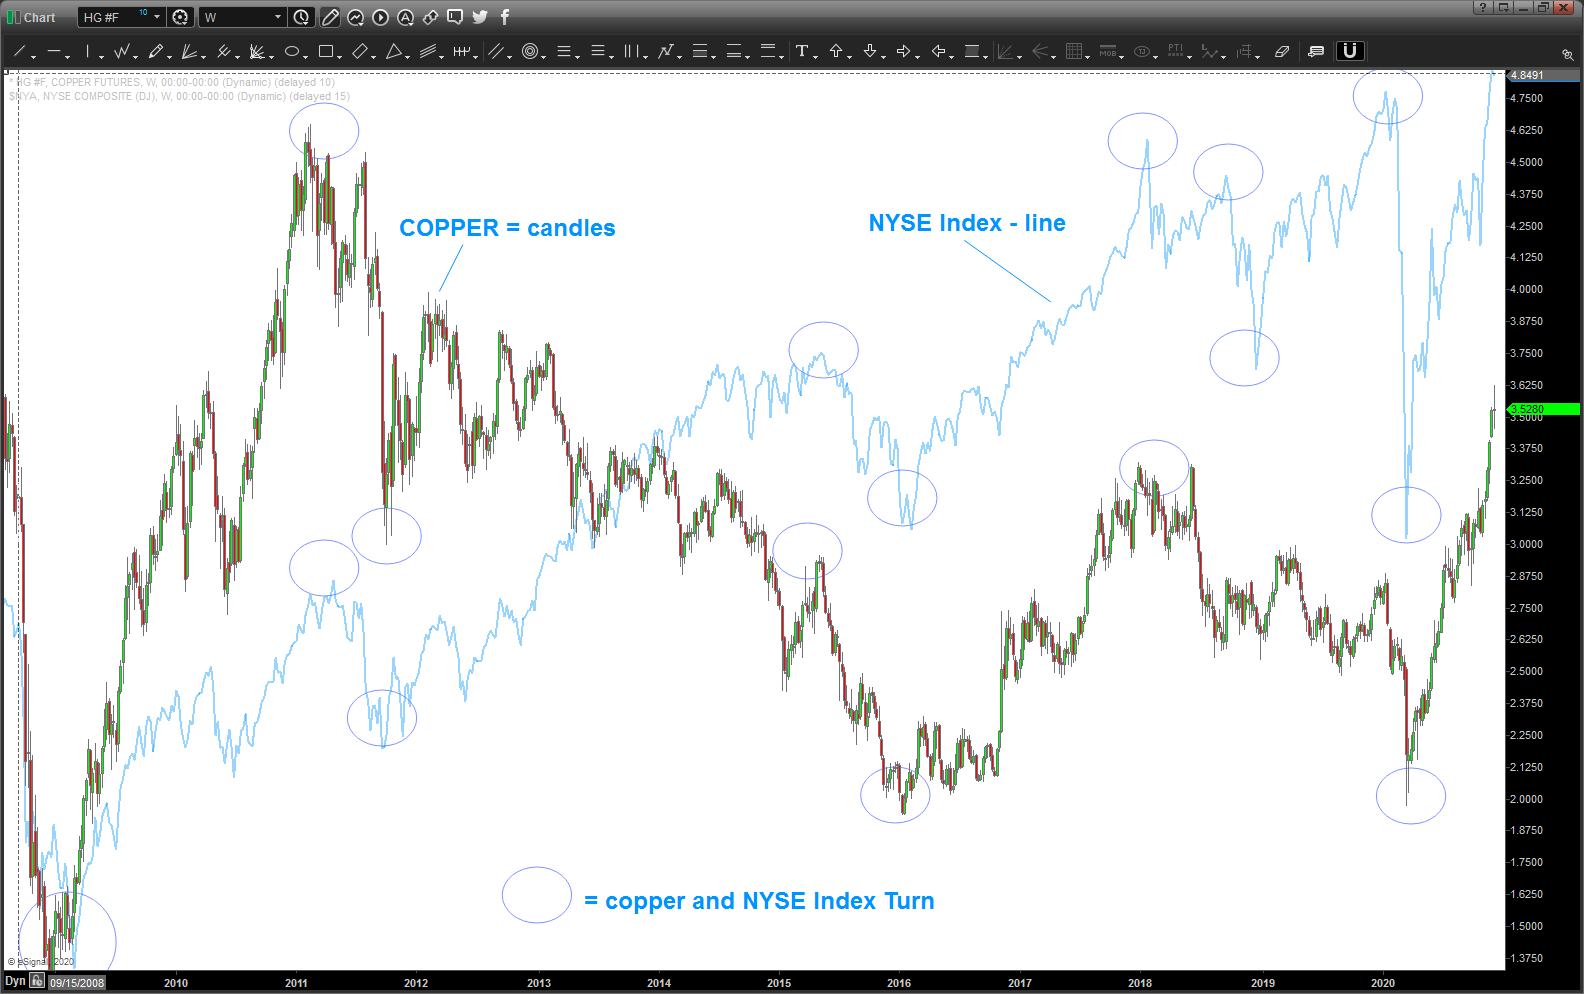
Copper,/ below, smacked right into the “SELL ZONE” … why is Copper being blogged about? Isn’t that a “who cares” type of metal? Ummmm, no. the inflection that occurs in copper has occurred in the stock market, as shown, on every major pivot since 2009, at a minimum. /
so, this “zone” is very important …. watch copper in the coming days/weeks to get a “feel” for the overall health of the market.
————————————————————–
if you’ve been following my blog you know I’ll say “I love Elliott Wave, when it works…!” for Copper it certainly has. one of my first blog posts was about absolutely nailing the low at 4 by using, you guessed it, Elliott Wave.
is it going to work again … I really have no idea. that being said, if we follow the standard Elliott corrective construction, certainly looks reasonable that Dr. Copper is finishing a trend defining “b wave” and, just perhaps, a monstrous “c wave” cometh ….
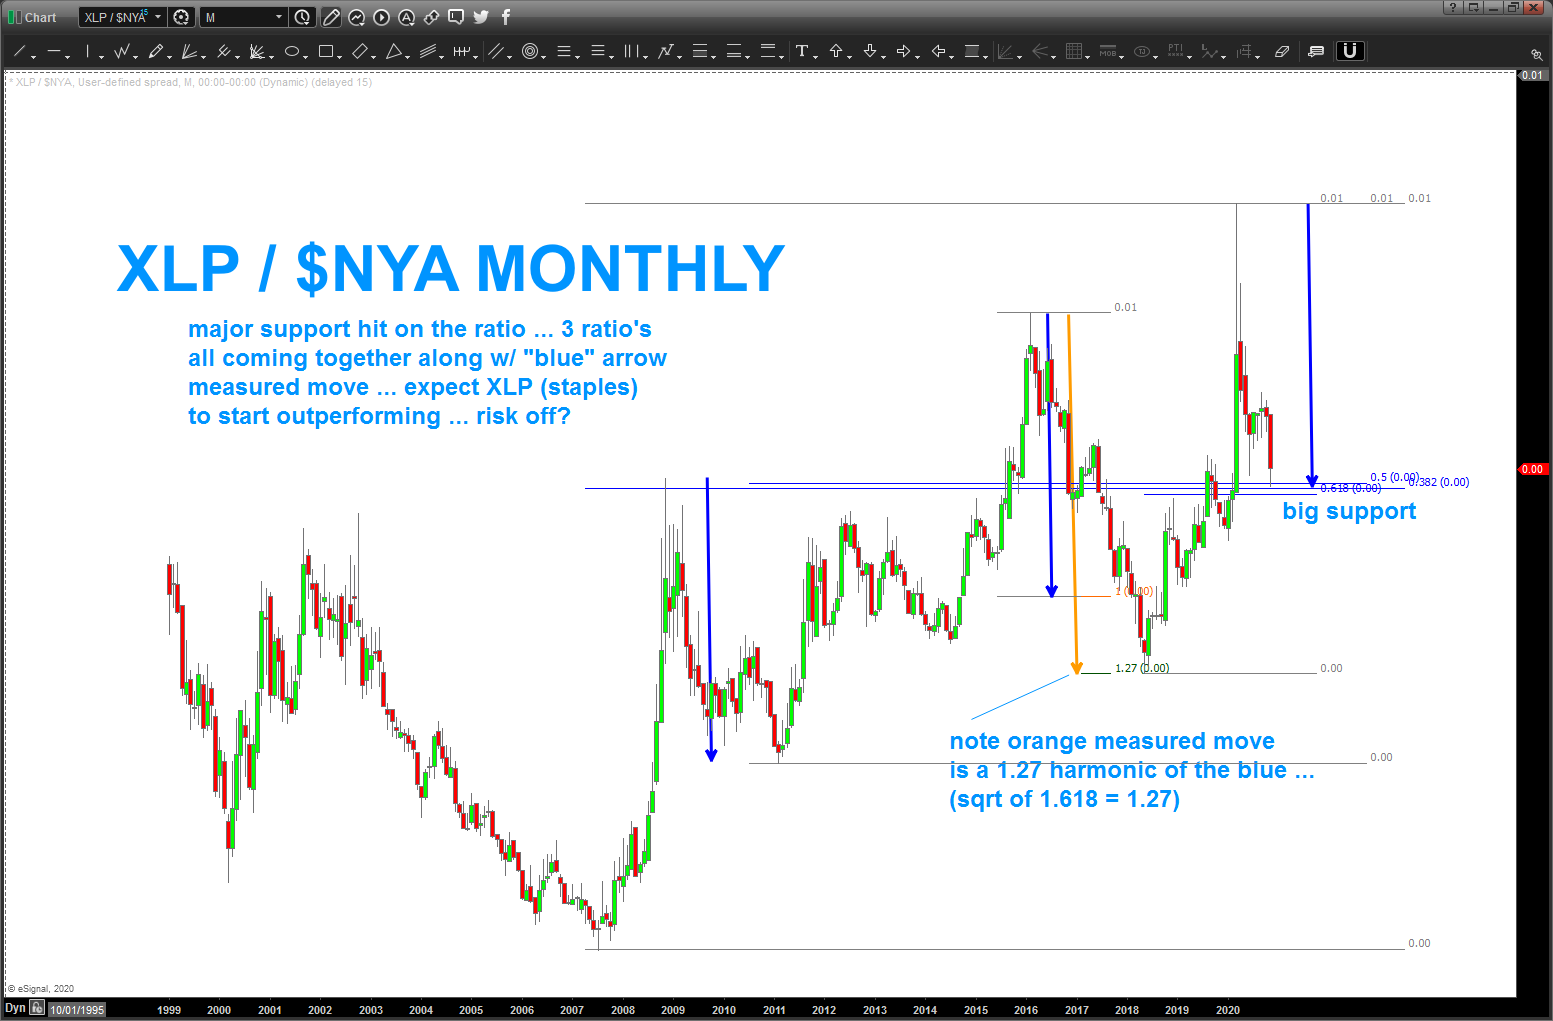
XLP/$NYA update
Posted on November 30, 2020 Leave a Comment
you can go to any financial site and check out “why” the equities sold off today … it could be any number of reasons. at the end of last week, we had a double 3 drives to a top pattern w/ timing that said “monday” is important … to me, it is as simple as that.
in addition to that, take a peak at the XLP/NYA ratio. bounced off some BIG support so the sell off is nothing that wasn’t expected.
how big will this become – if at all? no idea if it’s a one day blip or a big thump coming. just going to look for patterns ..that being said, a ton of euphoria, a lot of SELL PATTERNS and our ratio analysis showing support and Staples to outperform the broader market which usually means – risk off.
stay tuned …
DJIA 3 drives to a top pattern Monday 11/30/20
Posted on November 25, 2020 Leave a Comment
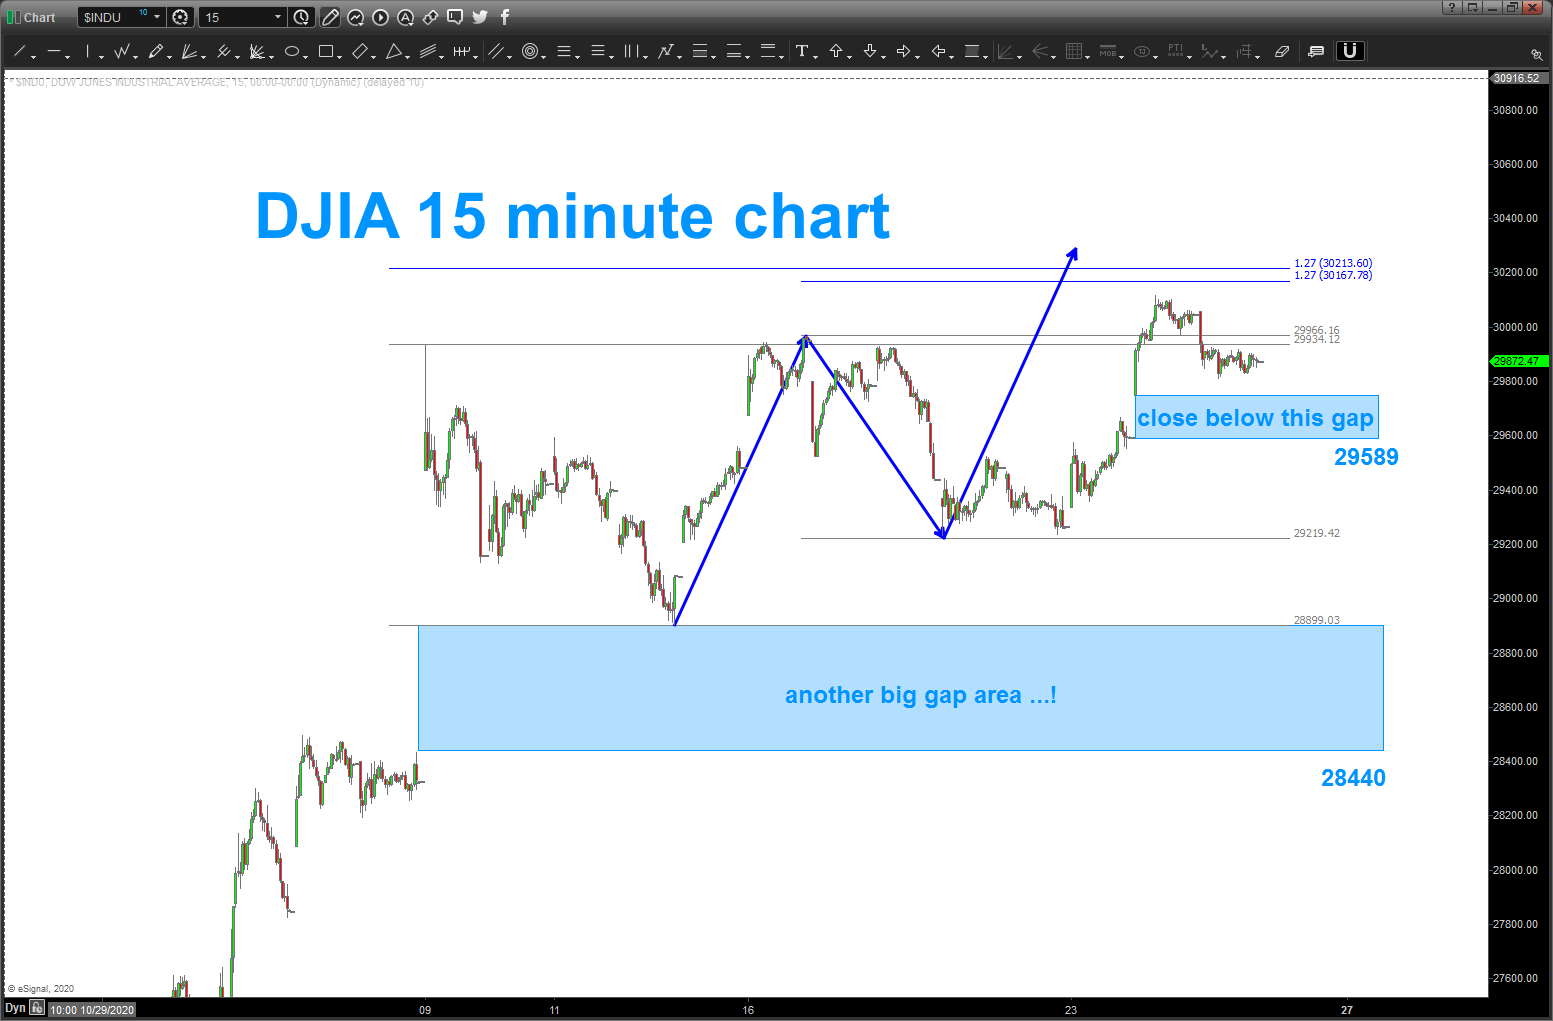
the two charts below are showing 2 three drives to a top pattern … the timing shows Monday 11/30 as the key date.
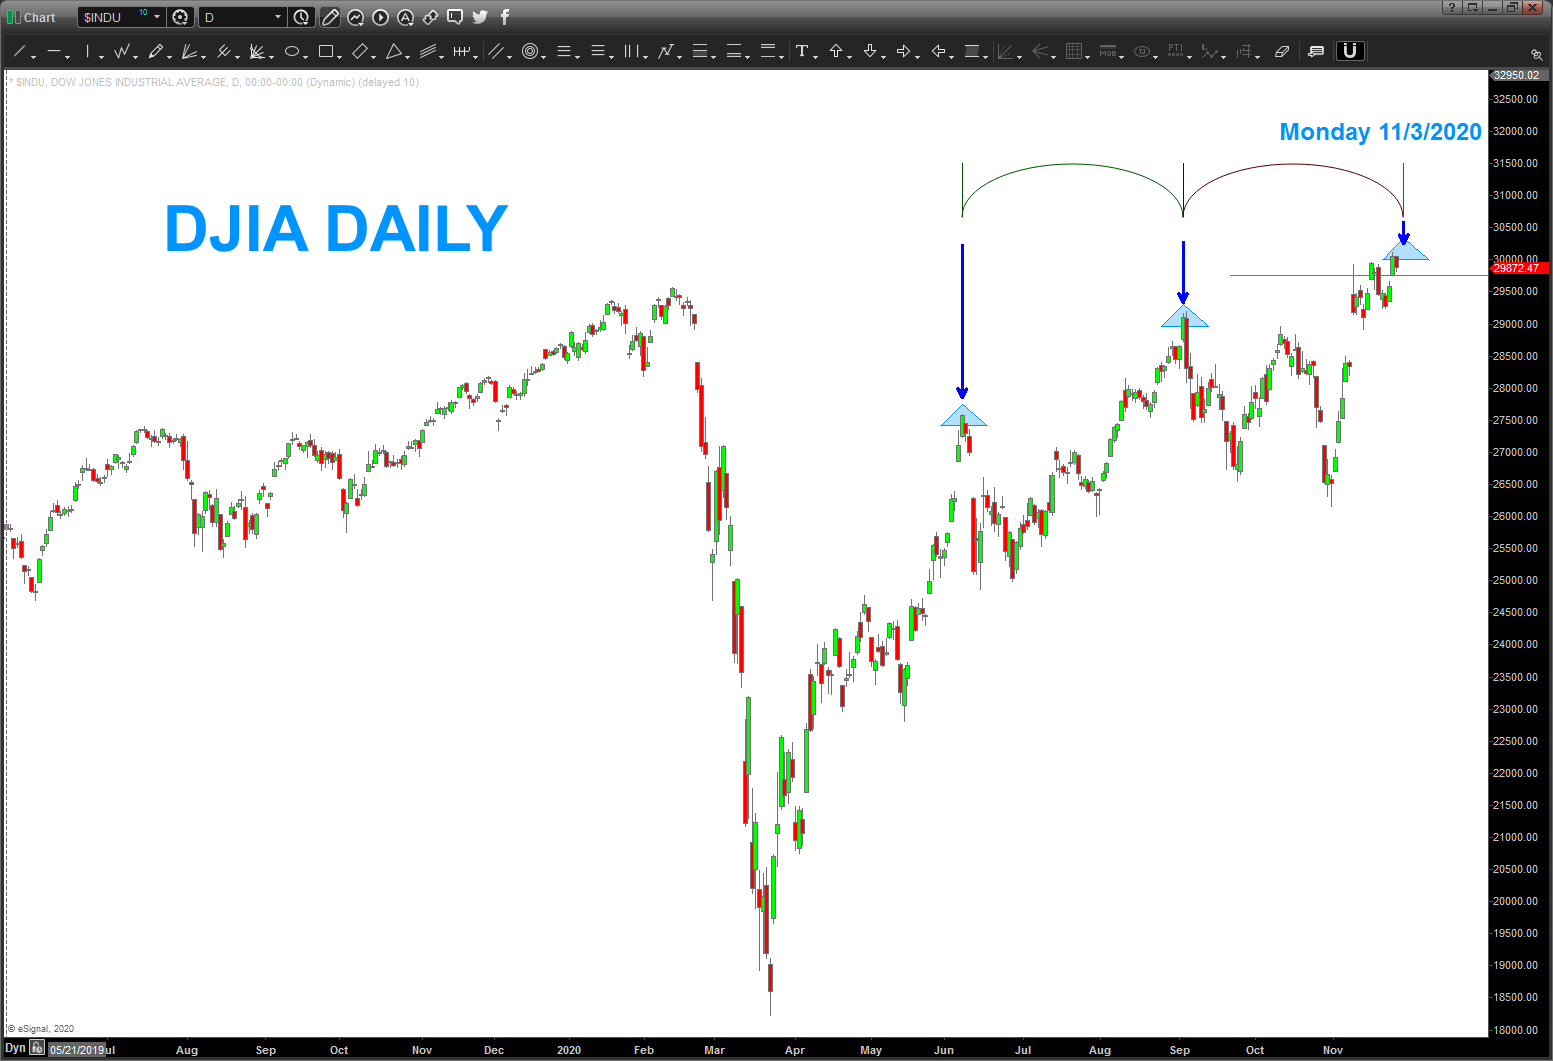
this chart is a 15 minute chart and showing the “three drives within a three drives” … kind of like Inception “dream w/in a dream w/in a dream” I guess ….
there are some higher targets but I would consider a daily close BELOW the gap area shown to be important for the bull case.
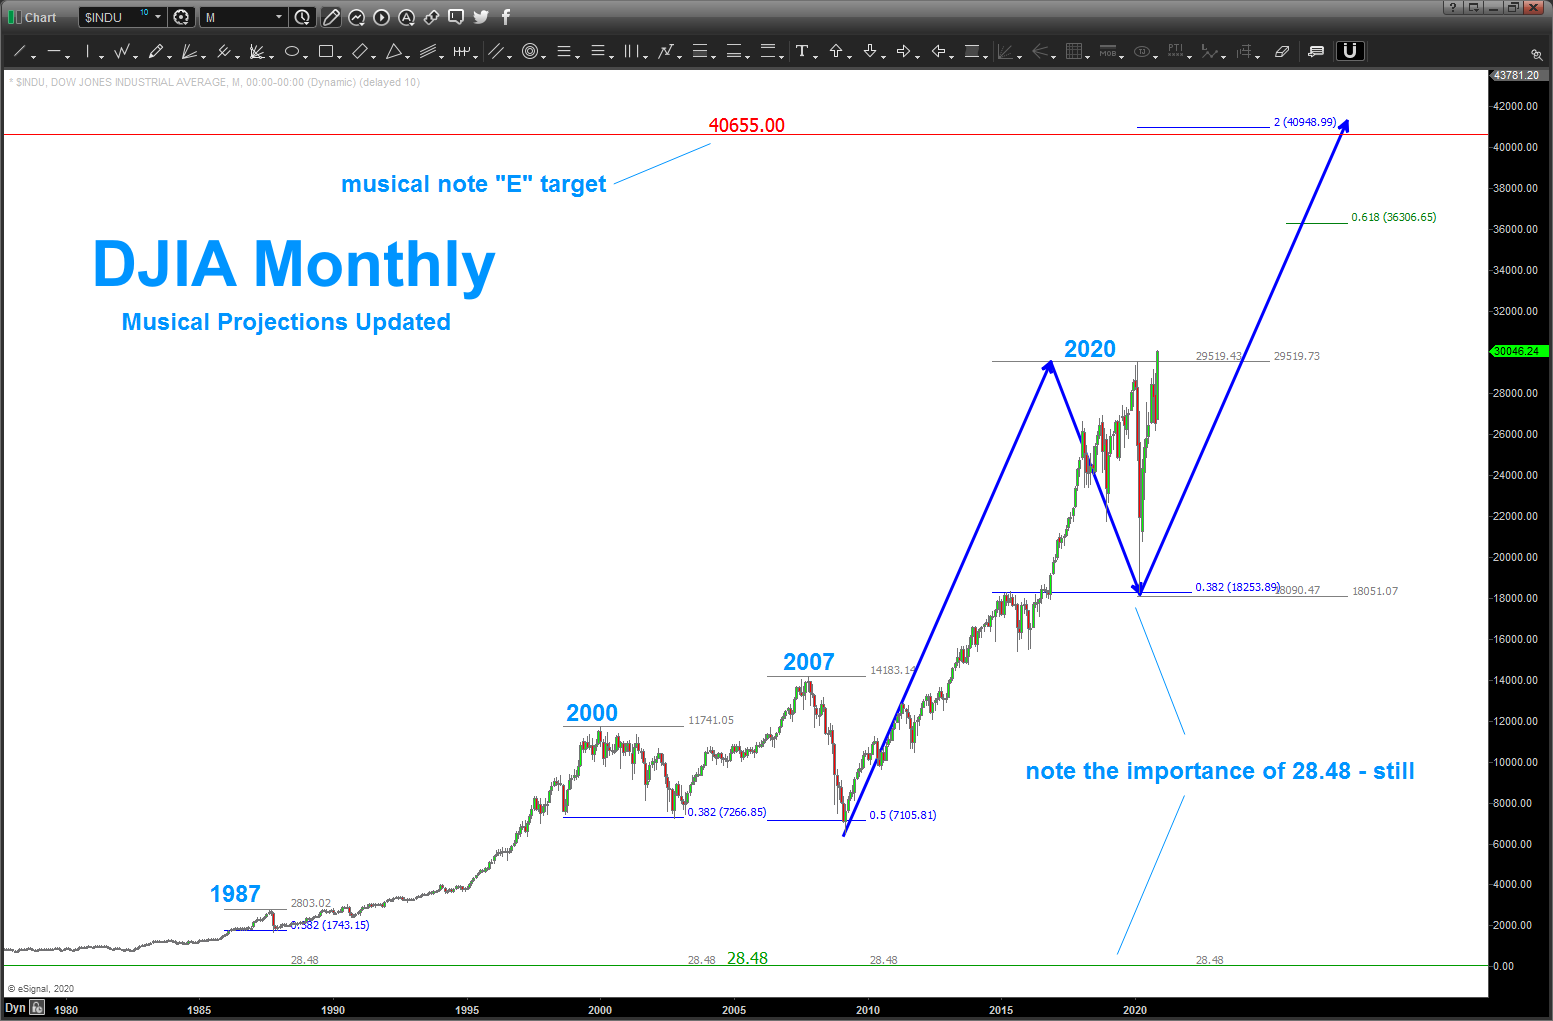
28.48 and the DOW
Posted on November 24, 2020 Leave a Comment
if you do a search around music on this blog you’ll see a pretty long post about using music and logs to calculate targets. a chart from that blog is here:
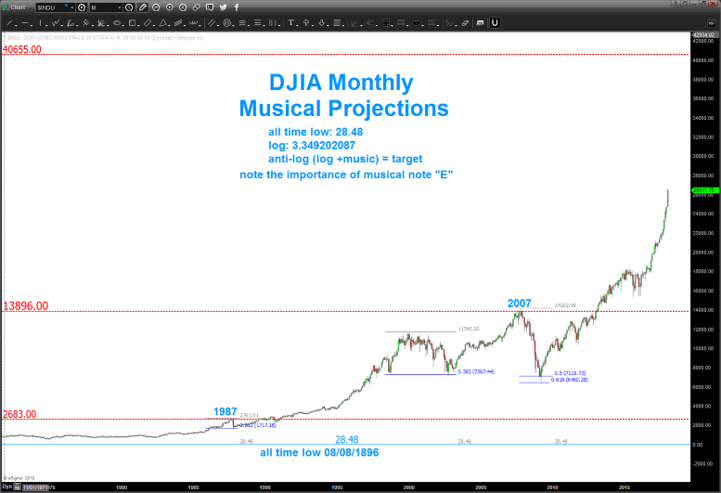
until tonight did I think about the correction this year and it’s harmony w/ 28.48. well, shucks, it perfectly nailed the .382 from that all time low. we will see some iteration of 28.48 at the final high – whenever that may be because TIME will always EQUAL PRICE at the final high or low.
long long way to go to 40K and it won’t occur in a straight line BUT hopefully some of us will be around when it hits that upper target ….
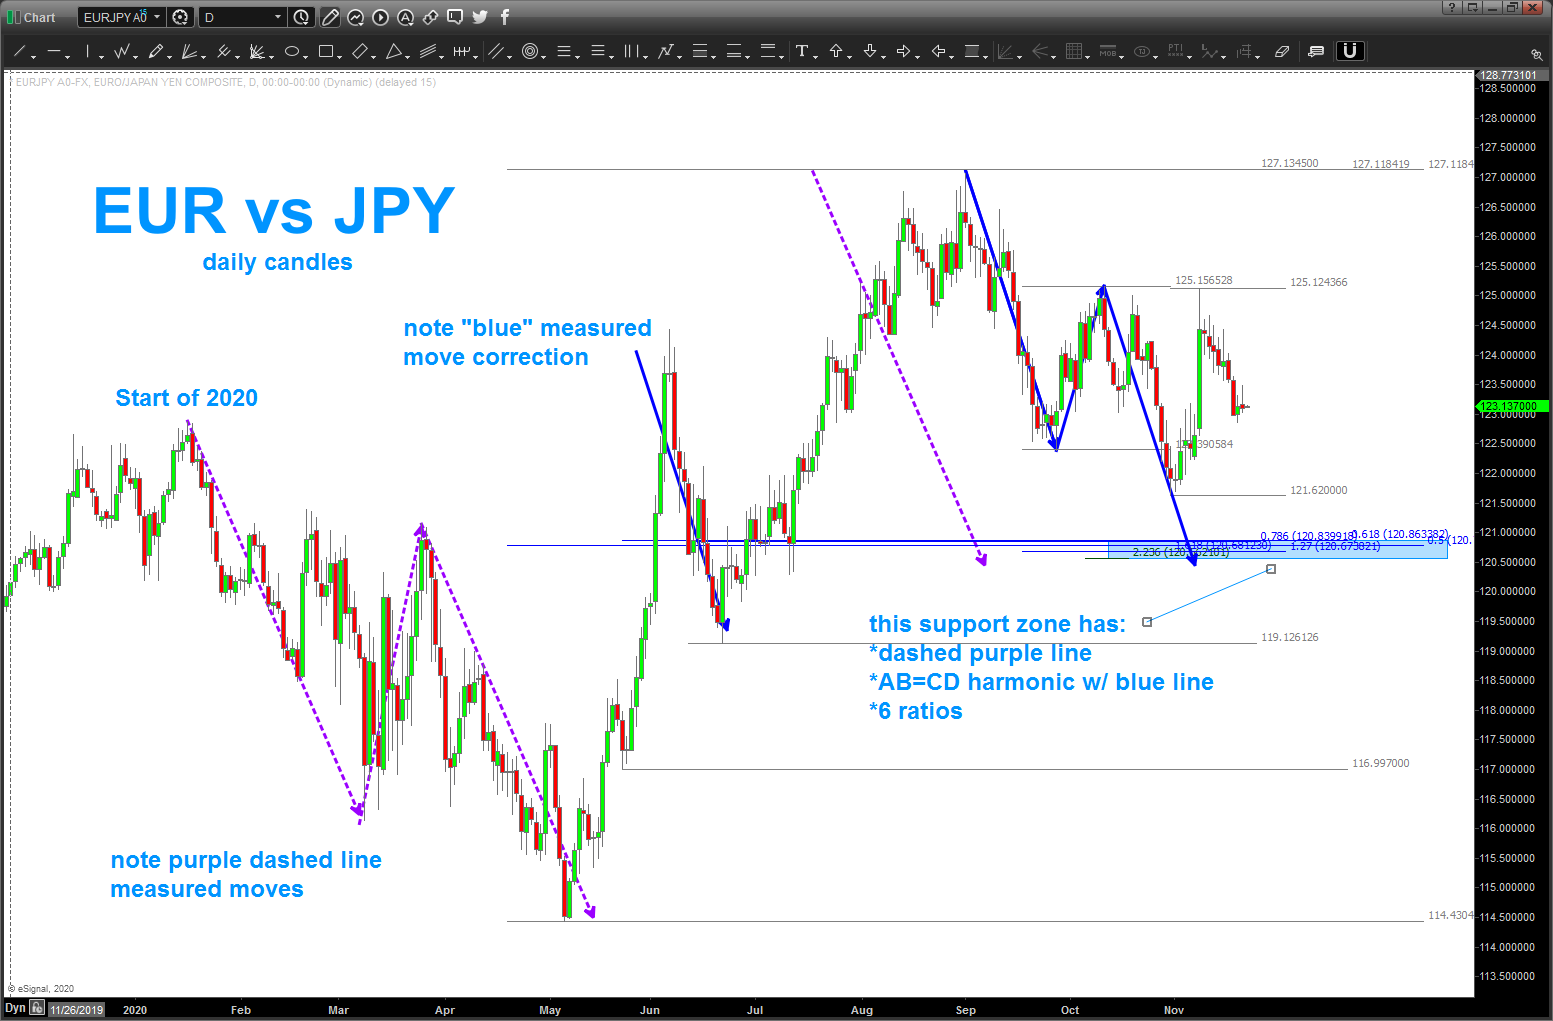
Math we like … EUR vs JPY
Posted on November 21, 2020 Leave a Comment
believe it or not, I learned to trade as a SPOT Fx dude ..no kidding. No stocks, no futures, no ETF’s out of the Navy I jumped right into the INSANE world of SPOT FX …
I still trade the SPOT MARKET … I’ll check out the majors, then the crosses and see what’s the scoop. no kidding, I once heard that ALL the world bonds and commodities and stock markets would have to operate for 90 days non-stop to match the liquidity of ONE DAY on the Currency Market. YEW …
in this case we have a currency pair as the EURO vs the Japanese Yen. chart goes up the Euro is stronger. chart goes down the Yen (versus the Euro) is stronger … it’s as simple as that.
I’m cruising the charts waiting to get locked down in CA and saw a neat chart to my eye. I just started working this chart and …boooooom … we find a level as depicted.
Let’s make this easy, when we have a LOT of math in a really TIGHT area we HAVE to take a swing at the bat … now, that being said, that is some nice thrust from the 121.62 area but I think that last thrust up was the end of a flat correction. so the recent wave down, should (trust my count or not 🙂 not sure I do or I don’t to be honest 🙂 ) go to our targeted BUY ZONE. Say 120.50-121.
let me know if you have any questions on how the levels were derived …
oh, in the spot fx world, w/ SO MUCH math in one area, I usually give myself 30 pips below – max- for my stop out. w/ the liquidity of the FX and the math as shown, go down to a 1 minute chart for the entry .. seeing these levels hit, instantaneously watching the reaction and to think that w/ a home computer and some PATTERN work the entire world STOPPED selling EUR vs JPY and started BUYING EUR vs JPY. still amazes me … I’m always surprised to see this insane way to look at anything rational about the markets work from time to time ….
good weekend to you – Bart
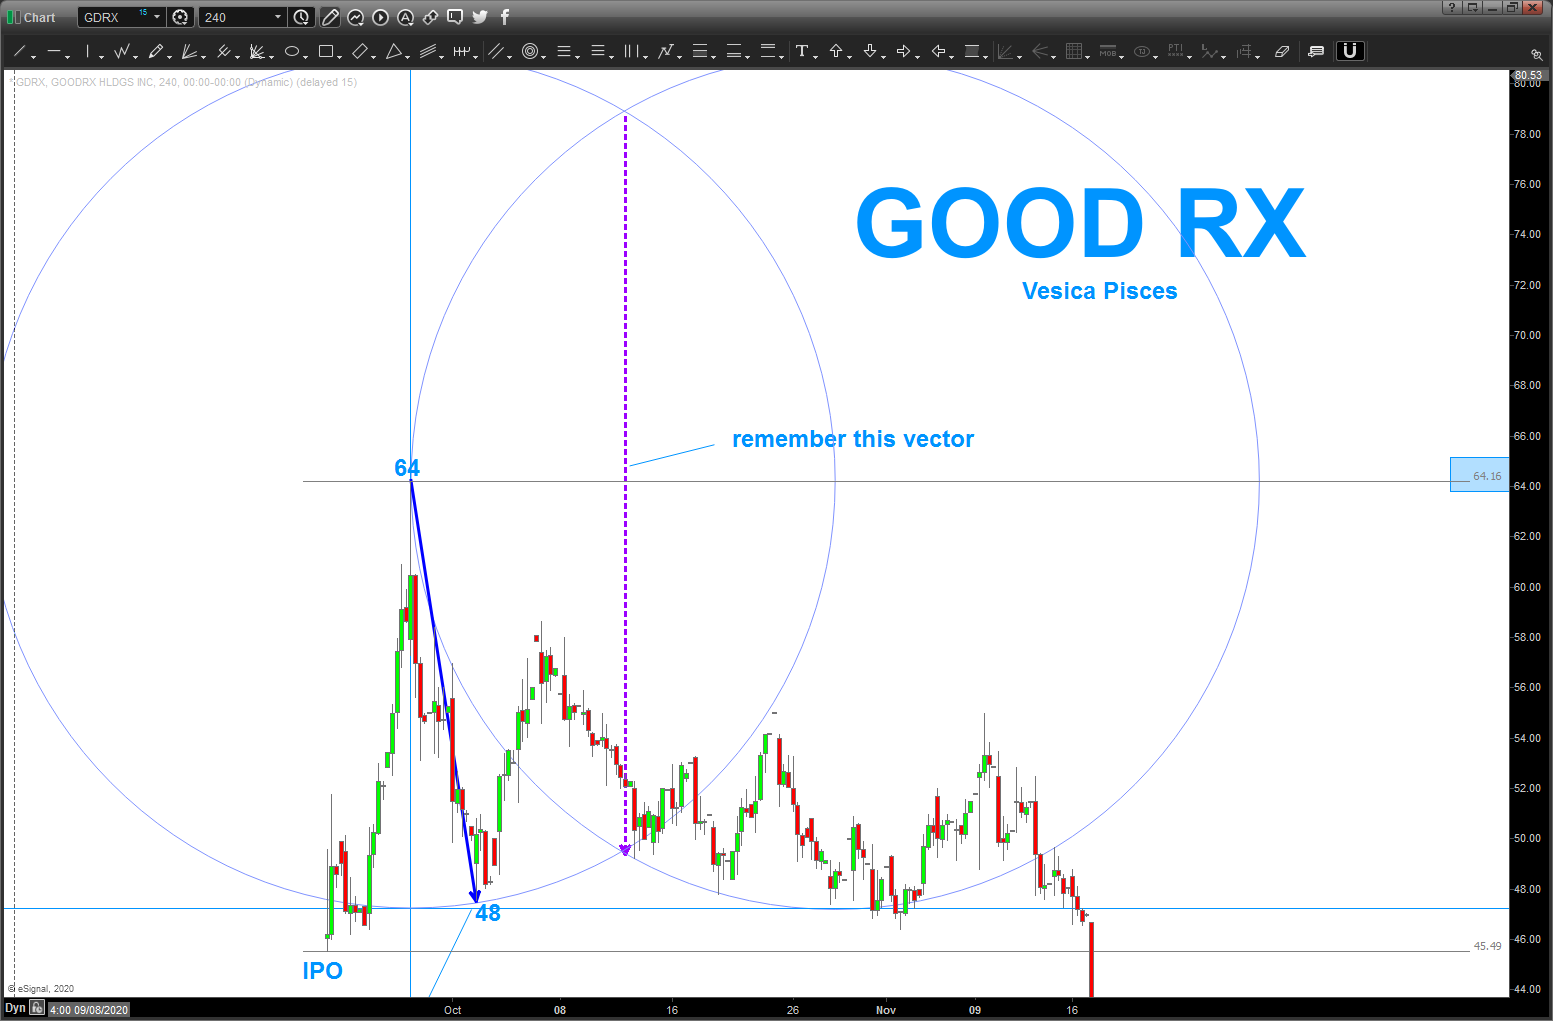
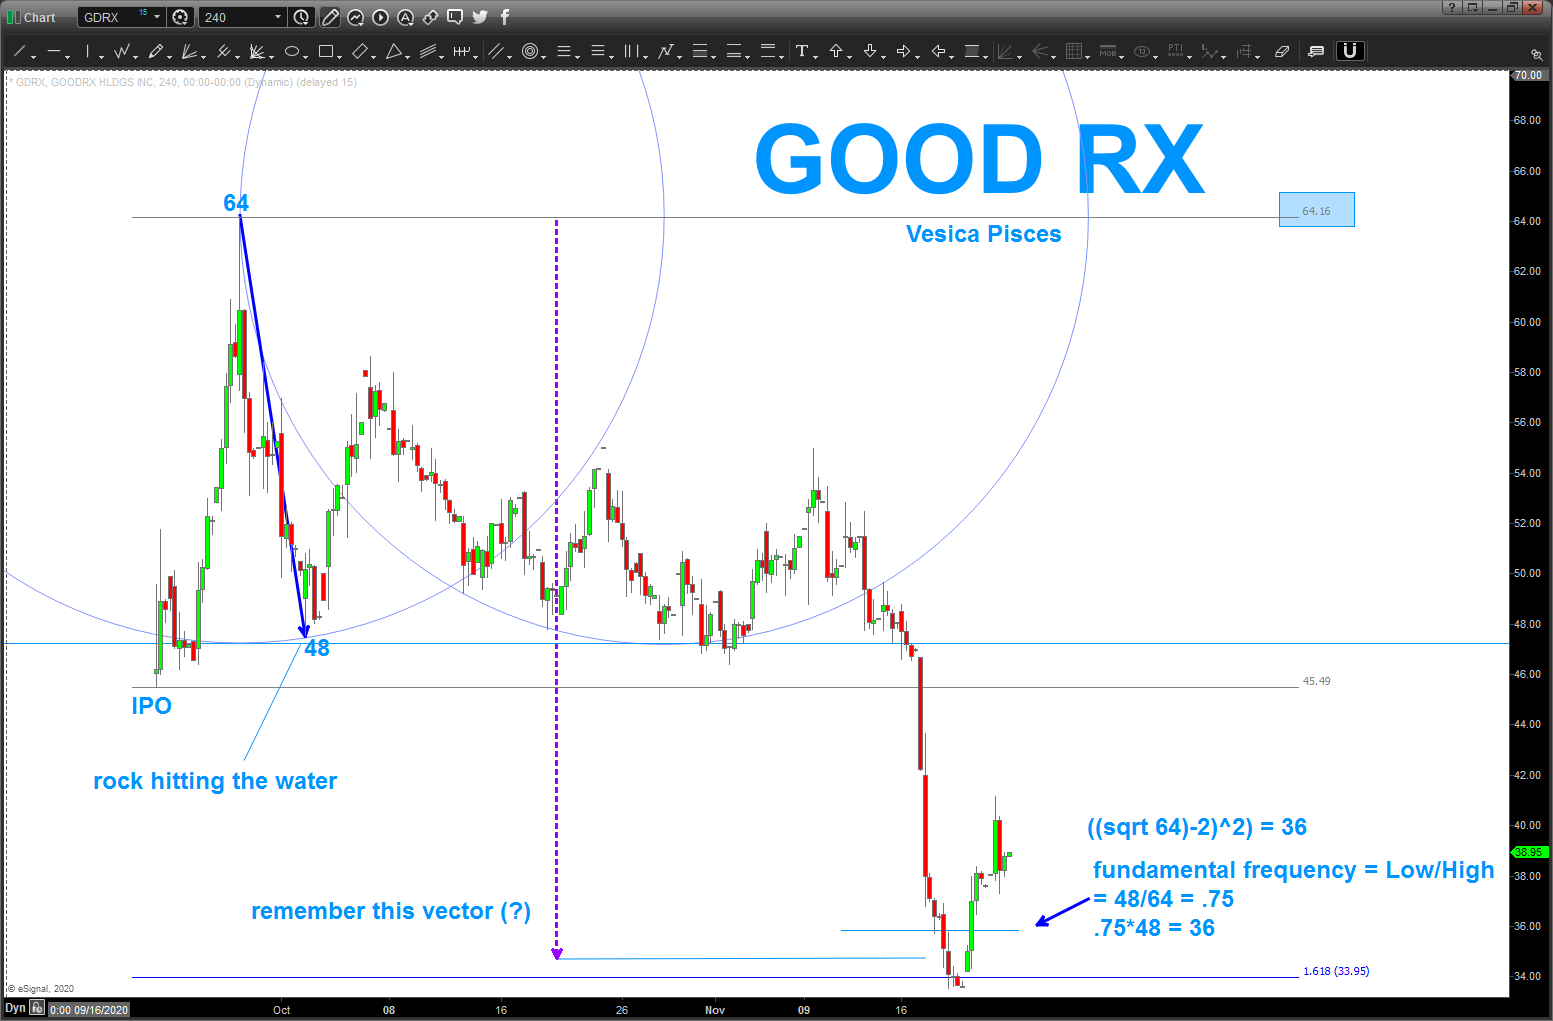
GOOD RX and the Vesica Pisces
Posted on November 21, 2020 Leave a Comment
I know the GOOD Rx dudes … really good guys. Hope this “bounce” starts a big bull run for them.
I’ve been doing some chart cruising and simply just decided to play around w/ Good Rx (GDRX)
1.618, fundamental frequencies, measured moves from the Vesica Pisces and, of course, square roots …