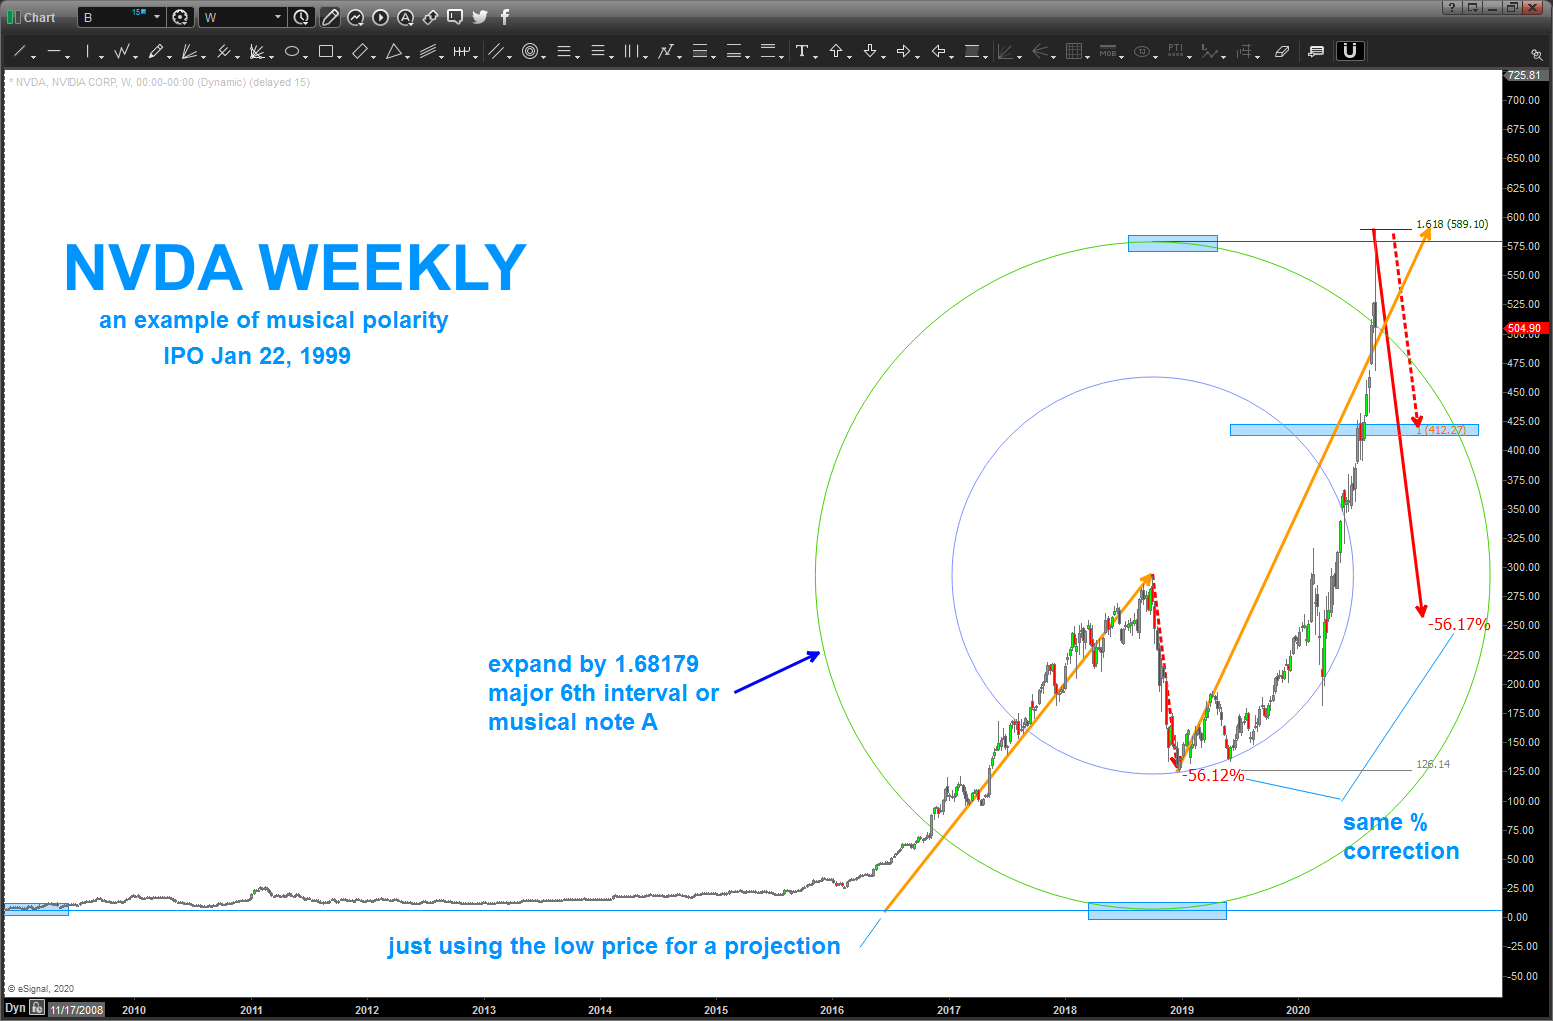
NVDA Musical Polarity and the Vesica Pisces
Posted on September 5, 2020 Leave a Comment

I was asked to look at NVDA and, while it hit a nice top at/around 575 I usually don’t like to do post like these because it’s a “could have, would have, should have” type of post but I wanted to show some readers the GEOMETRY working w/ NVDA.
In this case, we picked the first “major” correction and that becomes our initial arc .. folks THAT MOVE DOWN SIGNIFIED BY THE RADIUS OF THE BLUE ARROW IS THE ROCK HITTING THE WATER AND IT PUTS OFF WAVES ….those waves are, essentially, vibrations and they are governed by music and sacred geometry.
have done a ton of post on the square roots and the inverse of square roots and how they tie into the frequency of string.
when using arcs, circles the same concept of polarity applies so after the initial arc is drawn we EXPAND THE ARC by musical notes and sacred geometry ratio’s and we look back into the past to see where support or resistance (depending on the direction your going UP or DOWN) is present. In this case, we can see that expanding by musical note A of the equal octave scale of music is exactly the bottom of the price that coiled and consolidated and then lit the cans and took off!
so, w/ the polarity principle in mind – S becomes R and R become S IF the bottom of the circle (in this case) is support then the top should (doesn’t have to ..) be resistance. thus far, it has been resistance.
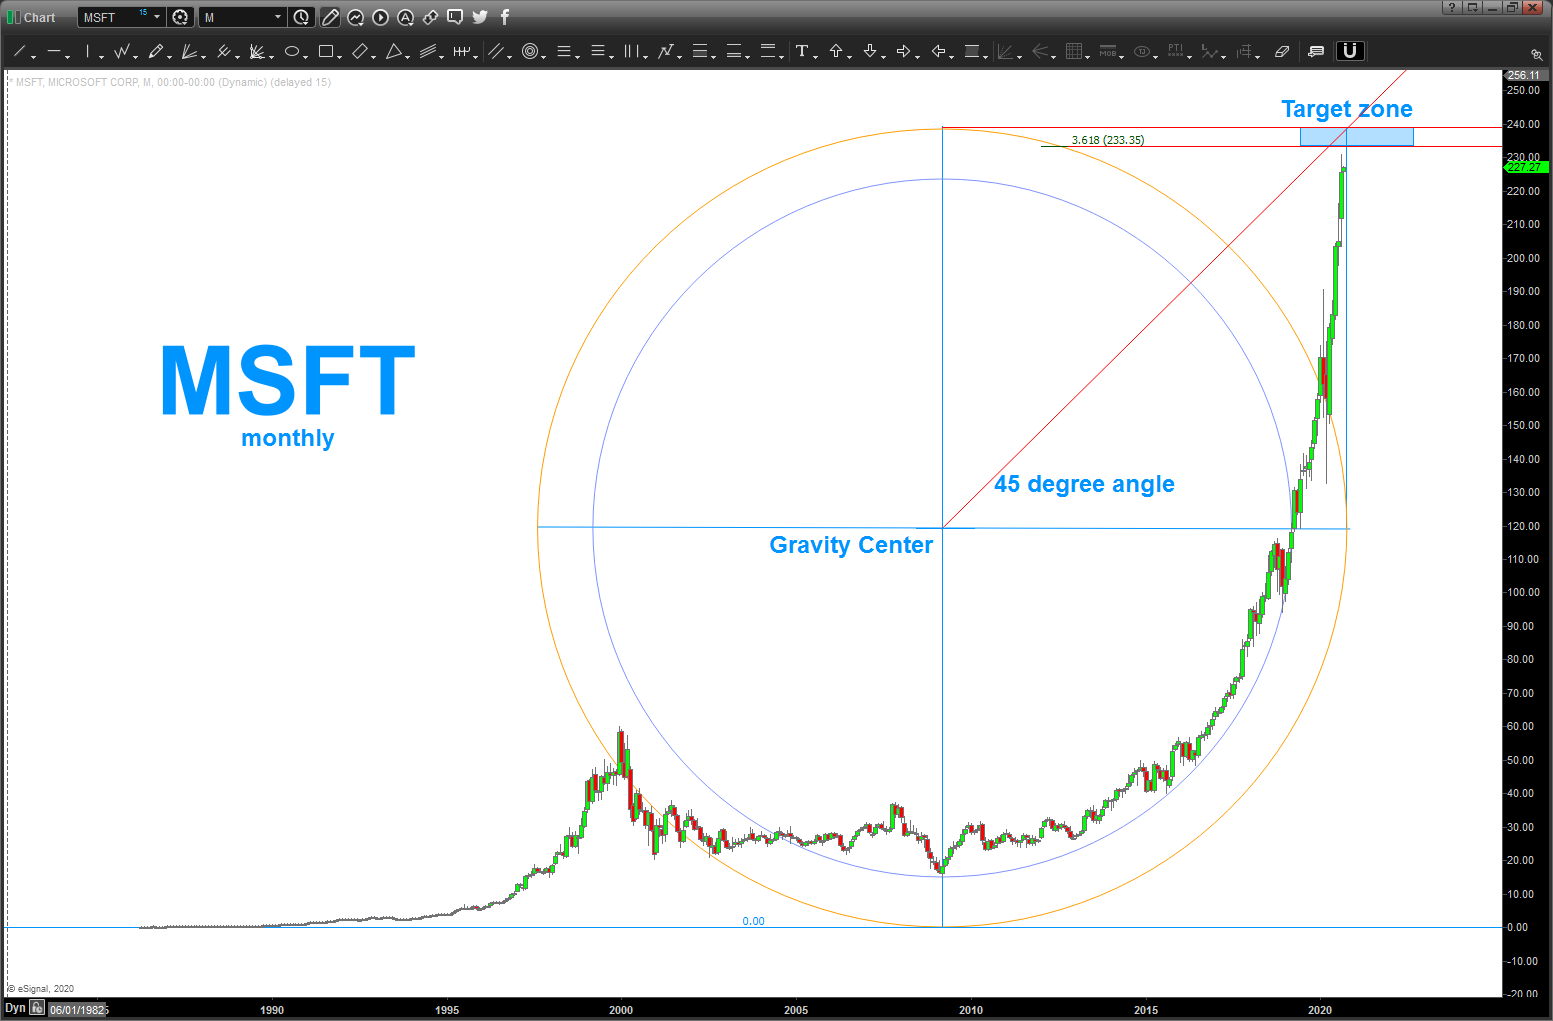
the other thing we need to notice is .. it’s also a 1.618 price projection …
NVDA is cooling its jets …
Now, see the AB=CD in/around 412? WATCH THAT LEVEL CLOSELY as a potential target as …. price likes to go back and tag the AB=CD if/when it blows thru that failed pattern … also, note, from a “price” correction the largest measured move correction takes us right down to the AB=CD
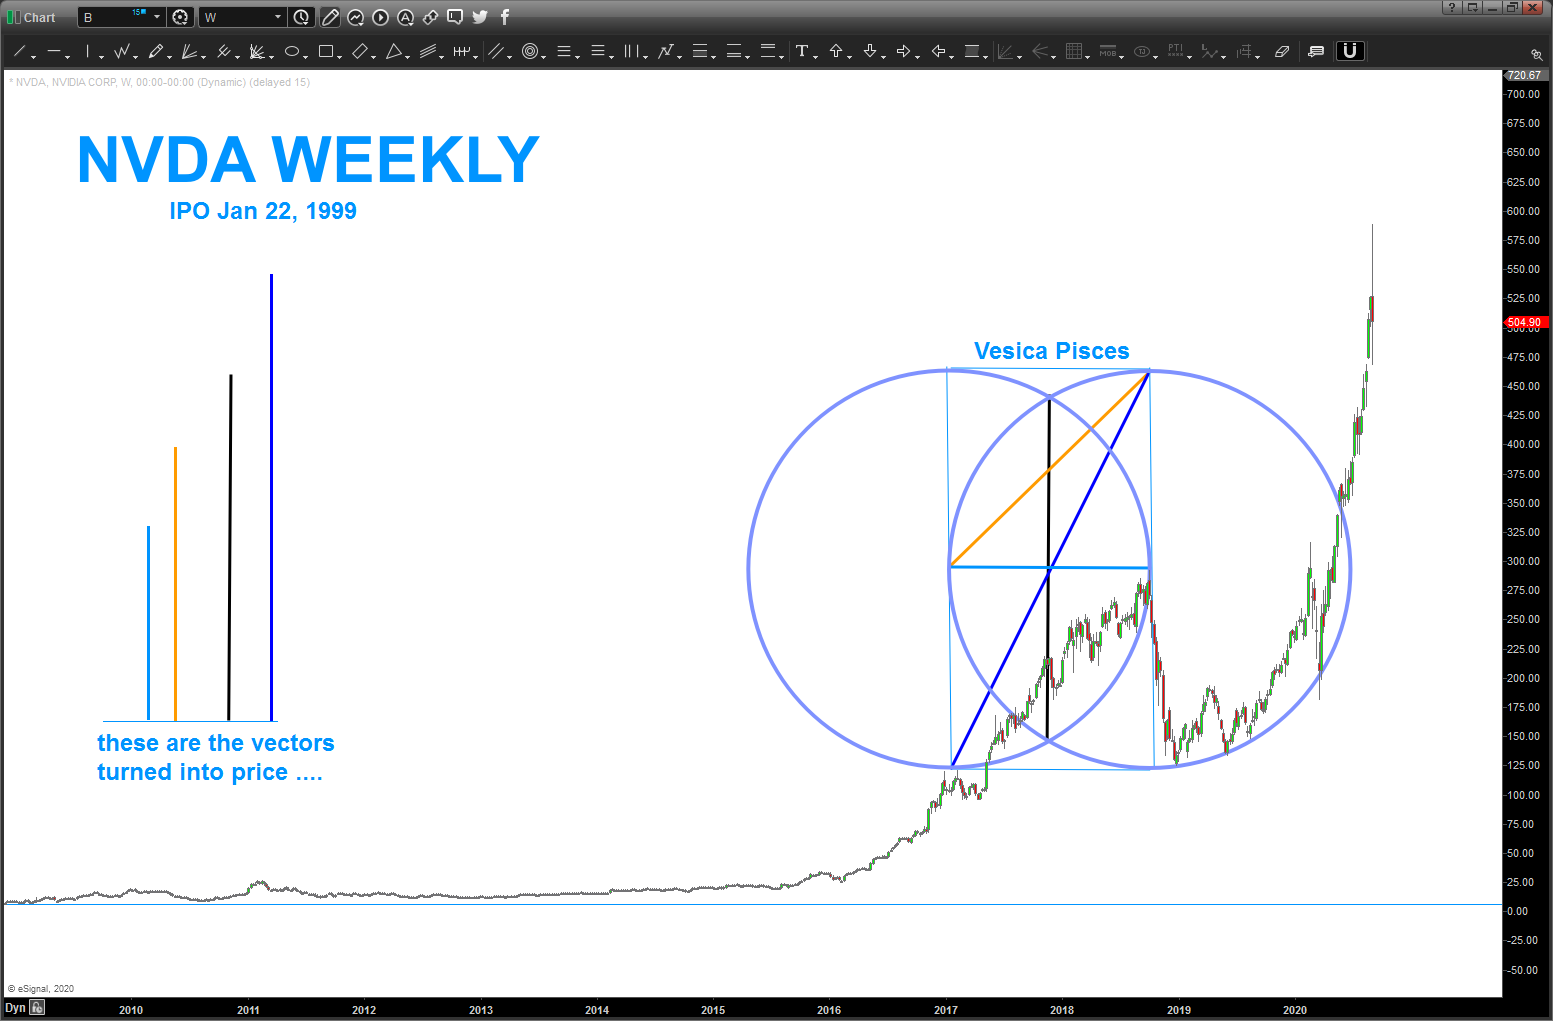
since I already had the circle drawn I went ahead and did the Vesica Pisces and then rolled those vectors to price .. they can also be done w/ price. remember PRICE = TIME.

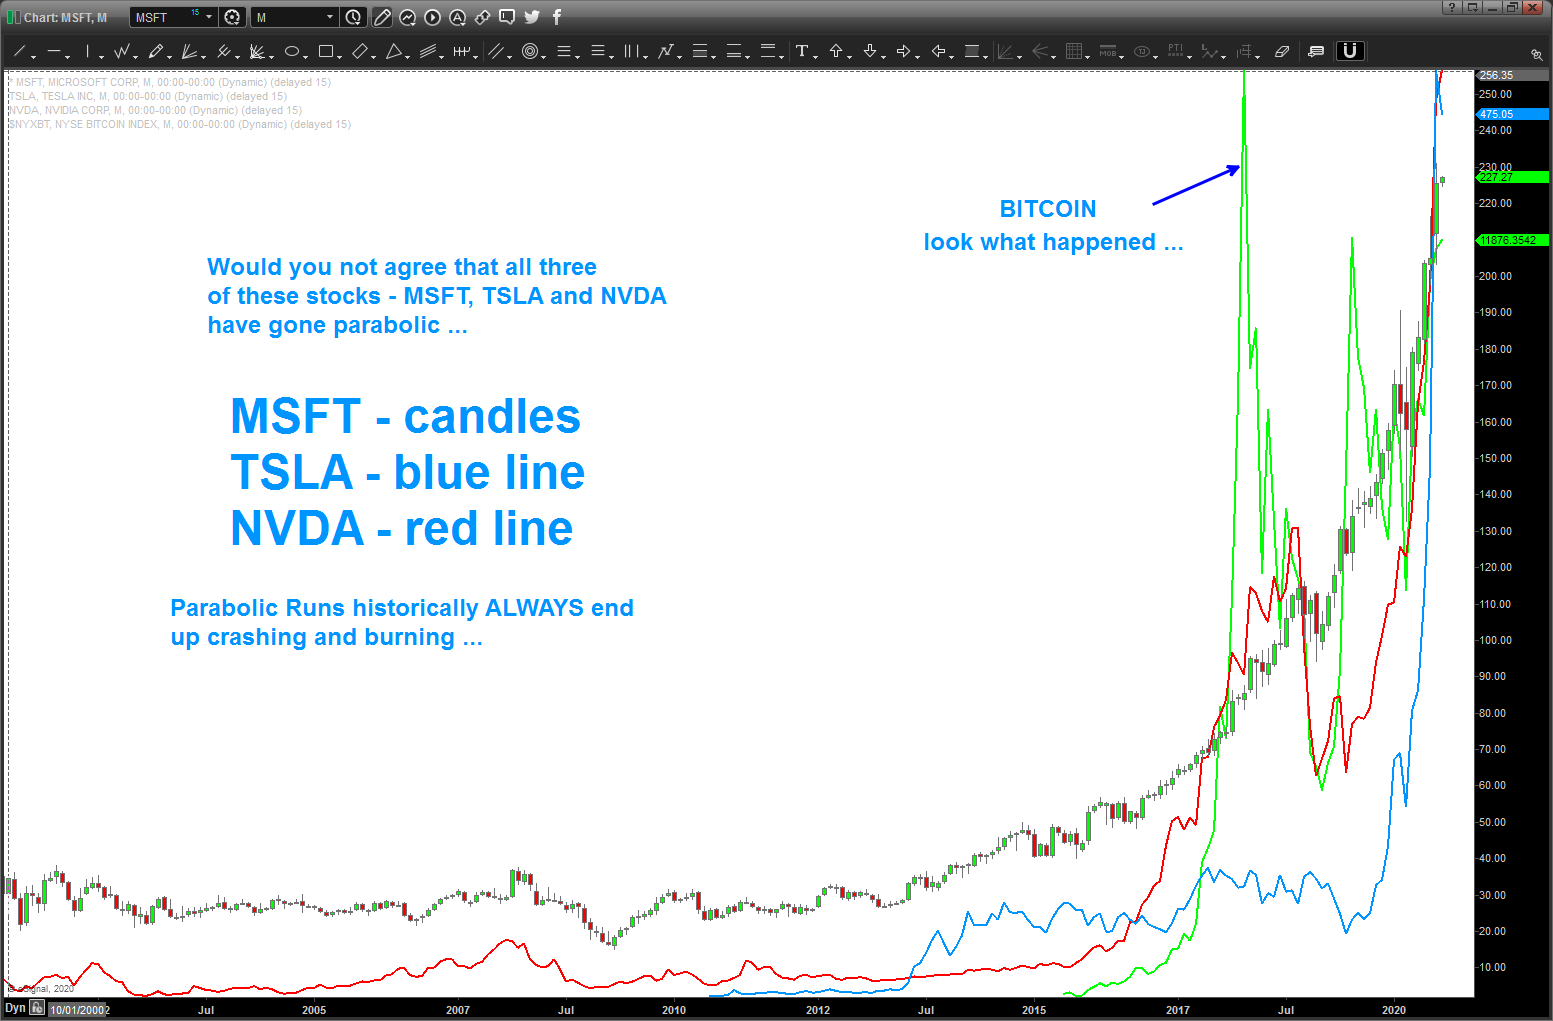
Parabolic Moves
Posted on September 1, 2020 3 Comments
Parabolic moves are amazing … if your short and your on the wave ride it and if your riding the long wave in the emotional fueled rally then find your line and carve …just don’t get greedy.
The fact is parabolic moves never (strong statement) or shall I say ‘most of the time’ don’t end well. I’m going to show the parabolic moves that are literally rocket ships and then walk thru some of the charts from the past that show parabolic moves and their outcomes … what’s interesting is they all really do look the same …and, if you can ride out the opposite side of the tsunami it can and will come back . but do you want to eat it if your on the wrong side of the market? I can’t answer you as that is part of your PERSONAL RISK MINDSET.
I posted on MSFT a few minutes ago about it’s parabolic move and got some VERY angry and nasty messages back. I blocked those people. You see, I really do enjoy blogging and investing. I absolutely LOVE observing human nature. Why mention the past couple sentences … well, you see, I get the occasional thumbs up or comment and somebody might ask a question or two and I enjoy responding. I can see, via analytics, that a LOT of people are visiting the blog page. And, if you notice, there are periods that I go silent and then I’ll start blogging a lot because, well, patterns start to emerge.
But the fact that I got a TON of hate and mocking messages over on Stocktwits feeds more fuel to the fire that a top is approaching. Does that mean tomorrow …? Maybe? Probably not. Next week, next month? Who knows … but it is definitely getting very interesting.
In parabolic moves think of physics and Ps. Ps=sustained power. we had numbers memorized when I flew fighters for the Navy .. what altitude, airspeed, G would give you the BEST turn rate and radius to perform the jet. What sustained power could you work to max perform it …? If you went outside the box you are going to trade something …
I can blog this now because I’m a decade + out of the Navy. Back in the day, off the coast of SoCal we took the jet from 250 feet over the ocean and lit the cans (afterburner) got a ton of speed up and zooooooom up we went. Straight up bullseye (nose 90 degrees high) and we topped out above 60,000 ft. (I’ll leave it at that)
The coolest thing about topping out was the jet was STILL in full afterburner …but guess what, it just wouldn’t go any higher and then it flipped over on its back, flopped around out of control and fell like a stone. Nothing to worry about when your 10 miles above the earth but still a little erie to be honest. What happened? Well Ps went to zero. Yup .. the power to keep the jet climbing was gone. Night night, we were done …. the SAME THING HAPPENS IN THE STOCK MARKET WITH PARABOLIC MOVES.
Don’t believe me…? Hope this is more than enough examples:
Altria (MO)
note: these charts are real time as the move was happening. I try REALLY hard to not “could of, would have, should have” …..I try my best.
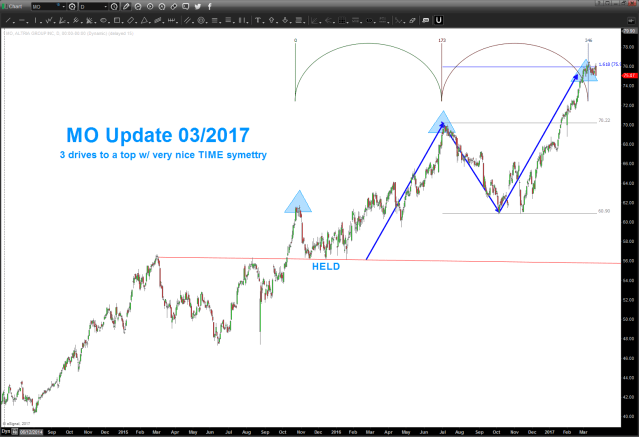
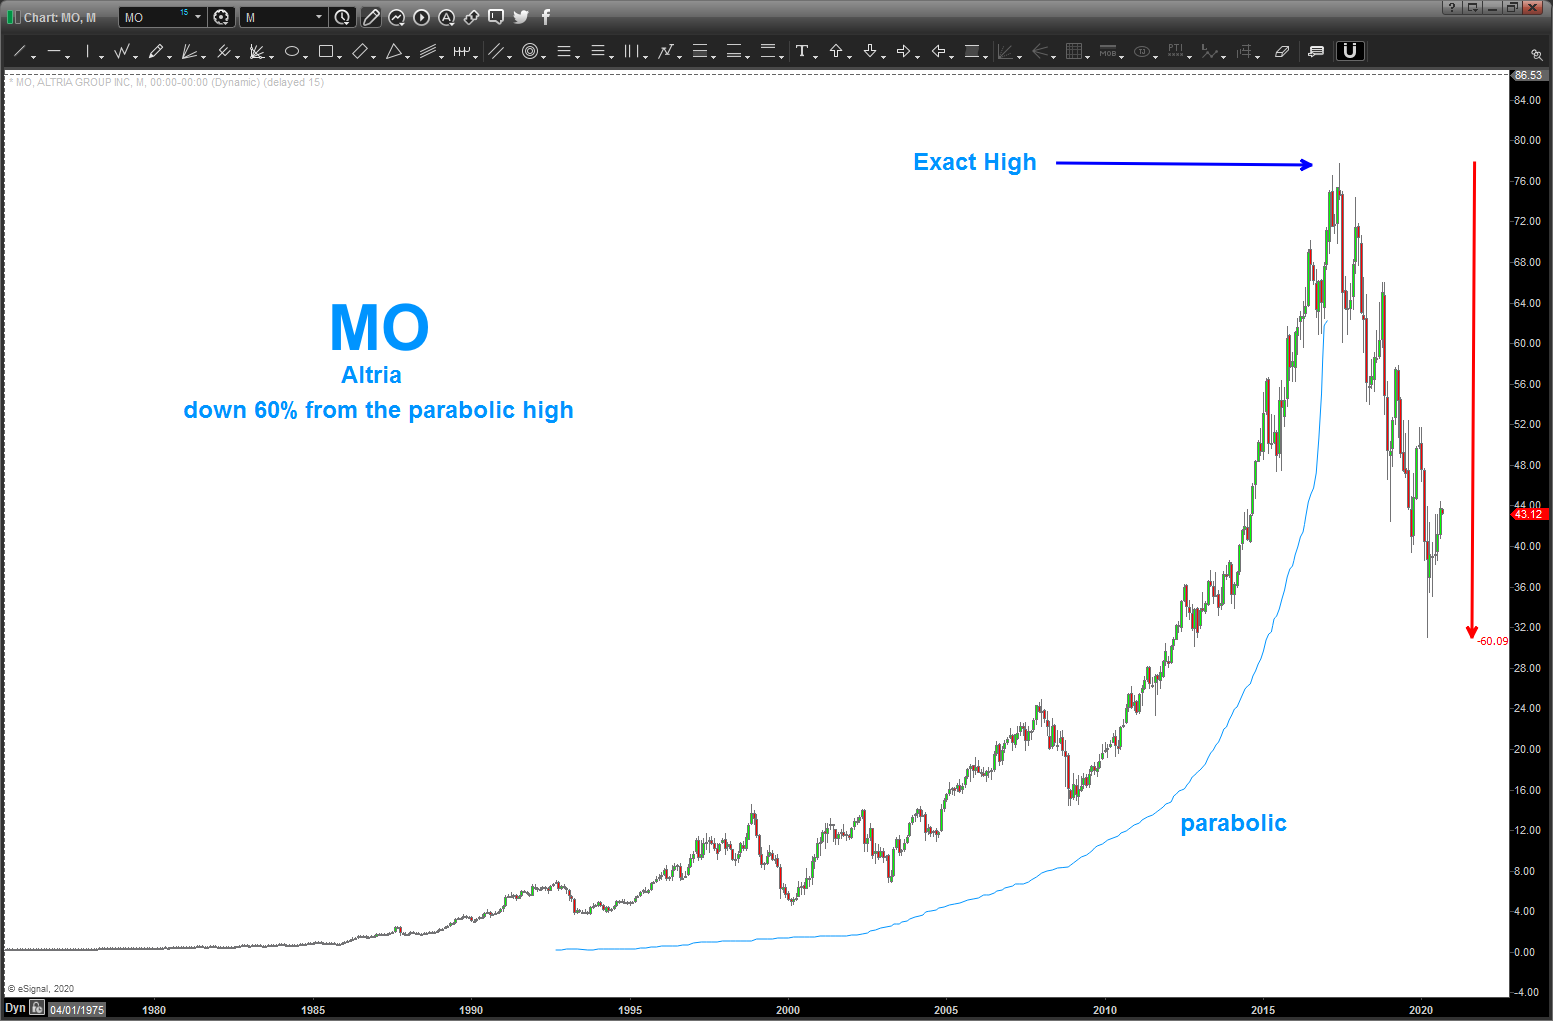
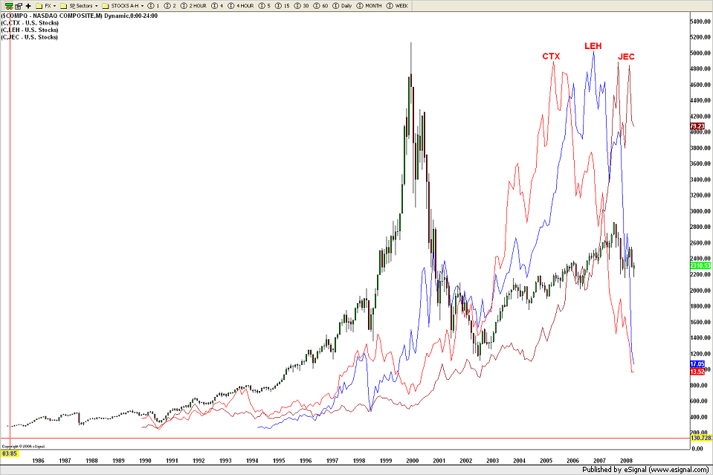
I have used this chart in a lot when talking to other fellow risk takers. Look how they look the same and the period between the highs is almost exactly the same from a time perspective.
I did this one for my good friend Andy @seeitmarket …it was during the mania rush that was the run up in Bitcoin. Look familiar? The key is, just like now, I was simply trying to provide a “risk based” mindset of the mania that was bitcoin ….OBTW, I’m long BITCOIN thru Coinbase and I let the entire run go because it was a parabolic emotionally fueled mania. SO I WAITED!
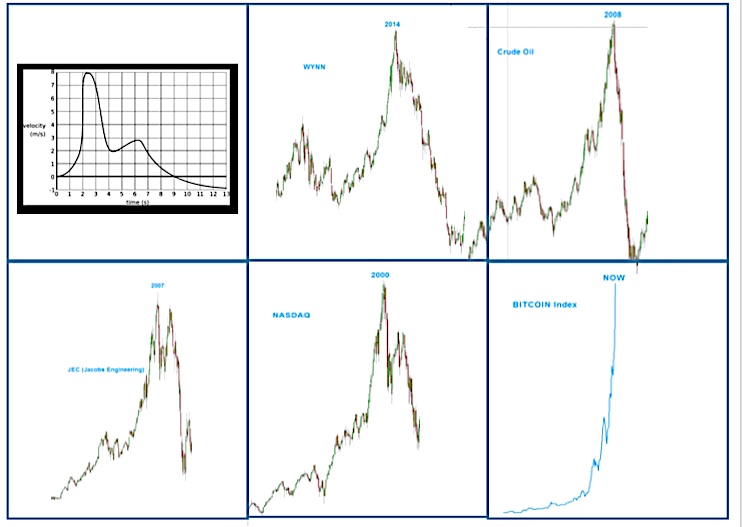
And, well, here is now. I kept the Bitcoin (green line) to show the bearish thump and the fact that it is coming back.
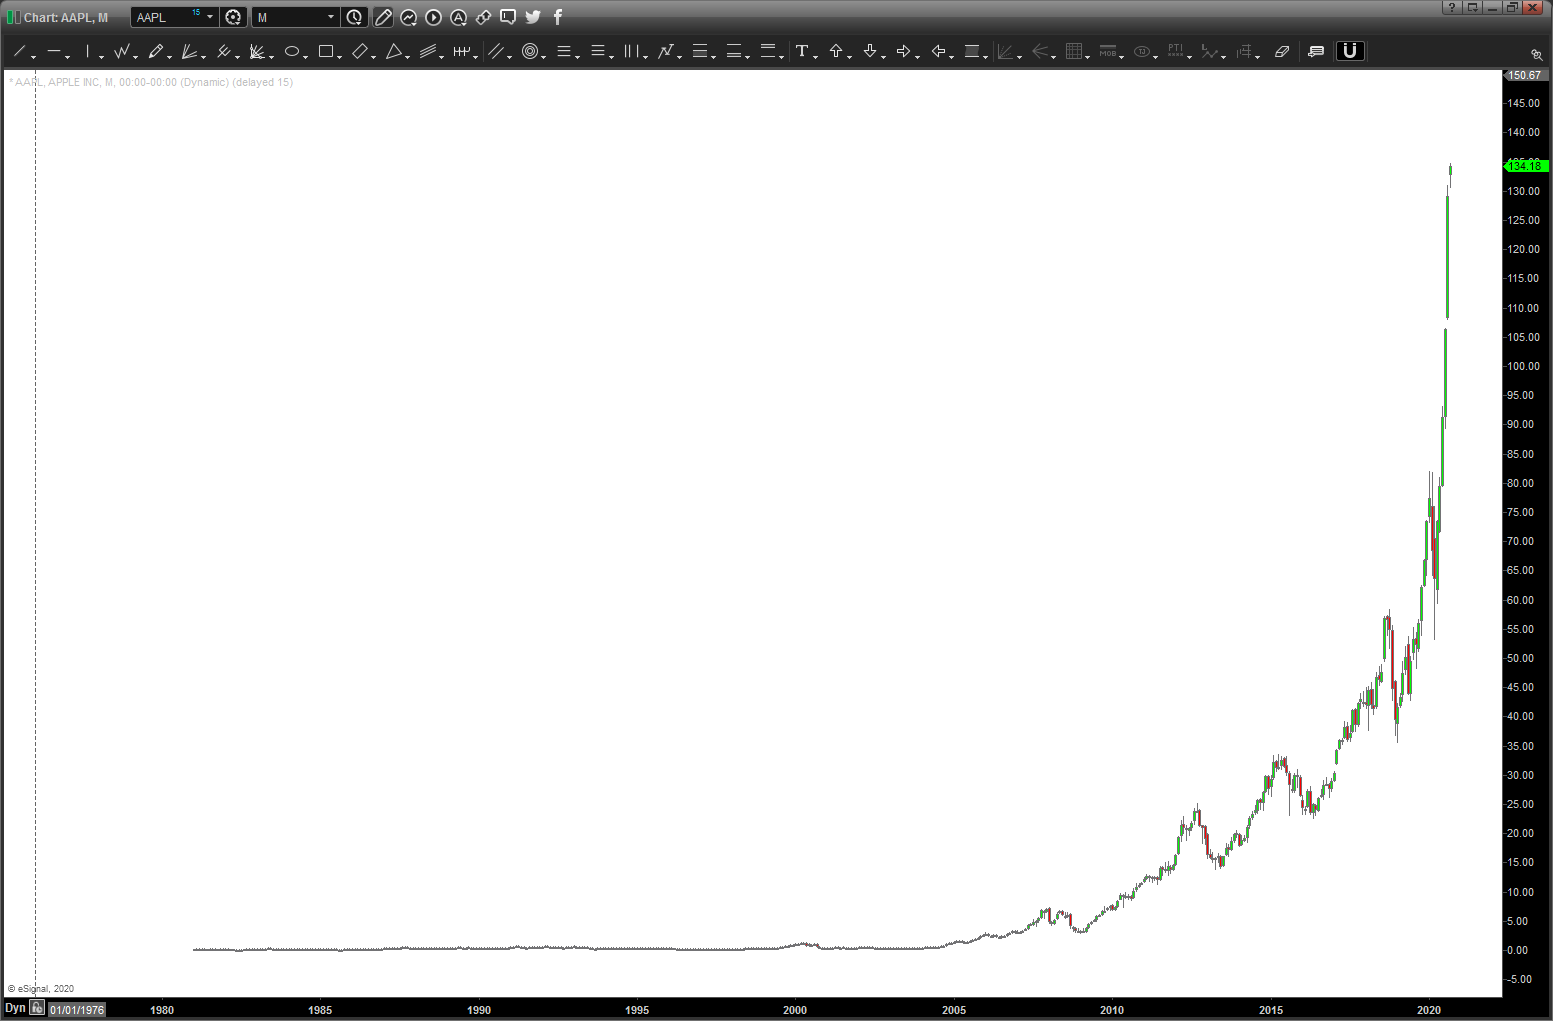
I’m not saying these companies or assets or commodities are going to zero or going out of business. I’m just objectively saying that Sir Isaac Newton has yet to be proven wrong … unless in LEO (low earth orbit) EVERYTHING comes back to earth.
Good thing this doesn’t look parabolic, at all.
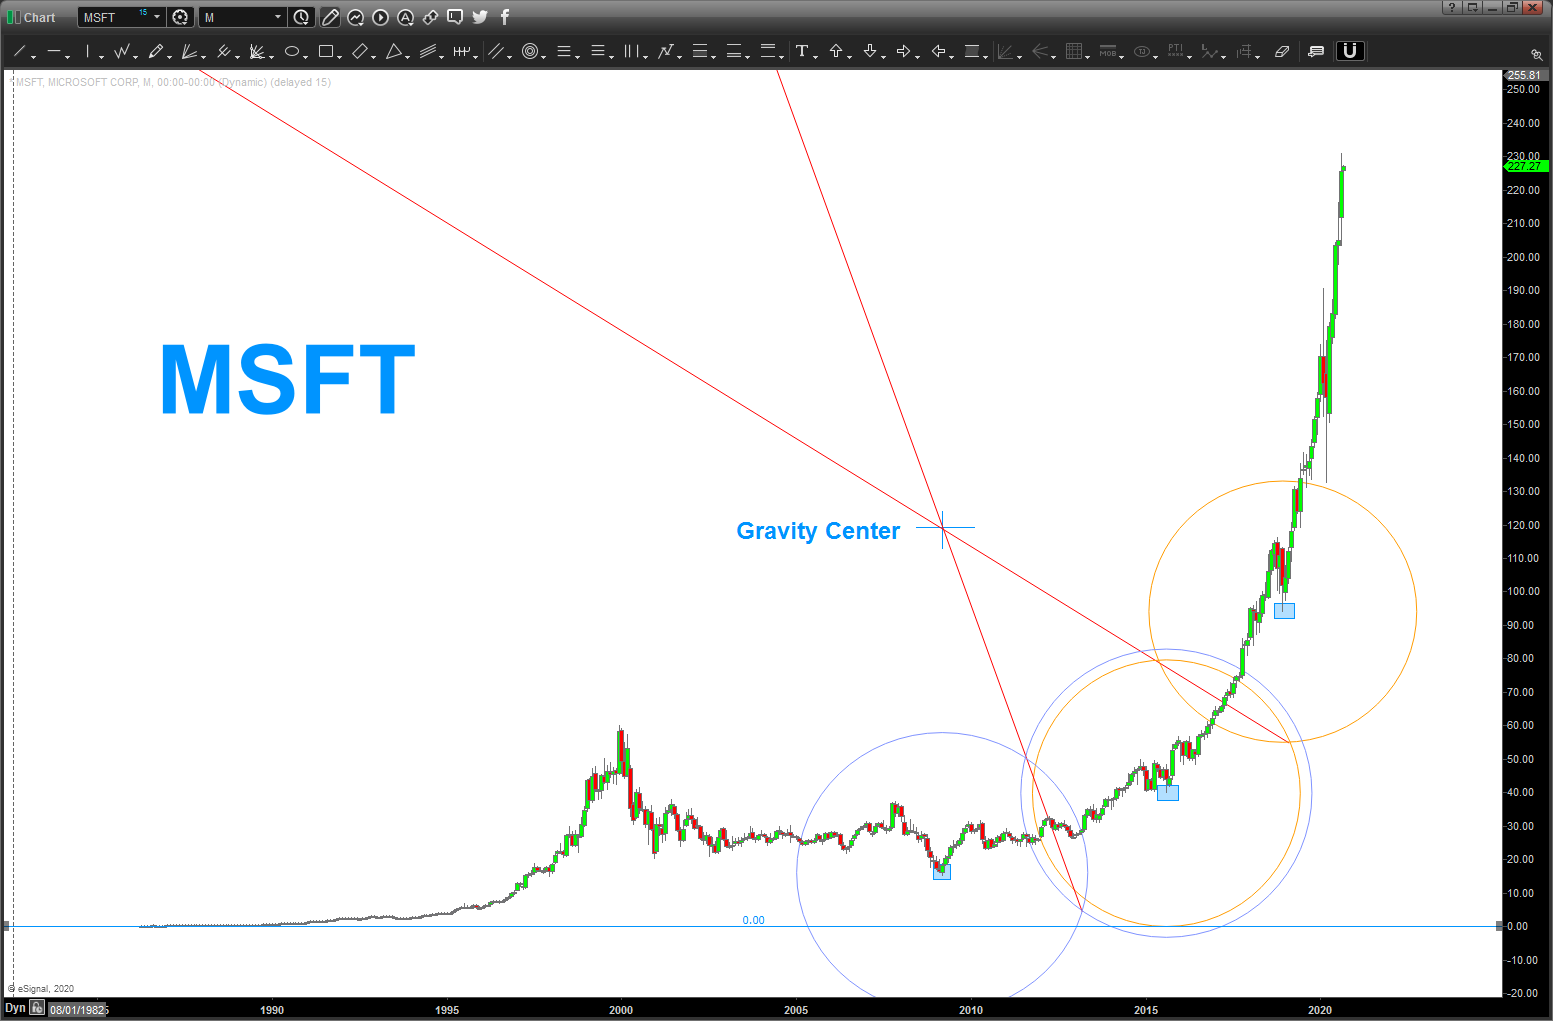
MSFT – everyone reading this post learned how to make a circle form 3 points …
Posted on September 1, 2020 4 Comments
folks, honestly, being in the parabolic wave is quite the rush and I’m 100 percent guilty of getting out too early and I would really love it if someone told me they got in at the exact bottom and took it all the way to the top … bless you if you have! 🙂
finding tops and catching knives is a fools game … we all know that. but you can use geometry to get a clue …
so, taking what I learned in my geometry class I used three points to define a circle, found the gravity center and then use 0 price and drew my arc. it’s below.
is a top coming – oh you betcha your bottom dollar.
is my analysis of that potential top target area correct ? I have NO IDEA.
but, we can watch and wait for a signal reversal candle ….
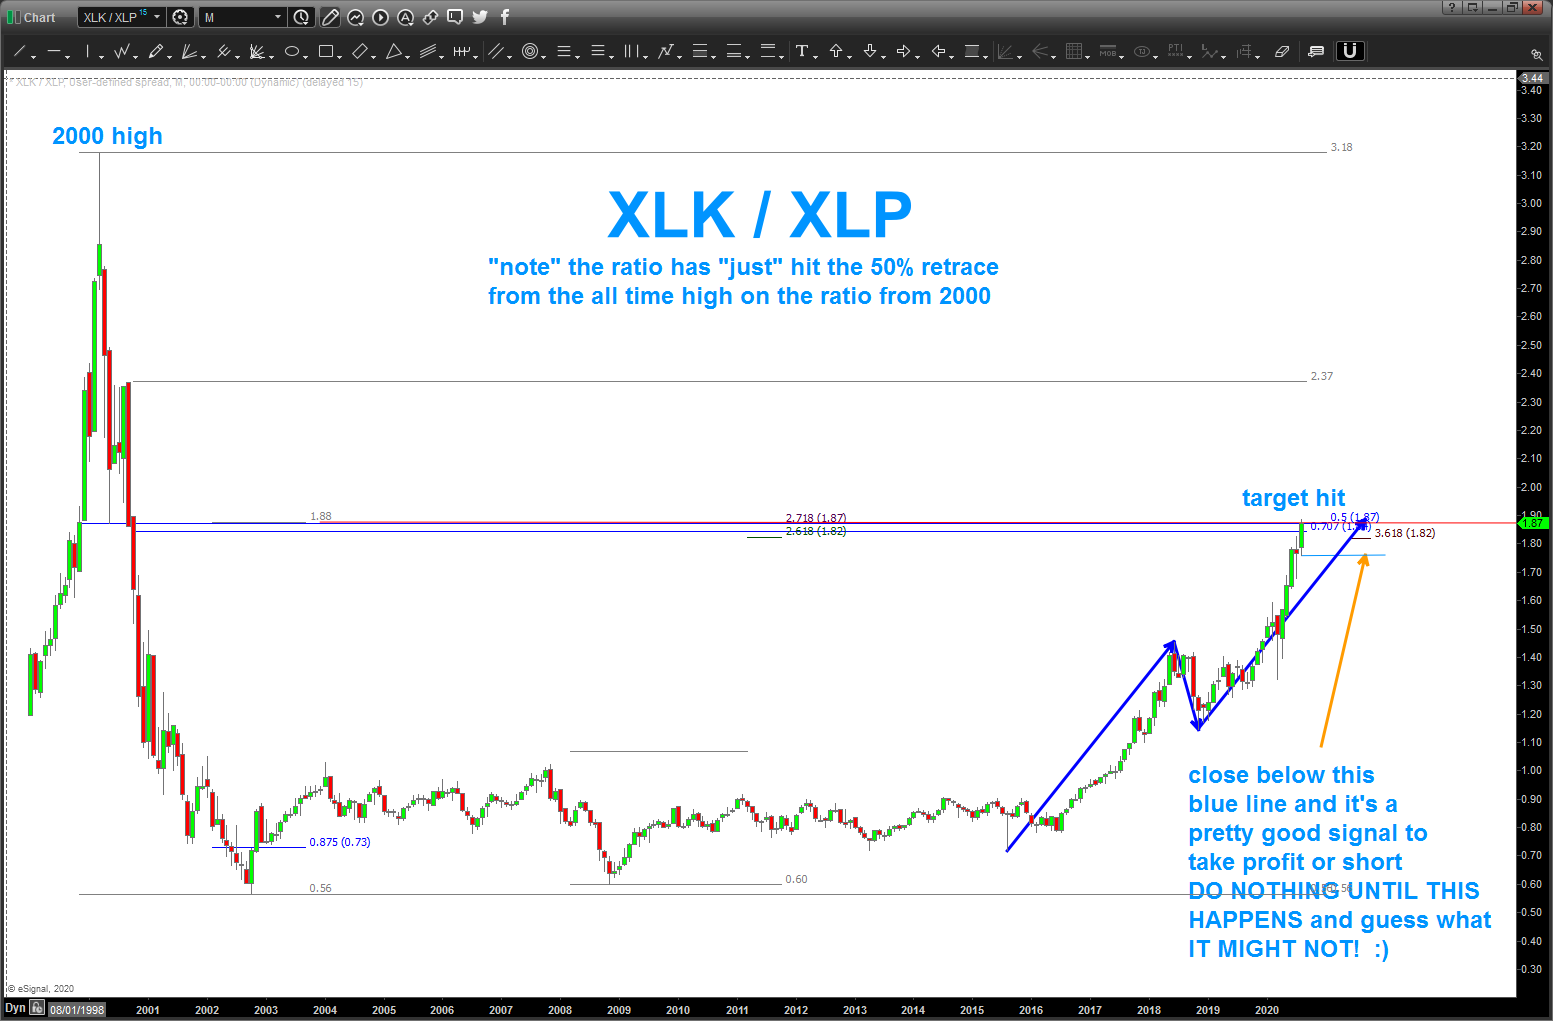
XLK / XLP
Posted on September 1, 2020 Leave a Comment
today, the market opened ABOVE our target zone and on a weekly basis we need to see if CLOSE above this level on Friday … folks, the sentiment indicators are thru the roof and nothing like anything I have ever seen before …. that being said, the market is ALWAYS right so we need to respect this opening. in parabolic emotionally fueled runs it’s always good to WAIT for the signal reversal candle …
I have a feeling we will know when the goose is cooked.
keep charting!
Bart
XLK / XLP TARGET HIT
Posted on August 29, 2020 2 Comments
if you look at this chart …it is hard to make sense of it all. at least for me ….you see the EUPHORIA and SENTIMENT indicators are at extremes and expressing bullish optimism all the way back 30+ years.
I’m going to say it once and for all … folks, it’s different this time. the market will never go down and just buy buy buy. who cares if the leaders are parabolic or any of that … this is EASY.
If that was the case, then the XLK/XLP ratio would be taking out the 2000 highs, correct? throw caution to the wind and its’ risk on right? Ummmm…no, this ratio says that the advance is not as great as we think. I know, that sounds crazy but look at the chart …
anyway, pay attention … a good signal to take profit or go short would be a signal reversal candle that CLOSES below the most recent candle that made the high … see chart below.
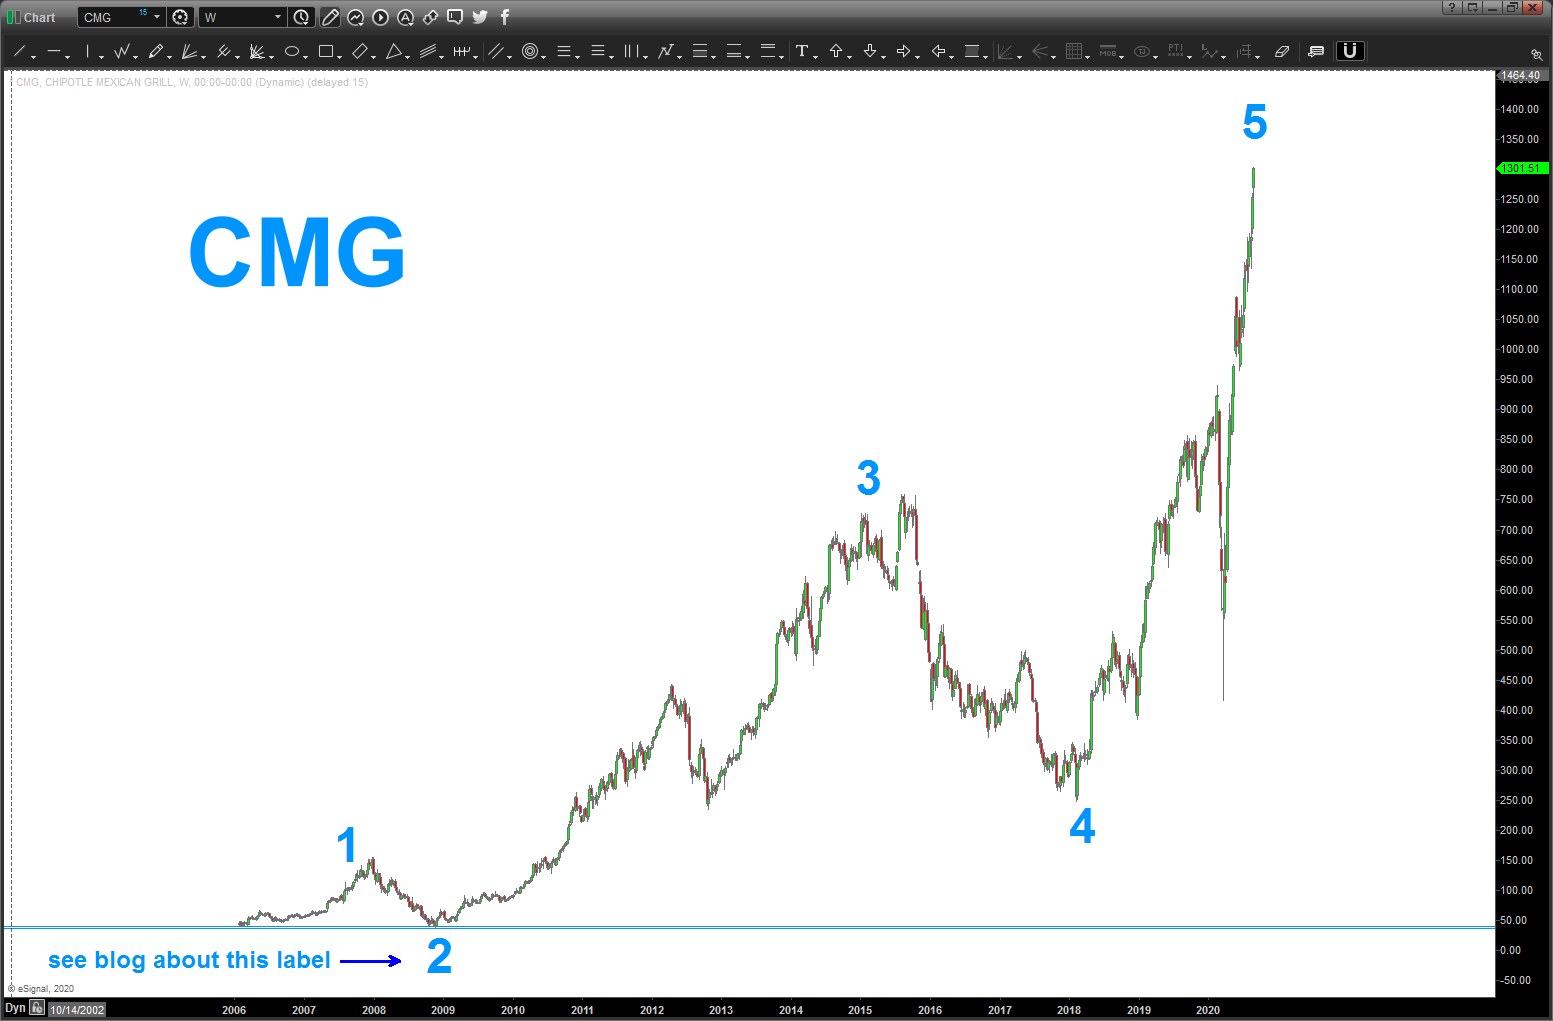
Chipotle Mexican Grill (CMG)
Posted on August 29, 2020 Leave a Comment
all, the burritos out her in San Diego are the best in the country- there I said it. I have a couple favorites and me and my son have a tradition of grabbing a Carne Asada or Cali Surf burrito every time we jam on some early morning jam sessions in the water surfing. the burritos blow anything that CMG can put on the menu BUT their stocks (don’t think any of them are publicly traded and most are local dive Mexican joints – the best type, right?) aren’t flying at over 1300/share. But CMG is …
if you search on my blog you’ll see we were all over the high at/around 700. then, frankly, I lost track of it and came back it to recently and was like “YOWZA DUDE!”
so, here is the biggest “other” w/ the CMG chart … it’s the 2009 low. It’s BARELY below the IPO price. But, because we try (operative word along w/ hope) to count waves we BREAK a rule by labeling it 2 after the IPO. folks we only have 3 rules and one of them is 2 can’t go below the origin of 1.
that’s the purist …
me, I’m not sure what I am so I’m going to allow a little slippage here and there …so here’s my count and if you give me that little/minor break of a rule w/in EWT then we have a VERY CLEAR 5 wave count …
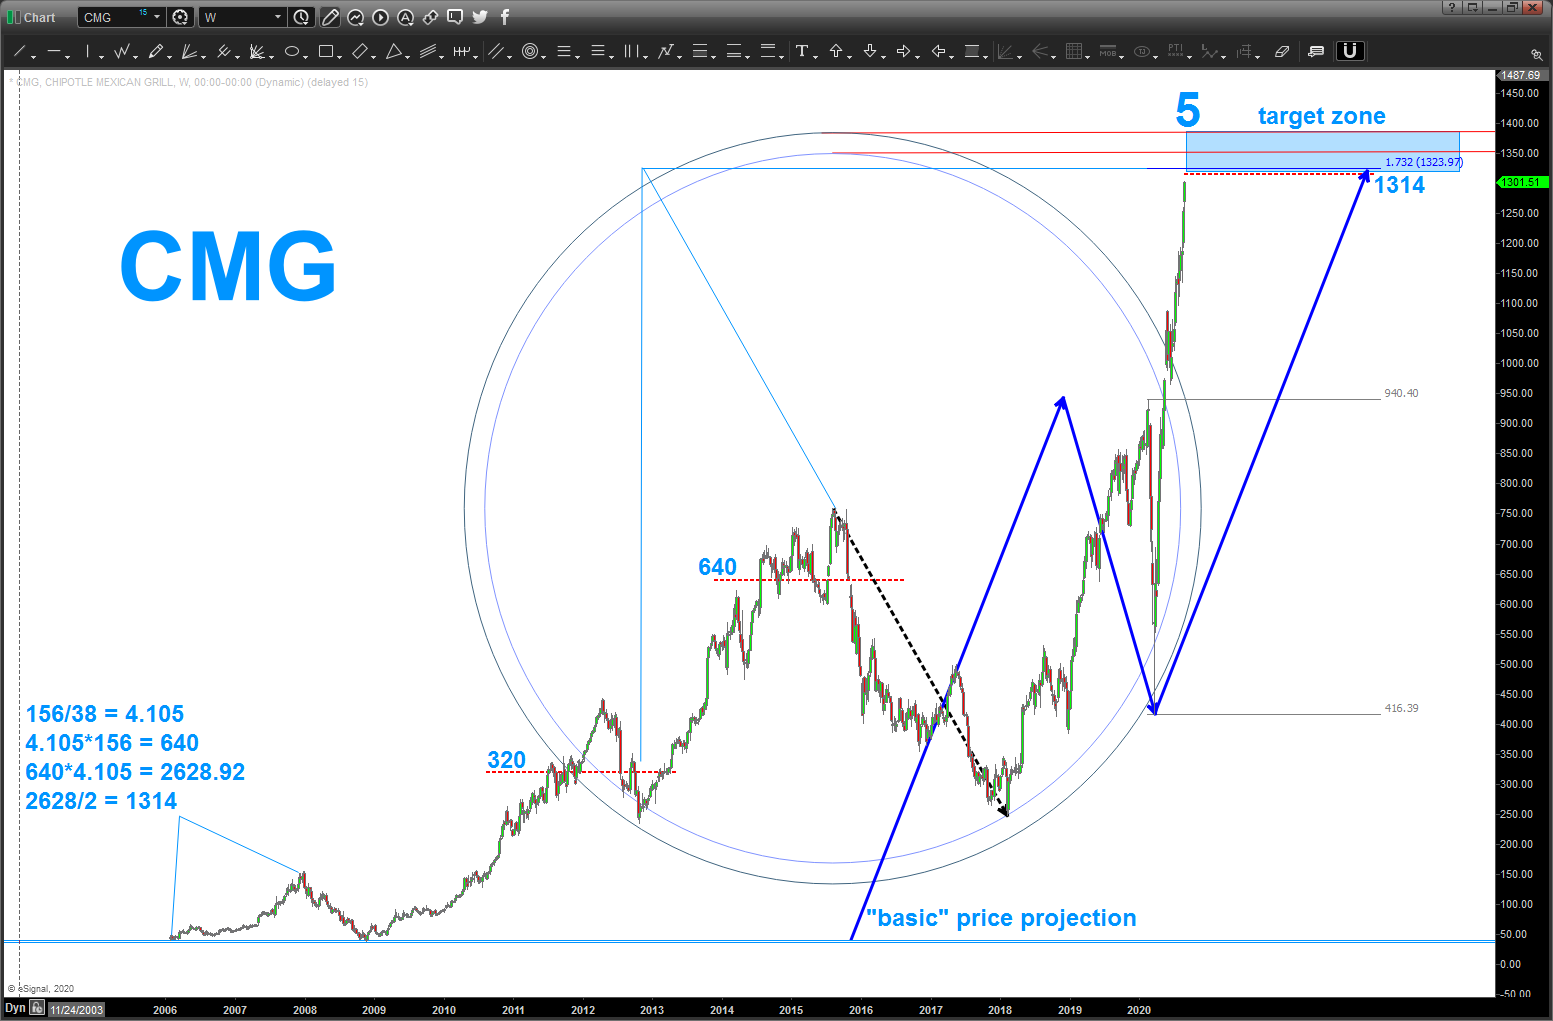
and here’s some of the math and geometry looking for the shown prize zone for targets to complete this run ….1320-1380 ish …
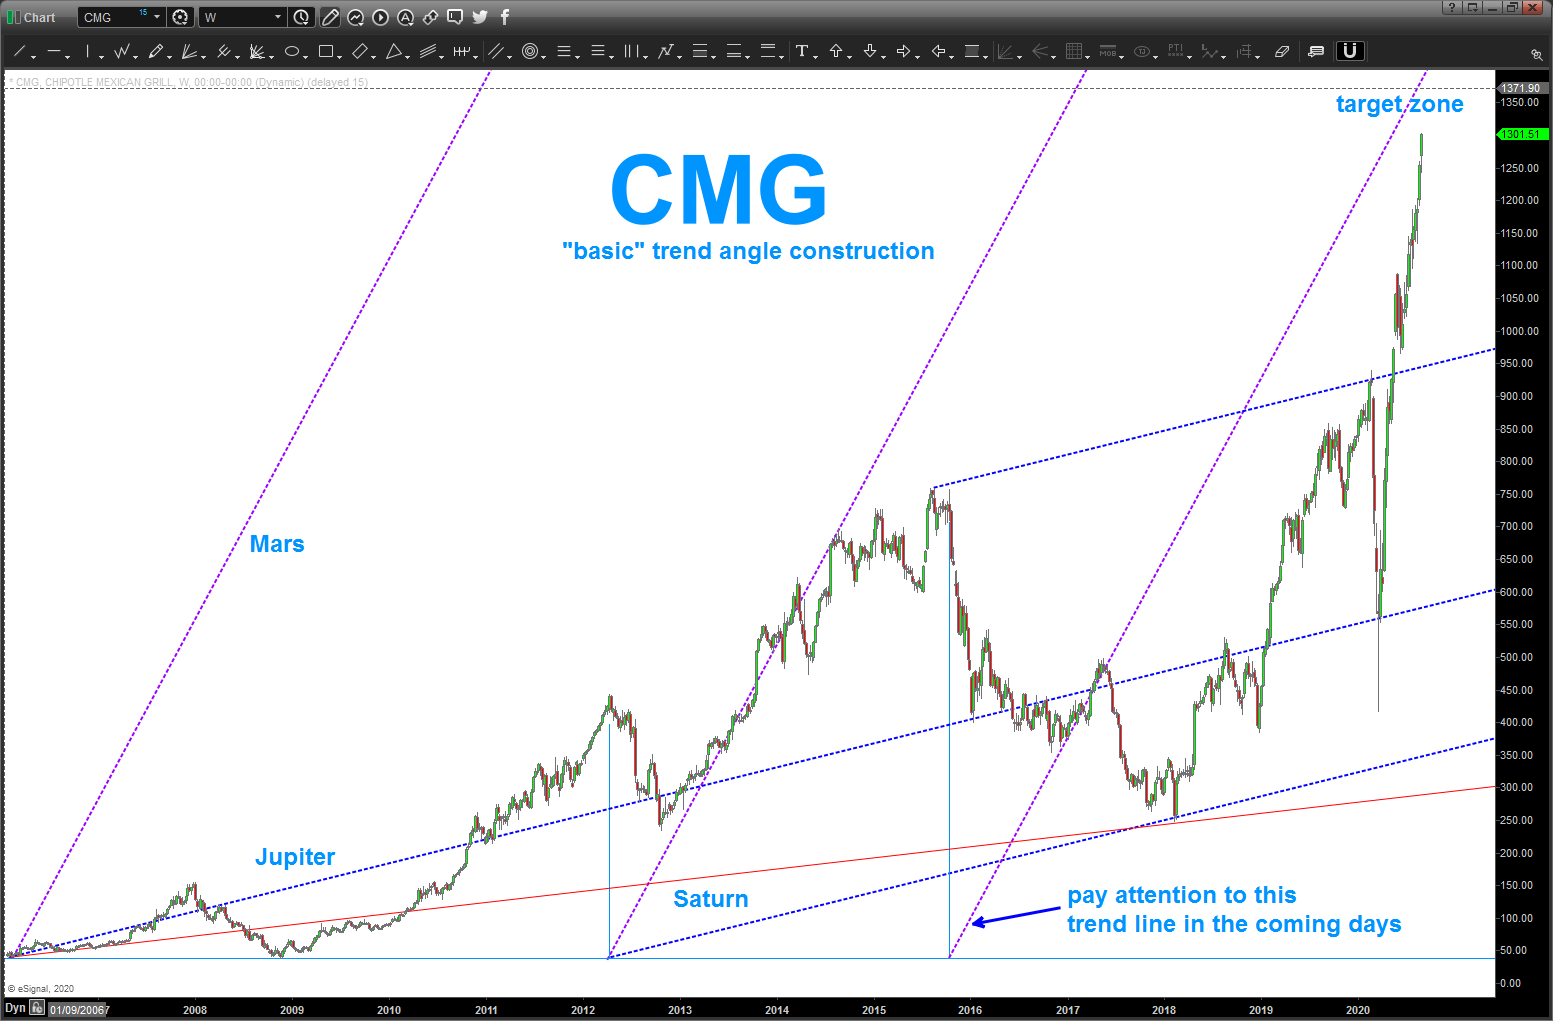
having taken all of the other ‘stuff’ off the chart, I want to show you a very easy yet powerful way to create “true trend lines” … take any planet (helio) and then move the planet 10 degrees from an origin point (in this case we are doing the IPO date) and that is your TIME component. Now, just add 10 points to the IPO price and where they intersect – draw a trendline. you can see the closer/fast moving planets have a more steep angle and larger, slower planets have less of an angle.
now, use those angles and copy/paste them and place them on different points to see the natural trend … you see, these trendlines are constant and don’t change … the planets move at a constant speed for time immortal.
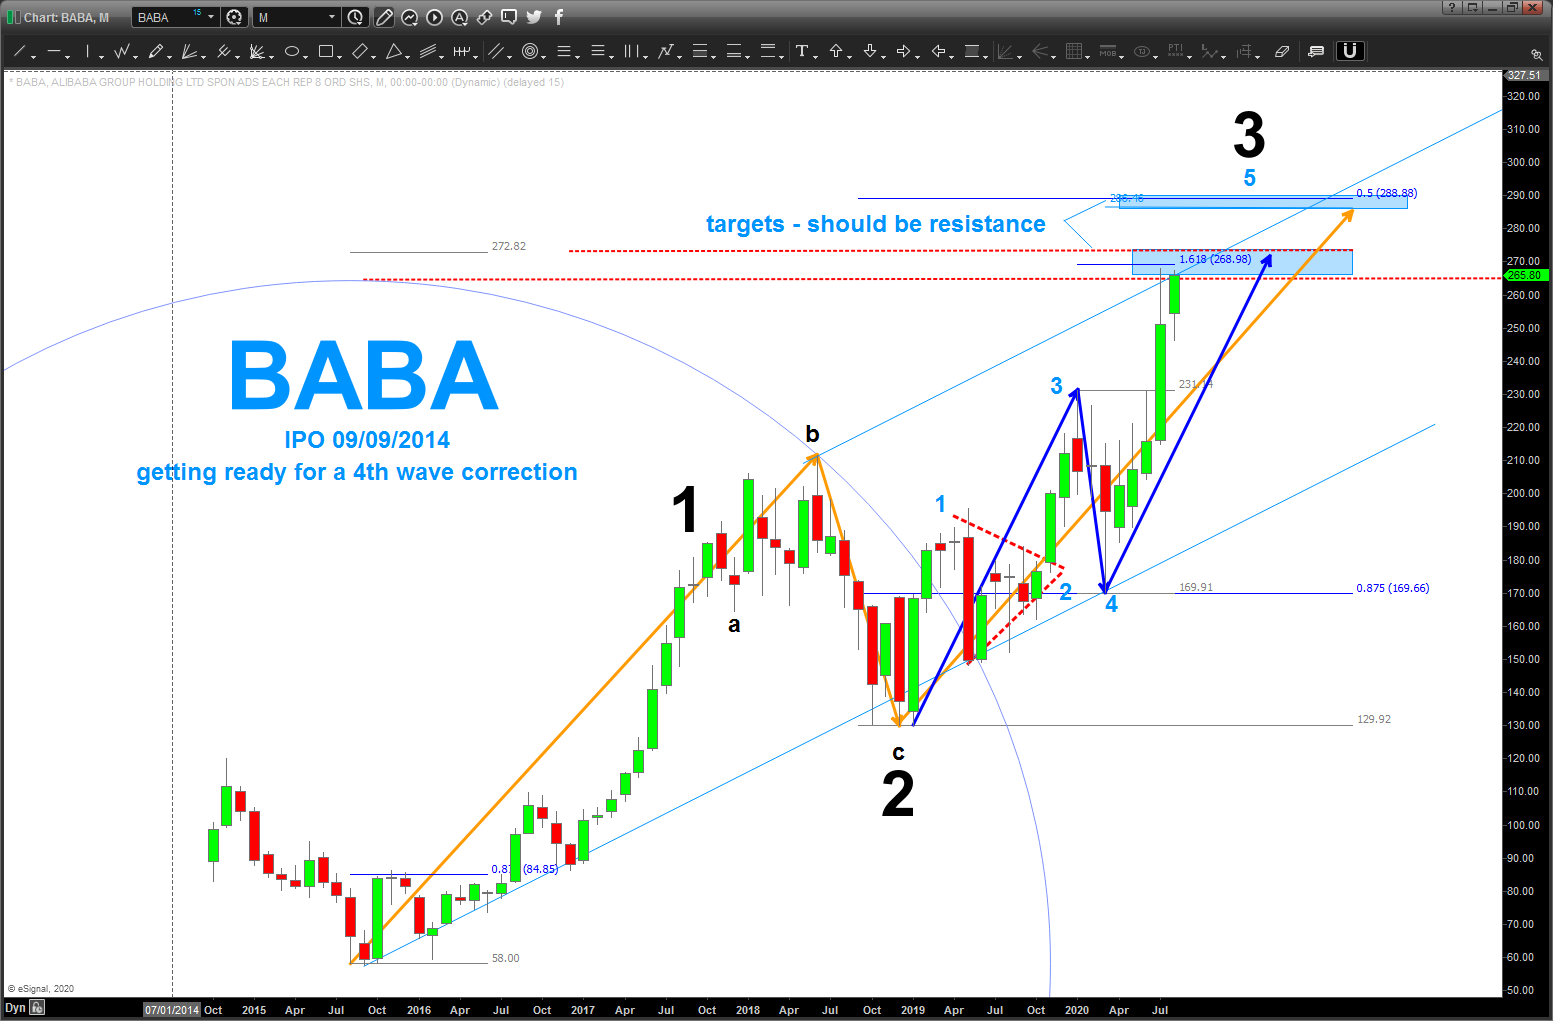
BABA
Posted on August 23, 2020 1 Comment
a lot going on in this chart … bottom line is either here or a little higher we have significant resistance with the most “basic” of price projections completing the AB=CD.
in this case we have two AB=CD’s
a larger orange one that starts at the all time low around 58. and a “fractal” blue AB=CD that starts at/around 129.
I have also use a very helpful technique taught me by my friend and mentor Michael Jenkins. It’s simple and very powerful. basically take 1/8’s of the signal reversal candle and project up … as you can see, we have a 1.0 projection and a .5 projection hitting at our lower and upper target zones respectively.
we also have the light blue parallel channel being hit at the upper end
extension targets are present …
then, no kidding, NOW, I’ll take a peak at the “potential” count. what i do feel “ok” about (and that’s all I will every to admit to w/ Elliott Wave – an “ok”) is the sub degree count that is finishing (labeled in blue) and that shows we are finished/finishing 5 waves. Is the THE 5 or the 3rd wave …I’m going w/ a big 3 and a 4th wave correction is inbound …
hope this helps …
Bart
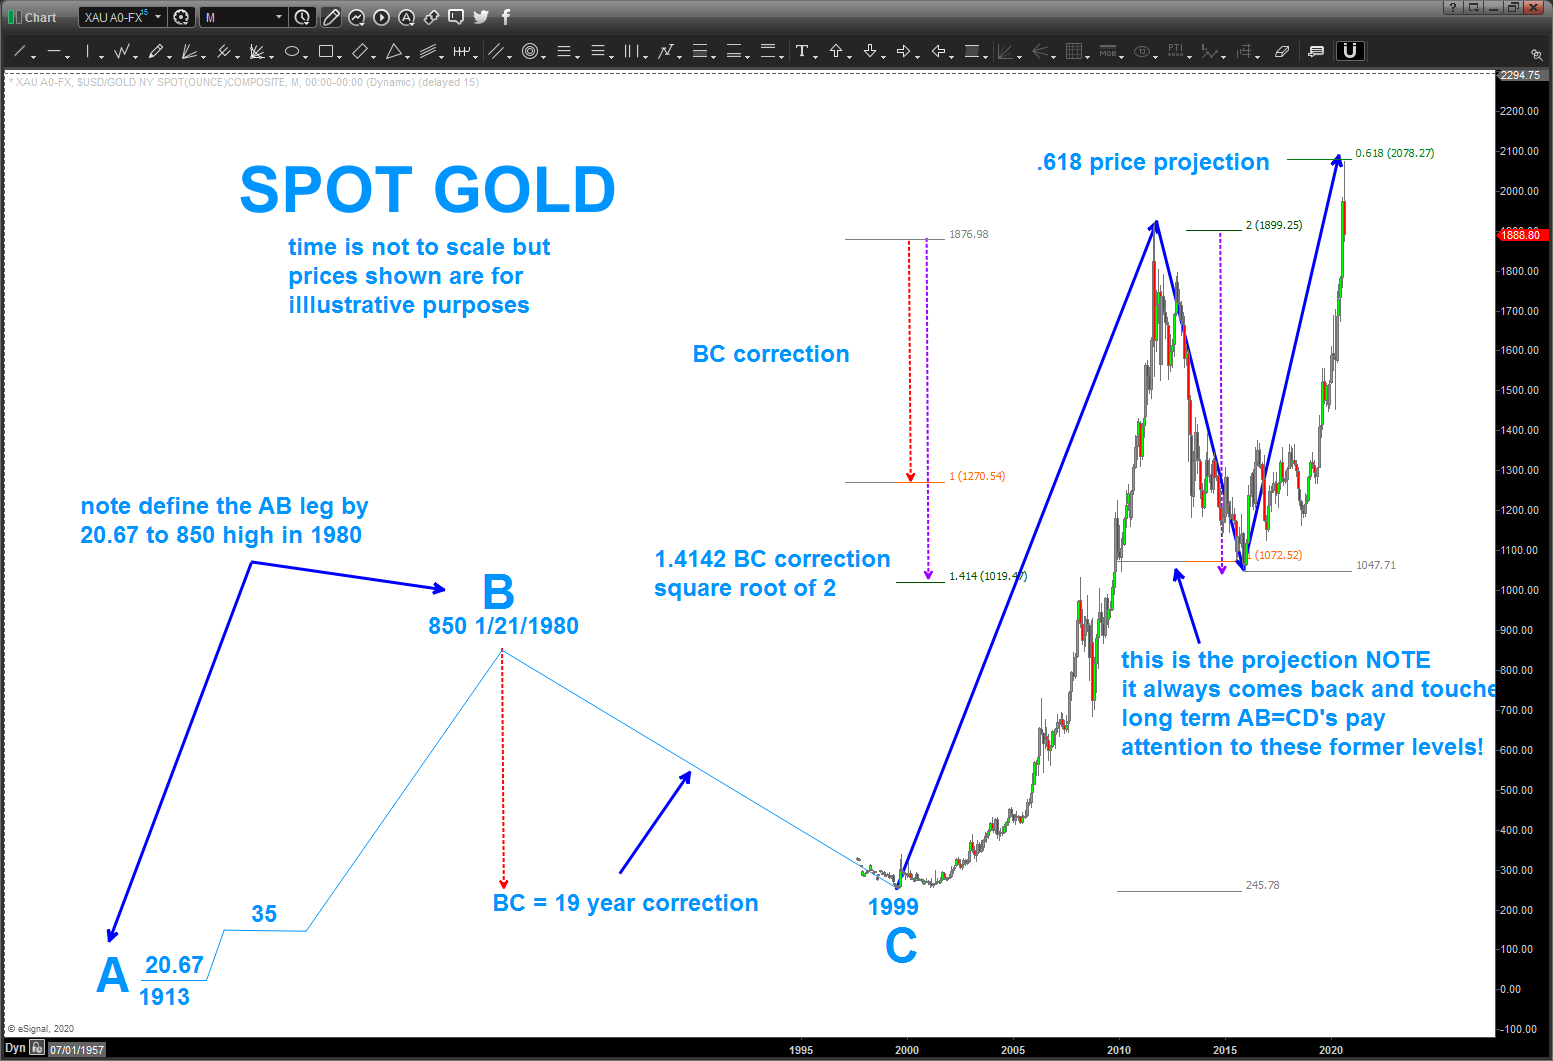
A look at Gold …
Posted on August 11, 2020 Leave a Comment
that was one heck of a breakout from the triangle back down around 1350! yikes … played the triangle well but took profit WAY too early. but, then again, anytime you can say “took profit” then yeah! why would you take profit w/ the mania that is gold … and that’s the reason: “mania.” Sentiment is more bullish gold than anytime in history!
and, believe we had a major (like a 5 count) high back around 1900 and the last “major” correction lasted almost 20 years so … do we have another wave down to complete the correction from a form proportion and balance perspective.
don’t believe Gold is a “sure thing” right now ….stay tuned.
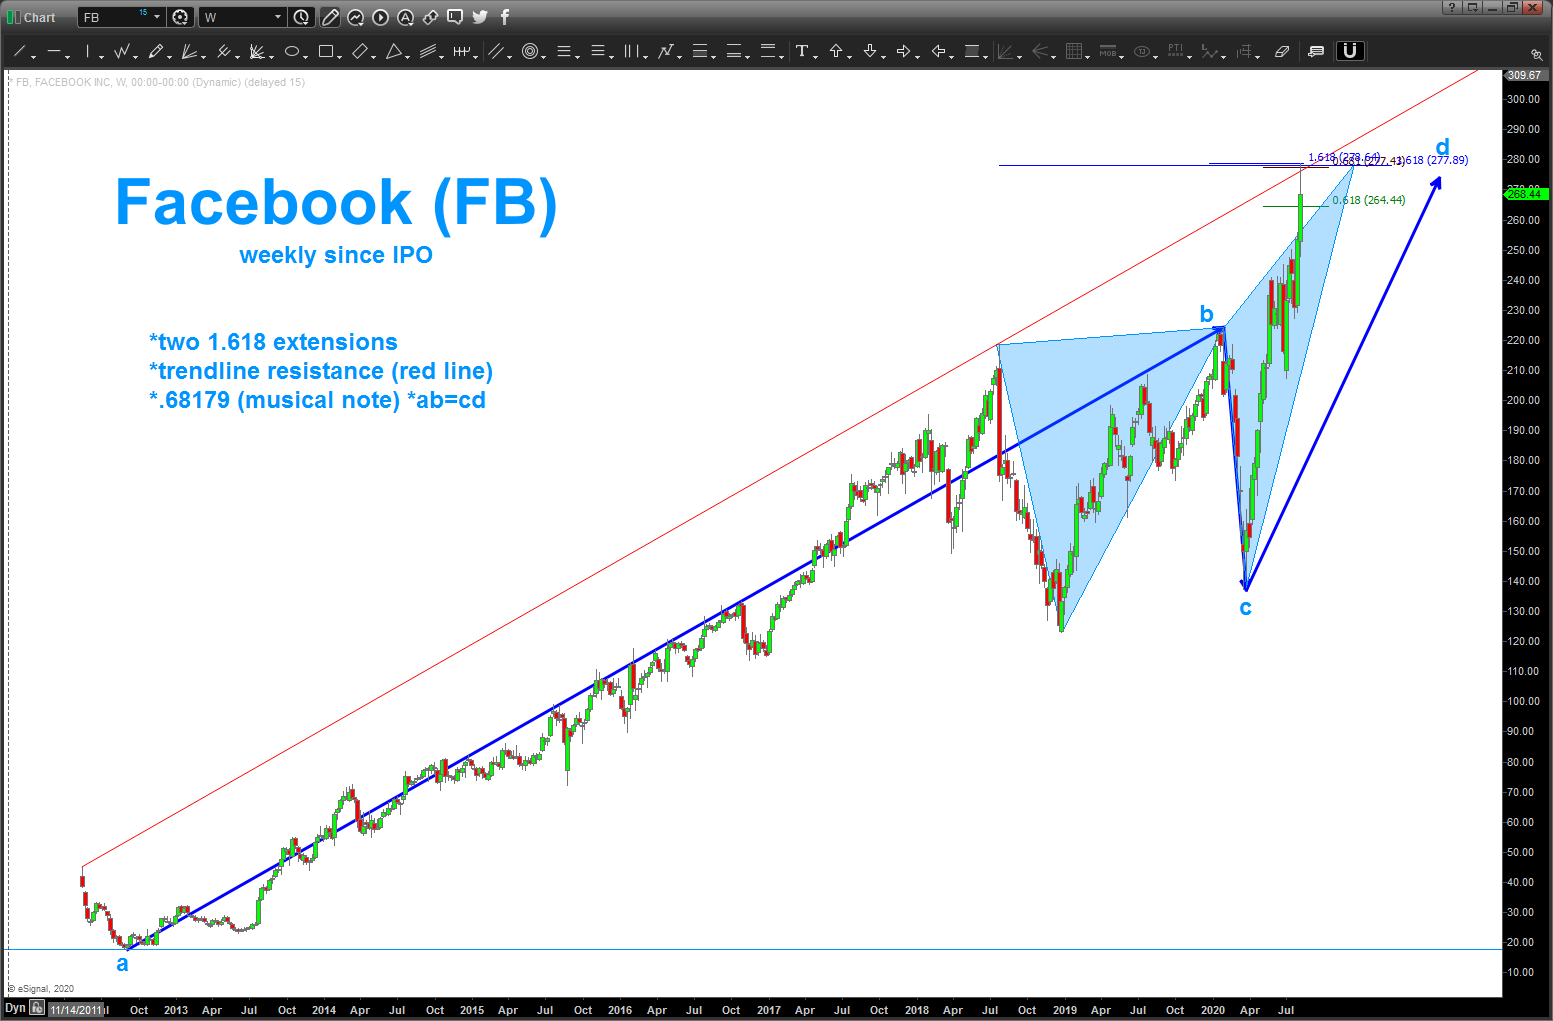
Facebook – strong resistance hit
Posted on August 10, 2020 Leave a Comment
we have 4 aspects of FB that show the ATH to be significant resistance.
two 1.618 extensions, key trend line resistance and a projection from the ATL and while it exceeded .618ab*cd you can see as discussed in this blog it did hit the .68179ab*cd (musical note ratio) so we can see why this level/area was big resistance. I would watch for a close below (weekly close) 250 for a significant pullback to be in place.
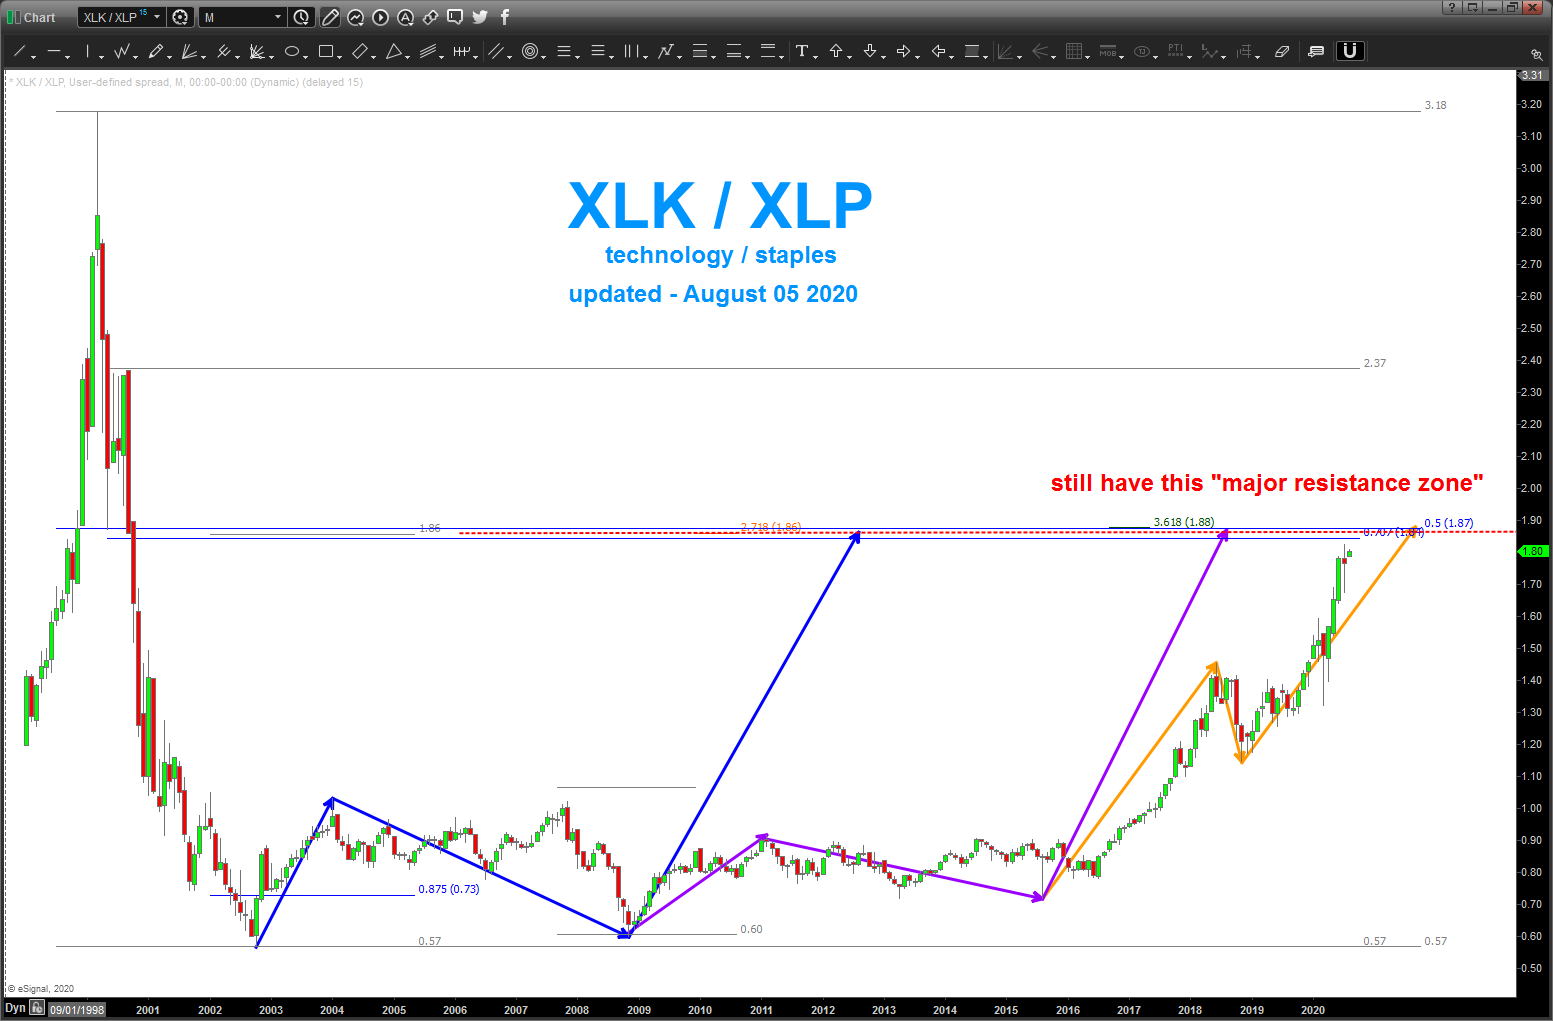
XLK / XLP – still has major resistance just a little higher!
Posted on August 5, 2020 Leave a Comment
we had a sell off on the ratio a couple weeks ago BUT there was not follow thru and we still have the lingering level just a little higher which is the real test … again, until we have a strong weekly close above this level I’m in the conservative/flat camp as far at the NASDAQ and Technology goes …