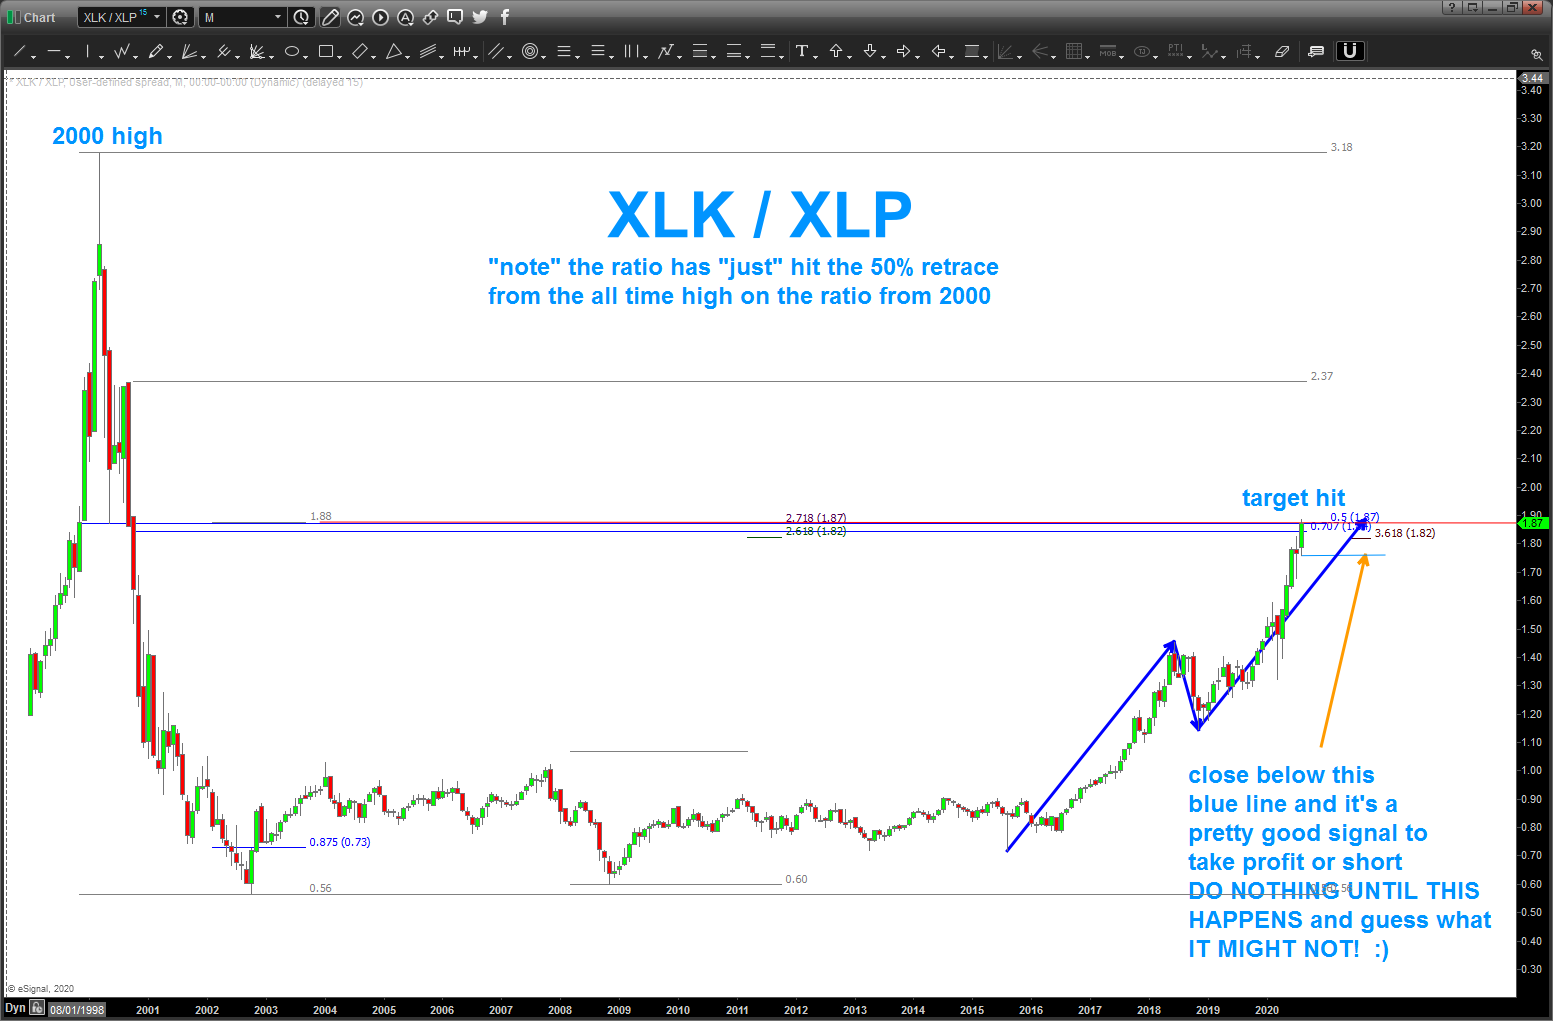
XLK / XLP TARGET HIT
if you look at this chart …it is hard to make sense of it all. at least for me ….you see the EUPHORIA and SENTIMENT indicators are at extremes and expressing bullish optimism all the way back 30+ years.
I’m going to say it once and for all … folks, it’s different this time. the market will never go down and just buy buy buy. who cares if the leaders are parabolic or any of that … this is EASY.
If that was the case, then the XLK/XLP ratio would be taking out the 2000 highs, correct? throw caution to the wind and its’ risk on right? Ummmm…no, this ratio says that the advance is not as great as we think. I know, that sounds crazy but look at the chart …
anyway, pay attention … a good signal to take profit or go short would be a signal reversal candle that CLOSES below the most recent candle that made the high … see chart below.

Is this a weekly chart?
this is a monthly chart from the 2000 high. NOTE – today it WEEKLY opened above the target zone which is bullish. a TON of math and “other” stuff was coming into play at this level. the fact that it went thru it like a hot knife thru butter … man that’s bullish. if we get a weekly close (FRIDAY) above this level then back to the drawing board. I am WAITING for a signal reversal candle..sentiment is ALL TIME BULLISH> I sense this will end badly when it pops, unfortunately. Going to post MSFT. Totally parabolic