Dollar Index … here we go and UPDATE
Posted on July 21, 2020 Leave a Comment

12/3 – please take the time to reread the below, as it is rather in depth, because it explains how important the coming levels are on the USD. folks, they are HUGE!
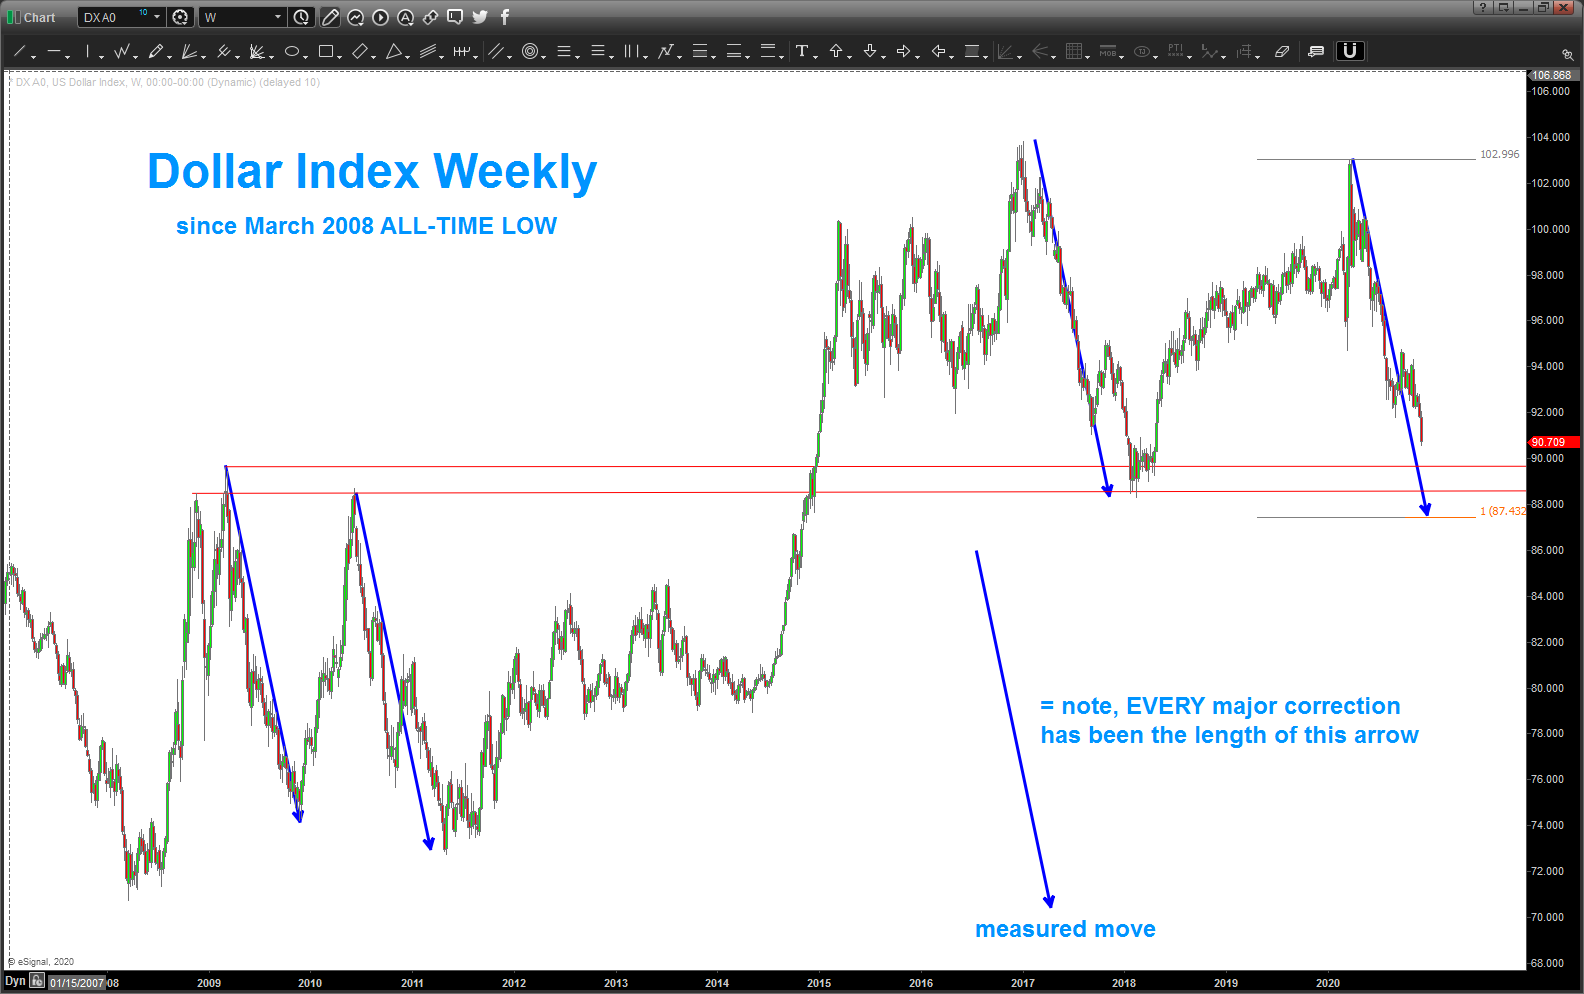
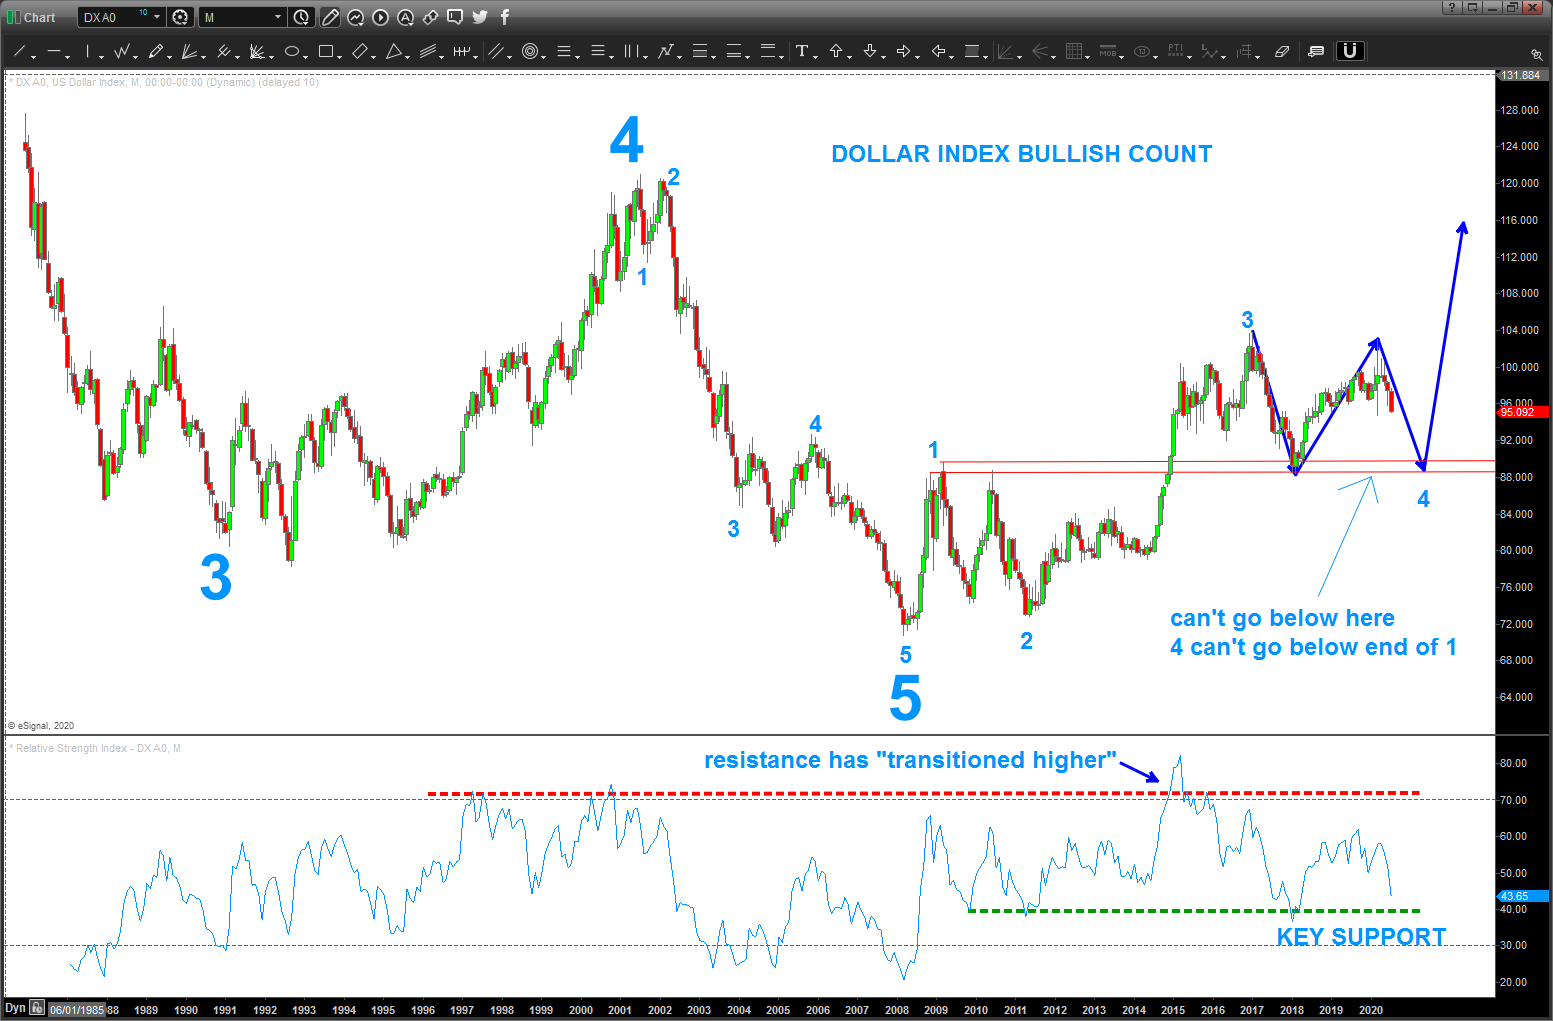
in the chart below, you will see no labeling. if bullish we poke our head below former support and ROCKET SHIP higher from 87-88. if bearish we find support but keep going down. how far down? well, of course, below the old all time low from 2008.
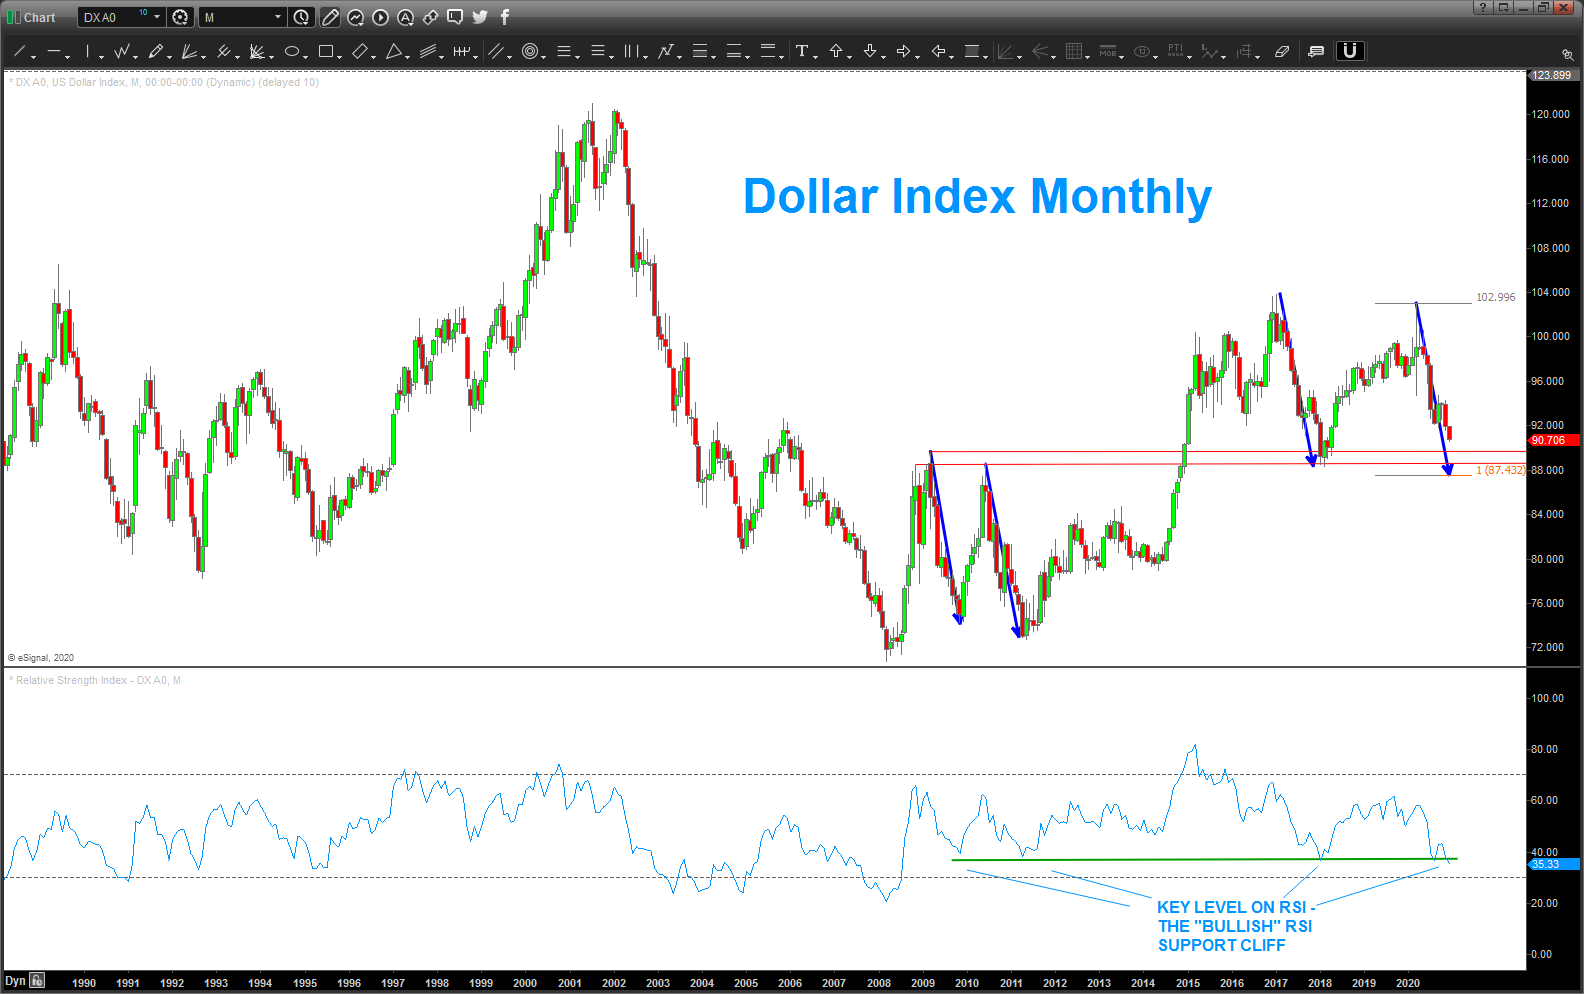
this second chart is the Monthly but added the RSI. this is key … as discussed below, the RSI develops bull/bear zones and can really help w/ your analysis .. in this case we are sitting right on the cliff of support for the BULLISH ZONE. If we go below there the RSI is telling us of a potential BIG trend change … adding more fuel to the fire for the key 87-88 level!
————————————————————–
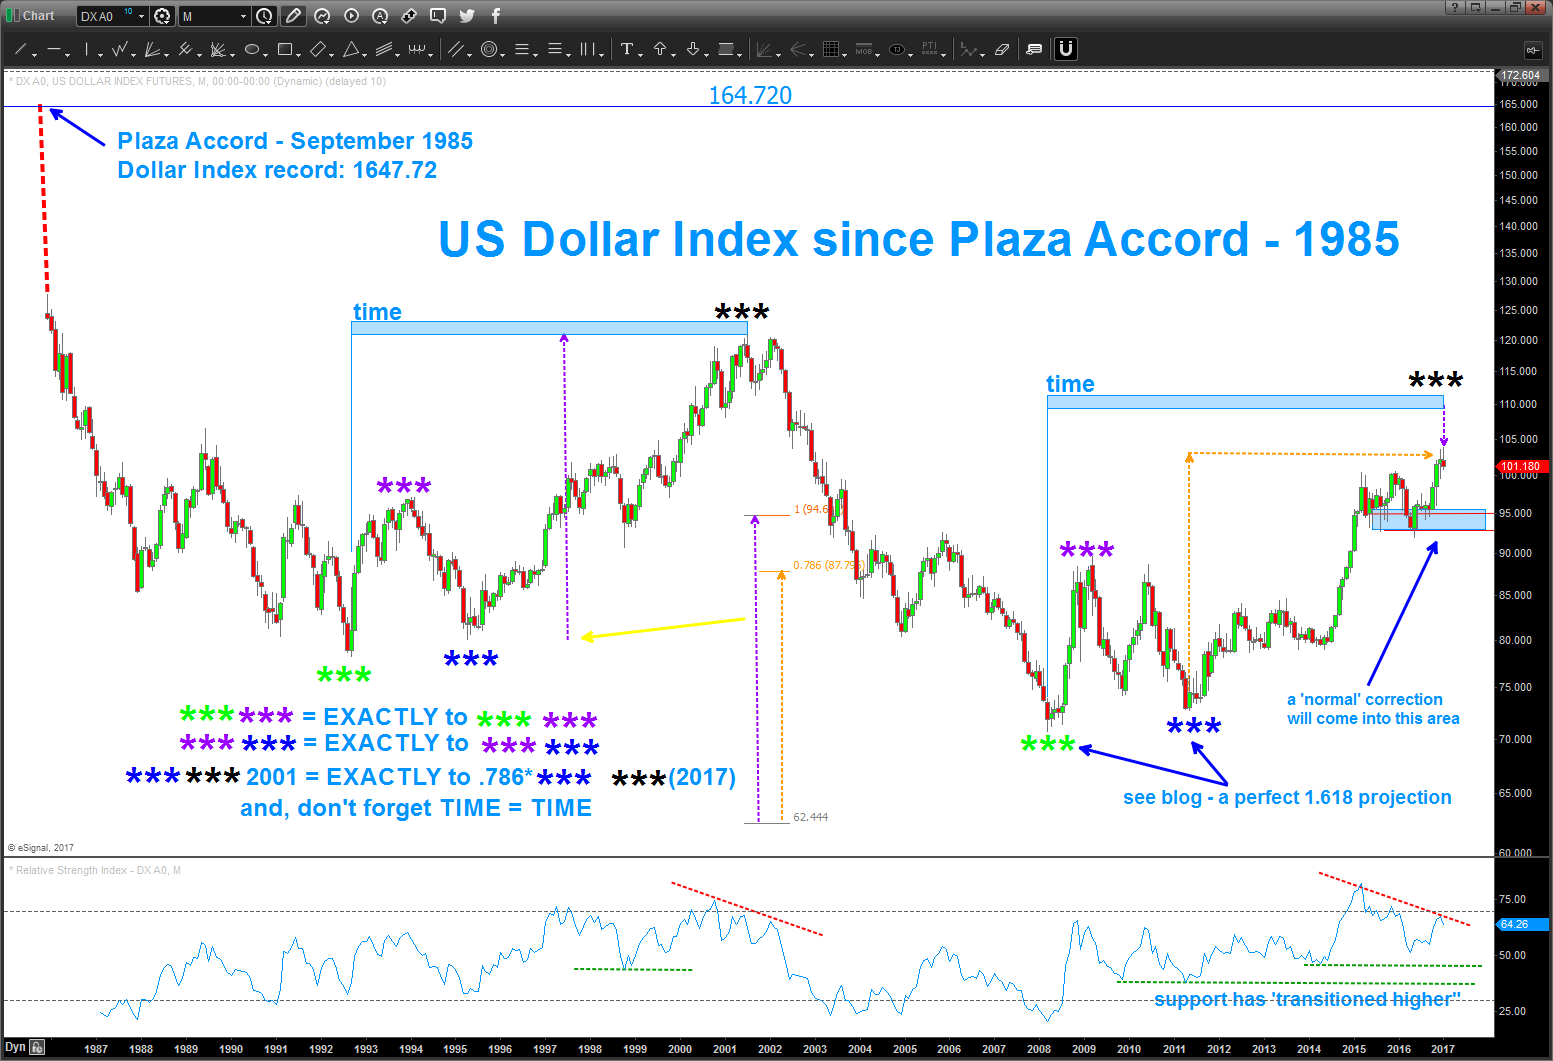
it’s been almost 3ish years since I posted on the Dollar Index. My last post was the chart below and what’s shown are the many many time and price synergies between the current time and, well, 30 years ago. this chart nailed the high in the dollar and I’ve been watching it just seeing what type of FORM and BALANCE and PROPORTION the index would take … ummm, I still really don’t know but what’s important is the kazillion dollar COVID question – was the “high” a C or a 1. Folks, this is a HUGE deal.
so where are we ….? i don’t know where you are BUT I know that I’m somewhat confused …. is it wave 3 and we are correcting wave 4 or was that an A-B-C correction from 2008 and we are at THE MOST IMPORTANT POINT IN THE US DOLLAR INDEX right here, right now?
for the EWT purest out there, the top in 2017 around 103 is really dependent upon the correction into the 88-89 area. for the bulls, we know that wave 4 cannot overlap the end of wave 1. we don’t close below the end of 1 but we do go thru a little … man, are we cutting hairs here …? we do have the RSI transition into bullish zones but here’s all we need to know. we can’t go below 88-89 because then 4 goes below 1 and we have something else going on …..
the bears …? it’s almost a textbook zig-zag correction and the symmetry in time and price from the last BIG correction (1992-2001) is PERFECT in time and the harmonic .786 of that last big correction make the bears … hungry? The RSI resistance breakout doesn’t help BUT note how low the last rally was … again, the key is support. If we break the dashed green line … this puppy might be diving into the red sea, so to speak.
I DON’T KNOW …but here are two charts that spell out the “big picture” bear case and the bull case … either way, I suspect we’ll know soon.
Bart

SMG – Scott’s
Posted on July 19, 2020 Leave a Comment

now that I’m in SoCal doing a TON of SUP Surfing I really don’t spend my weekend like I used to in VA – cutting the grass, giving it fertilizer and aerating, etc … man, I had some very nice lawn going on … 🙂
I used to say, the grass just needs a stiff drink of “Scott’s and Water” …
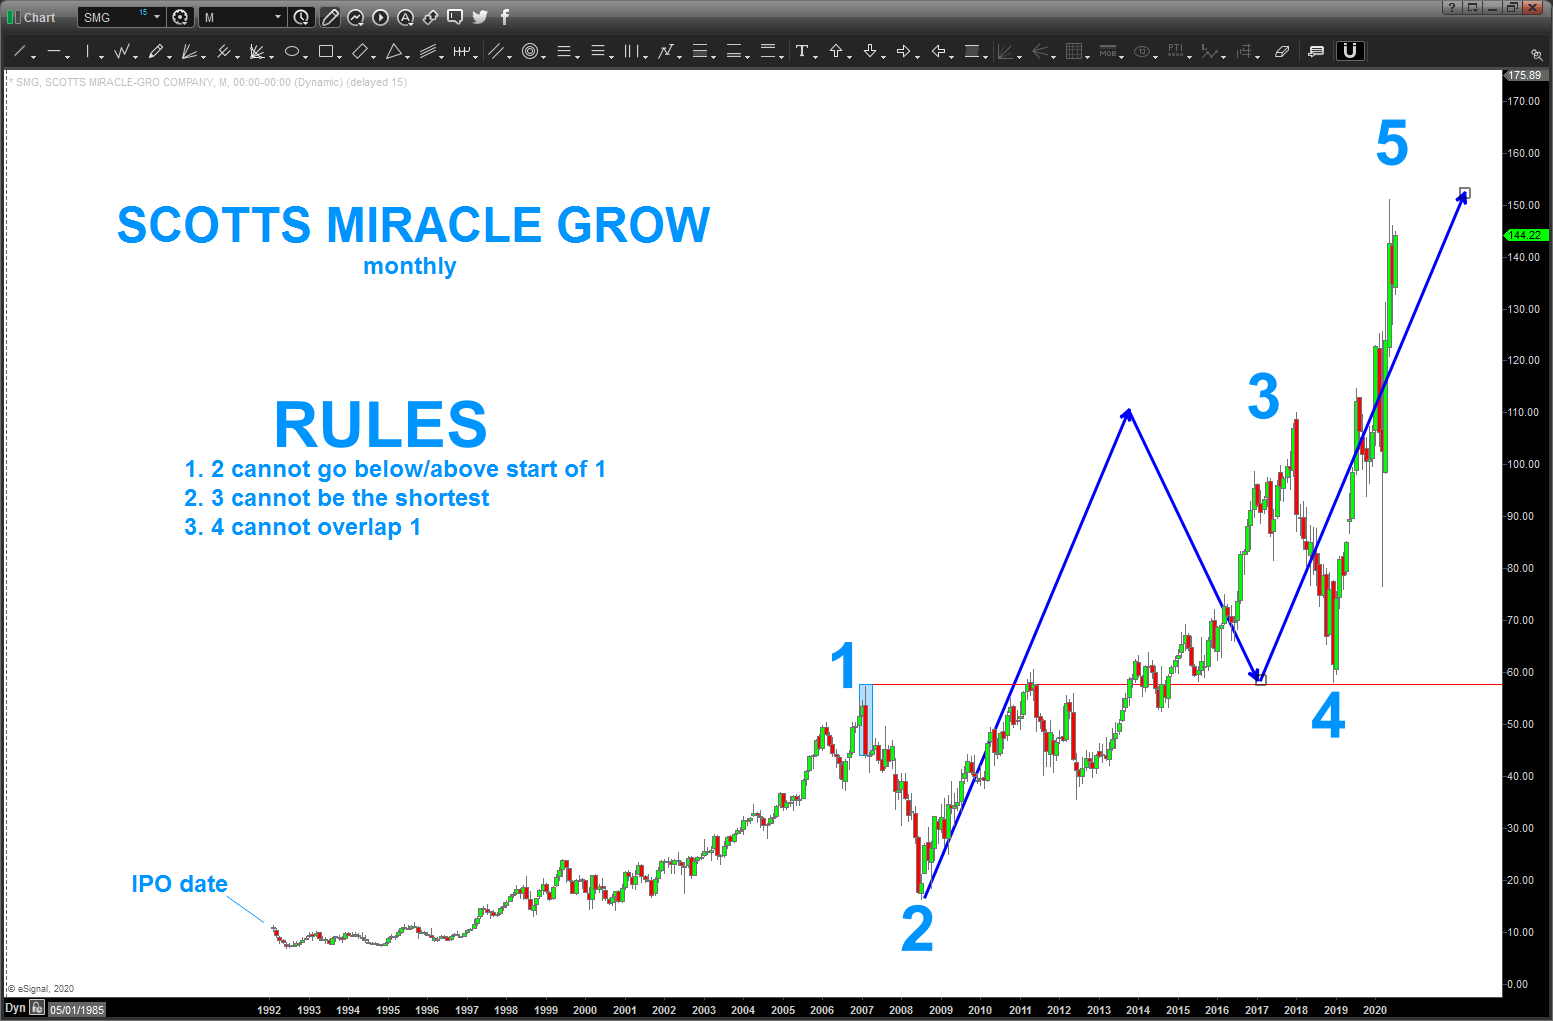
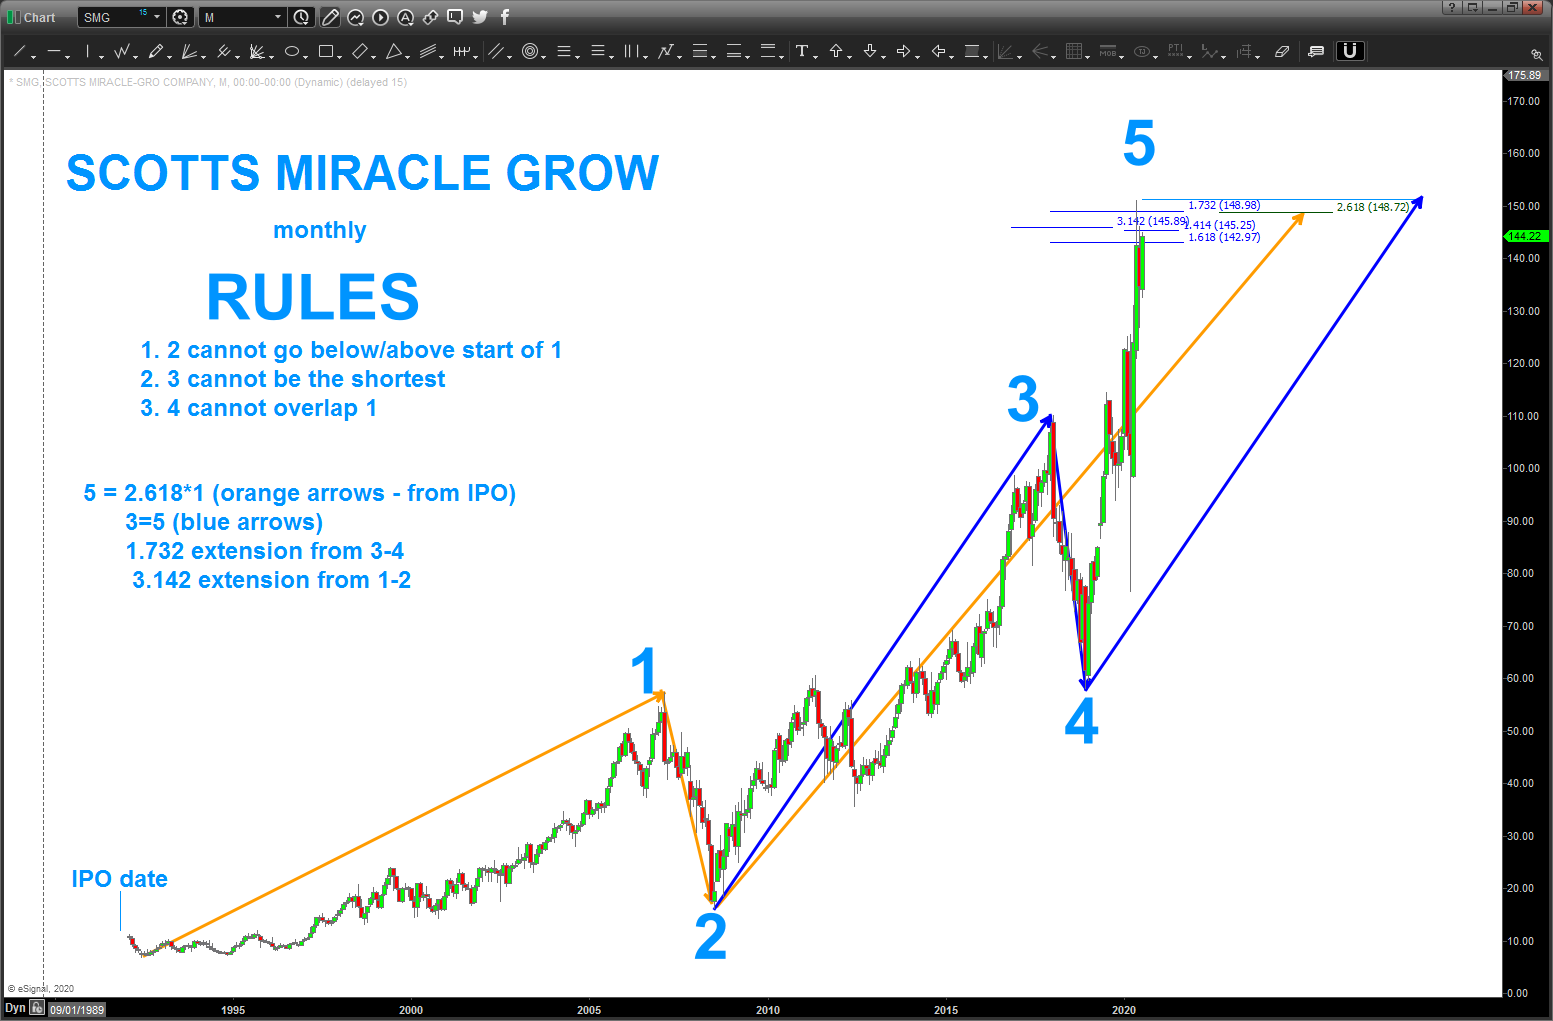
anyhoo, took a quick look at SMG this AM and I’m going to be teaching some EWT to a fellow professional and this one popped onto the radar so I shot it over to him ….
EWT is great – when it works. that was supposed to be a joke and serious because it’s both.
just know the rules, look for corrective moves in form/balance/proportion and if your counting to may waves of sub waves of blah blah blah then put it aside and WAIT.
this count does not break any rules and is therefore a valid – subjective – interpretation. I do see that we are in a 5th wave. I also see the “why” behind the math and numbers of the most recent top.
TSLA-rocket ship – updated – updated-update-update resolved
Posted on July 12, 2020 Leave a Comment
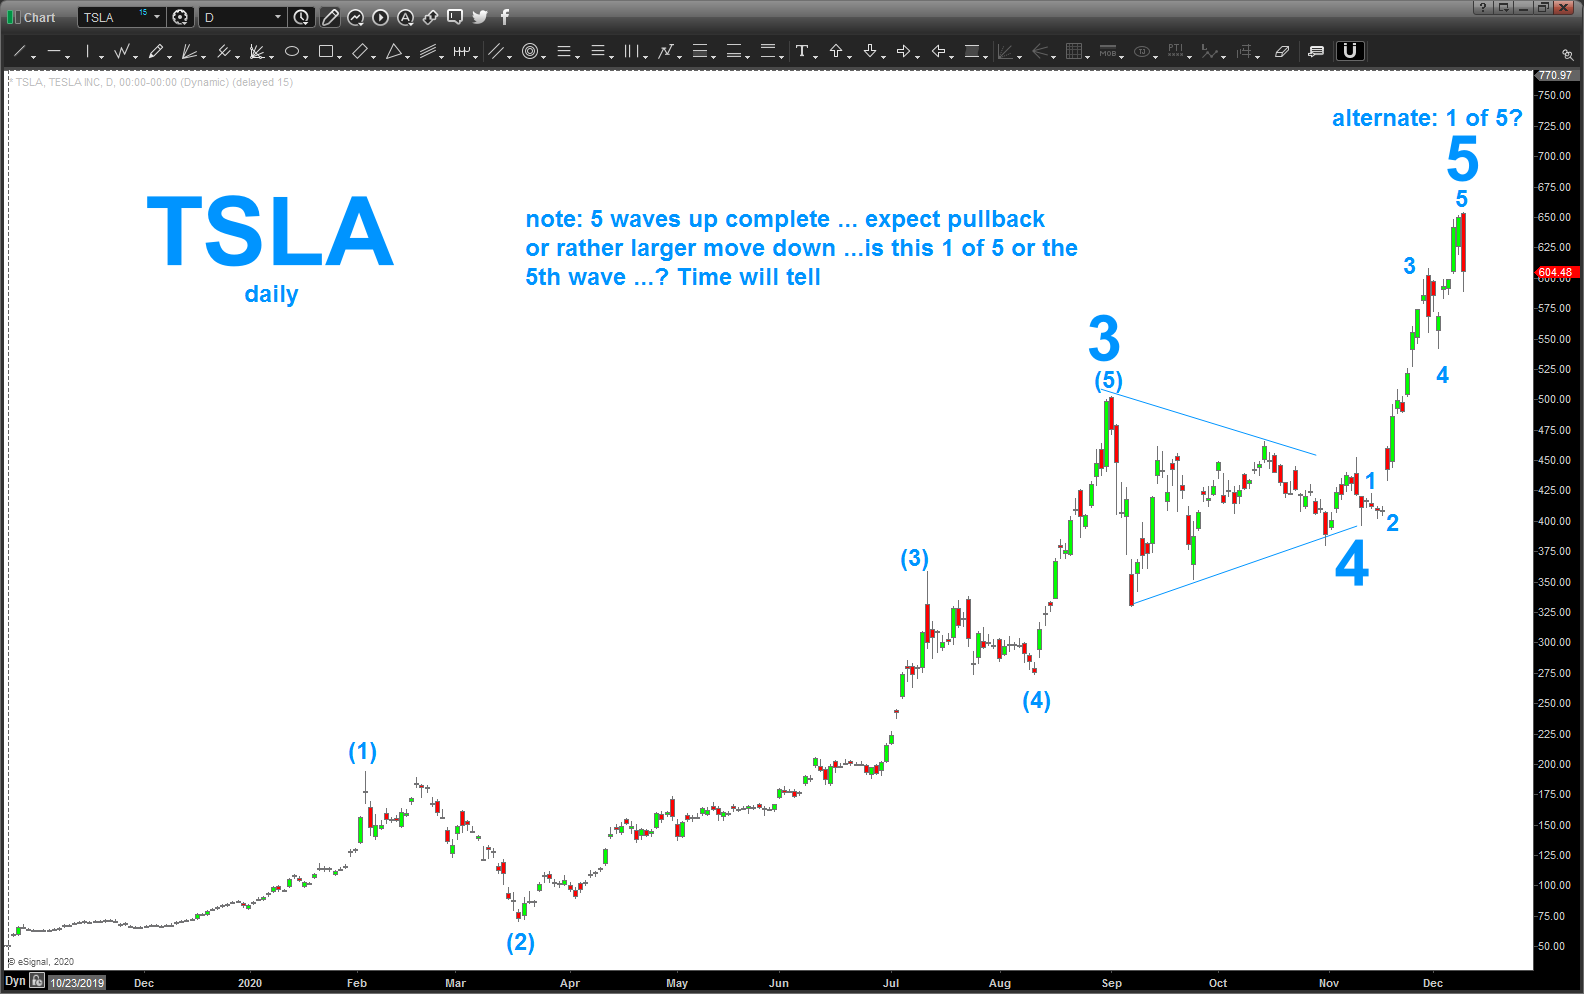
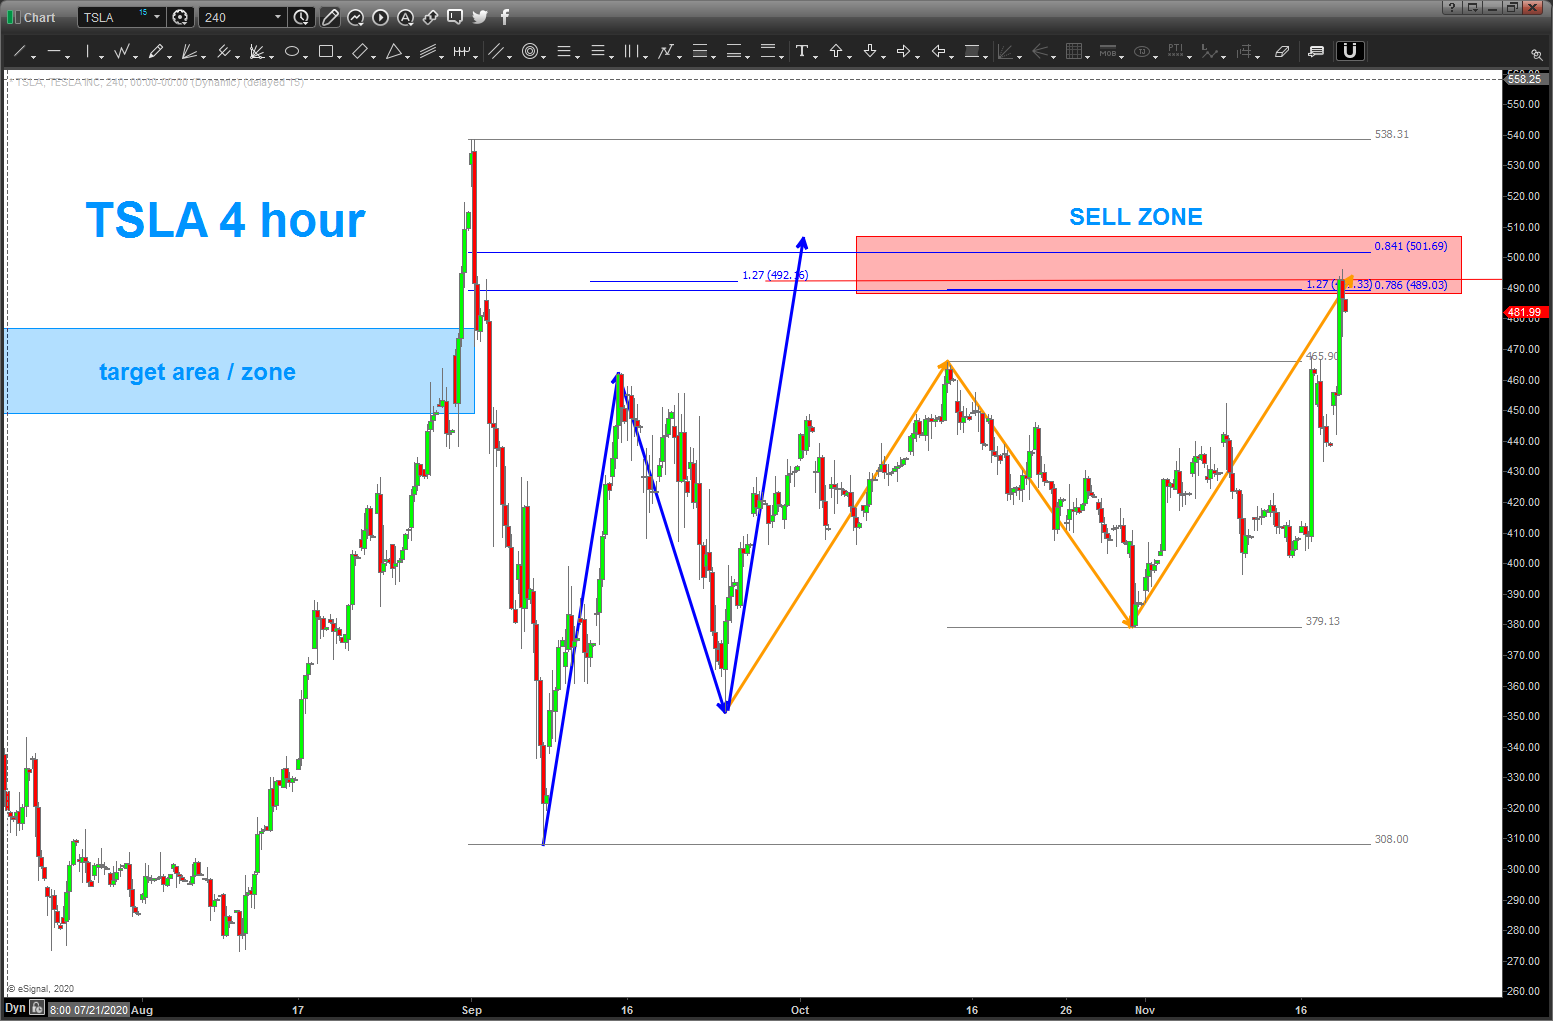
12/9 – 5 waves up complete .. is this the 5 or 1 of 5? don’t know and don’t care. expect a pullback from here … lot’s of gaps on the way up so stand by …
_______________________________________________
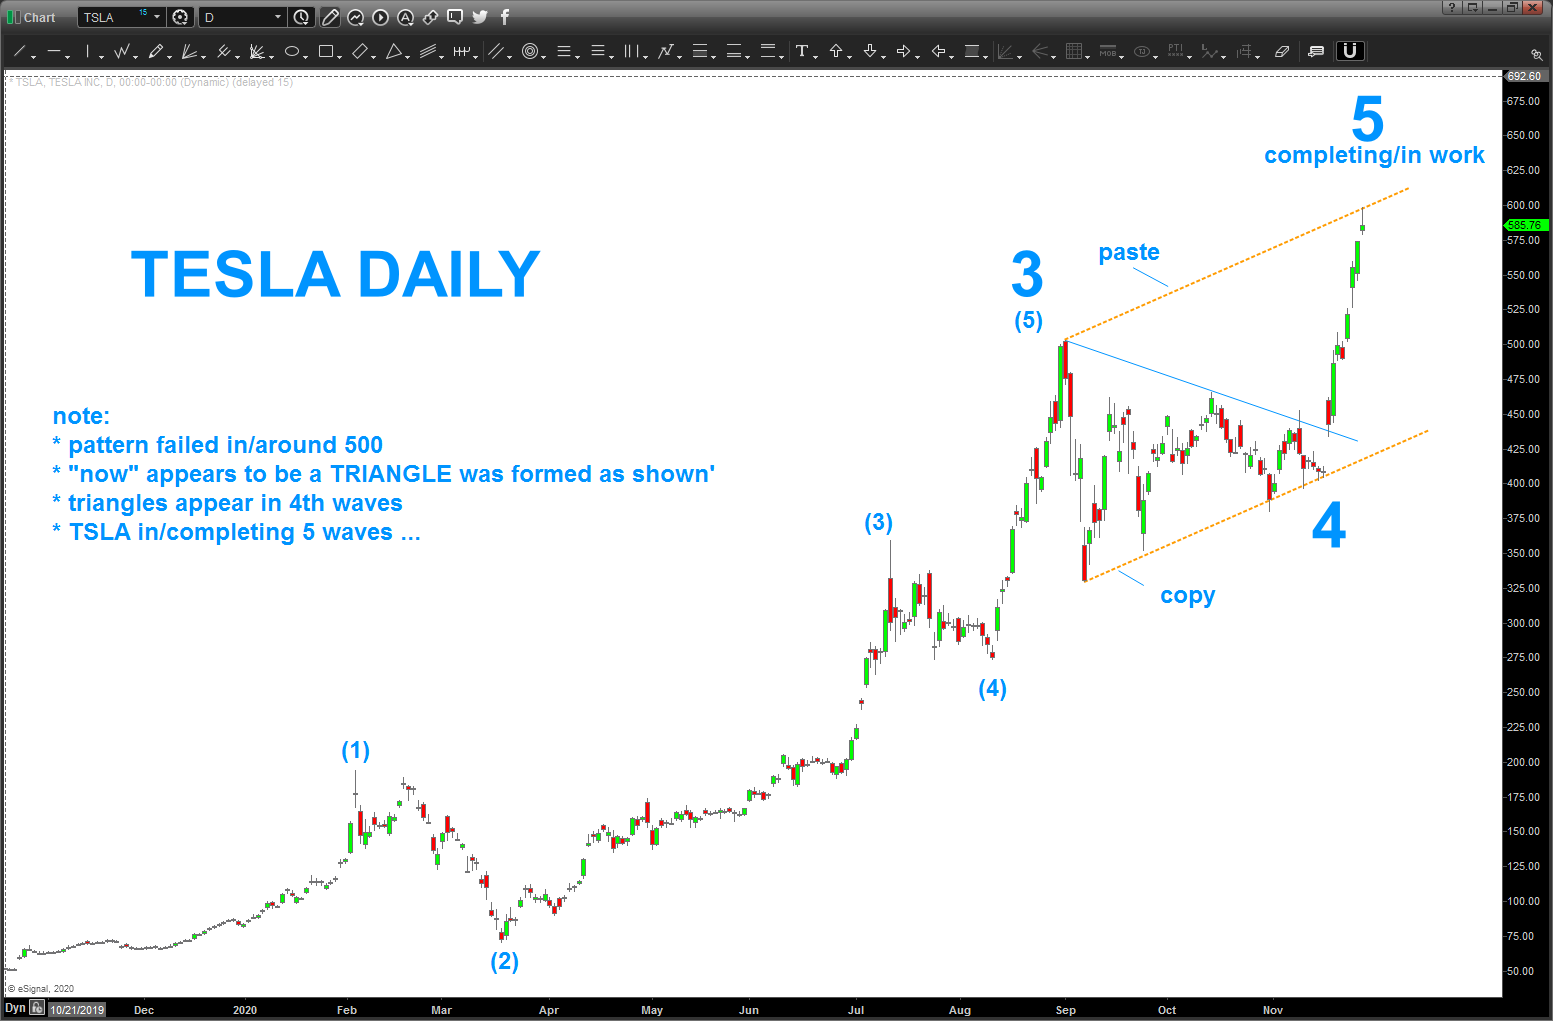
11/29 – TSLA blew thru the SELL PATTERNS shown below (11/19/20). the way it just took off made me rethink and look at the chart and, as Triangles usually do, after the fact (sorry about that) it appears to have been a 4th wave triangle. most of the time, you don’t realize your in a triangle – if you ever do real time – till after the fact or in the “e” wave …all this means… TSLA is completing/ has completed a 5th wave.
the PATTERN/CHARTS saying the risk is now on the long side … a correction down to 400 ish is not out of the question.
_______________________________________________
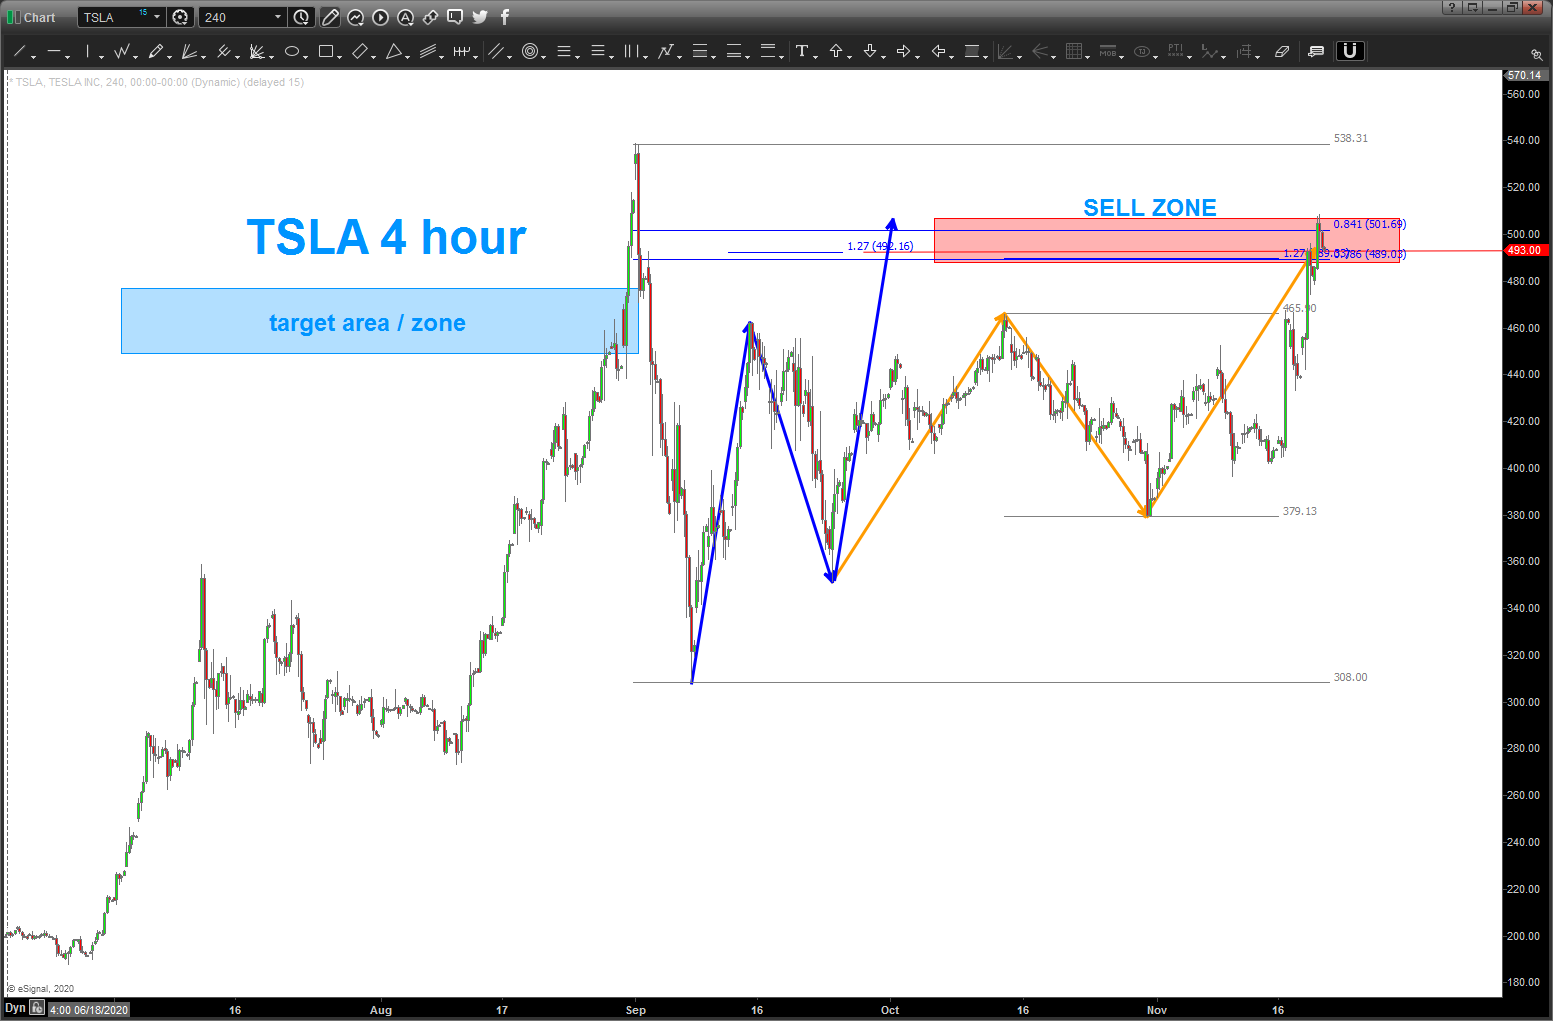
11/19 – today, TSLA ran into the top edge of the “sell zone” and backed away … keep an eye on this one as it’s not a “no brainer” long, right now.
_______________________________________________
11/18 – today, TSLA ran into a strong sell pattern. if, we start down from here it will be a BUY but not after a potential “large” drop. a daily close ABOVE the sighted “SELL ZONE” would be continually bullish and strong.
_______________________________________________
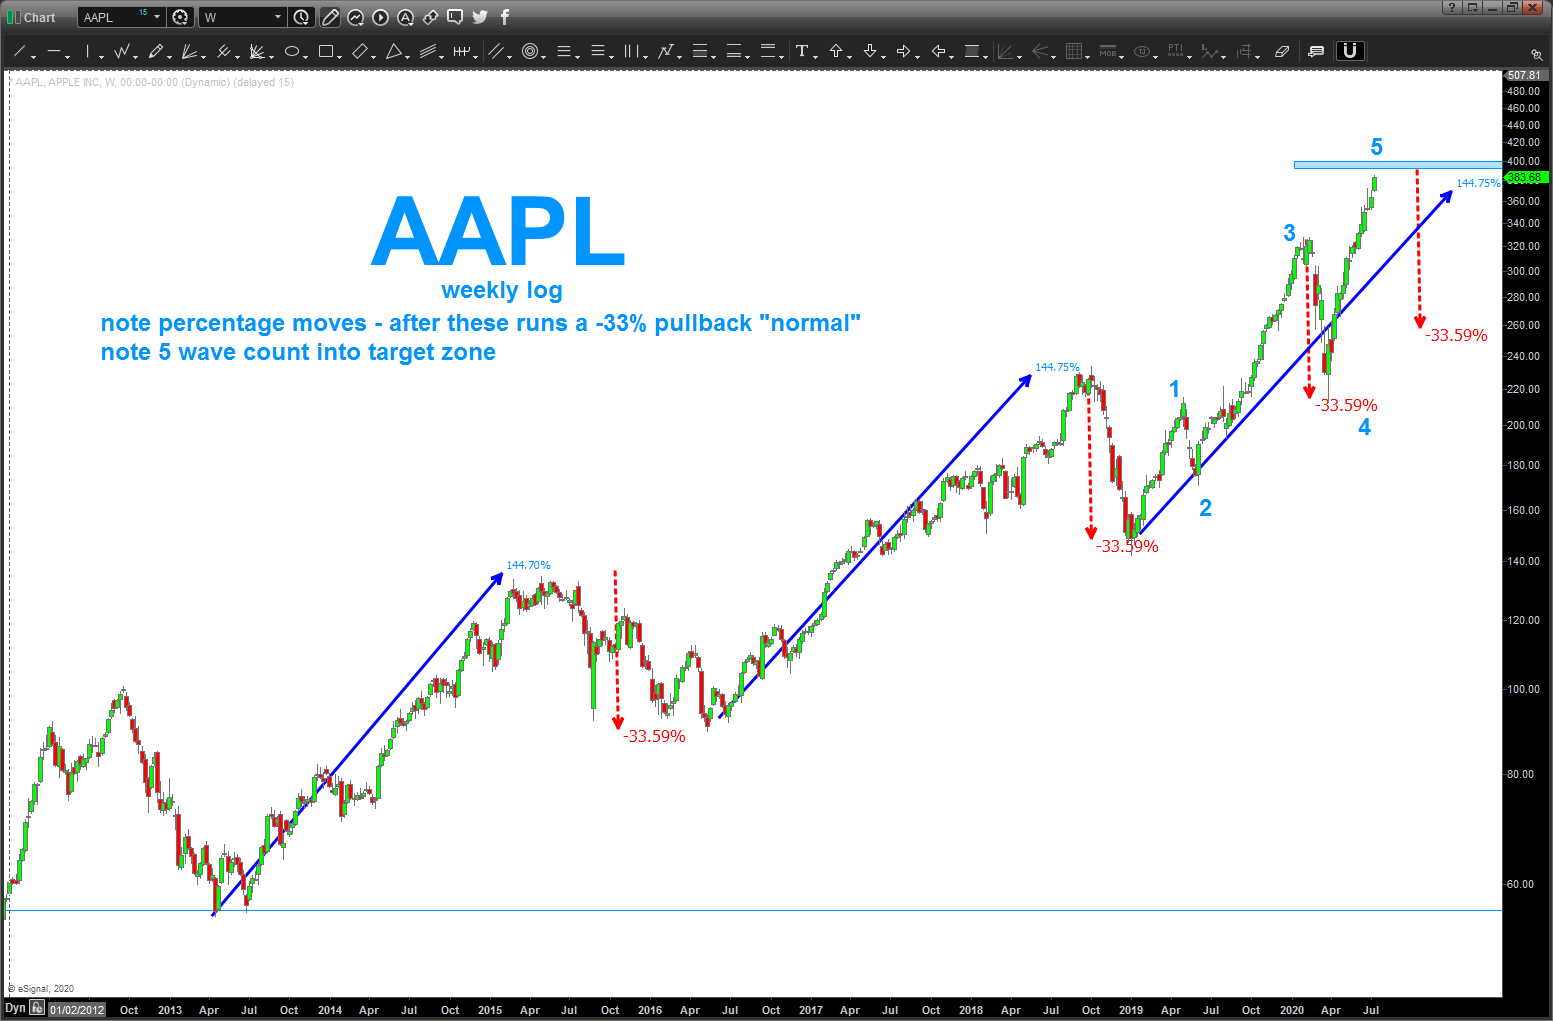
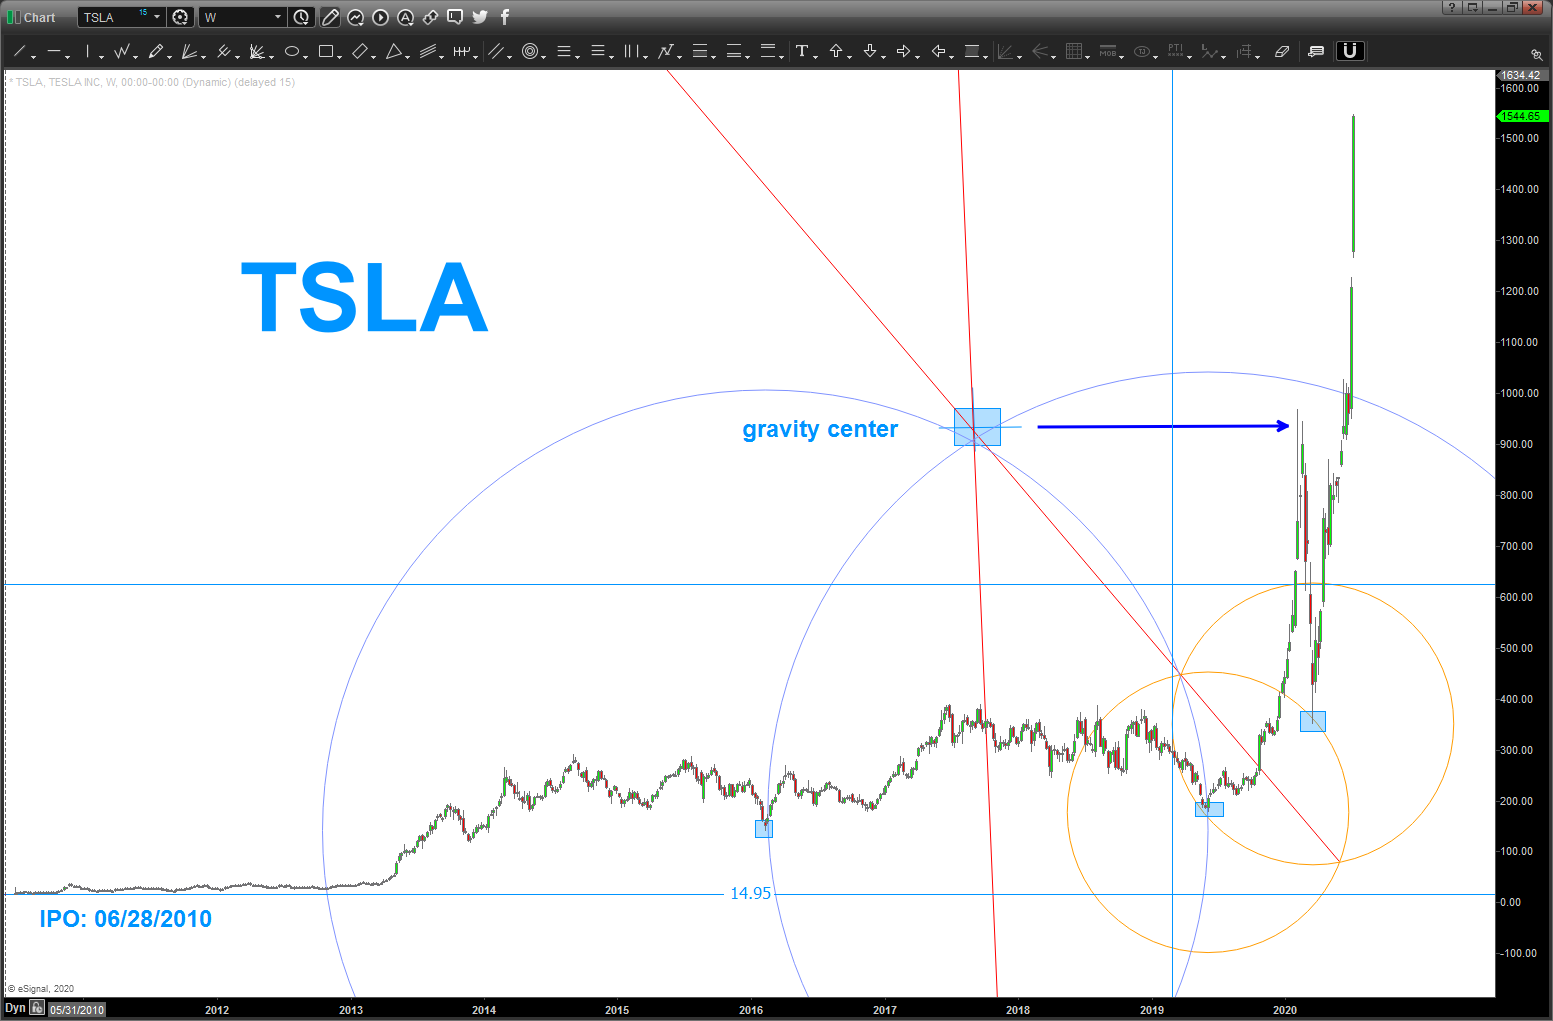
as I’ve shown in the past on the blog, these type of parabolic – in this case appears like a rocket they built launching into space – moves ALWAYS end in a big liquidation.
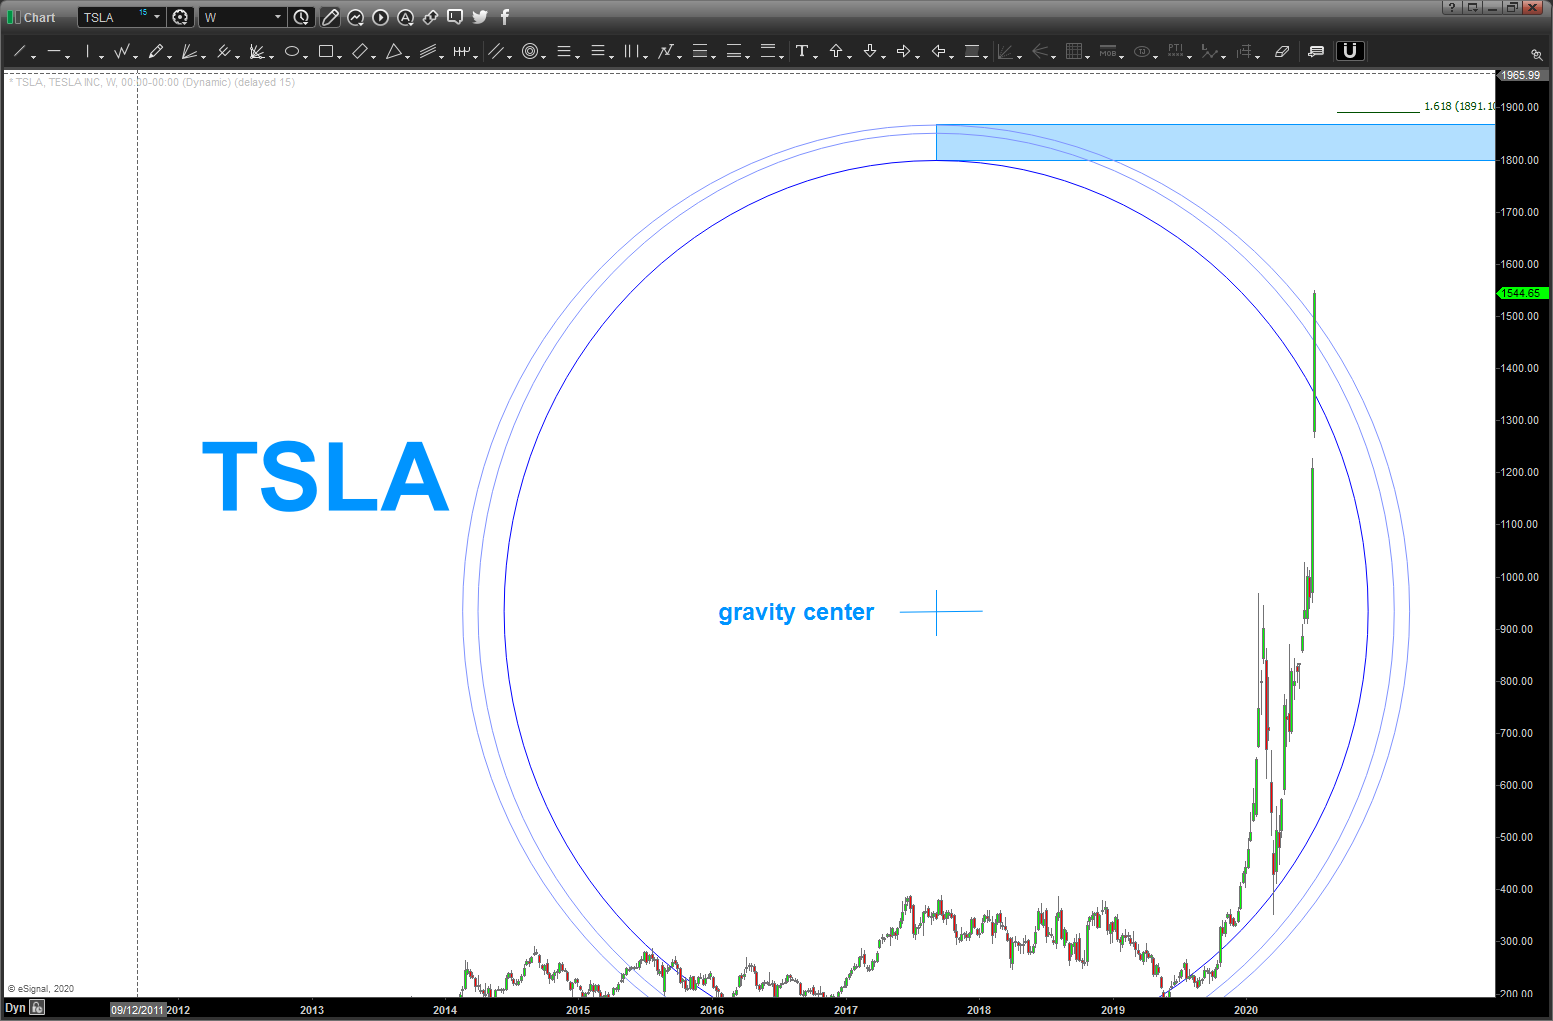
I’ve used what we learned in kindergarten on how to create a circle using 3 points and have the 1800’s a being pretty significant resistance for TSLA. that target zone is roughly 15% away. folks, let’s put THAT into perspective, on Friday the stock (in a single day) was up 12% so is 15% or so that unrealistic?
great to be long but … don’t get greedy, this puppy could flip bearish on a dime …let’s face it, this is unsustainable.
note, do believe we have a good “gravity center” as the point in time/space was the reason (from a pattern perspective) for the top shown by the bold blue arrow.
Technology – kaboom
Posted on July 6, 2020 Leave a Comment
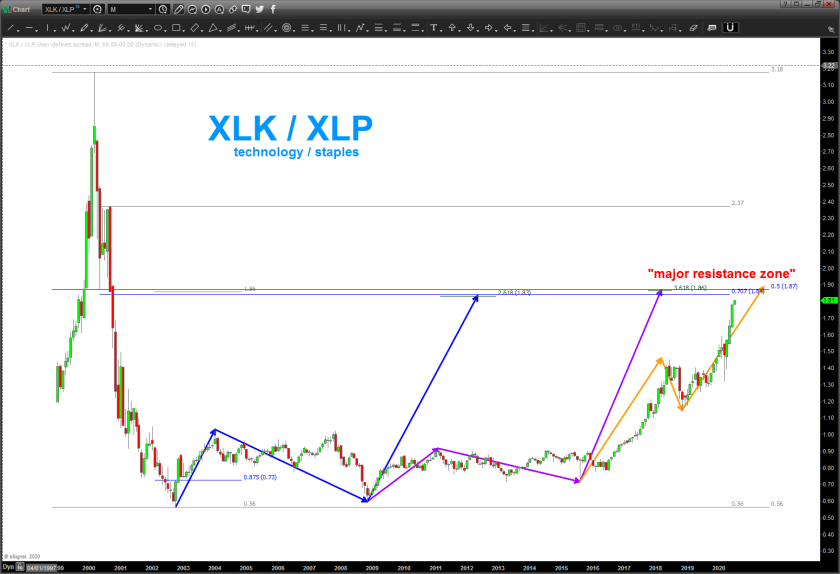
yes, technology and specifically the NASDAQ have been ROLLING. that being said, do see some resistance ahead and especially at the level indicated by the XLK / XLP ratio analysis. (technology/ staples) the level shown below has 6 mathematical derived levels all really really close to each other.
“should” provide resistance to this amazing run … that being said, appears like NOTHING can stop this run and this time it’s different and just buy buy buy as it’s all good …
OBTW, glad the REPO and sovereign debt crisis magically just went away …
one last, anyone else find it interesting that, w/ the NASDAQ soaring to new highs the ratio of the XLK/XLP is “barely” at the 50% level. if we had broad participation across the board wouldn’t this (the ratio) be making new highs?
Bart
the ratio has HUGE support
Posted on June 8, 2020 Leave a Comment

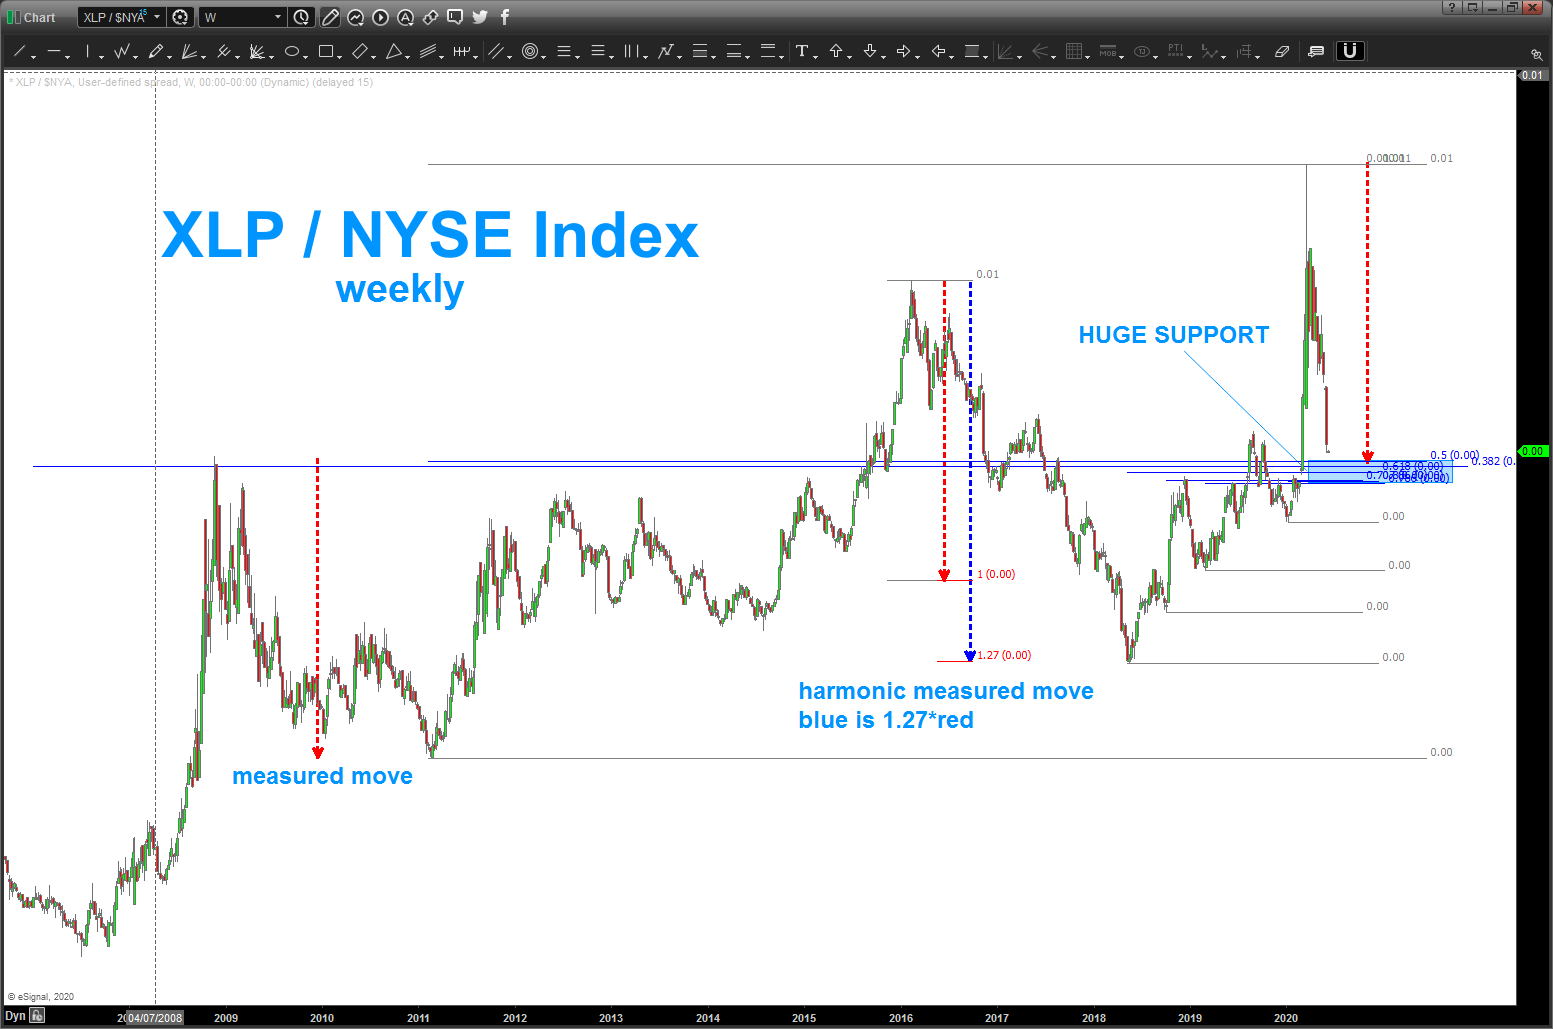
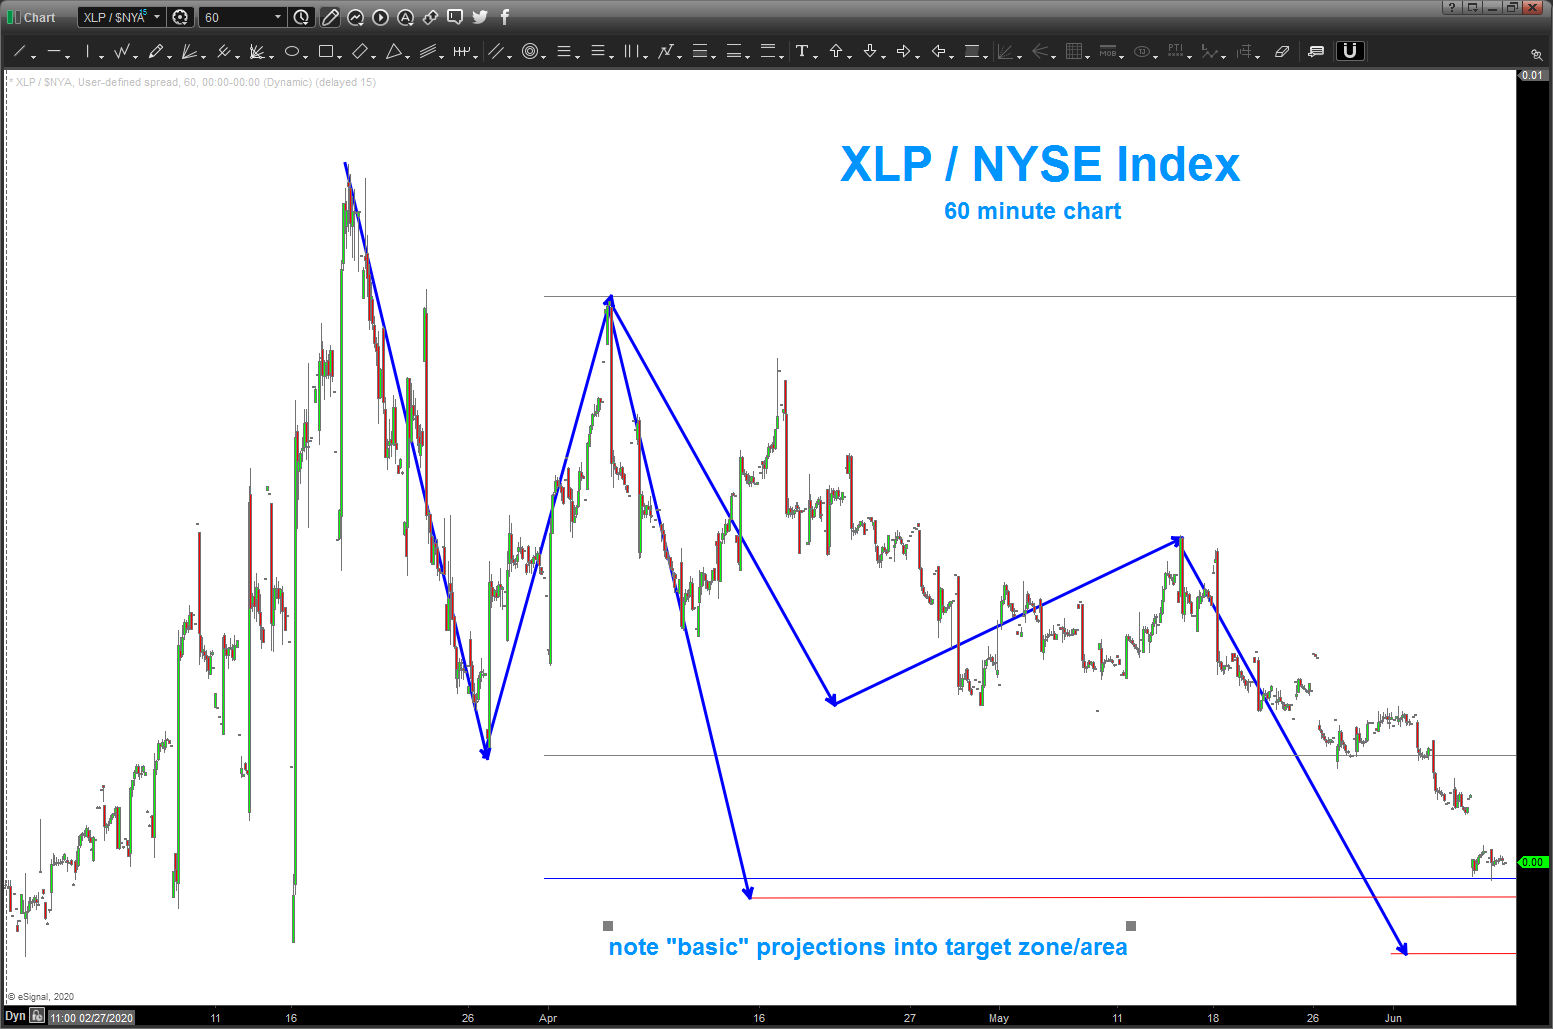
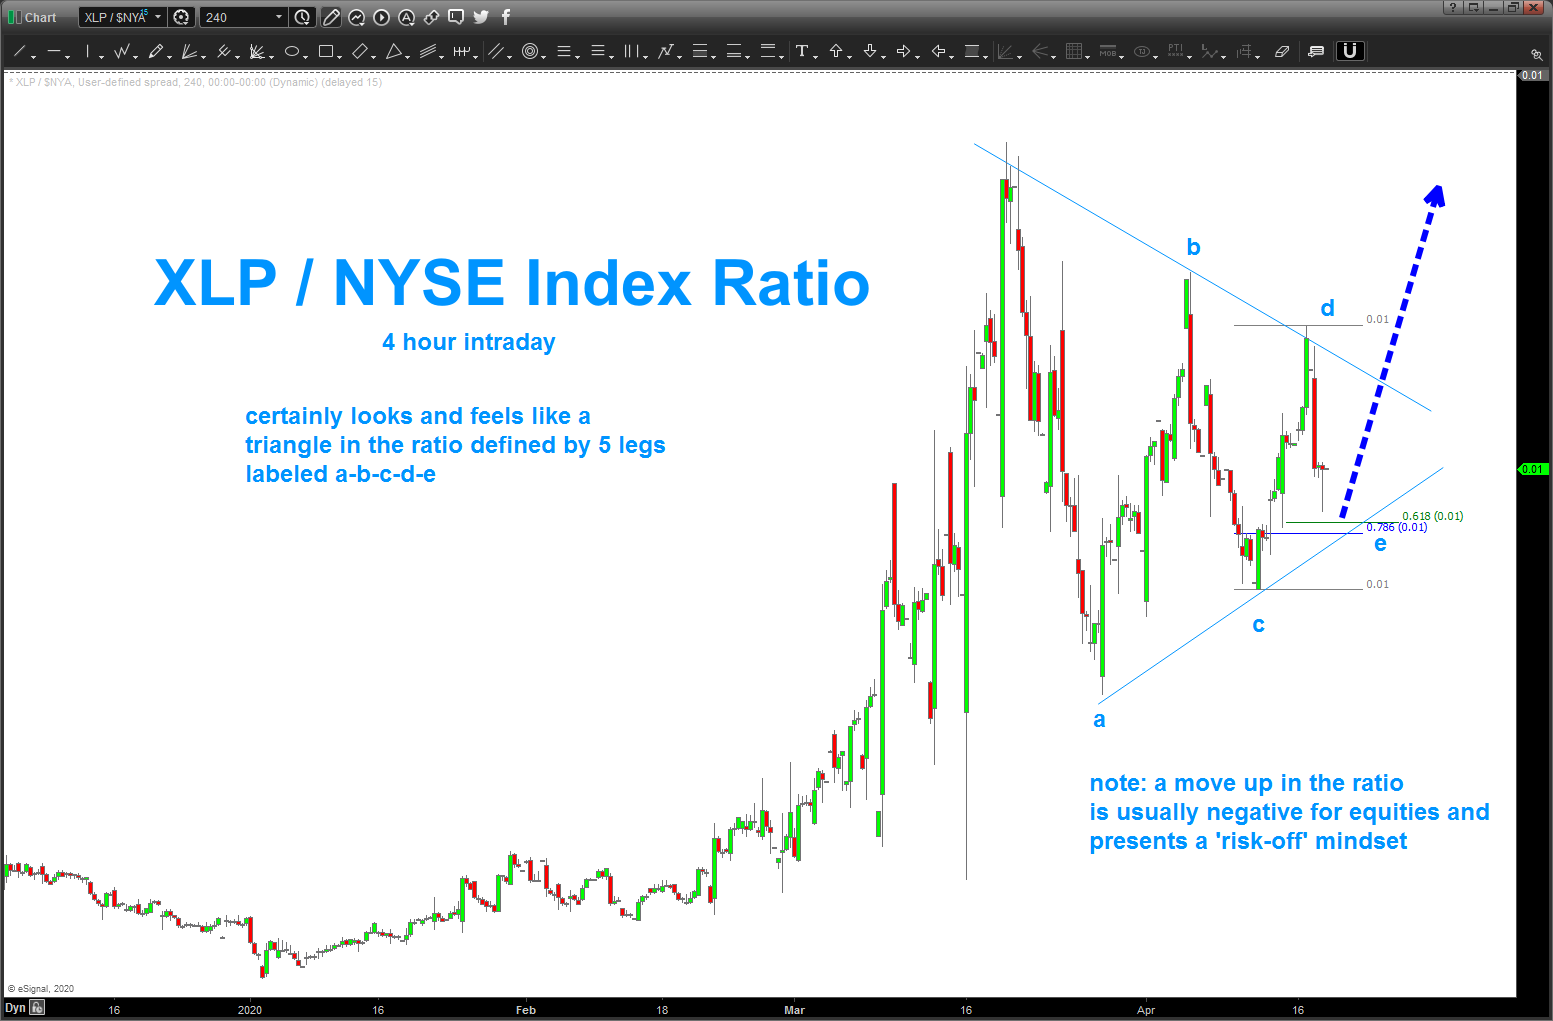
can’t believe it’s been since mid-april since I posted about the market. at the time, I spied a triangle forming which proved to be wrong and it broke down and the market has continued it’s advance. humbling for sure .. when I was working up the triangle thesis I came up w/ the level that’s shown below but, honestly, I shrugged it off. “it’s not going to go all the way down there, I thought .. ” but I do remember saying, “if it could get down there, then what a perfect spot to short the market.”
folks, we are there … don’t hold me to it BUT I have around 12 reasons that this is HUGE support for the XLP/NYA ratio. don’t need to go back over the importance of this ratio … for a summary when ratio goes up risk is off and when ratio goes down risk is on. UP = bad equities. DOWN = good equities. so support should mean bad equities.
put/call ratio at an extreme, sentiment at an extreme and MONSTER support on the XLP/NYA ratio. probability says support holds and equities top and start back down … all for now. let me know if you have any questions.
disclaimer: this is ALL probability but we now have a very well defined street sign. the market COULD blow right thru the level below and it’s a rocket ship takeoff higher … that is also a probability.
so, play it safe … if it bounces strongly in / around this area then short BUT if it closes on, say a weekly basis, below the defined target area w/ conviction then be long. but for NOW, would wait and see which way she goes. hope this helps.
be safe out there …. Bart
Advanced Micro Devices
Posted on April 25, 2020 Leave a Comment

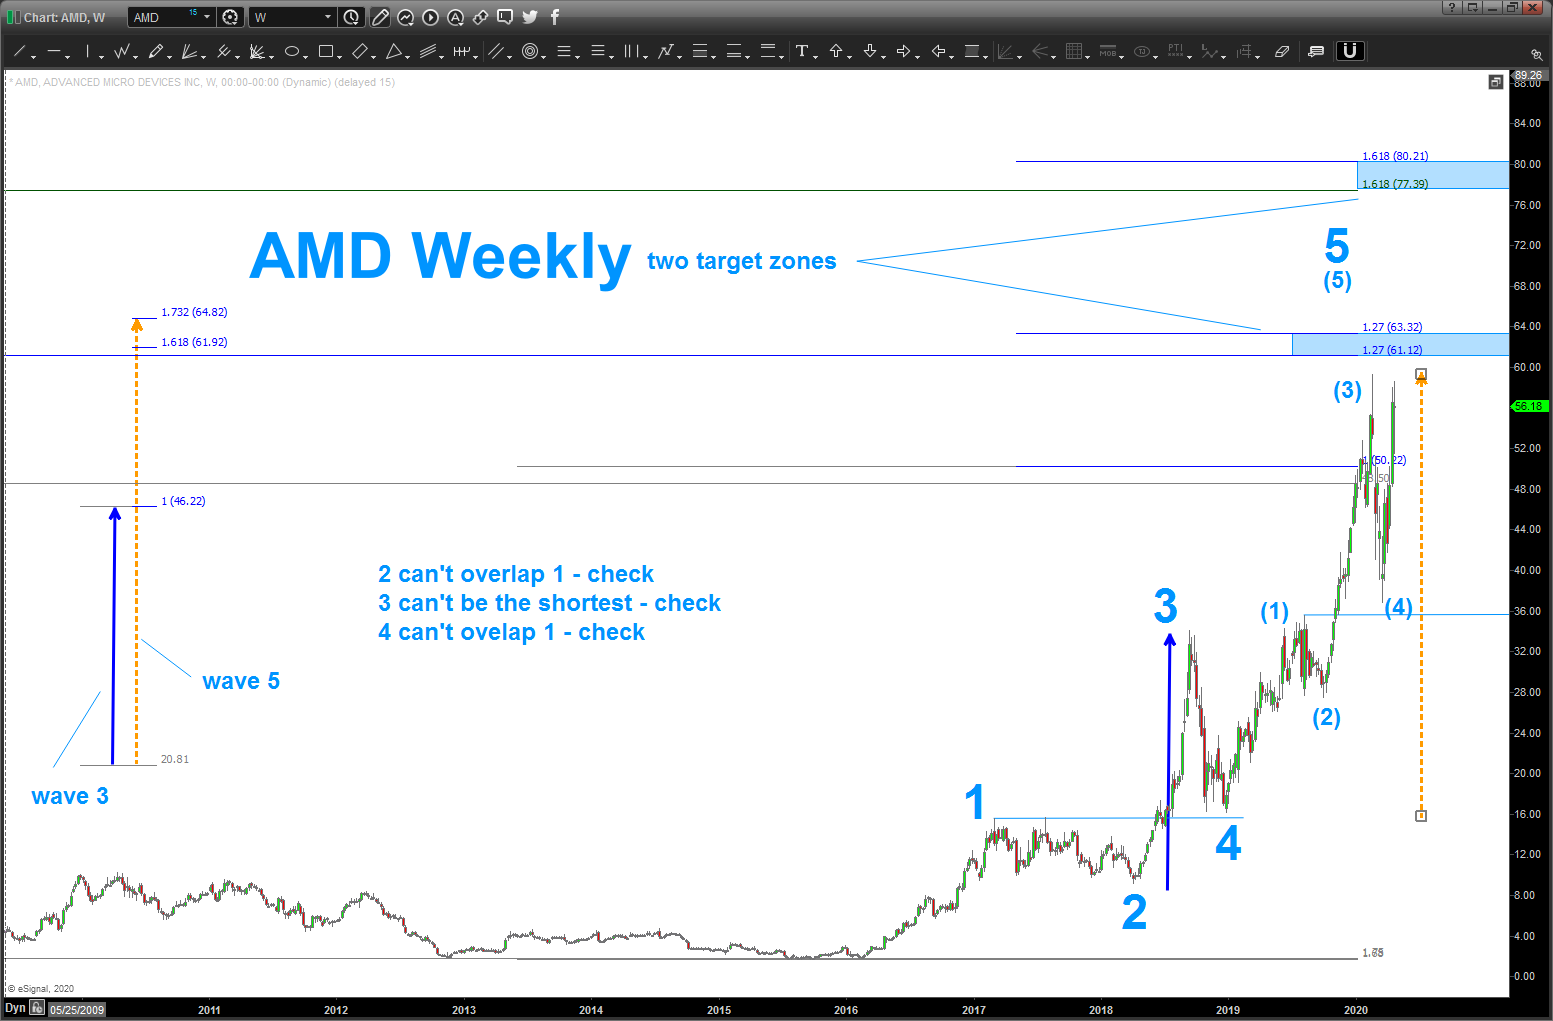
AMD has been on a TEAR since 2015.
from a wave perspective believe we have a little higher to go for a target of 60-64 and if that is taken out then 77-80. the math of the current high (59.35) is working out so this could be it also … from a wave perspective the current high is 1.618 and exactly 1.732 of wave 3 … I’m labeling this current move as the final waves of 5. a move higher into the shown target zone should do it for now …

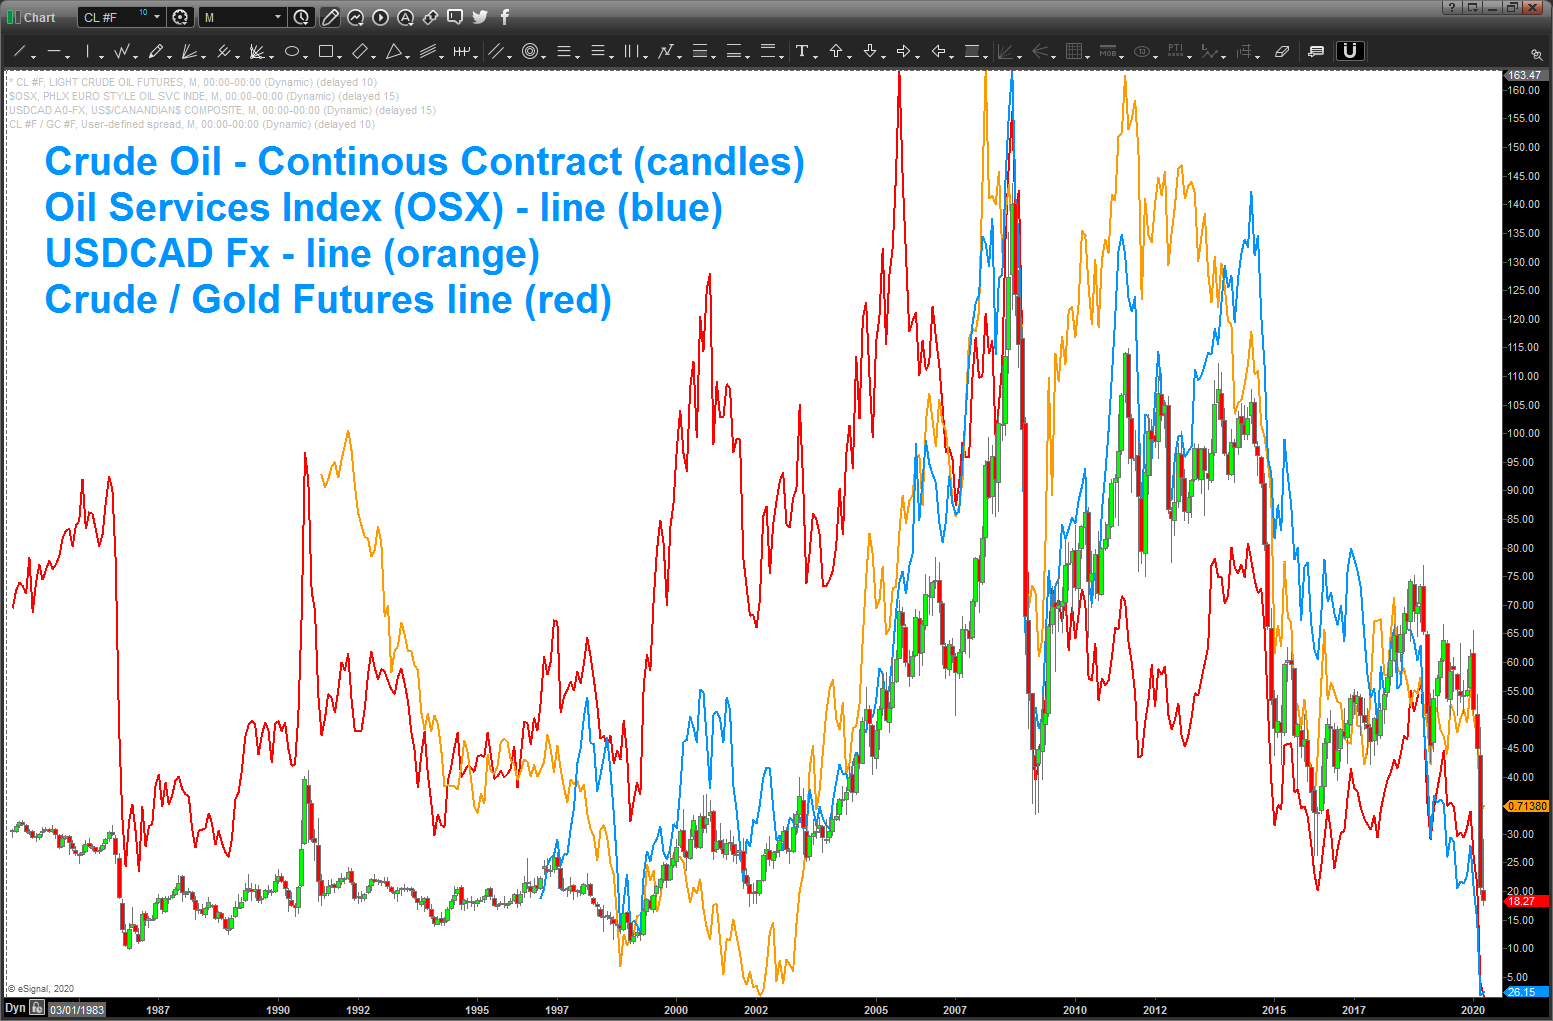
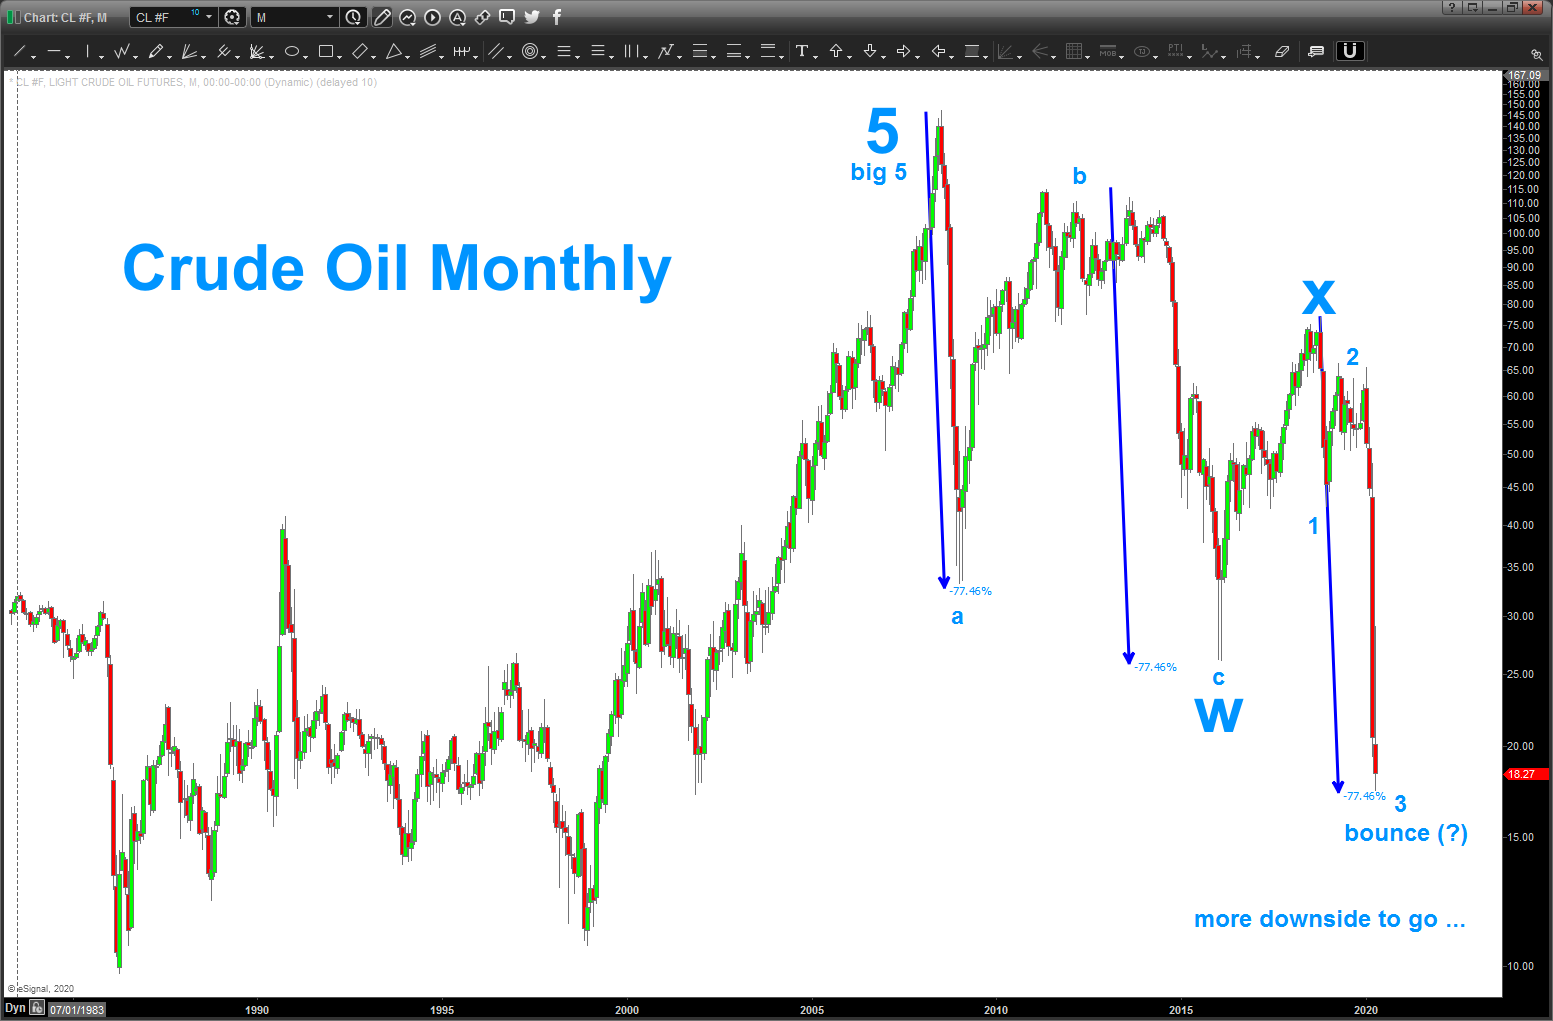
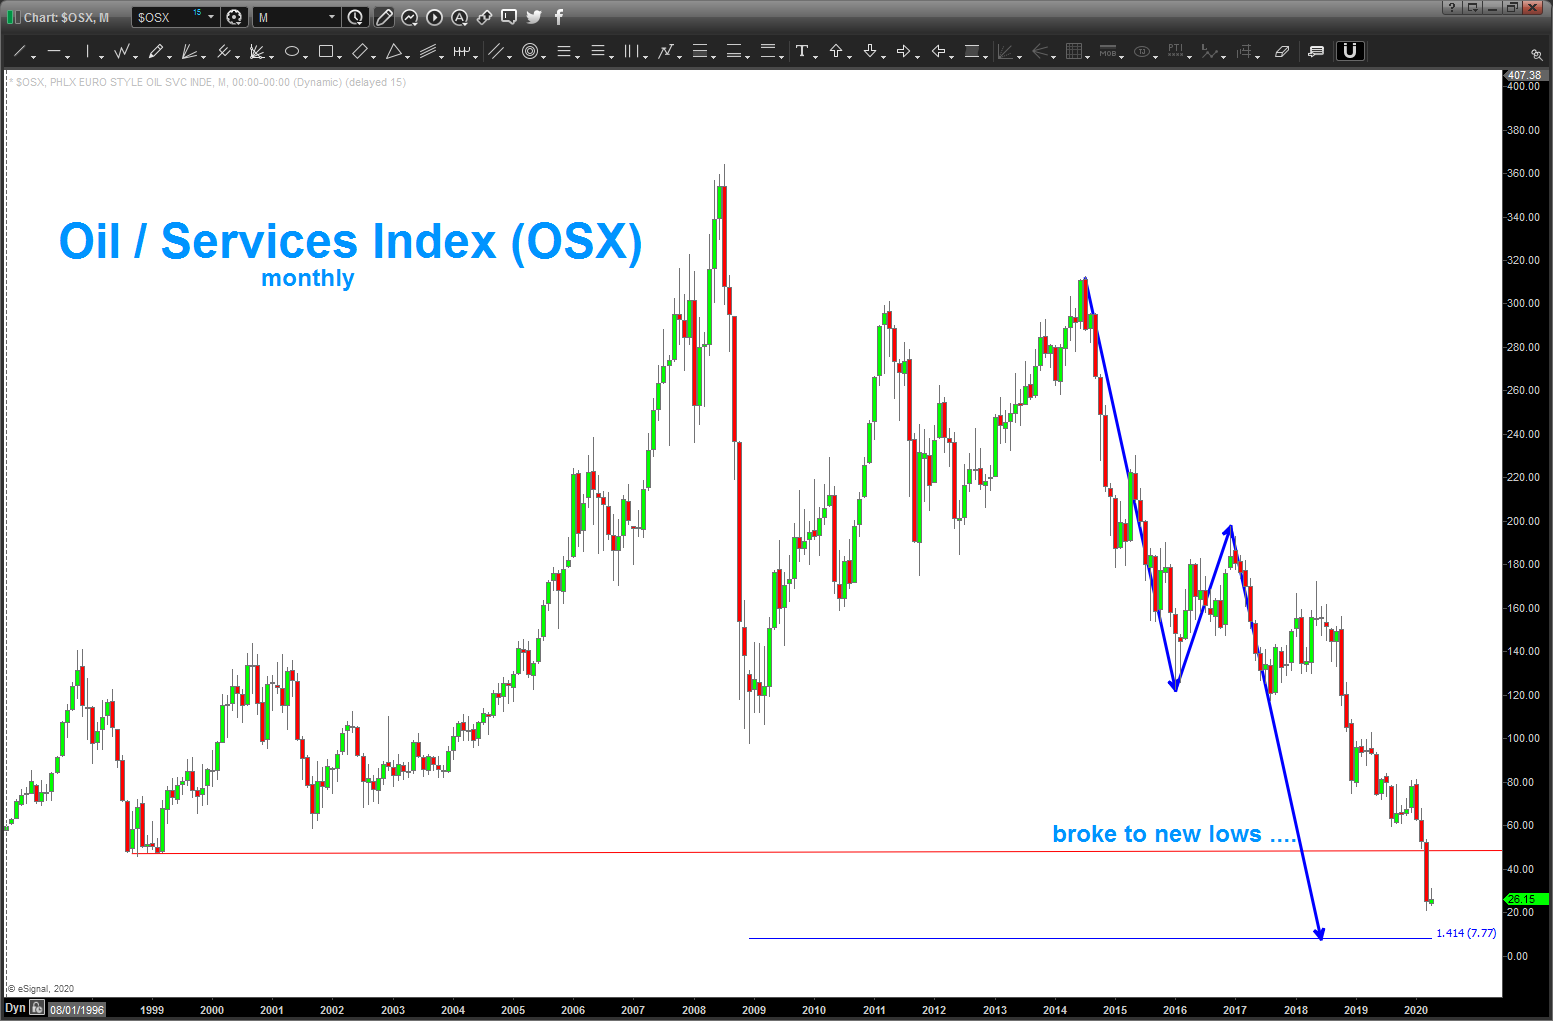
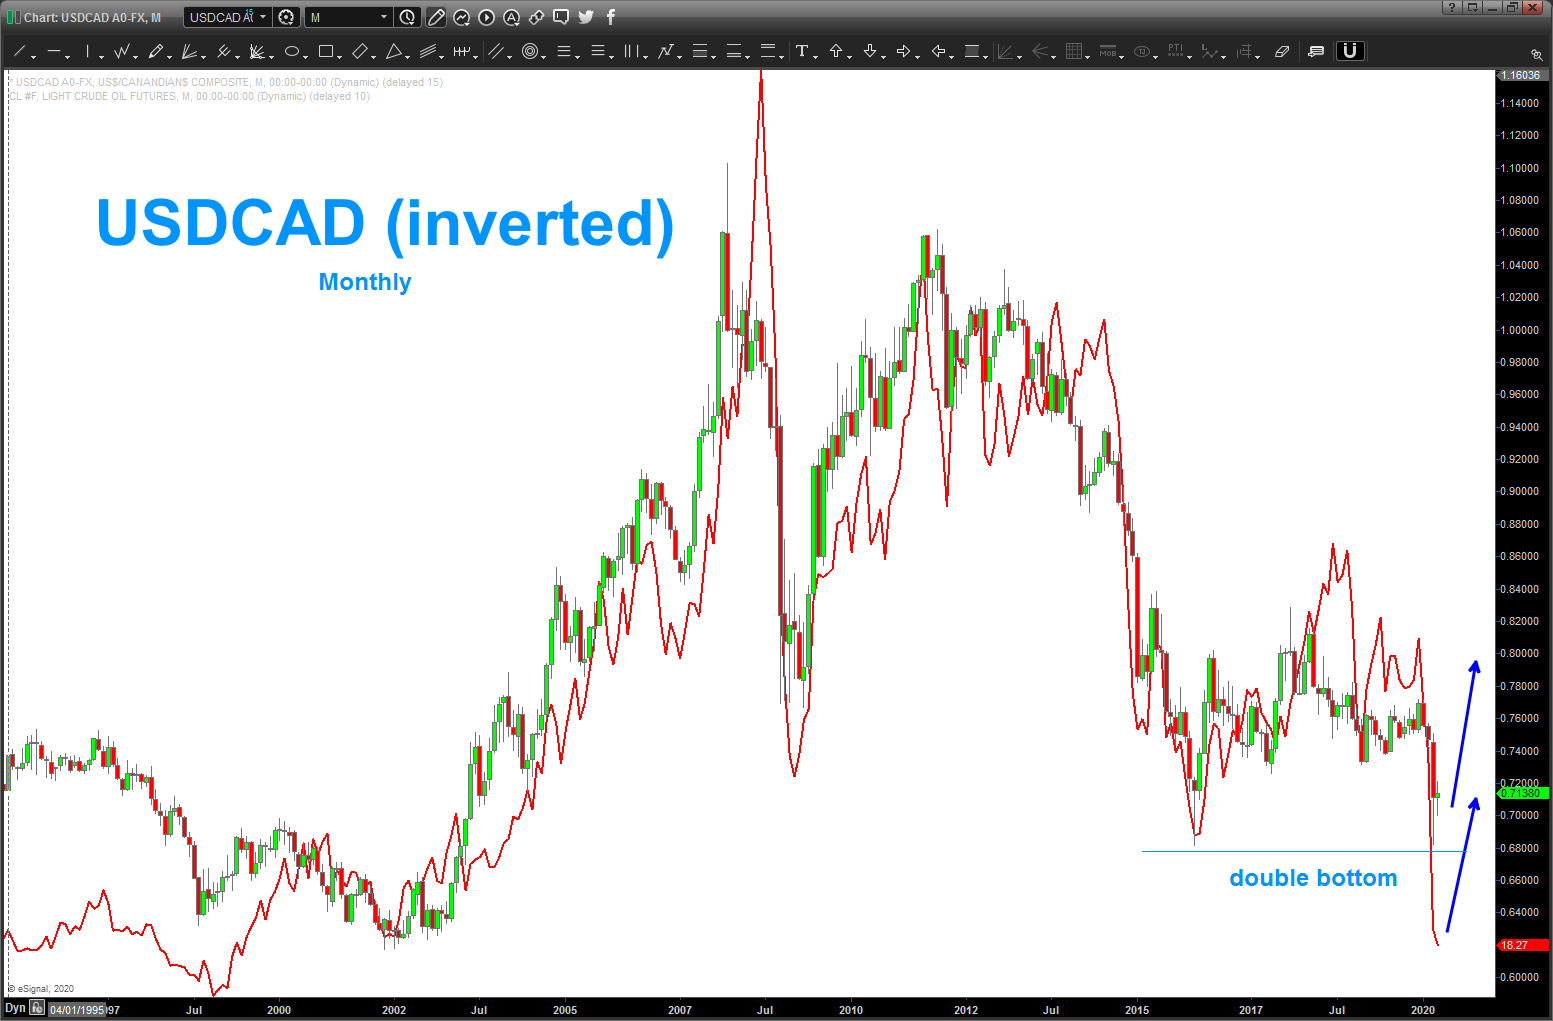
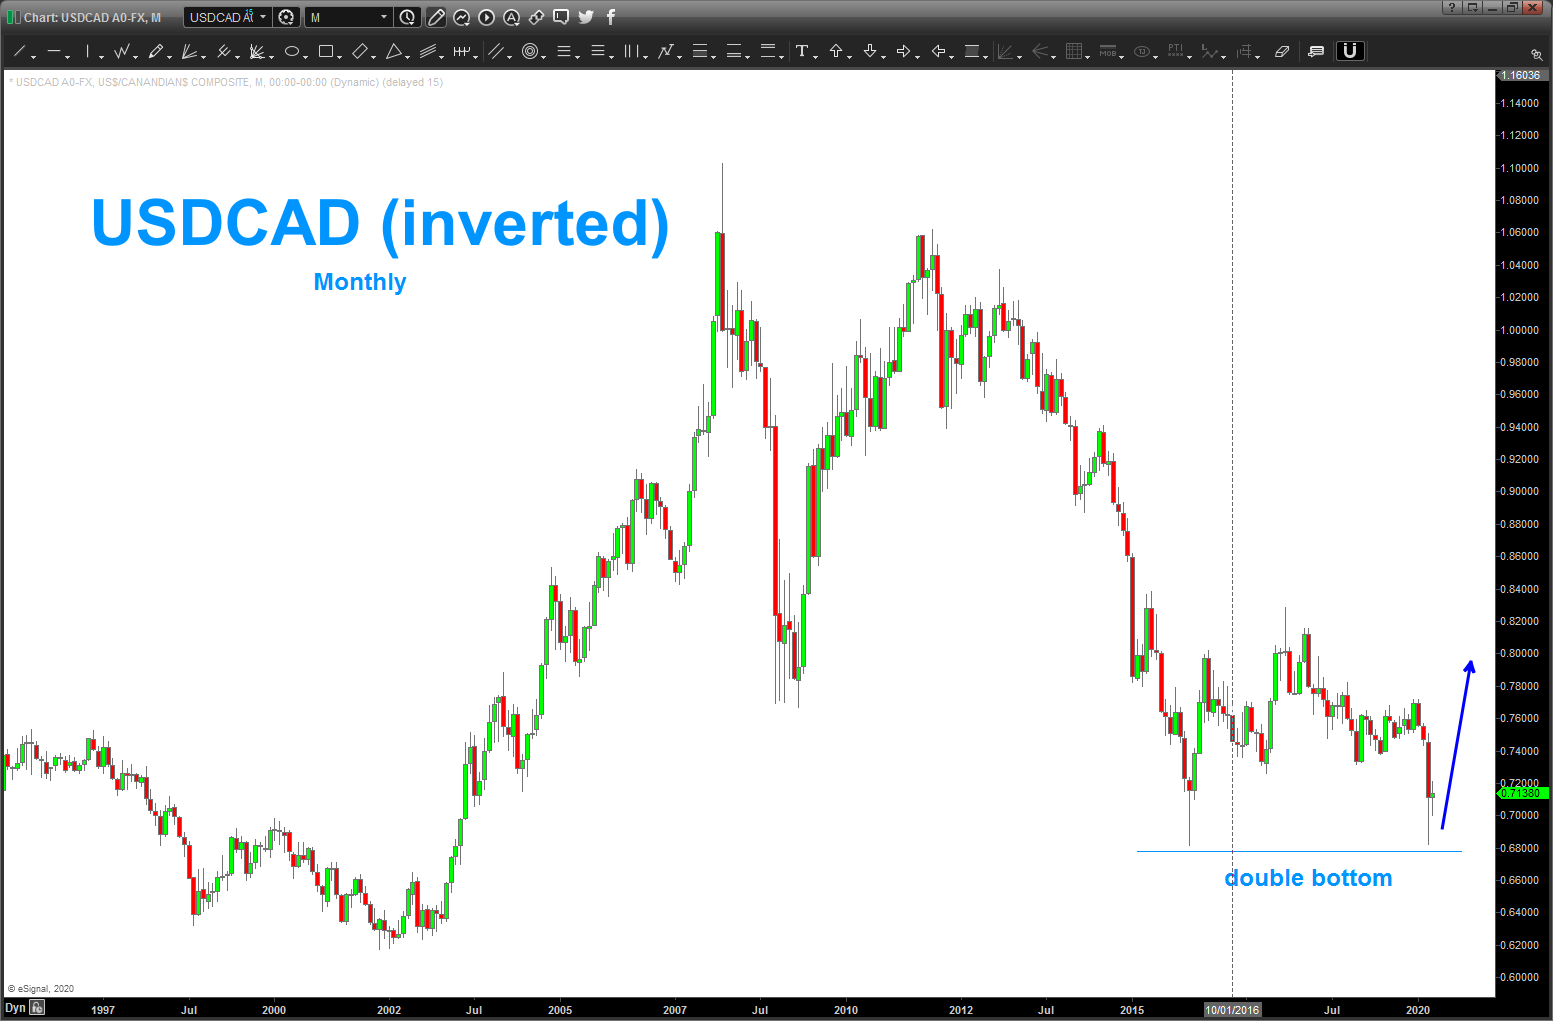
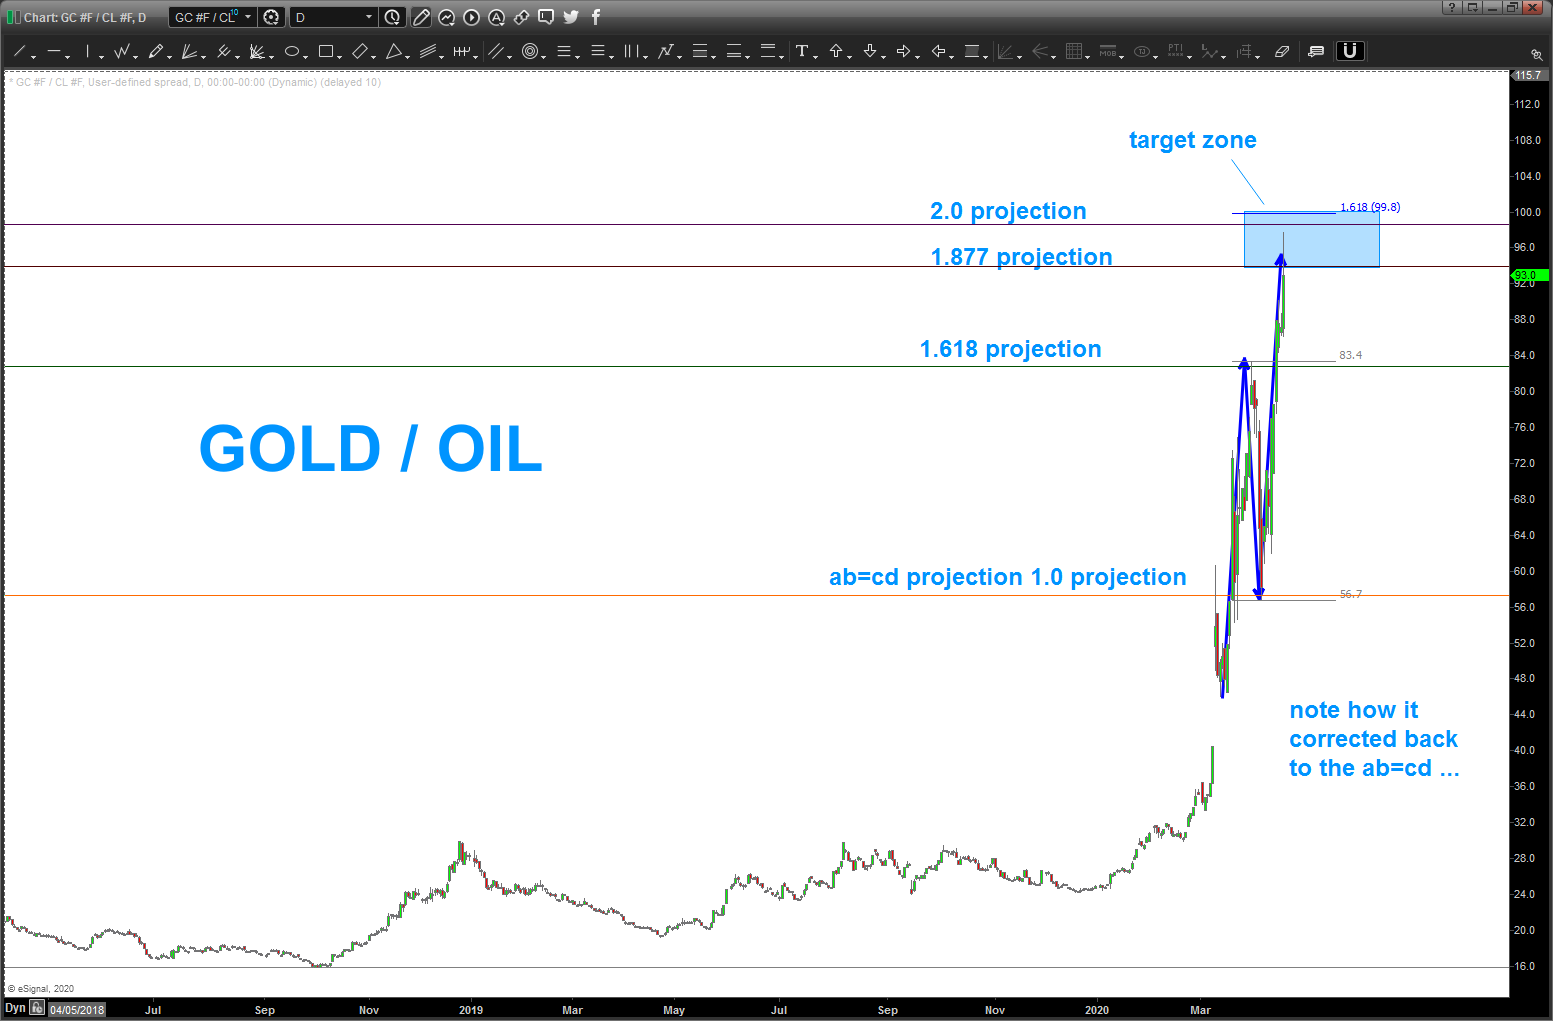
the Crude Oil Complex
Posted on April 18, 2020 Leave a Comment

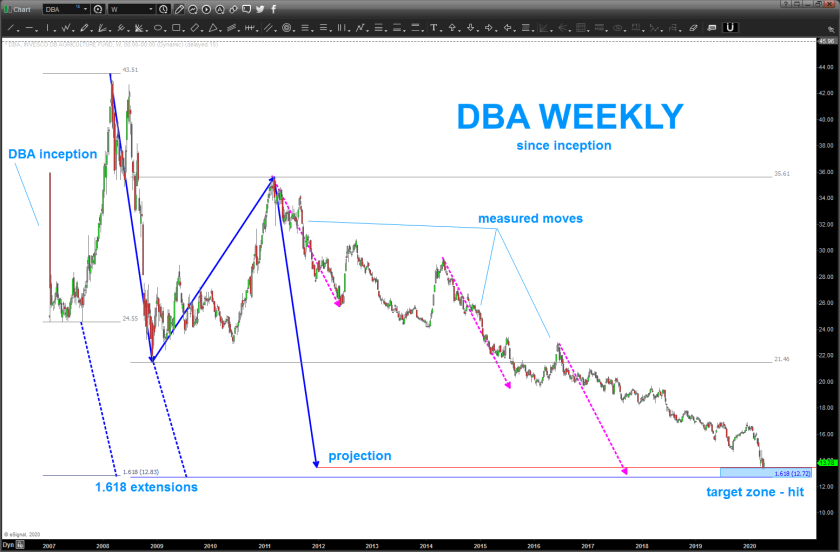
DBA – a target finally hit …
Posted on April 11, 2020 Leave a Comment
the first target zone we have been watching for a LONG time was hit on the DBA ETF last week. note, we also have other targets in the 12.70′ ish area but, as far as long term targets being hit – DBA has hit them. a low risk BUY in today’s climate.
note, when looking at the composition of the DBA ETF, discovered that the largest holding at 14% is CLTL or an inverse bond fund. Interesting … other than that we have the typical coffee, soybean, corn, sugar, cocoa, wheat, cattle and hogs … not that much volume but if your not a futures player then this is an opportunity to get a broad basket of commodities in your portfolio.