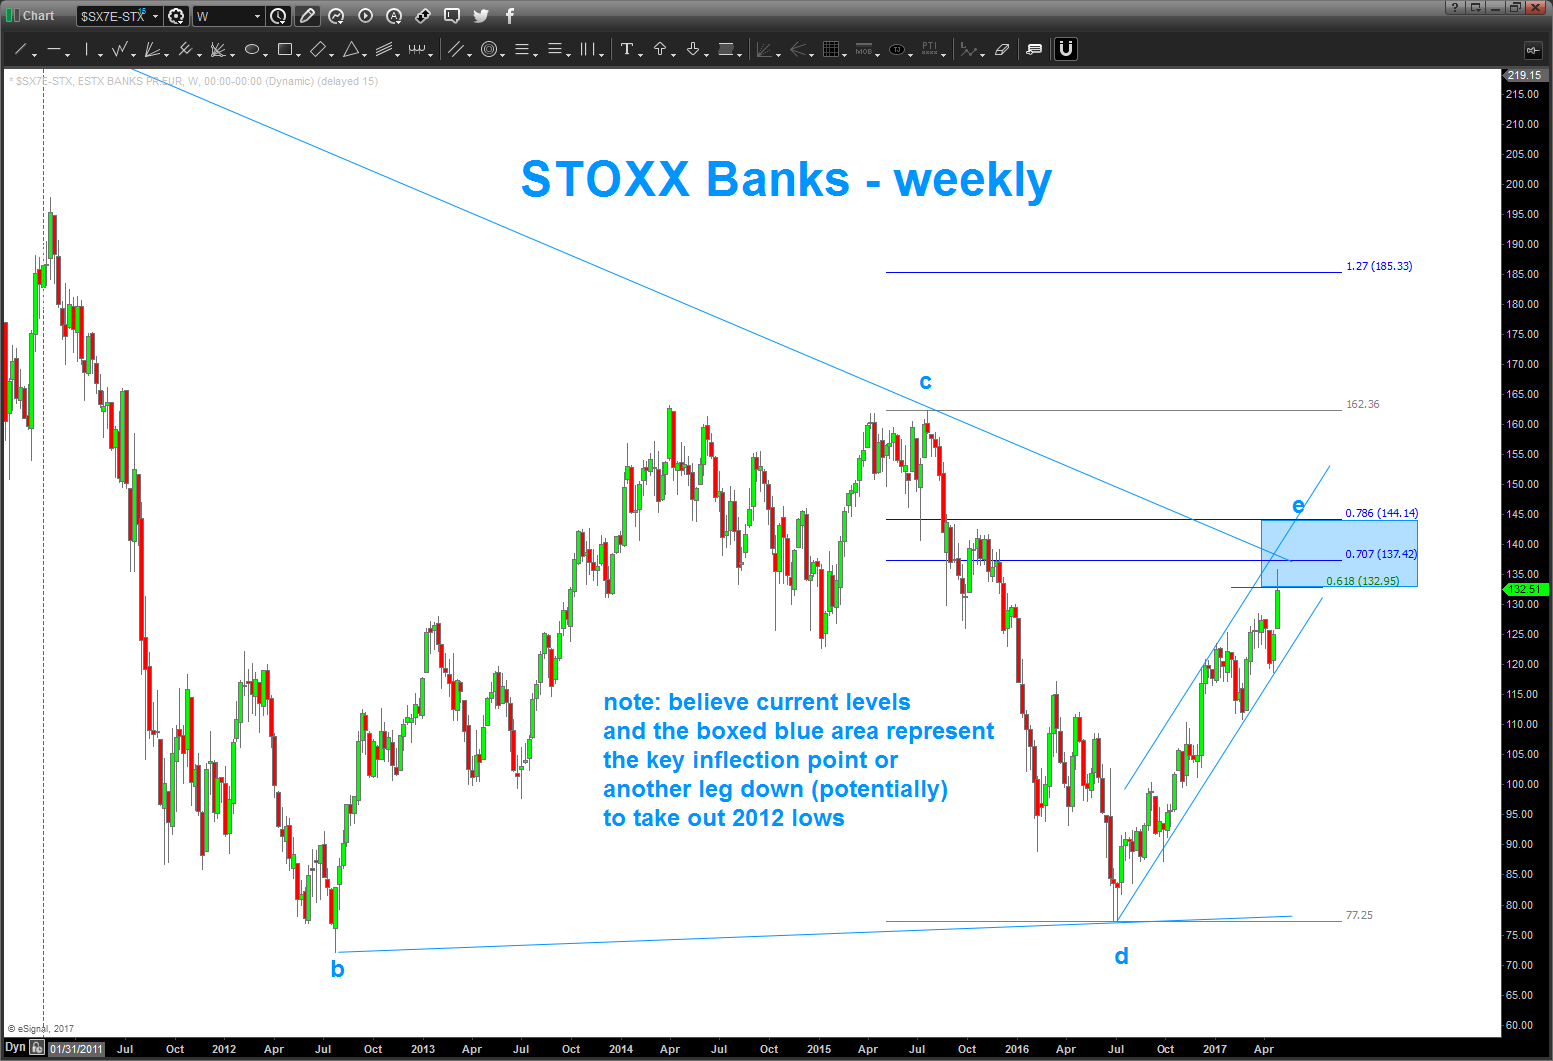
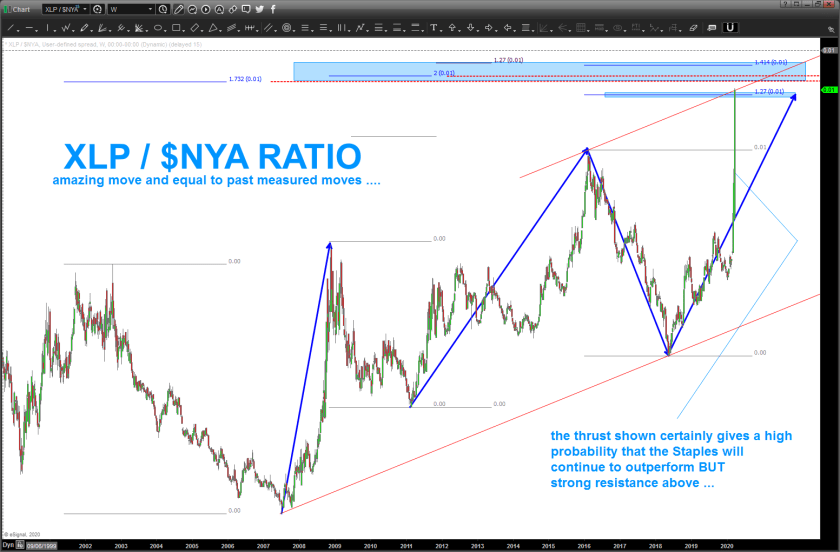
XLP/NYA ratio …
Posted on March 23, 2020 Leave a Comment
we have a pretty big ‘wick’ up at the all time high on the ratio and closed w/ a doji today at the level that’s basically equal to the close on Friday. Basically, even though we were down 500+ the ‘fear’ subsided w/regards to the Staples/NYA ratio. this lack of follow thru is telling .. is the low in place, yet. I HAVE NO IDEA but I do trust this ratio .. until we CLOSE ABOVE the blue rectangle area on a WEEKLY basis I’ll move to a neutral stance in the equity market for now … trading bounce (not necessarily a long term investment buy) appears to be working into the vernacular …
HYG – BUY pattern approaching / here UPDATE 04/10/20
Posted on March 21, 2020 Leave a Comment

04/10/2020 – trust everyone has a blessed and peaceful weekend. also, please keep staying safe. check in if you have the chance …
couple weeks ago, we showed VERY important support on the HYG and detailed how we can find a pattern by simply Projecting, Extending and Retracing. Where the ratio’s all come together then, well, support or resistance SHOULD (operative word) appear. as I have discussed on this blog, a bunch, it’s all PROBABILITY. No idea which will work or which won’t …in this case support held, the BYG liquidation stopped and the market rallied! GREAT … where are we now.
if you want to go down the worm hole which is Elliott Wave then first pay attention to the corrections! Learn em’ and then try to count subwaves for the rest of your life. I have found the EWT to be very helpful in CORRECTIVE PATTERN ID’ing. The most common? A three wave move that is against the overall trend.
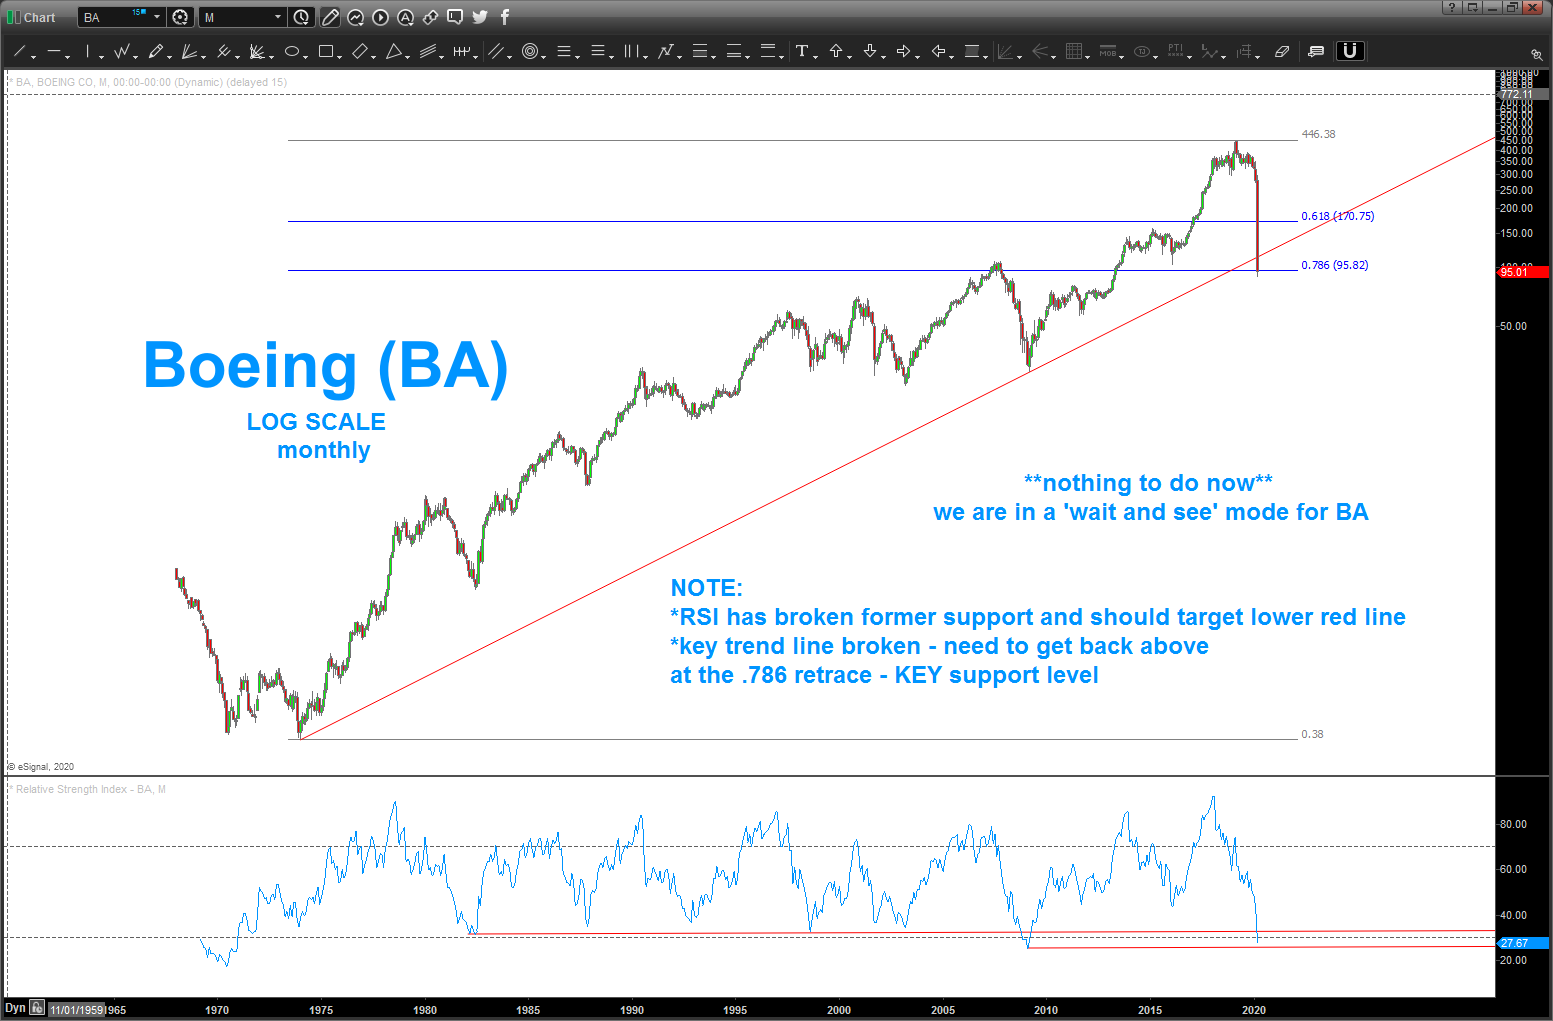
we finished a 3 wave SELL PATTERN on Thursday and, if this level holds then expect the stocks to sell off again. note on the chart below … that’s a MONSTER BULLISH gap … pay attention to this ETF!
note the blue arrow projection – it’s equal in BOTH PRICE AND TIME. the market hit the 84.04 level and now, if the pattern works, it should start back down. a gap down below the gap (bearish island reversal) or a big move back thru it is not a good sign.
HYG is getting thumped. as people who are just starting to read my blog or are long time followers you recognize that, for me, it’s all about patterns. period.
don’t try to use any fundamentals (don’t understand them and not smart enough to …) and just try to find patterns. I love patterns … why? because, they give you a really good set of benchmarks or maps of where you are … when they work, you know where you are and, conversely, when they don’t you also know where you are …HYG is so important to the global financial structure.
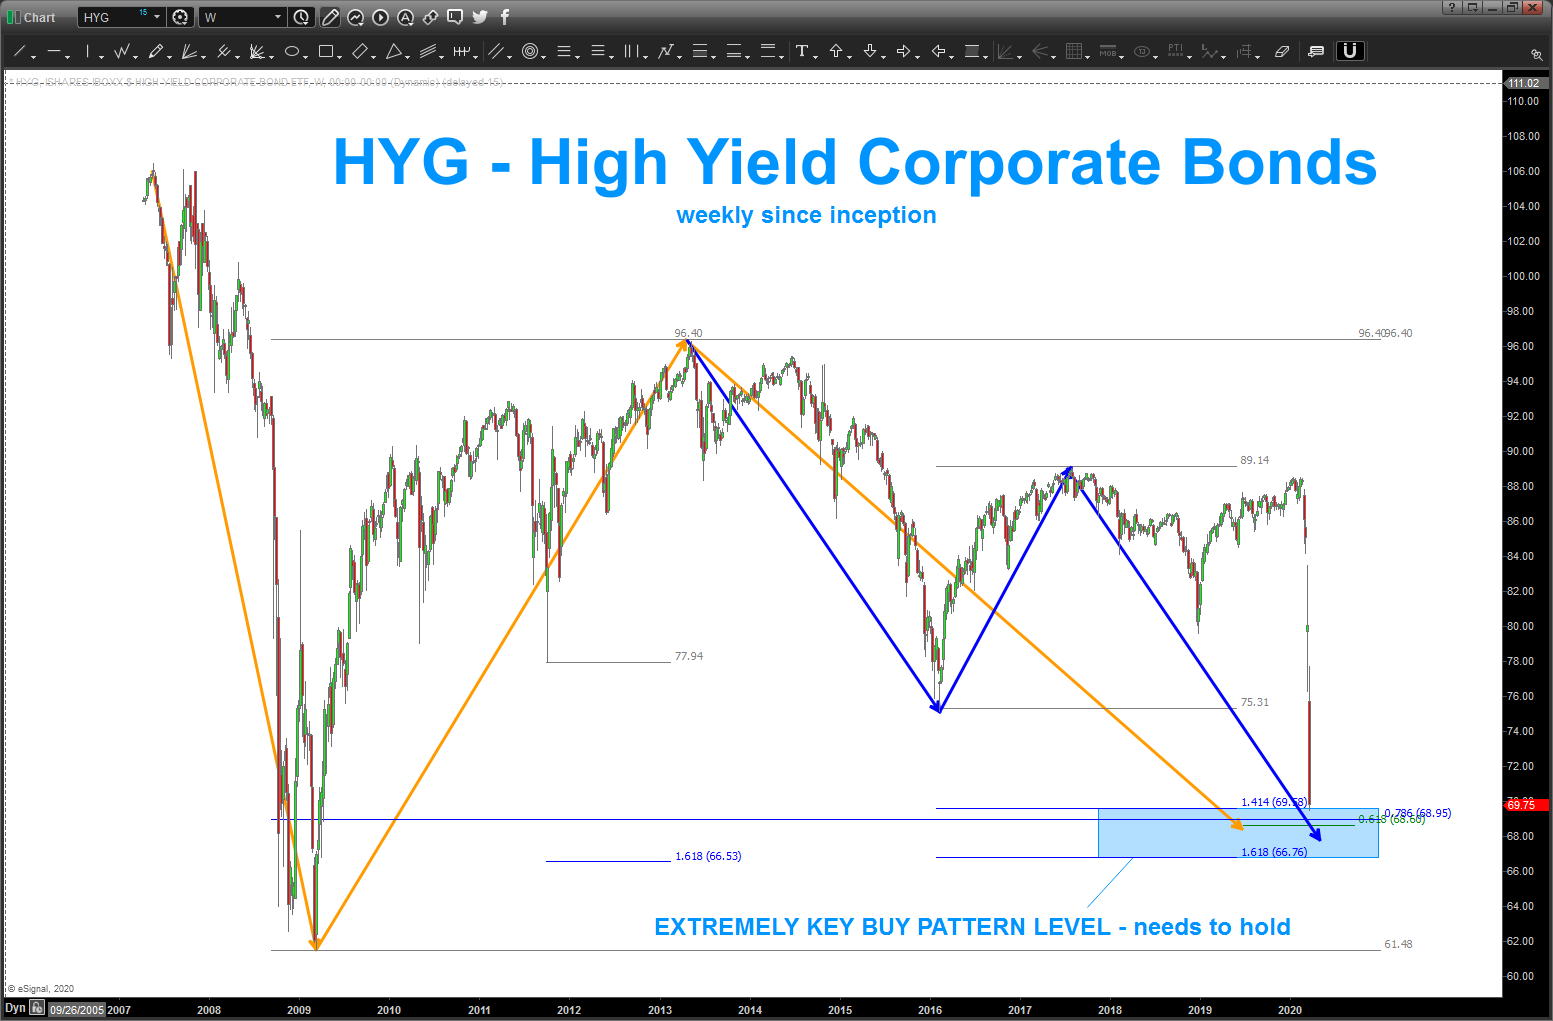
i’m up early doing some blogging on the west coast and nothing is going on so I’ll say the 66-69 level is a KEY support level / BUY pattern on HYG. It needs to hold at these levels or things are going to get ugly. (like they aren’t already) buy how did we get 66-69?
P – E – R – PROJECT, EXTEND, RETRACE there are other methods to hone in on this level – square of 9, cycles work, etc. But doing a quick PER gives us a nice level and it’s early this AM so I’ll just leave it at her for now …folks, in the world of patterns it doesn’t get much better than this .. we have 6 ratio’s all coming together in the area highlighted below. trust me that equals a big deal. losing this level and something is definitely a foot at the circle K. that sure is a TON of thrust coming into this level … it does warn of a potential failure of this pattern
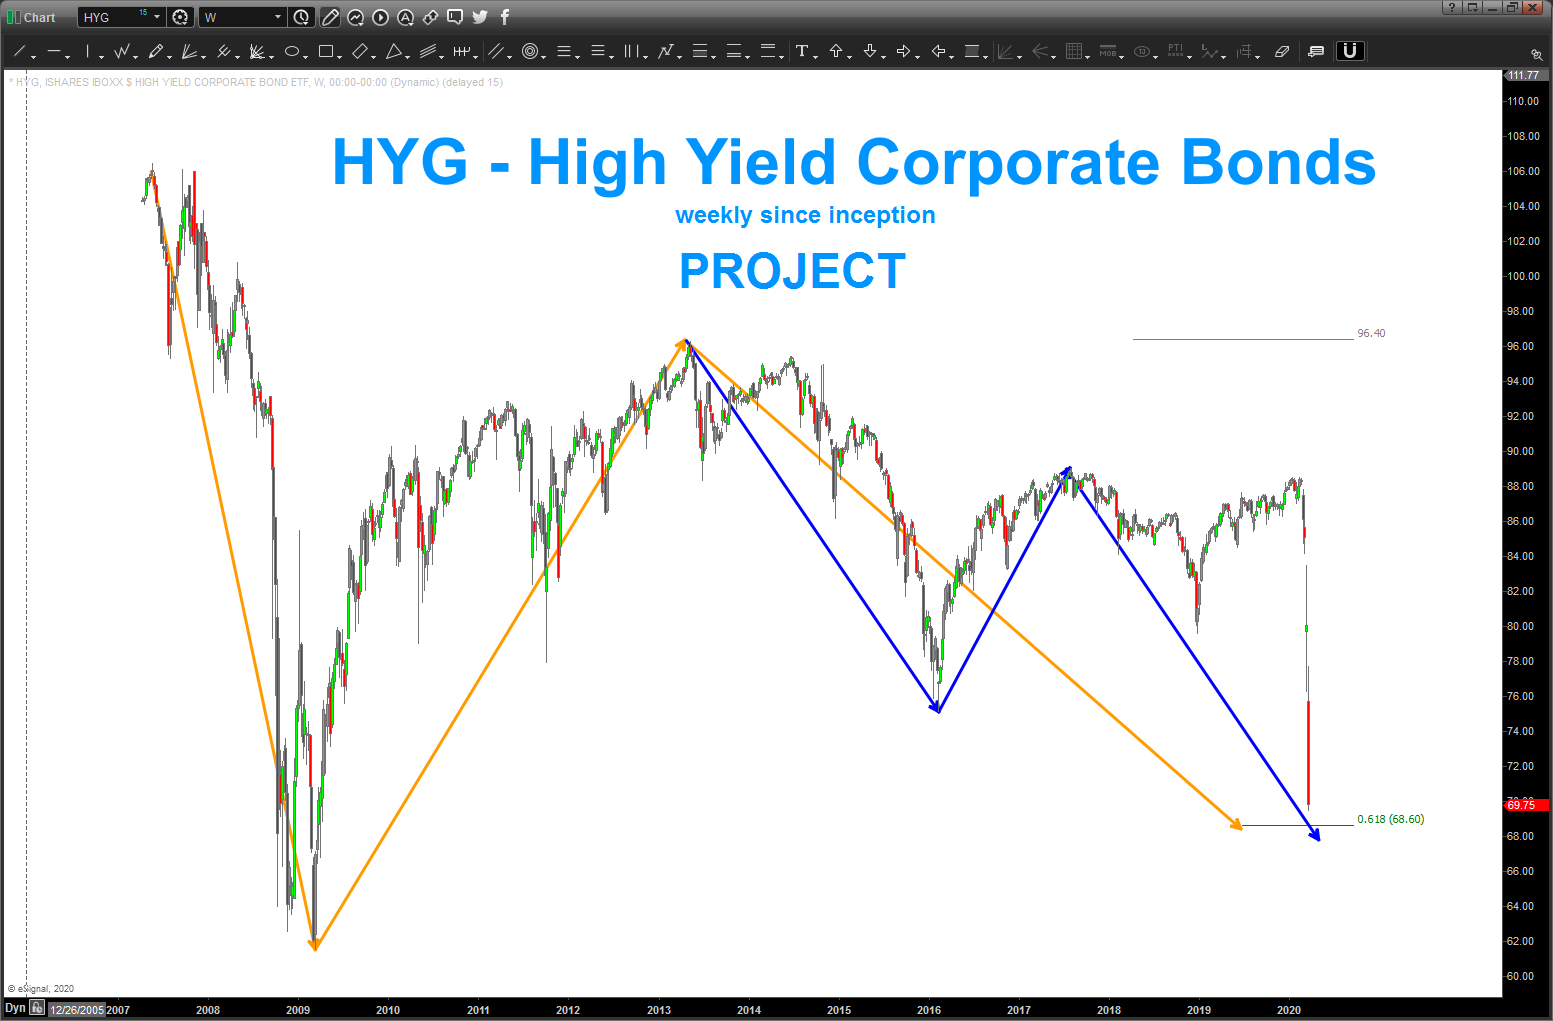
PROJECT
Orange: .618 ab=cd and Blue: ab=cd
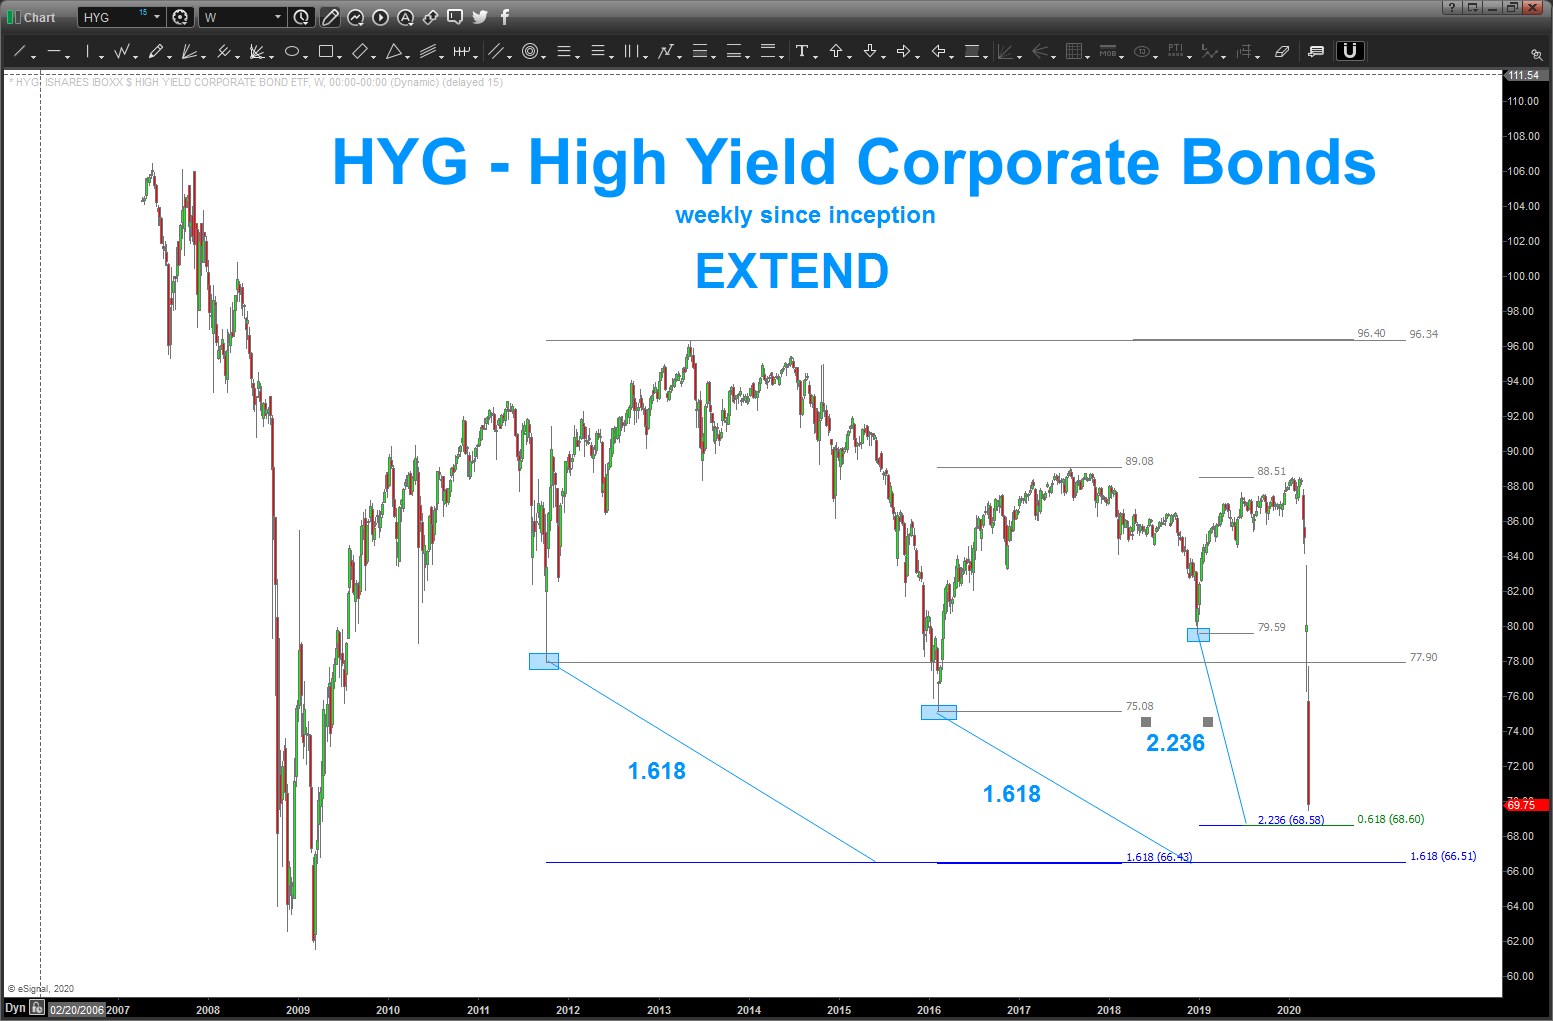
EXTEND: took three key lows (rectangles) and extended fro those points … 2.236 is square root of 5
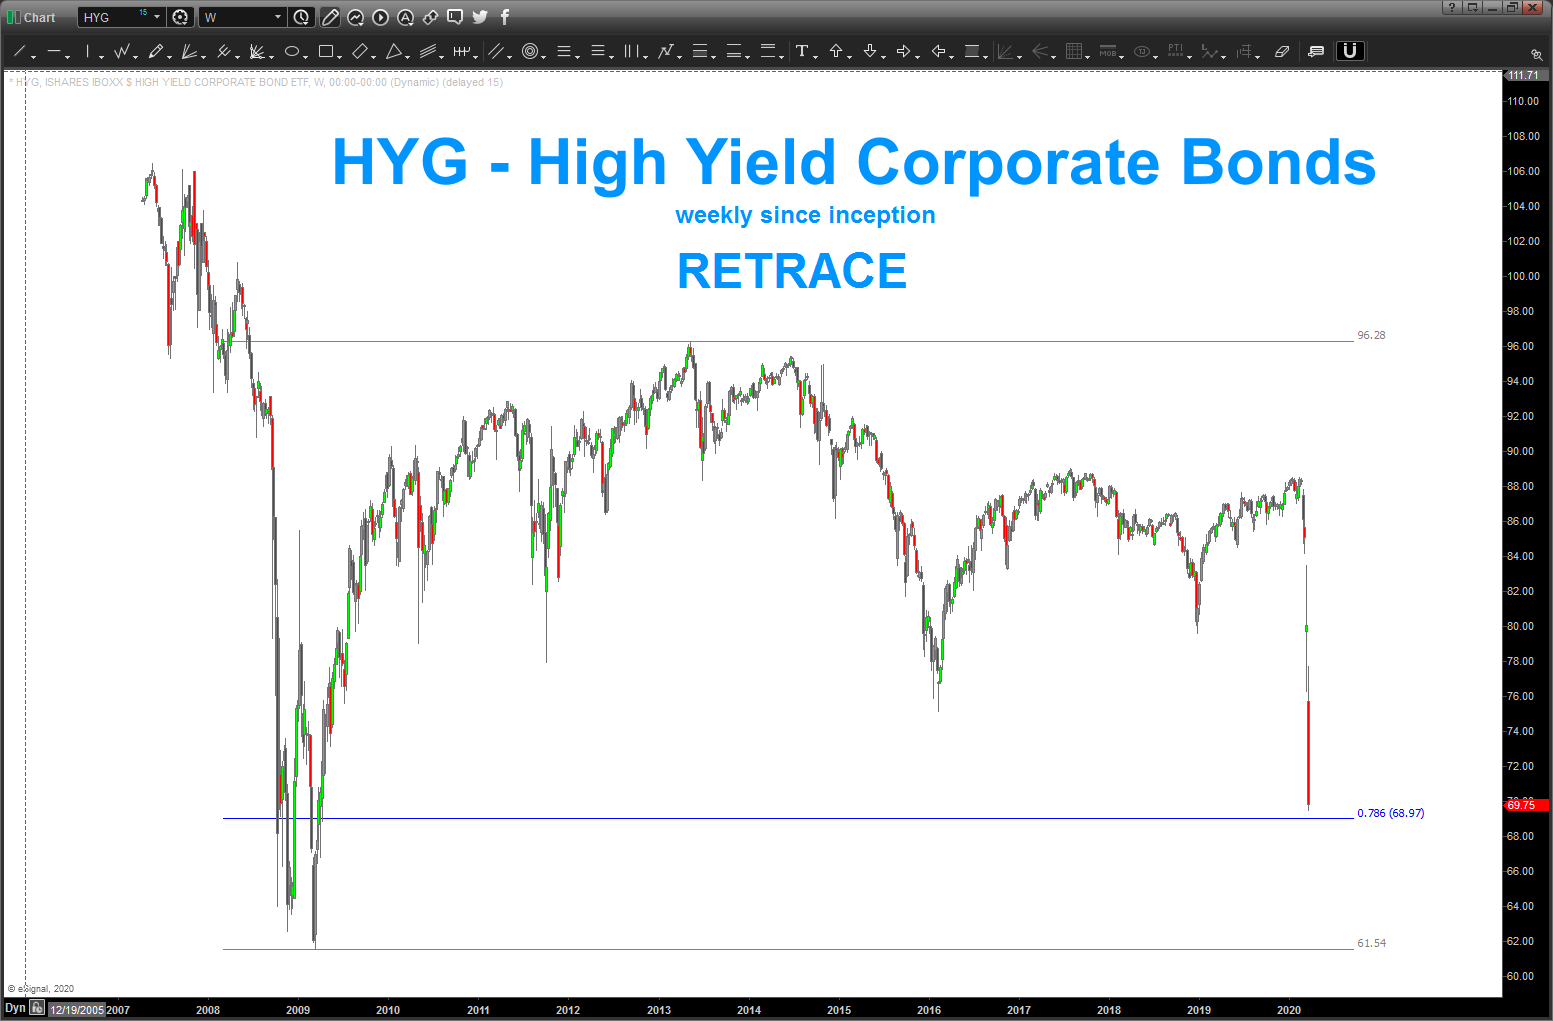
RETRACE – there she is, the .786 retrace right in/around the key level
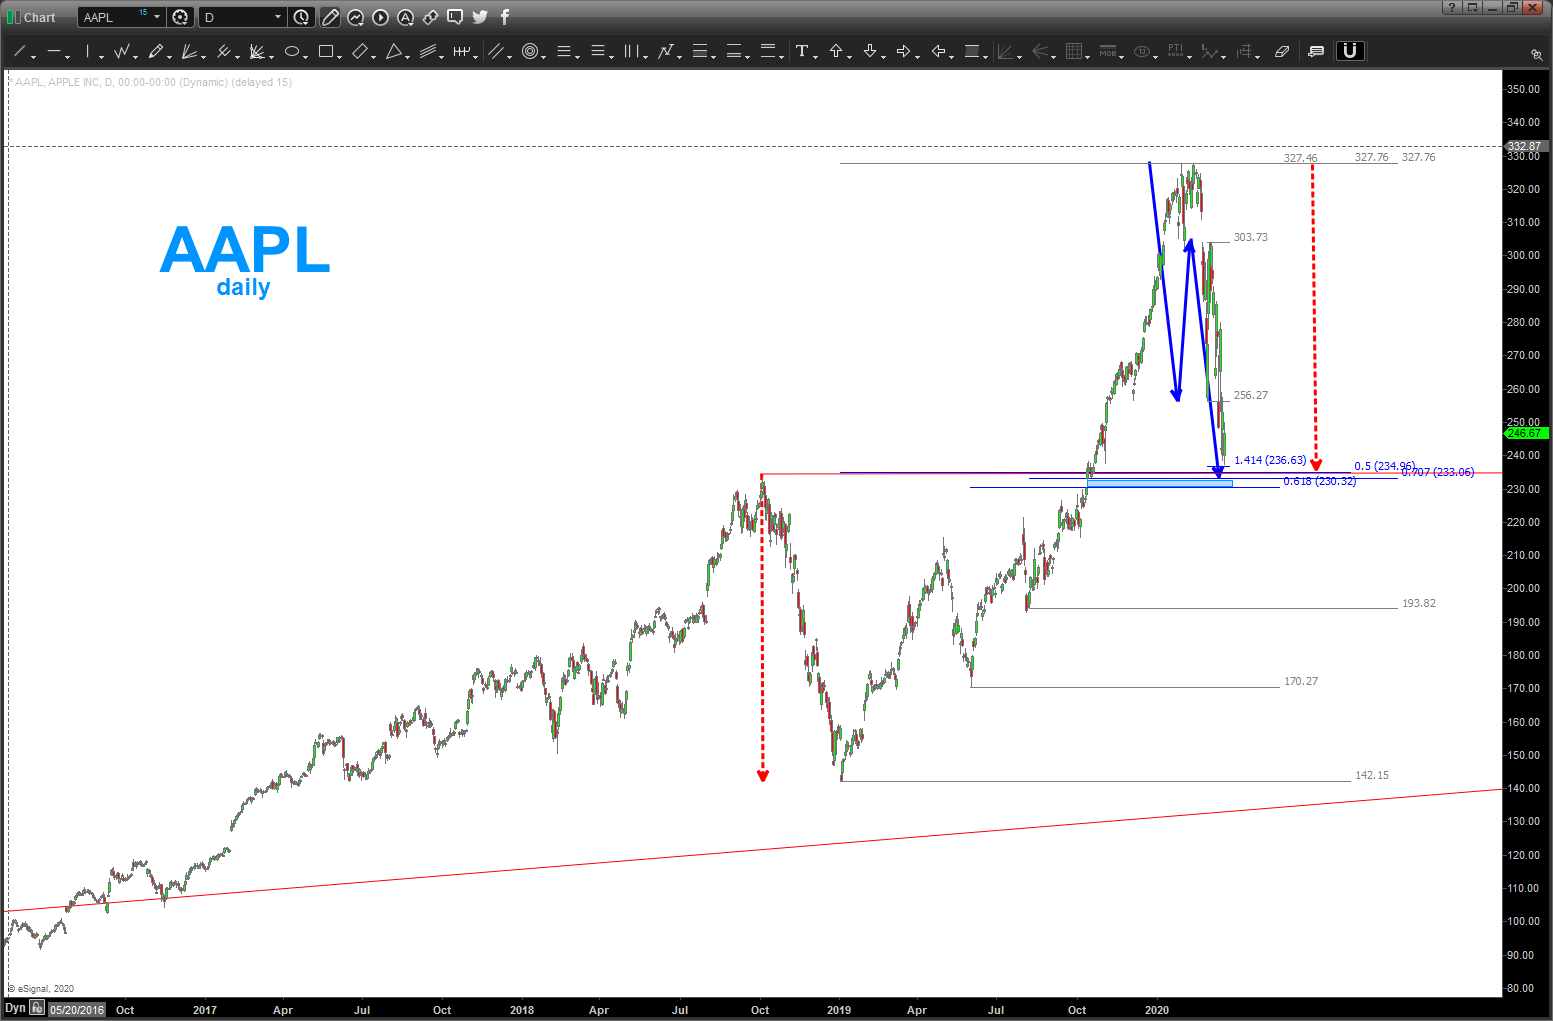
AAPL
Posted on March 18, 2020 Leave a Comment
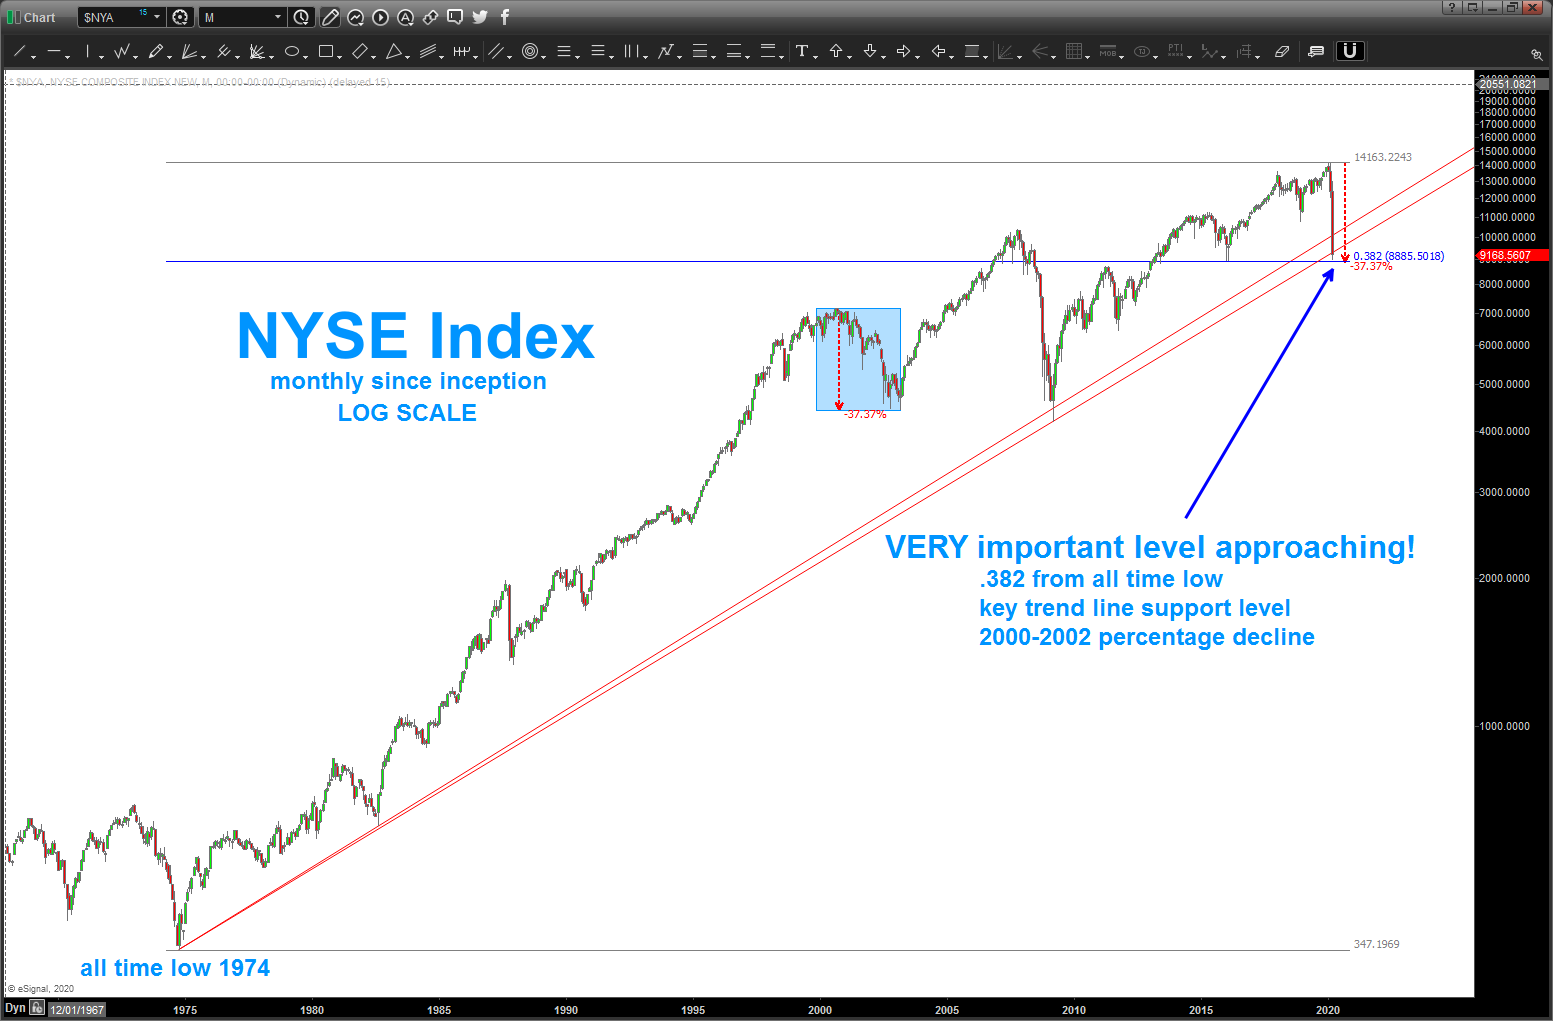
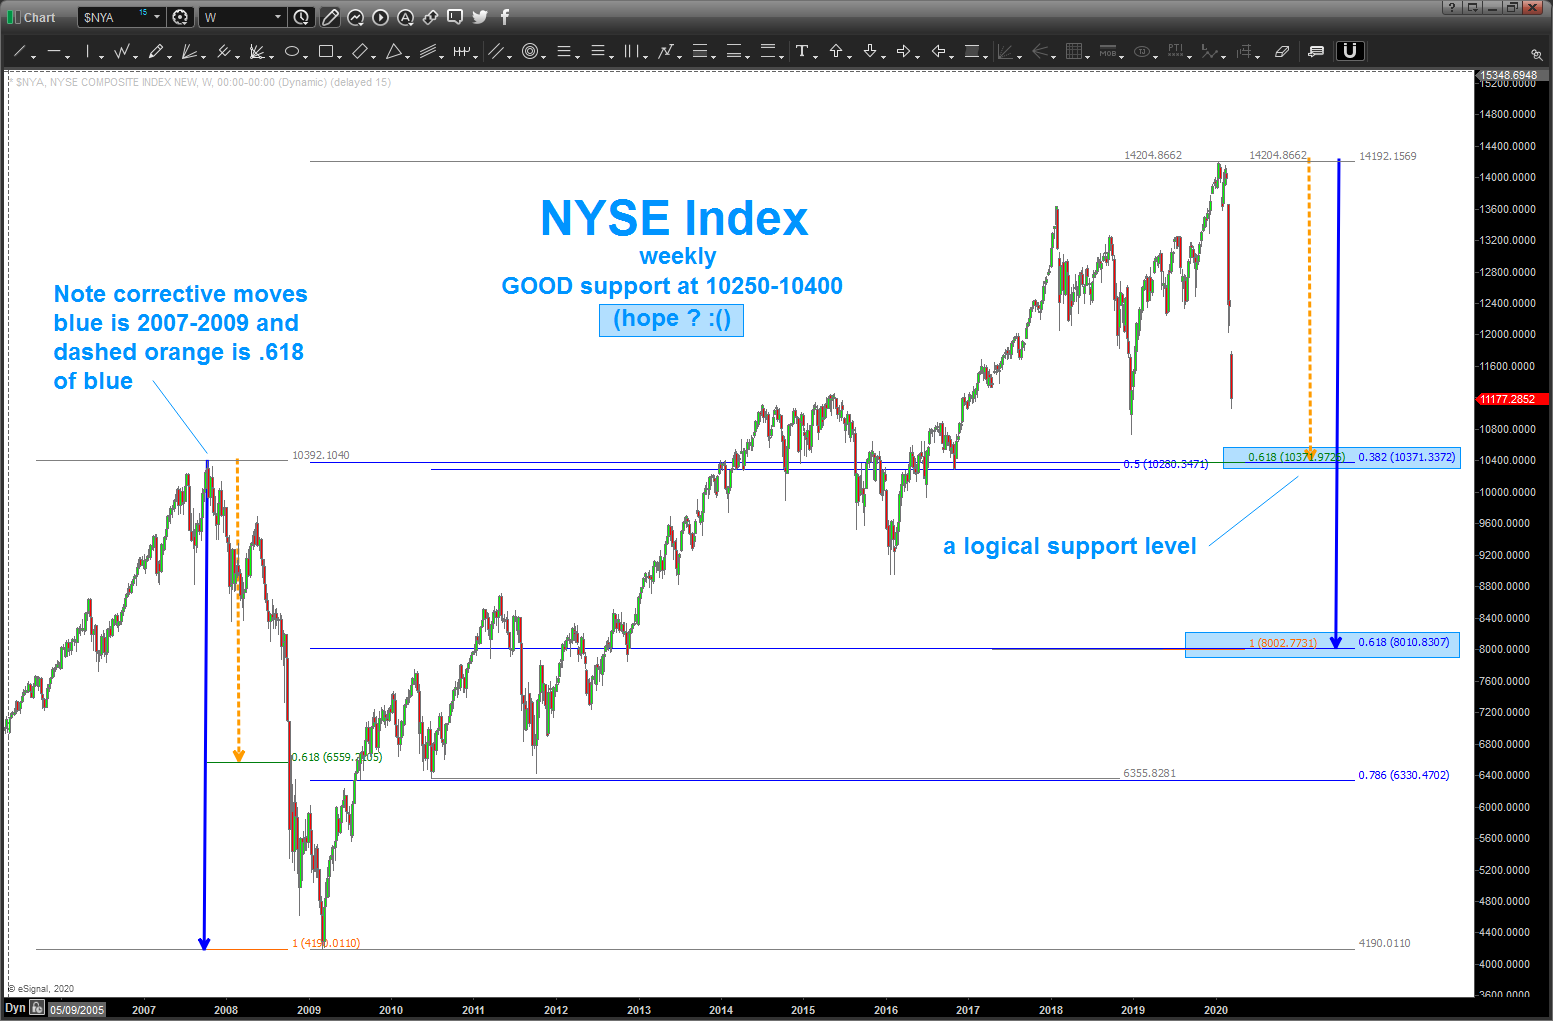
we all know that AAPL is responsible for a LOT of the point count out there … looking at the XLP/NYSE Index ratio and also the NYSE Index and it’s .382 retracement w/ the measured percentage move of 2000-2003 and the long term log trend line certainly looks like we should find some support HERE and NOW.
if these levels give away, it’s really not a good thing … read that last sentence again … they could very well give away. massive liquidation occurring right now. so … the “levels are the levels” but in this type of environment it’s probably a good thing to wait for a SRC on a weekly basis or something like that …
I’m simply trying (the operative word) to be unbiased and find SUPPORT levels that will stop this insanity. from there we can figure out the type of move (corrective, impulsive, etc.) and make detailed projections .. right now, am using measured moves from weekly/monthlies and then geometry to find the levels.
I am NOT advocating BUYing – just yet.
Bart
the ratio … what’s it saying
Posted on March 18, 2020 Leave a Comment

if you want to take a peak at what we’ve been doing w/ the XLP / NYSE Index (Staples/overall market) then search for XLP on the site at the top right of the home page …we very clearly saw the ratio bottom and start back up (which means, on a relative strength basis that staples were starting to outperform (negative for equities)) back in late December and January. what is fascinating to me is the STRENGTH and VOLUME of the candles of late. frankly,they are blowing away the candles from the 2007-2009. it sure looks like, from the ‘big boy lens’ (hedge funds, relative value funds, institutions, etc.) that they are moving into the safer names (staples) in a BIG WAY. I trust this ratio because, as you can see, it’s been responsible for guiding the MAJOR tops and bottoms since the XLP ETF was created back in 2000.
per the chart below, we are in uncharted waters … however, note the blue rectangle areas. if we take these areas and then look at the NYSE Index that I just blogged about earlier THEN we could very well see a sustainable bounce (note I did not say end of the dumping) but a bounce … so, pay attention to the level on the NYSE Index and also the blue rectangles below …
KEY LEVEL on NYSE Index
Posted on March 18, 2020 2 Comments

.382 from all time low in 1974, key trend line from all time low and same percentage decline for 2000-2002. KEY
Asian Open – Fed cuts rates to zero and possible mirror image foldback NYSE Index
Posted on March 15, 2020 2 Comments
here’s last weeks post on the Asian Open and the YEN. level worked pretty well and we rallied pretty much all week. the USD vs YEN should stay below the 108.46 level and/or 109.866. if (the big if) this sell signal works then it ‘should’ put pressure on the equities:
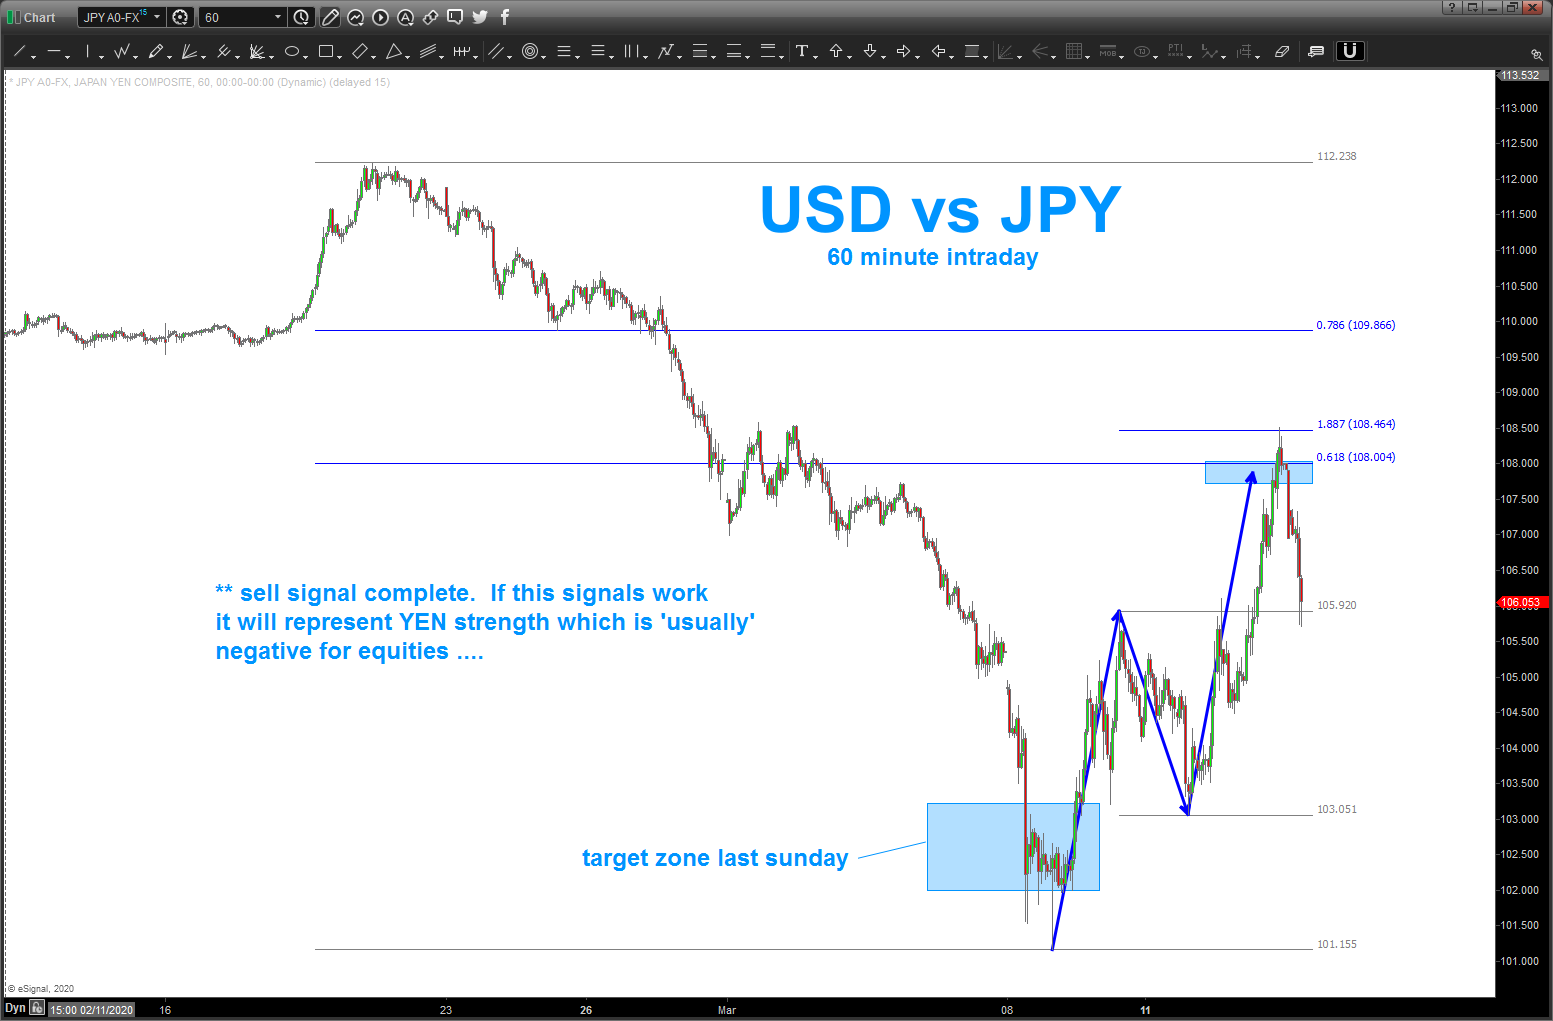
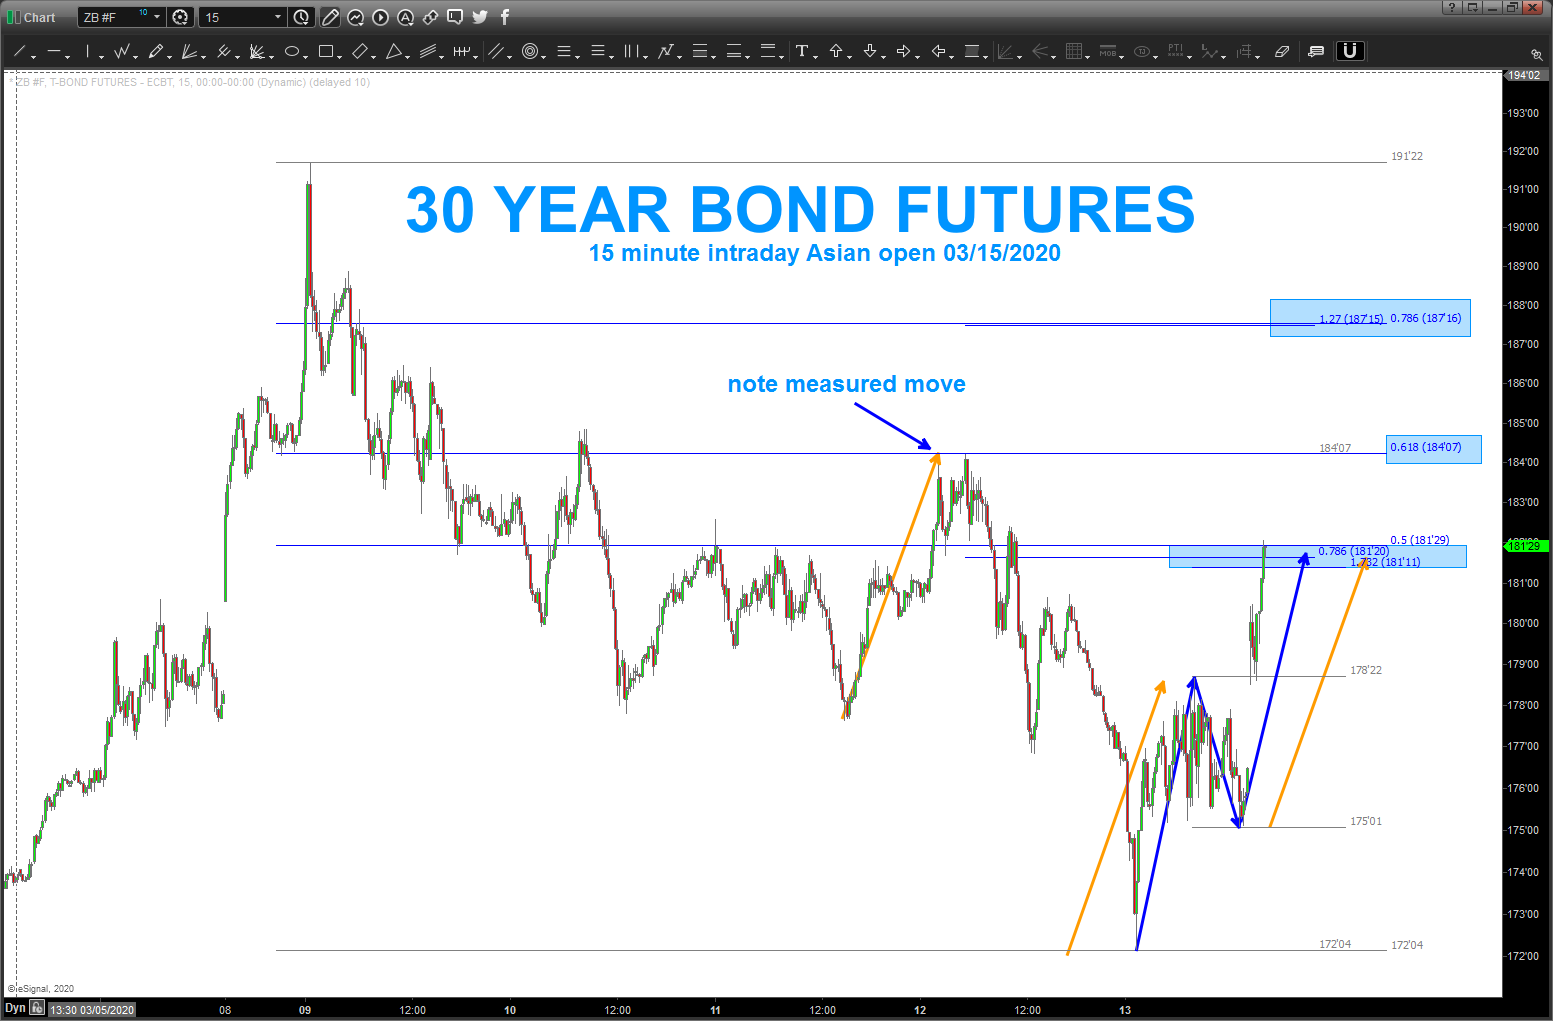
even w/ the FED cutting rates take note of the key (intraday sell signal) on the bonds … intraday/15 minute chart. we have higher targets but this is the ‘first’ sell signal from the lows back on 3/13.
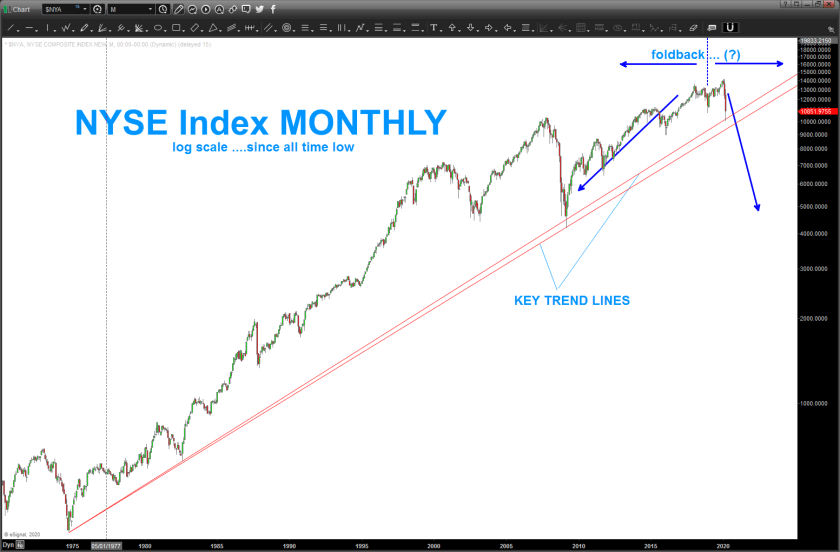
here’s the potential mirror image foldback I’m monitoring on the NYSE Index. Pretty symmetrical pattern. note the key trend line … that’s a BIG DEAL.
Hot knife thru butter …
Posted on March 12, 2020 Leave a Comment
when I came up w/ the support levels last night I certainly didn’t think we would come down into those levels today. not the least bit BUT we did .. ugh. I watched the levels in between calls as the gap came down into our targeted support zone – actually held for a bit and then pierced the level and closed at the low of the days …
so, we’ll get out our pencil, erase, and come up w/ another level … ultimately, this drill is to define/find key support – look for confirmation that a low is in place and then WAIT for a SELL PATTERN to appear to try and get a short on .. try being the operative word.
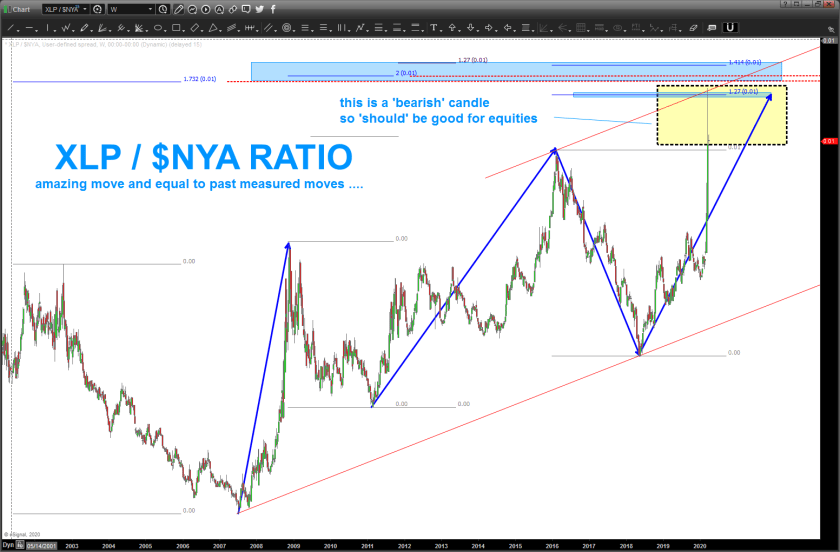
below you’ll see the key UPTREND trend line from the all time low back in 1974 and in log scale. in fast moving markets log scale trend lines become key as they really help one capture the emotion and velocity of the moves. note we have not broken a key log trend line so the trend is still up …yes I know that is crazy, but that’s the case, for now. certainly looks as we will test that line in the coming days …
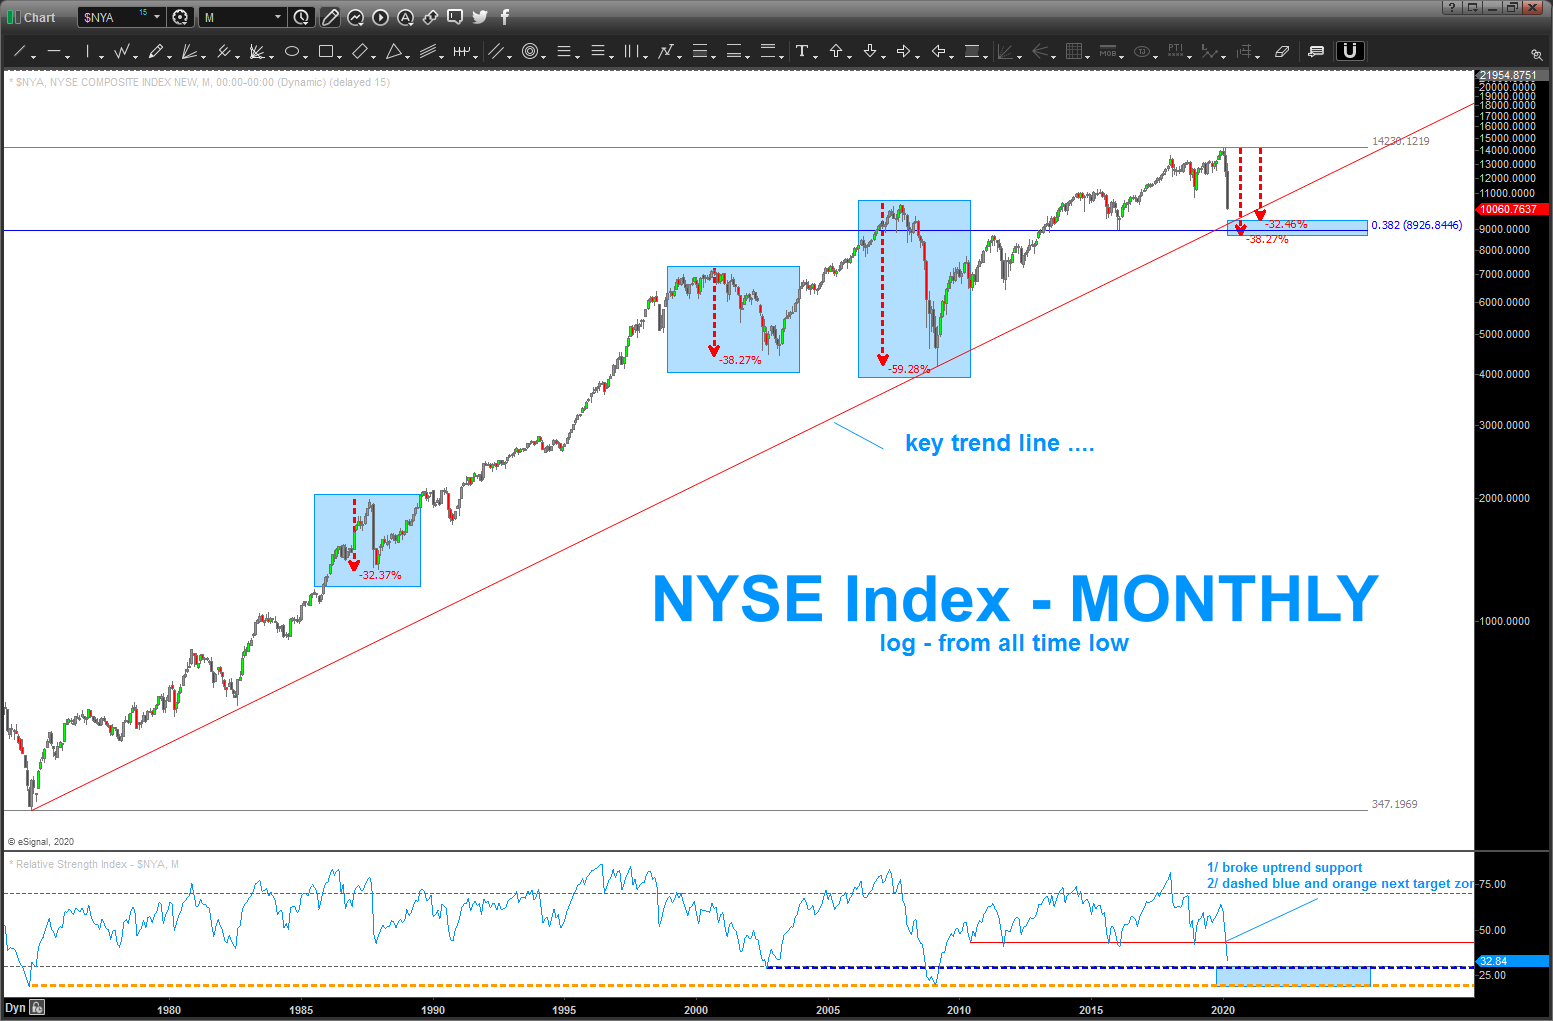
1/note RSI below on a monthly basis – we have broken support that defined support levels for the entire move up from 2009. 2/ we should target the dashed blue or orange RSI support – watch those levels. 3/ note the uptrend line labeled “key trend line” 4/ taking the “biggest” corrections ever we can see that they range from 32,38,59 percent for 87,2000-2002, 2007-2009. we are approaching the 30% decline level and right in/around this area is the .382 retracement from the all time low back in 1974. WE SHOULD FIND SUPPORT IN AROUND HERE ….
note – when using an all time low or high to derive a confluence zone its good to go back in time and use that same point and see if it was important in the past .. it was and therefore, the all time low in 1974 ‘should’ be the node to offer support .. .for now. that’s the second chart.
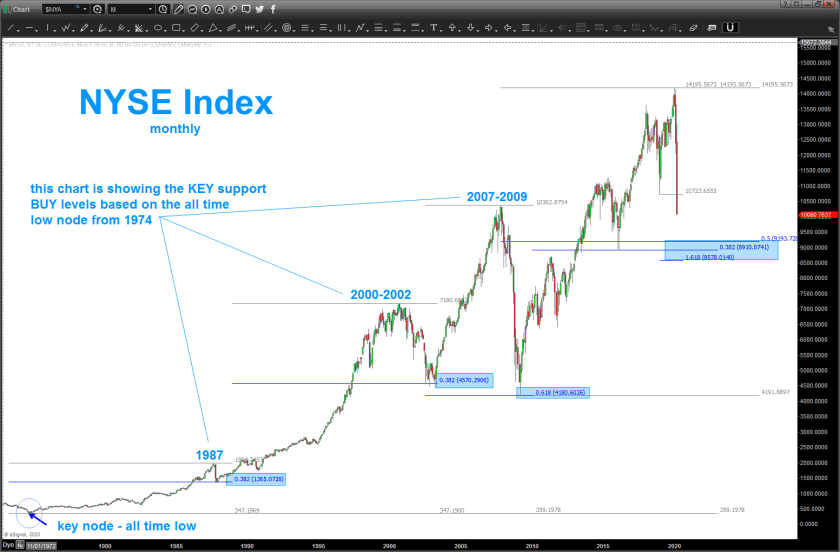
here’s the chart showing the key node and it’s importance in deriving support and/or BUY levels.
Targets for support (hope – a strategy)
Posted on March 11, 2020 Leave a Comment
Here’s the link to the ‘targets a plenty’ – https://bartscharts.wordpress.com/2020/01/25/targets-a-plenty/
there are also two other posts which mention the target in Dec and then early January. resistance? yes! contagion selling? no! so, here we go …
if we take a look at the 2007-2009 correction we can find harmonics to it and go into the past (I’ve done it) and then PROJECT those harmonics on future support …that’s all the chart below is … we have some “standard” fibo’s coming in but we do have 2 ratios (that’s always good) and for me the most important point is they all land right on the key retracement points … so, very quickly, let’s watch that 10250-10400 for some nice support!
if we swing down to a daily it “appears” (see above title for hope) that we are in a 5th wave down so we ‘should’ (operative word) see a bounce here-soon. also, I haven’t updated it but am watching it like a hawk – the USD vs JPY has NOT seen new lows and if that maintains support this selling will abate.
take er’ easy – Bart
STOXX – ugh
Posted on March 11, 2020 Leave a Comment
I’ve been following STOXX for a friend overseas and I truly hope that he and his family and friends are OK w/ all this craziness going on …hat tip, friend.
here’s the link to the STOXX posts on my site: https://bartscharts.wordpress.com/?s=stoxx
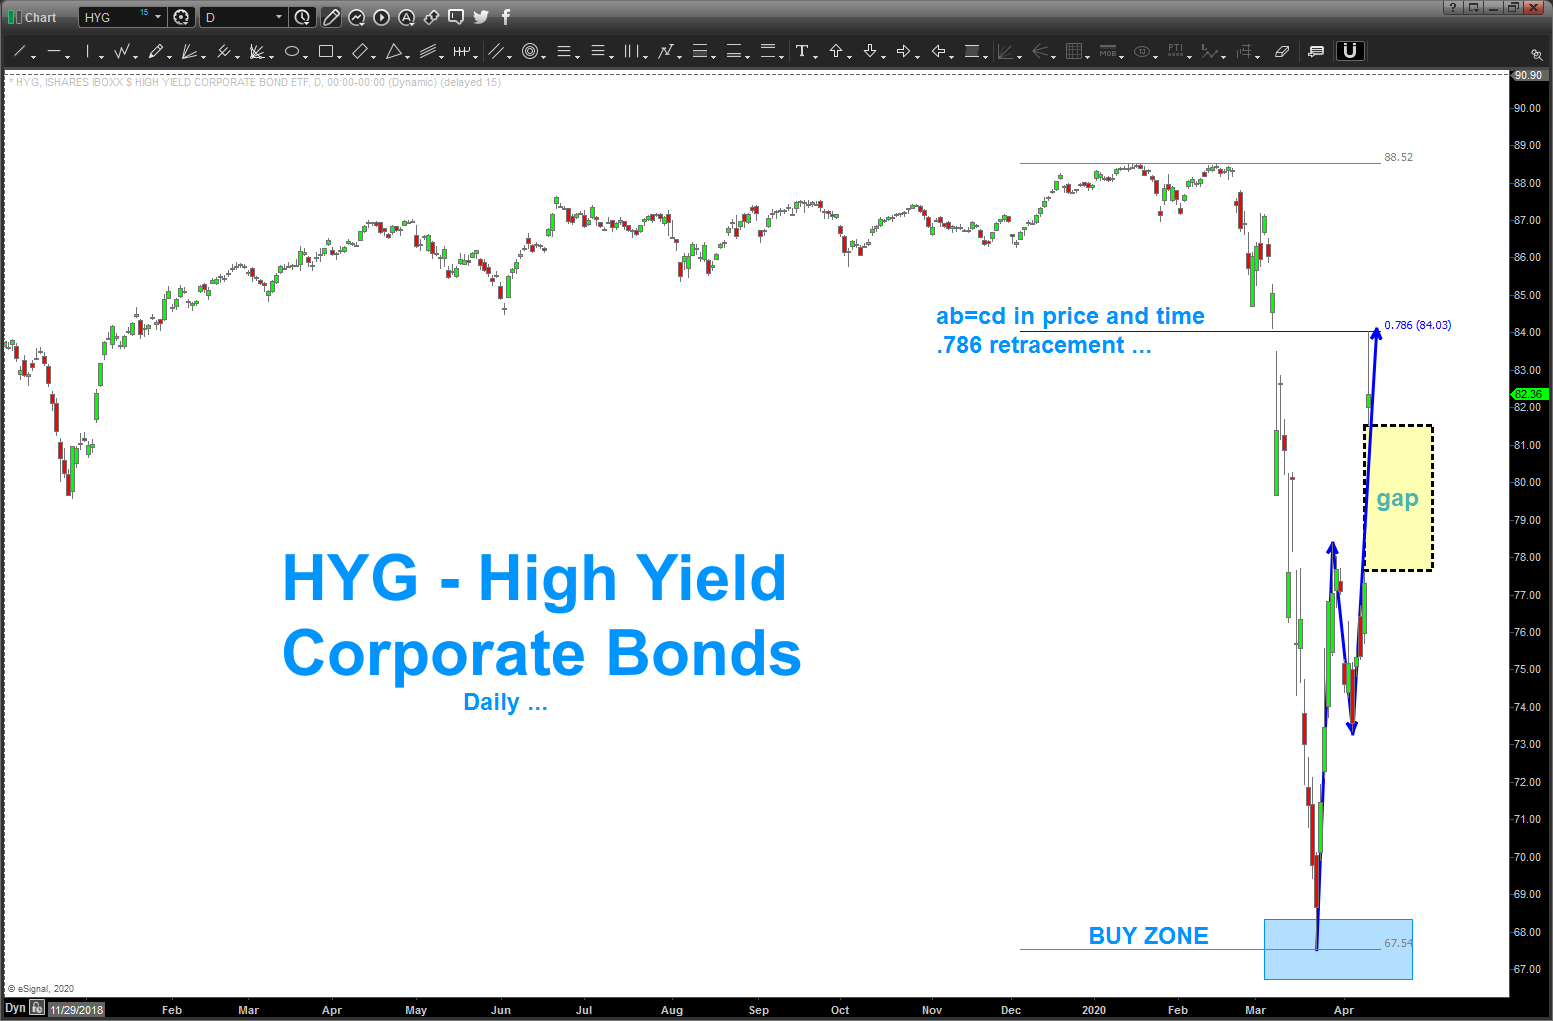
net-net, my friend contacted me a couple years ago and asked about European Banks and, in particular, the STOXX. it was hard to email him back because what I saw – which unfortunately was proven to be correct was a multi-year triangle that had been forming since 2009. it’s ramifications? well, the STOXX WOULD go to new lows and, more than likely, ACCELERATE the move lower because … that’s the nature of moves out of triangle. in my world of using crayons, I have no idea, nor do I care ‘what’ caused the market move one way or the other. there are ALWAYS a thousand reasons. for me, it’s a pattern that helps one manage risk and help one determine how much $$$ to risk and then pull the trigger.
Here’s the updated STOXX chart:
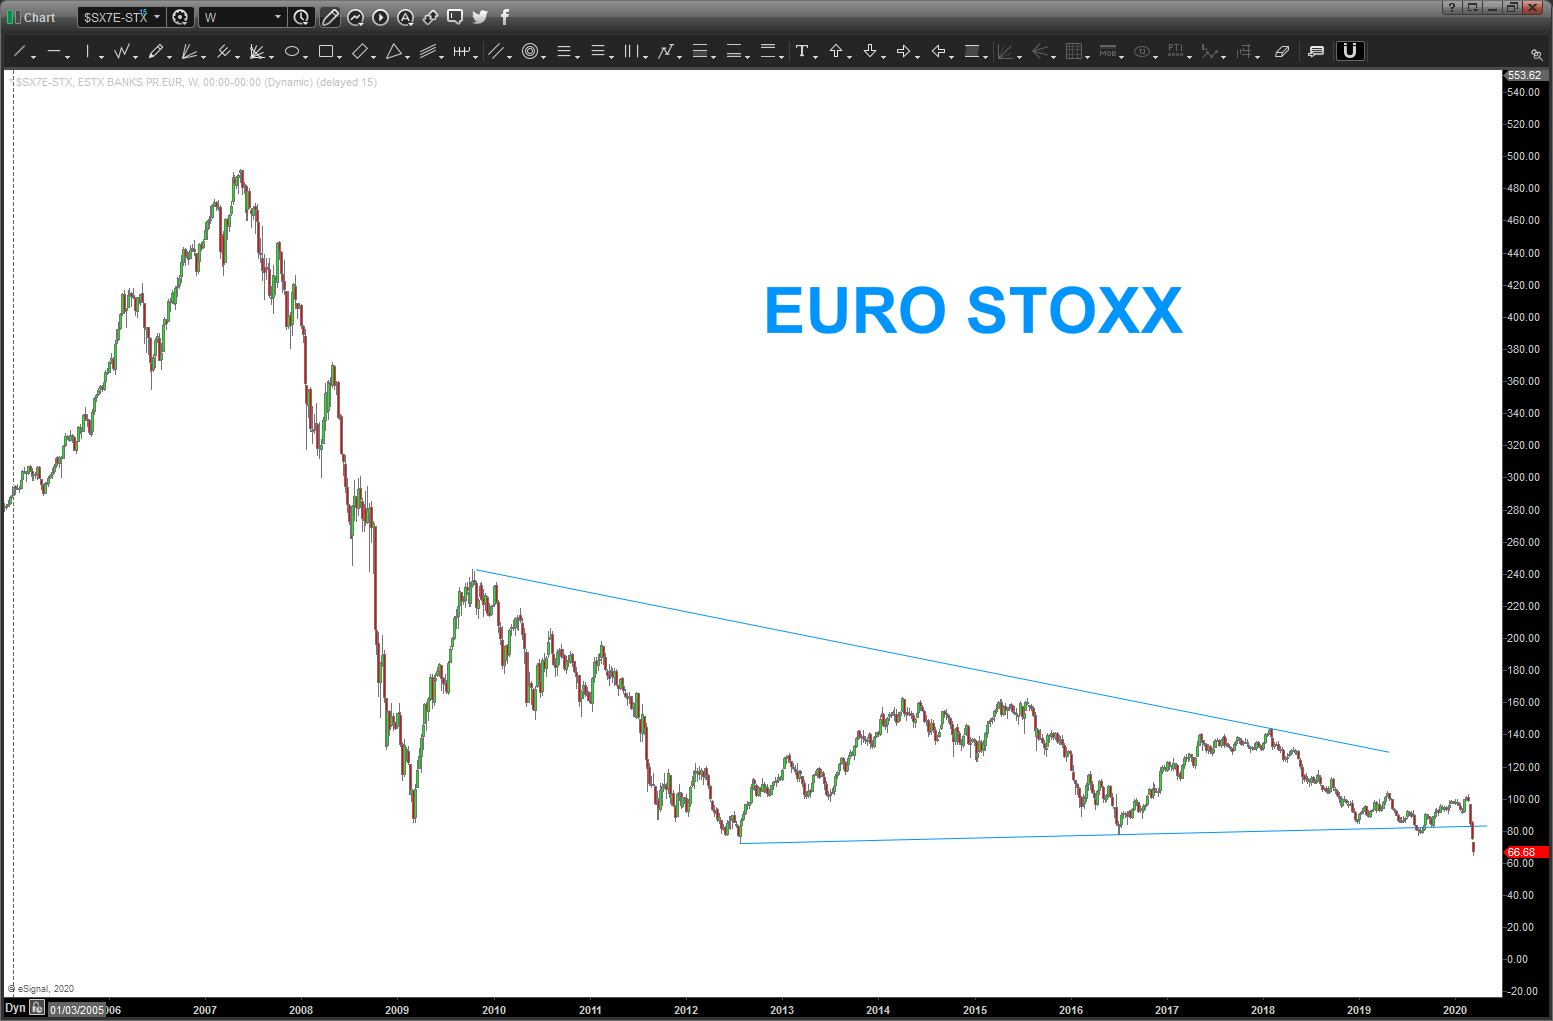
I went back and captured the daily chart showing the target zone … two years ago, chart below: