MSFT – everyone reading this post learned how to make a circle form 3 points …
folks, honestly, being in the parabolic wave is quite the rush and I’m 100 percent guilty of getting out too early and I would really love it if someone told me they got in at the exact bottom and took it all the way to the top … bless you if you have! 🙂
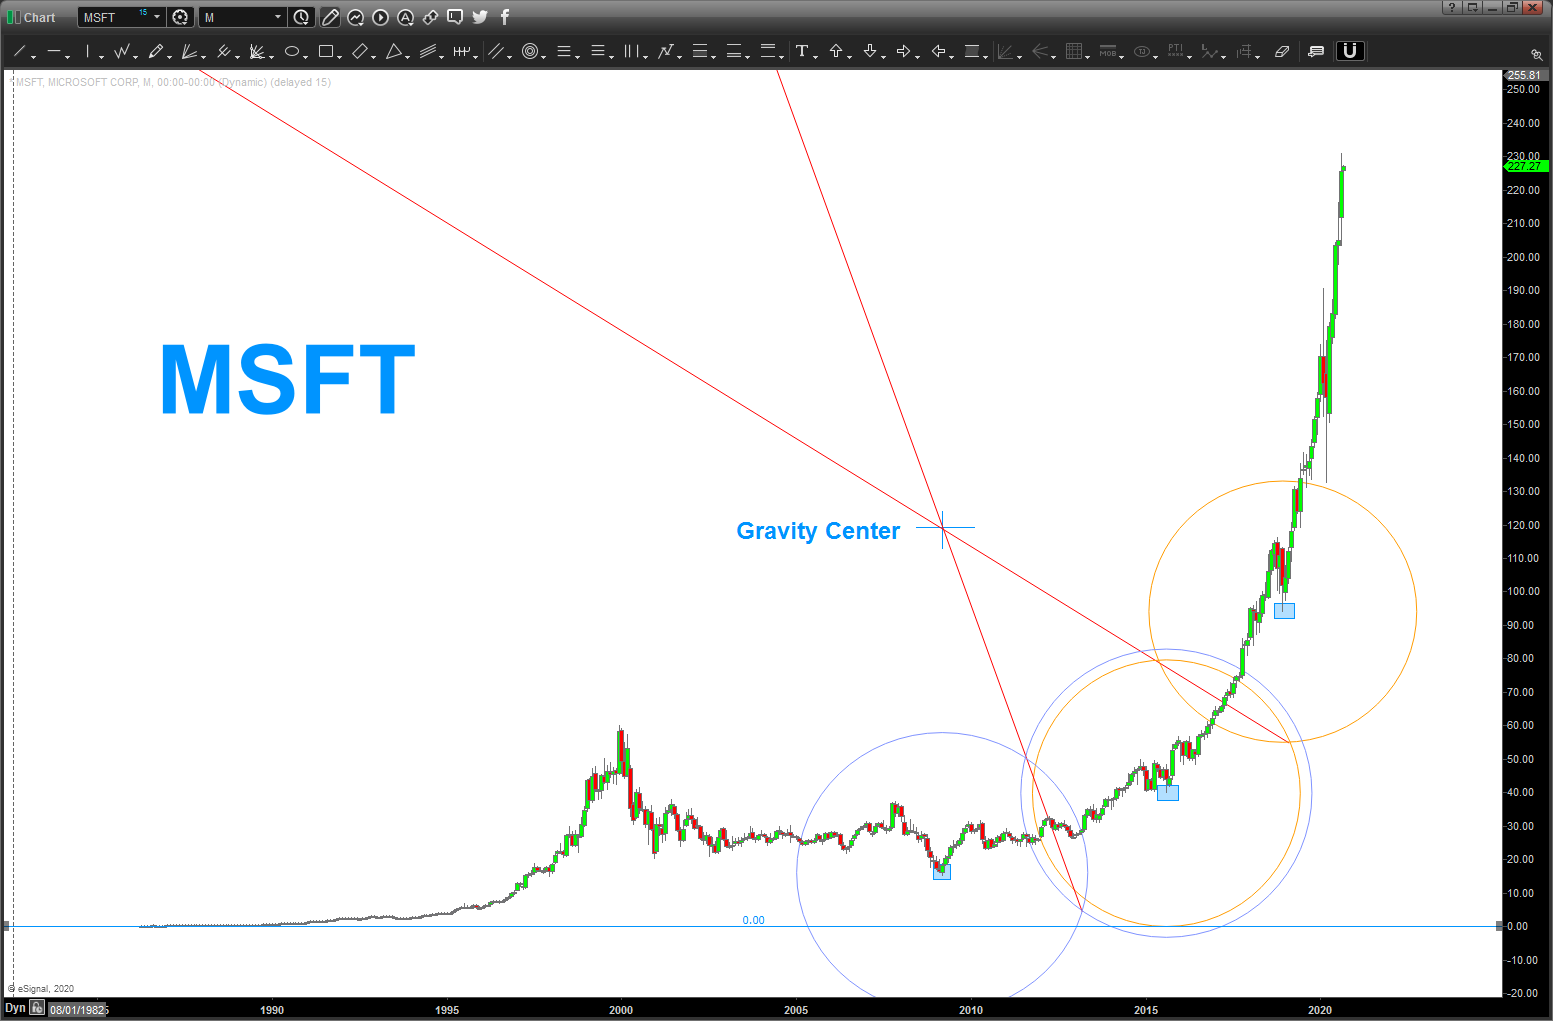
finding tops and catching knives is a fools game … we all know that. but you can use geometry to get a clue …
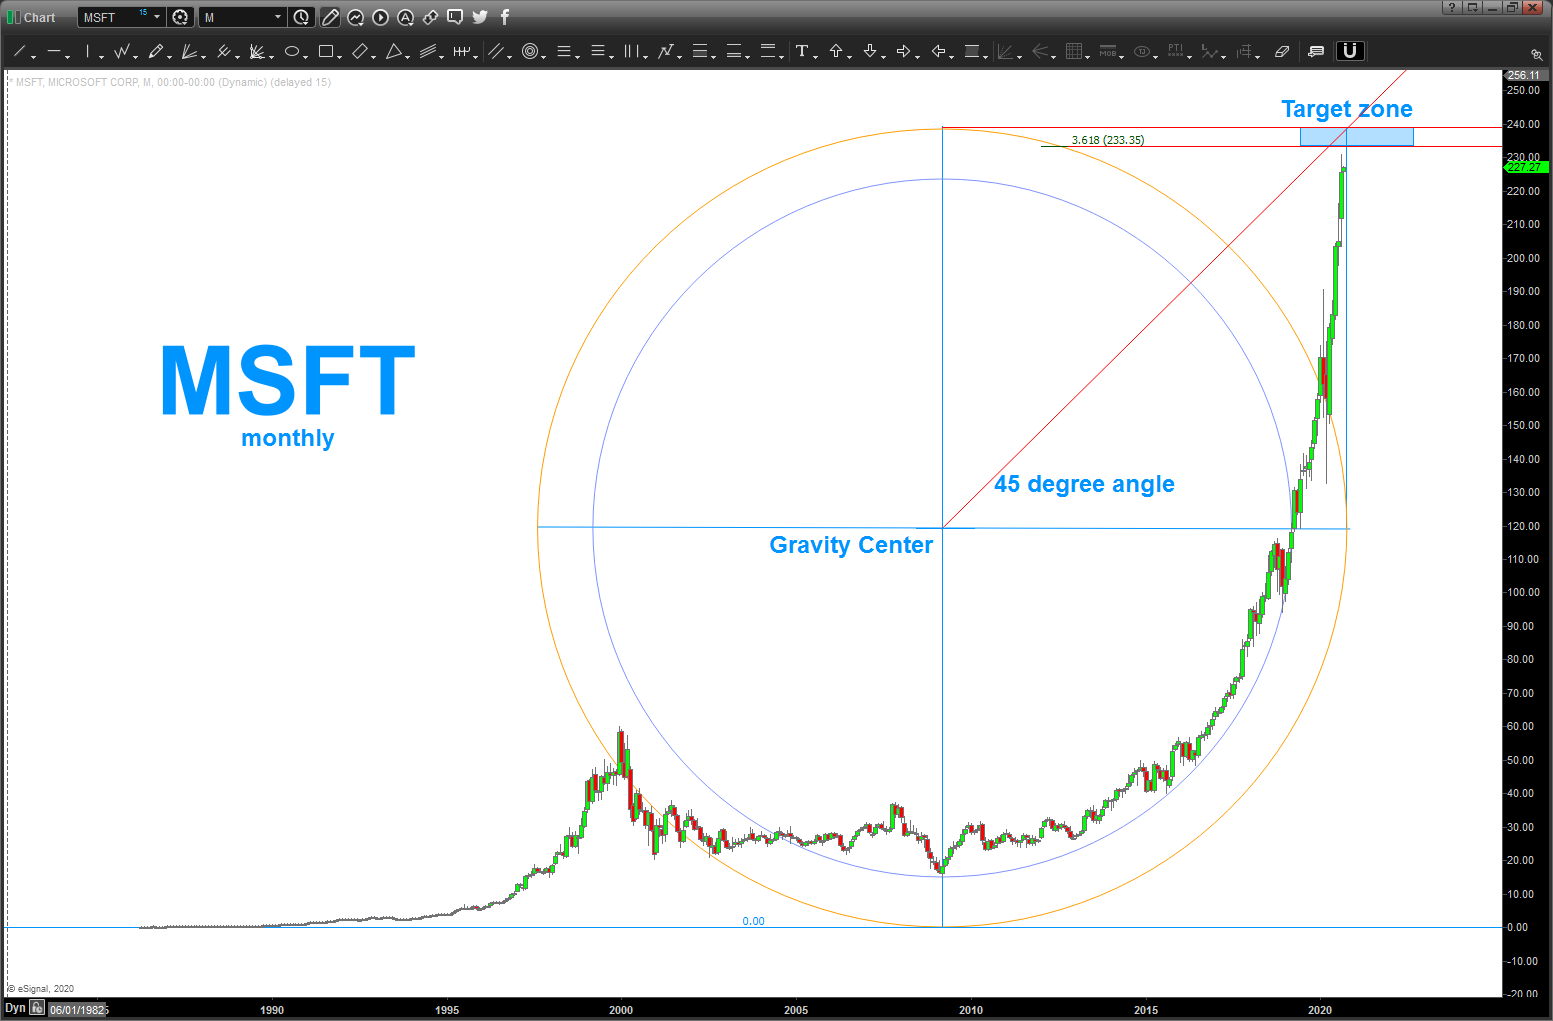
so, taking what I learned in my geometry class I used three points to define a circle, found the gravity center and then use 0 price and drew my arc. it’s below.
is a top coming – oh you betcha your bottom dollar.
is my analysis of that potential top target area correct ? I have NO IDEA.
but, we can watch and wait for a signal reversal candle ….

The charts of stocks like Apple and Microsoft look very different on a logarithmic scale. Not quite parabolic… yet. Wouldn’t it make sense to evaluate them on that basis as well? As a matter of fact, I’ve often wondered why not more technical analysis is presented that way.
The fighter jet analogy is very powerful, btw.
yes – log scale is VERY important. when I look for the parabolic take off, I use the normal chart view but once a move occurs (up or down) the confirmation is usually a break of a long term log trend line. thanks for reading and commenting! take care – Bart
ciao Bart
Enzo from South Italy thanks nice post never stop learning
Enzo – great to hear from you. how are you doing over in Italy? hope you, your family and friends are all well. so love that we are still in touch ….