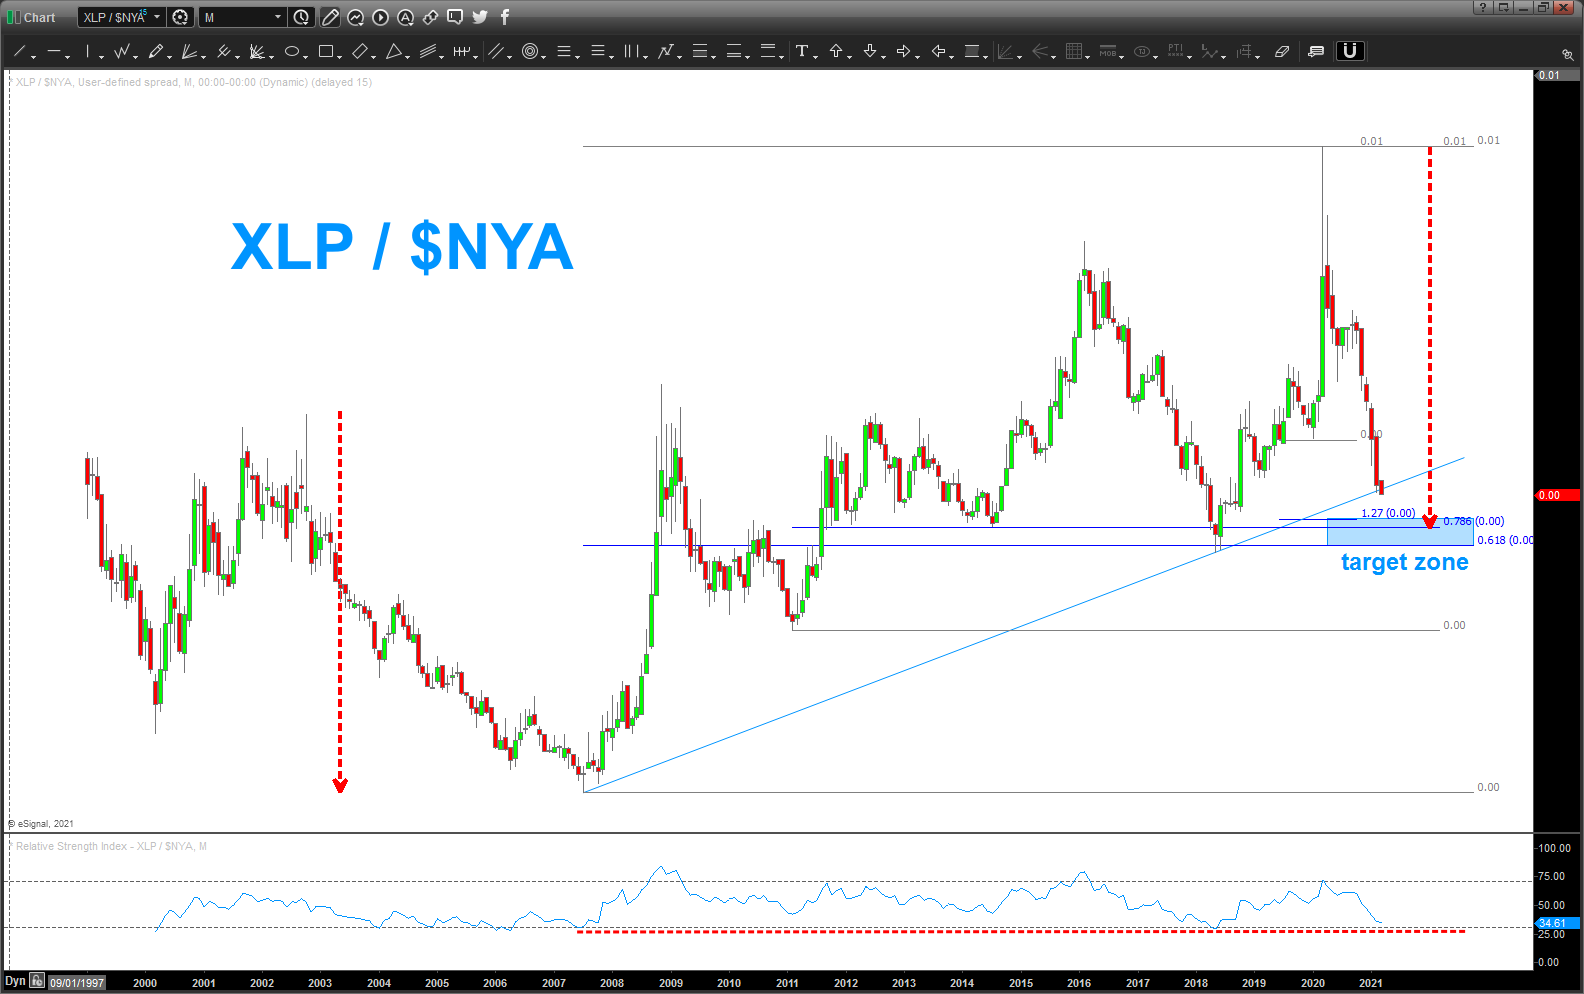
don’t forget this target on my favorite ratio …
Posted on March 1, 2021 Leave a Comment
note, on the monthly, looks like we will start the month closed below the key trend line from 2007. and he market accelerated upward.
that being said, we are approaching the “target zone” for a lot of math and I also want to call your attention to the monthly RSI and the support zone that its approaching …
I went back and checked .. the last two times it touched this low of a level in the past 15 years was 05/2018 which was part of a -40% ish correction and 07/2007 and we knew what happened during that time frame.
Caveat Emptor …
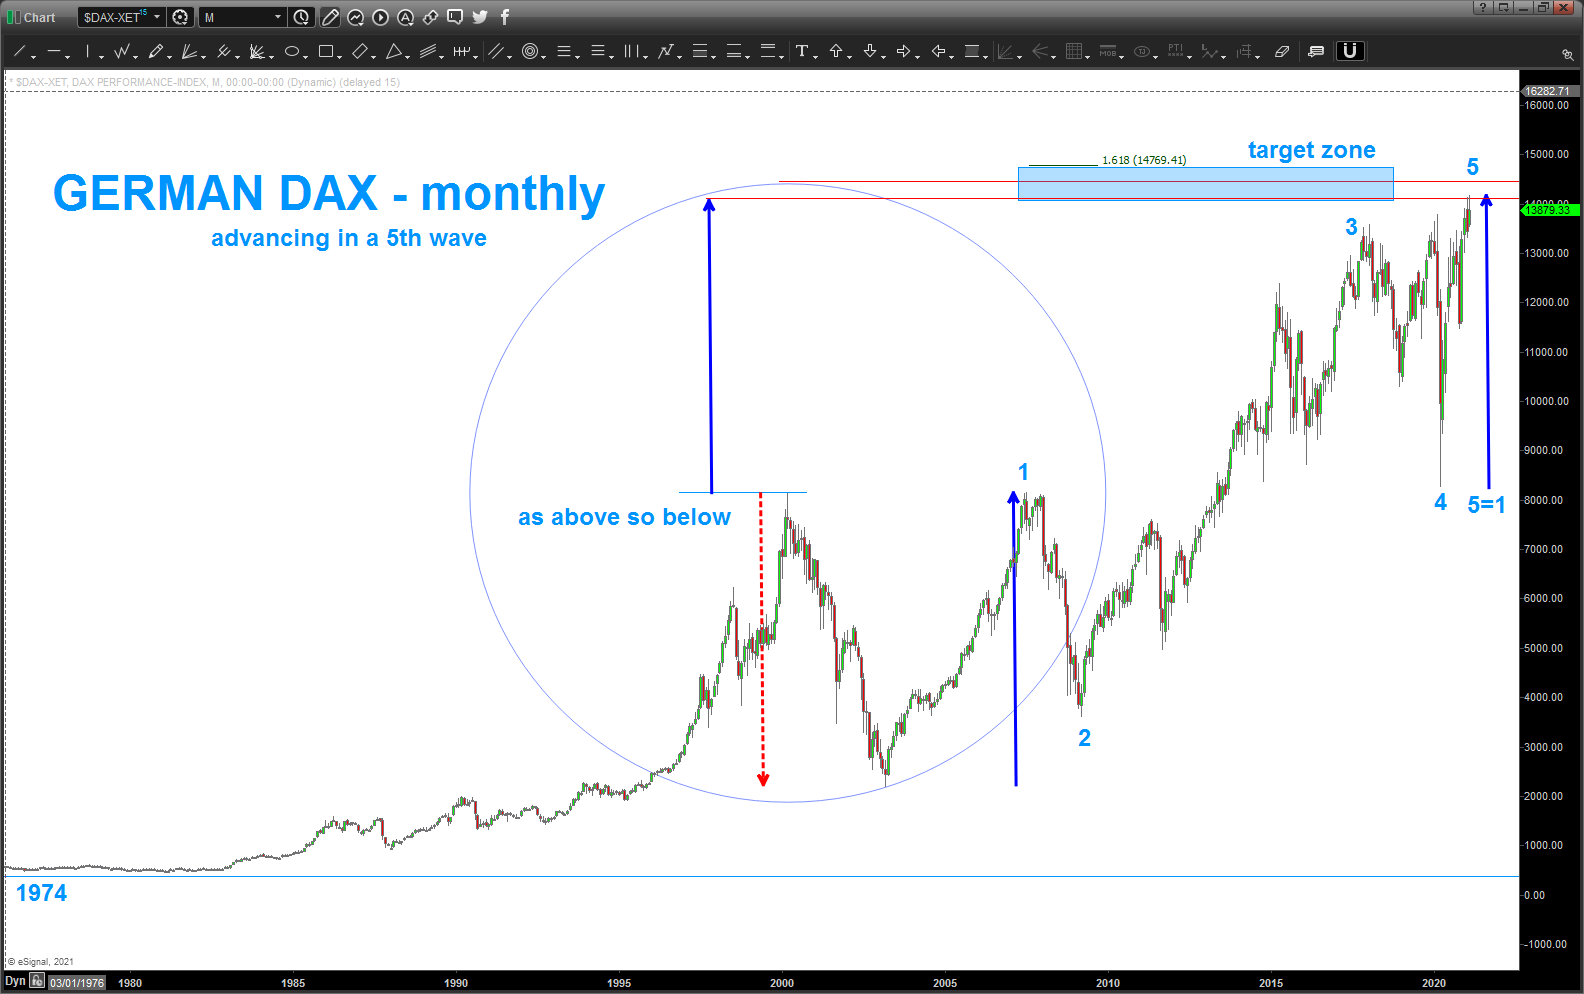
German DAX – circle holding
Posted on February 25, 2021 Leave a Comment
original post: https://atomic-temporary-44460632.wpcomstaging.com/2021/01/30/german-dax-hit-top-of-circle/
for now, the circle area holds .. note, as an FYI, wave 1=wave 5 at the target zone …..
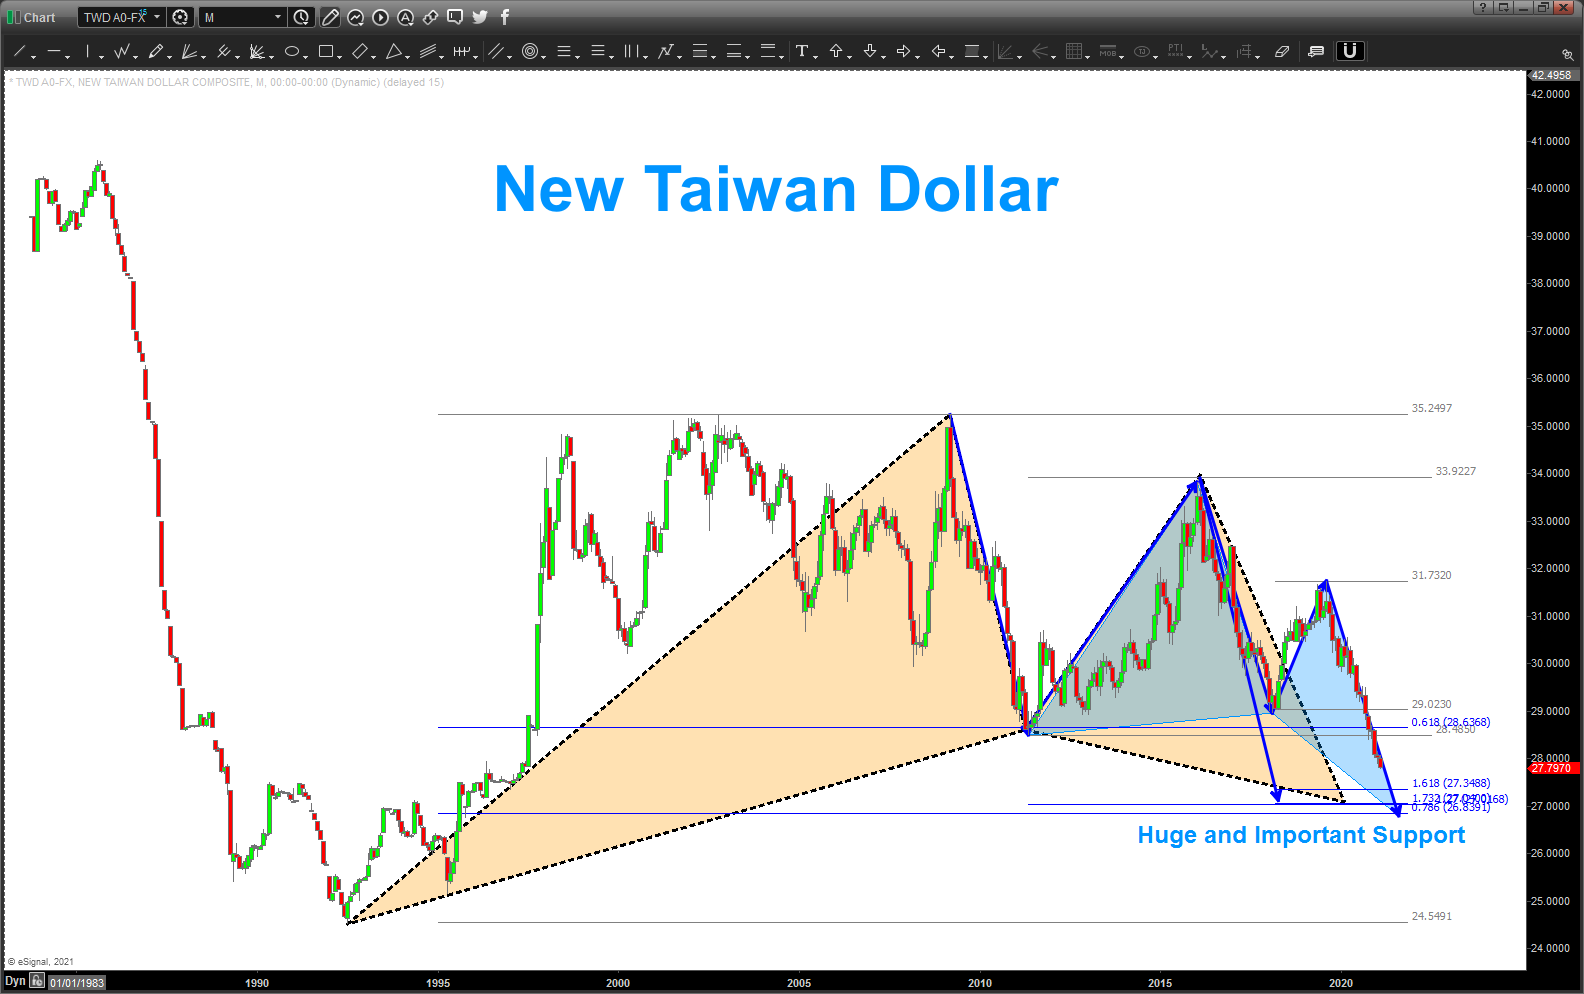
New Taiwan Dollar
Posted on February 25, 2021 Leave a Comment
well, the US struck Syria today.
Spratley’s are heating up and, well, they always have … made me think of China and Taiwan.
Would you check out the BUY PATTERN on the New Taiwan Dollar? Two MAJOR patterns on a monthly chart all coming in/around the same area.
PAY ATTENTION.
USD Index – close to a BIG move UP?
Posted on February 22, 2021 1 Comment
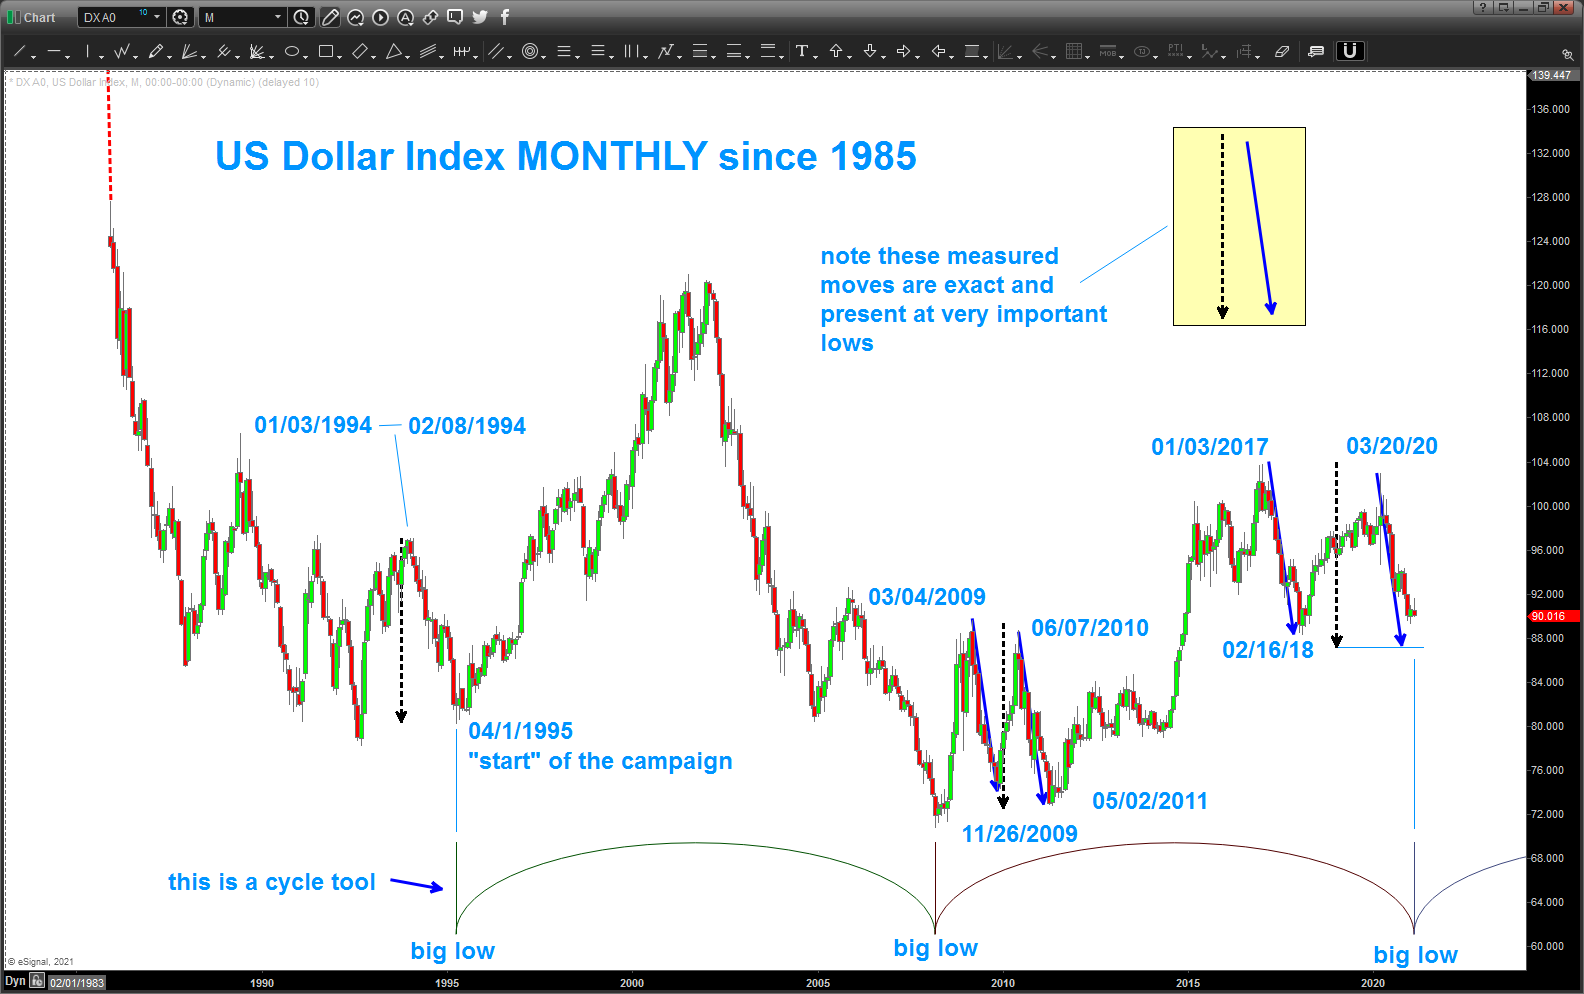
if you have been following my blog, you’ll remember the big measured moves that were around when the dollar was carving out THE low. they have appeared/are appearing again. w/ a wrinkle … using “basic” monthly cycle tools you can see that we have a BIG cycle coming in this month which lines up w/ the measured move target zone a little lower in the index. this could be a BIG DOLLAR MOVE higher ….
below you’ll find the chart that started the dollar bears growling and stopped the dollar bull in it’s track. the form, proportion and balance are amazing and exact. take time to study this chart
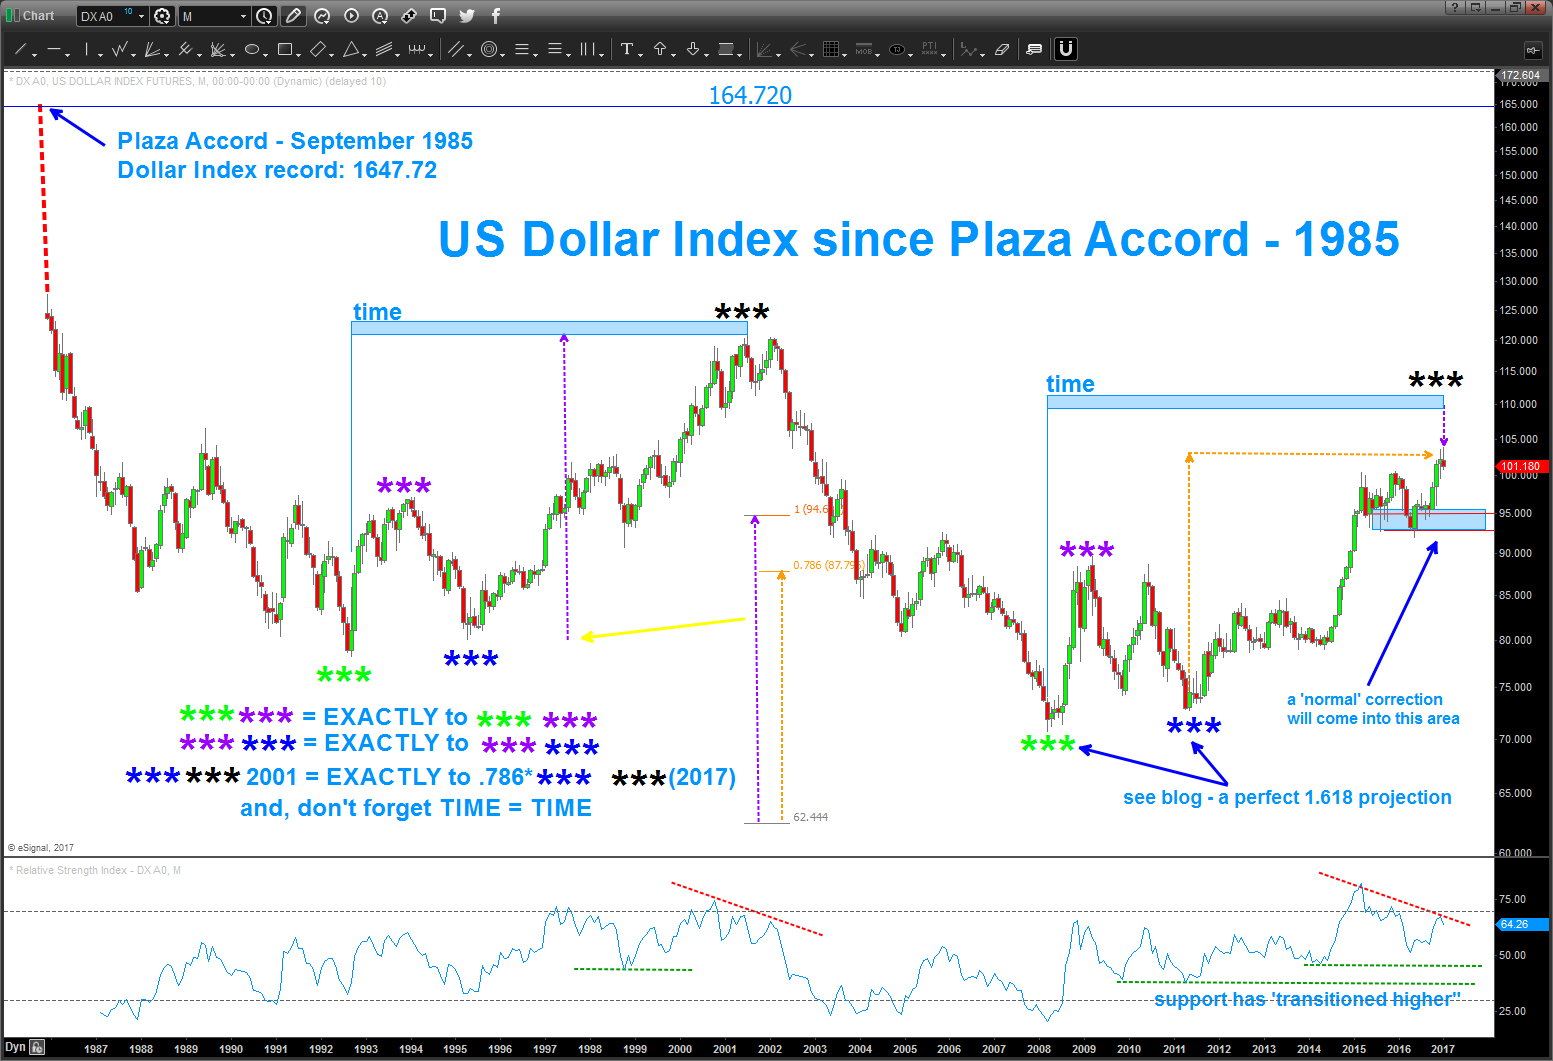
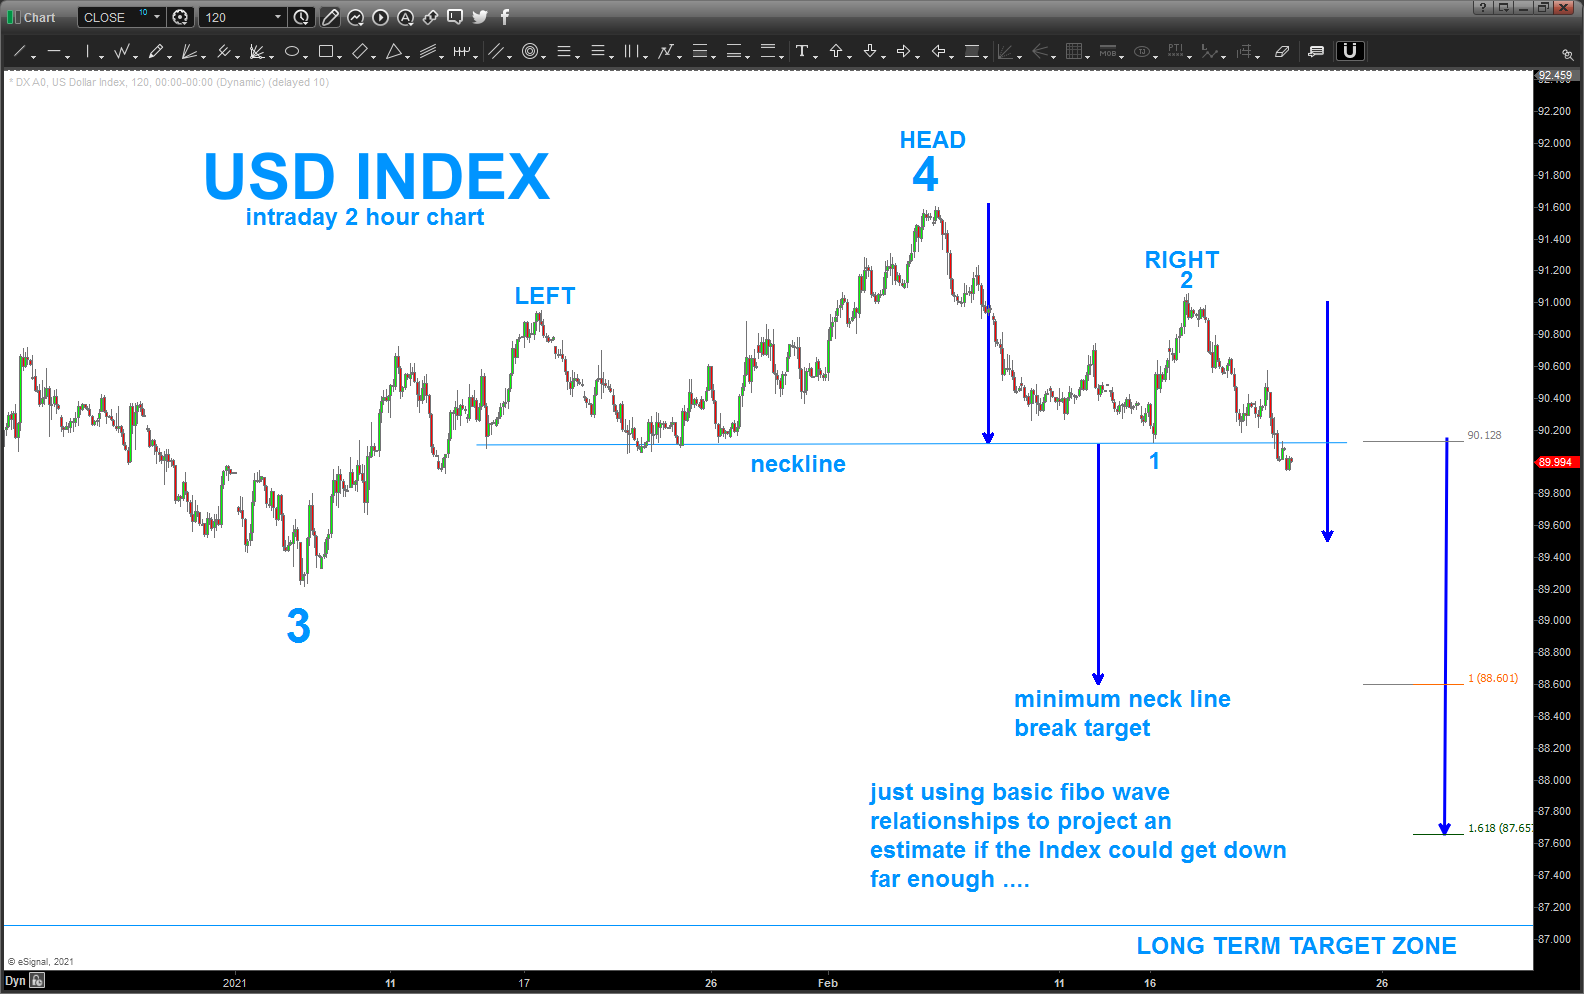
since then, the USD Index has basically been carving out what looks like a flat correction and then higher … you can read prior posts to see if this was an A-B-C correction or 1,2,3,4 (in work/finishing) and then higher in a big 5th wave. we are getting a little below the end of wave 1 which breaks a rule if your a purist but it sure looks like we are bottoming. then, the last chart is an intraday chart showing a possible mathematical derivation of wave length based on fibo relationships that could get us into the target zone … so, stand by, as this is a BIG level coming up on the USD.
IWM – is that it?
Posted on February 21, 2021 2 Comments
adding to this last post about IWM: https://atomic-temporary-44460632.wpcomstaging.com/2019/03/02/iwm/
I’m teaching my son about “advanced” Pattern Recognition … it’s fun and the big thing we keep hammering into each other is trade what you SEE not what you think/believe. (thanks Larry P)
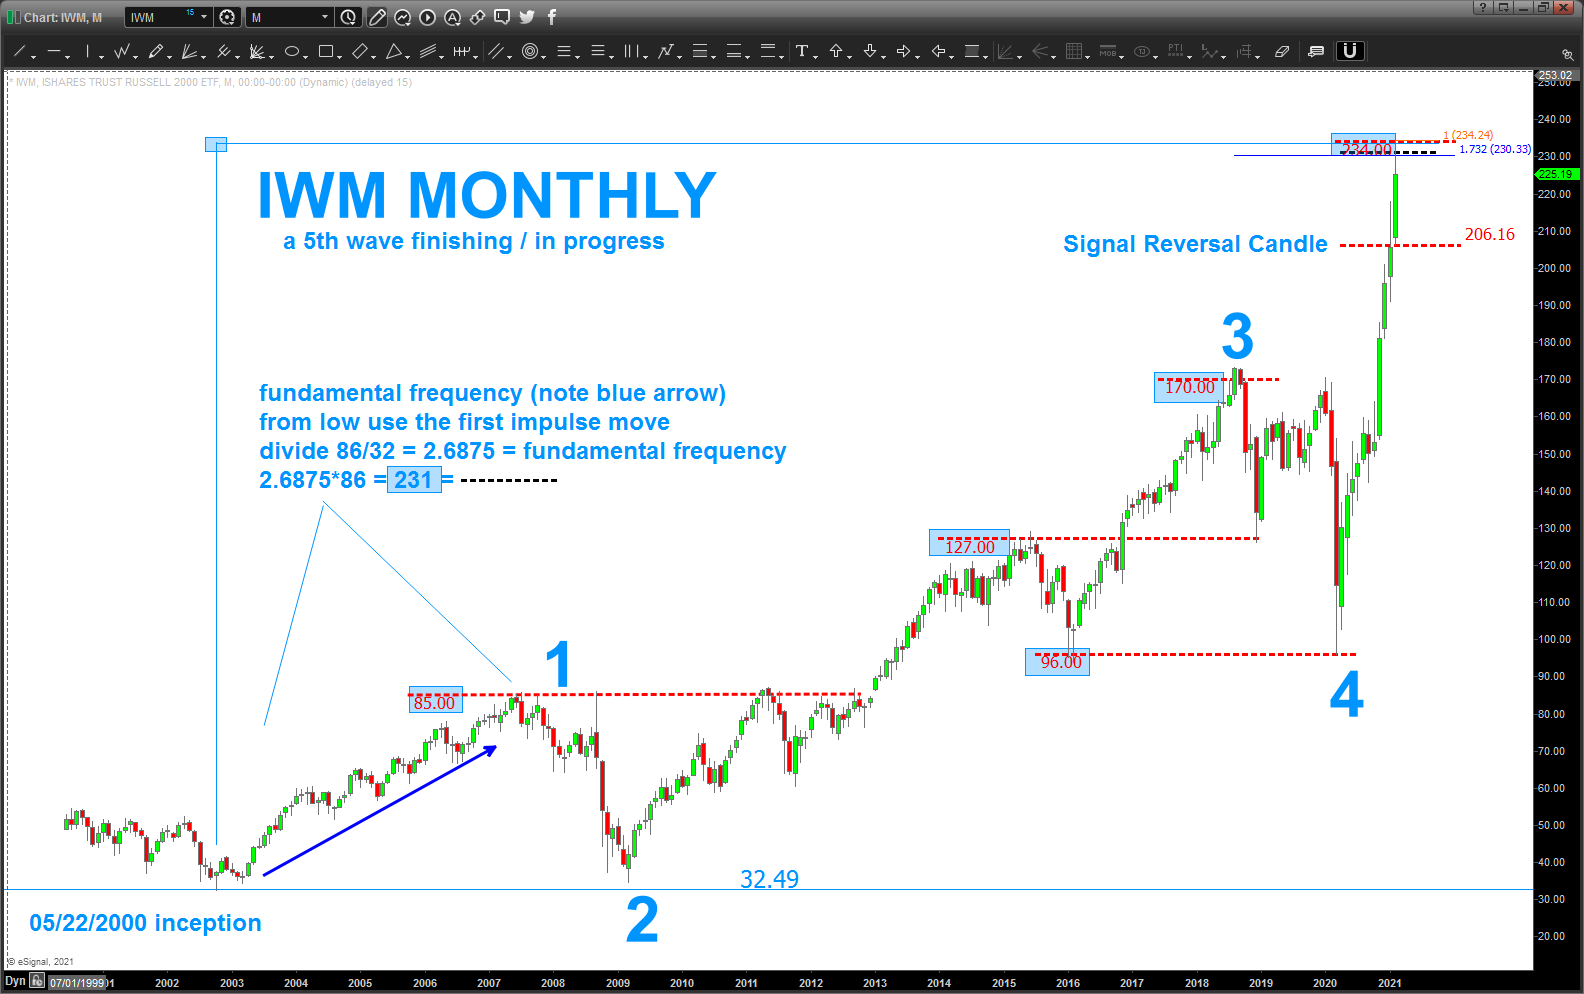
well, here is IWM.
what do I see:
- a VALID wave count that breaks no rules. I feel comfortable in saying that we are in a 5th wave …
- AB=CD or Wave 3 = Wave 5 at 234.
- 1.732 extension (daily)
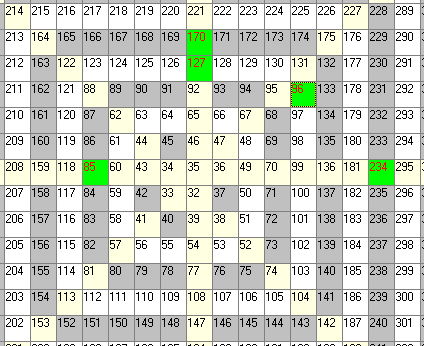
- fundamental frequency from the first impulse low of October 2002 – July 2007
- Square of 9 targets
- geometrical projection technique
Folks, a LOT of thrust into this level, so .. playing it safe here and WAITING for a signal reversal candle weekly close below 206.
A LOT OF MATH HAS BEEN HIT ON IWM …
it’s only probability and only a pattern … if it holds, ramifications are BIG.
Transports – a LOT of degrees of trend coming together … heads up
Posted on February 21, 2021 2 Comments
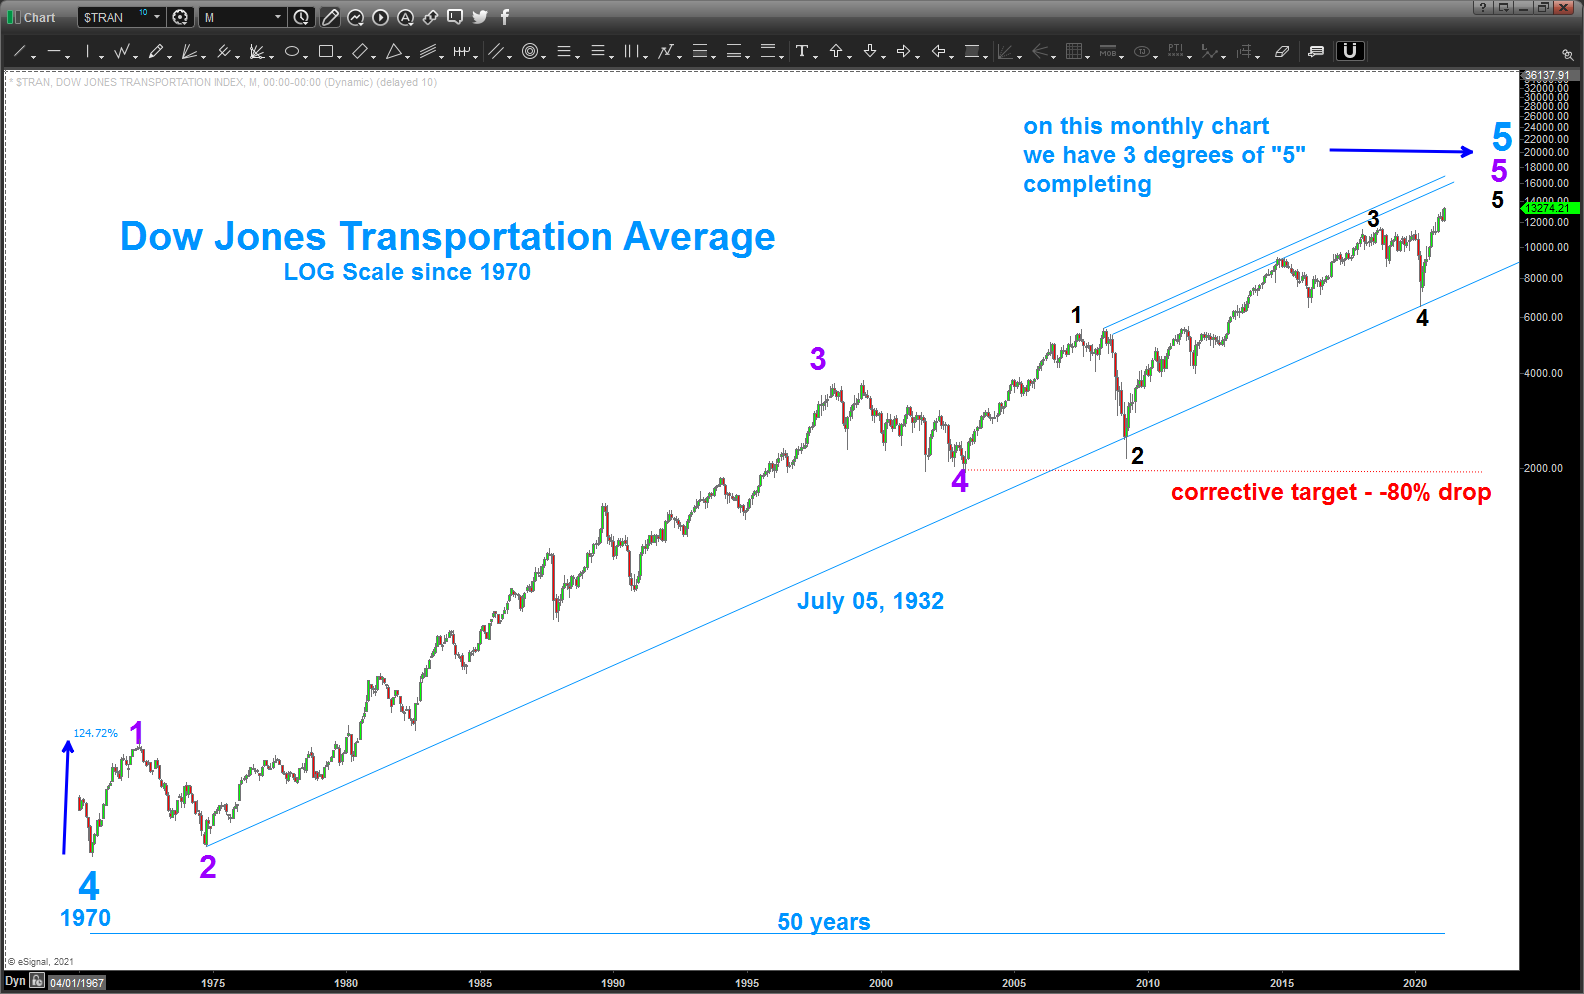
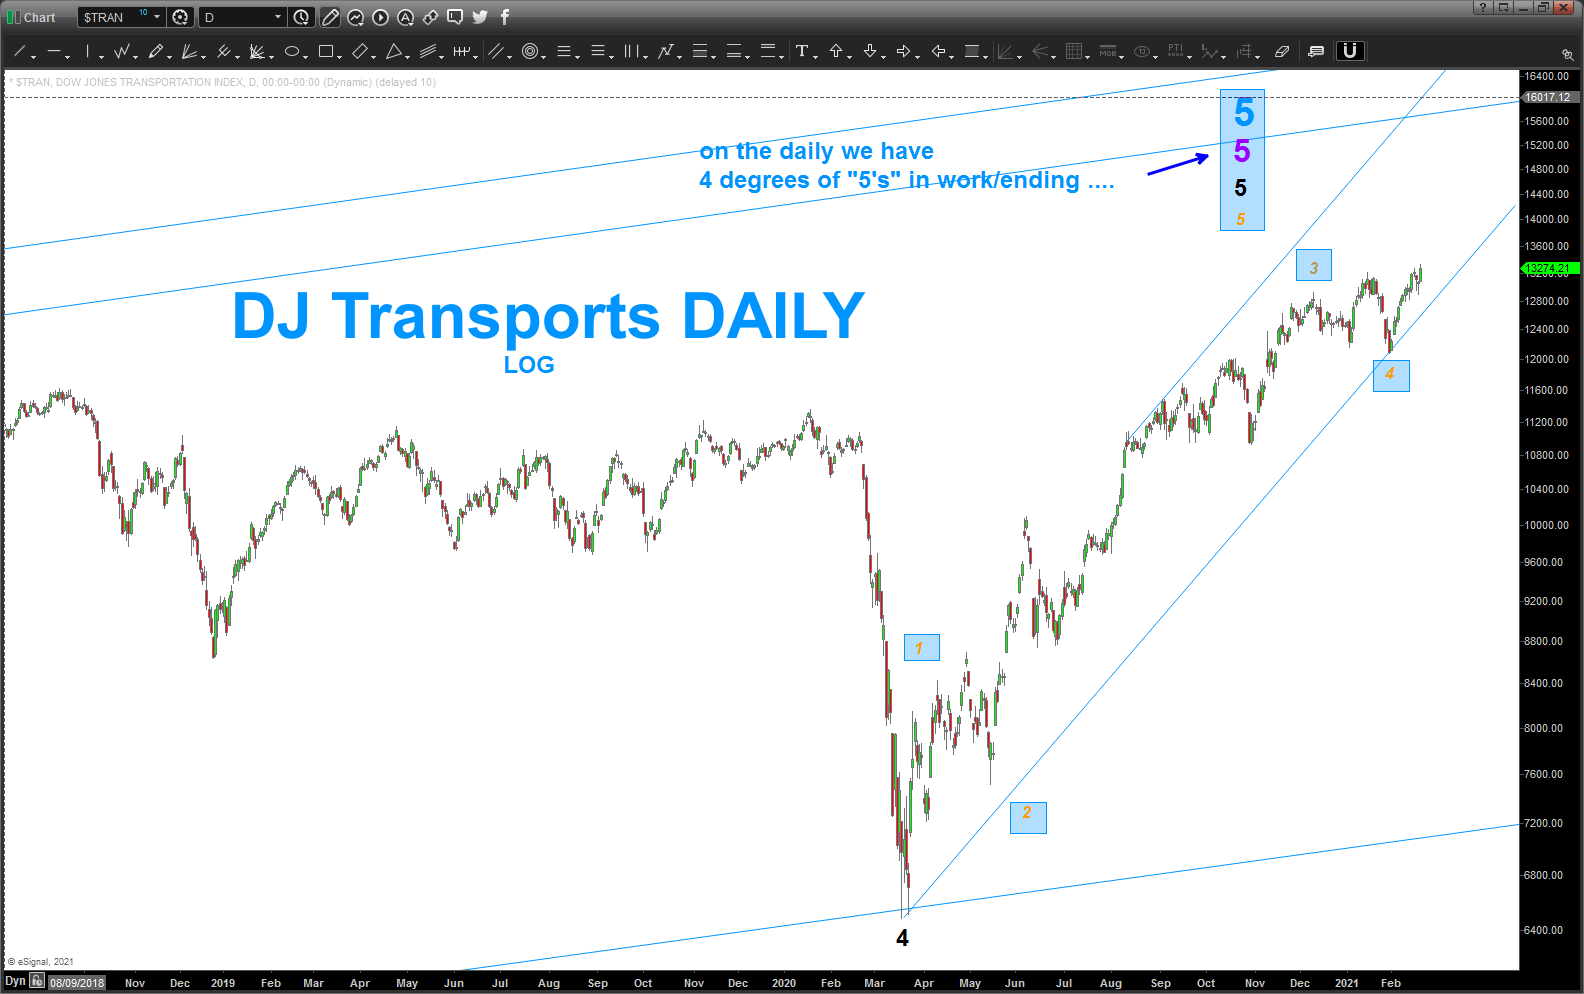
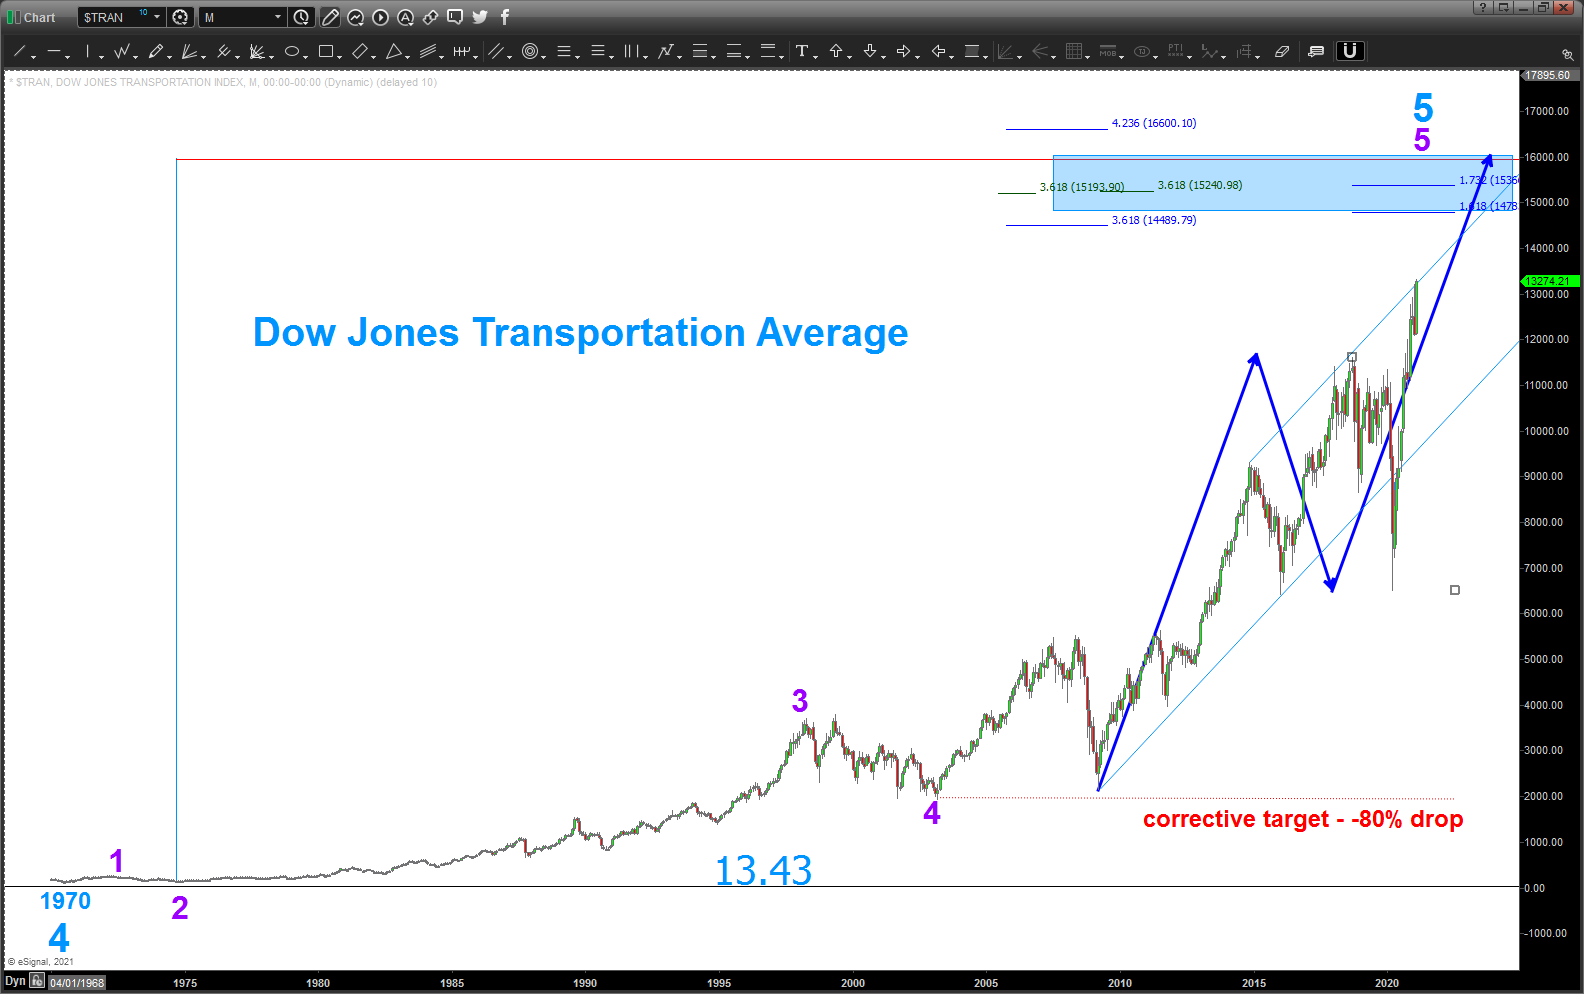
it’s time to really start paying attention to the market across the board.
in this case, there is a high probability that this count is correct. I was able to use some of the data from the peeps at http://www.elliottwave.com. I enjoy their newsletter and while sometimes too early, in the end, they have proven to be correct.
I’ve found that when my count matches their count AND we have a turning point in the Martin Armstrong cycles things do happen …
bottom line … I would fasten your chin straps and get ready for Mr. Toad’s Wild Ride … folks, I love SUP Surfing.
and, believe it or not, I see the waves and look for patterns and fractals of the waves that are coming in my Pacific Ocean playground. all I can think about is a tsunami to describe the wave that is approaching our shores. I’m not even sure if this wave is one that anybody could ride, it’s that powerful.
call me crazy, many continue to do so, but we are entering into territory that NOBODY alive has ever experienced.
Bart
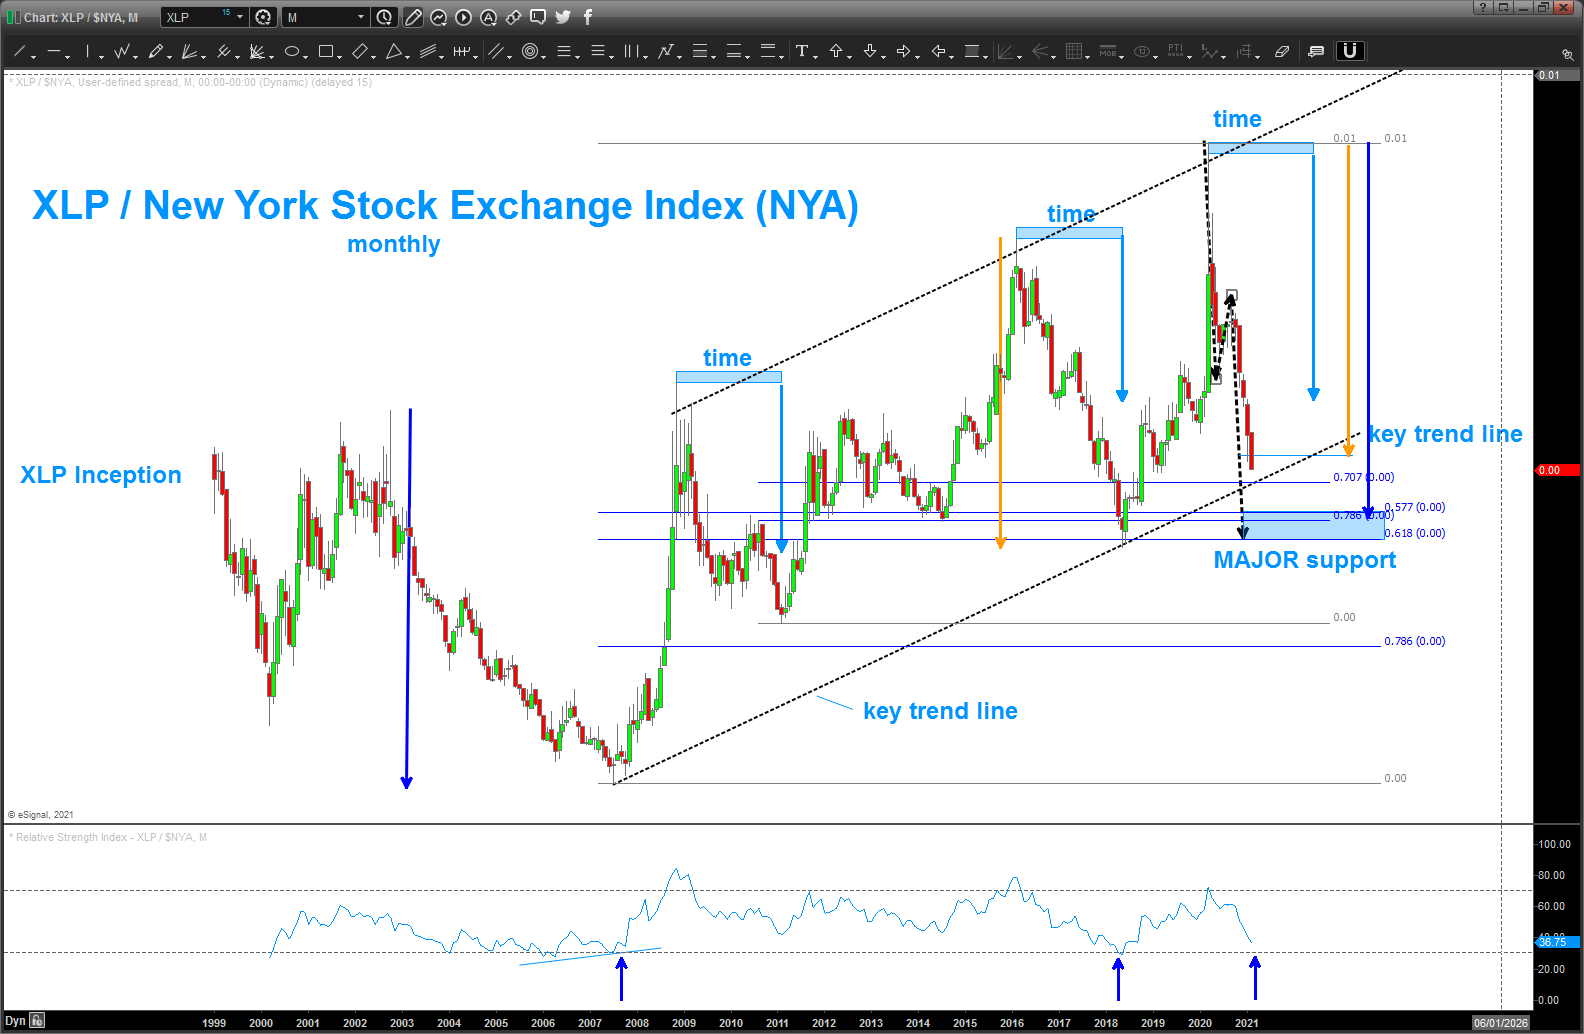
the Ratio … XLP/NYA giving us clues
Posted on February 14, 2021 1 Comment
the last time I posted about the XLP/NYA was here: https://atomic-temporary-44460632.wpcomstaging.com/2021/01/24/ratio-analysis-key-level-hit-on-the-xlp-nyse-index/
as you can see, the ratio hit this level, held and the market sold off for a couple days. the market strength the past week has been impressive and, with that, the ratio “failed” at the level indicated and, as you can see, we have a pretty big candle that is closing at the low, for now, so it sure looks like the pattern failed.
that being said, I’m not overtly bullish here, right now. note the key, dashed black line, trend line is approaching and then below that we have 3 ratio’s, an AB=CD (dashed black line) and the all important measured move from the 2003-2007 time frame. MAJOR SUPPORT for the ratio … also, of note, is the 14 period RSI is approaching a key support level …
could the market continue higher from here – of course – but there are some other sell patterns present on other indices so I’m just going to be flat/neutral here.
one last, note the TIME of the corrections .. on this leg up from 2007 the corrections (blue rectangle w/ ‘time’ written on top) has been nearly perfect and, if that is the case, then this current leg down, from a timing perspective isn’t ready, yet.
could we be at the start of a parabolic move higher? let’s wait and see what the “MAJOR support” level does before we get too far ahead of ourselves.
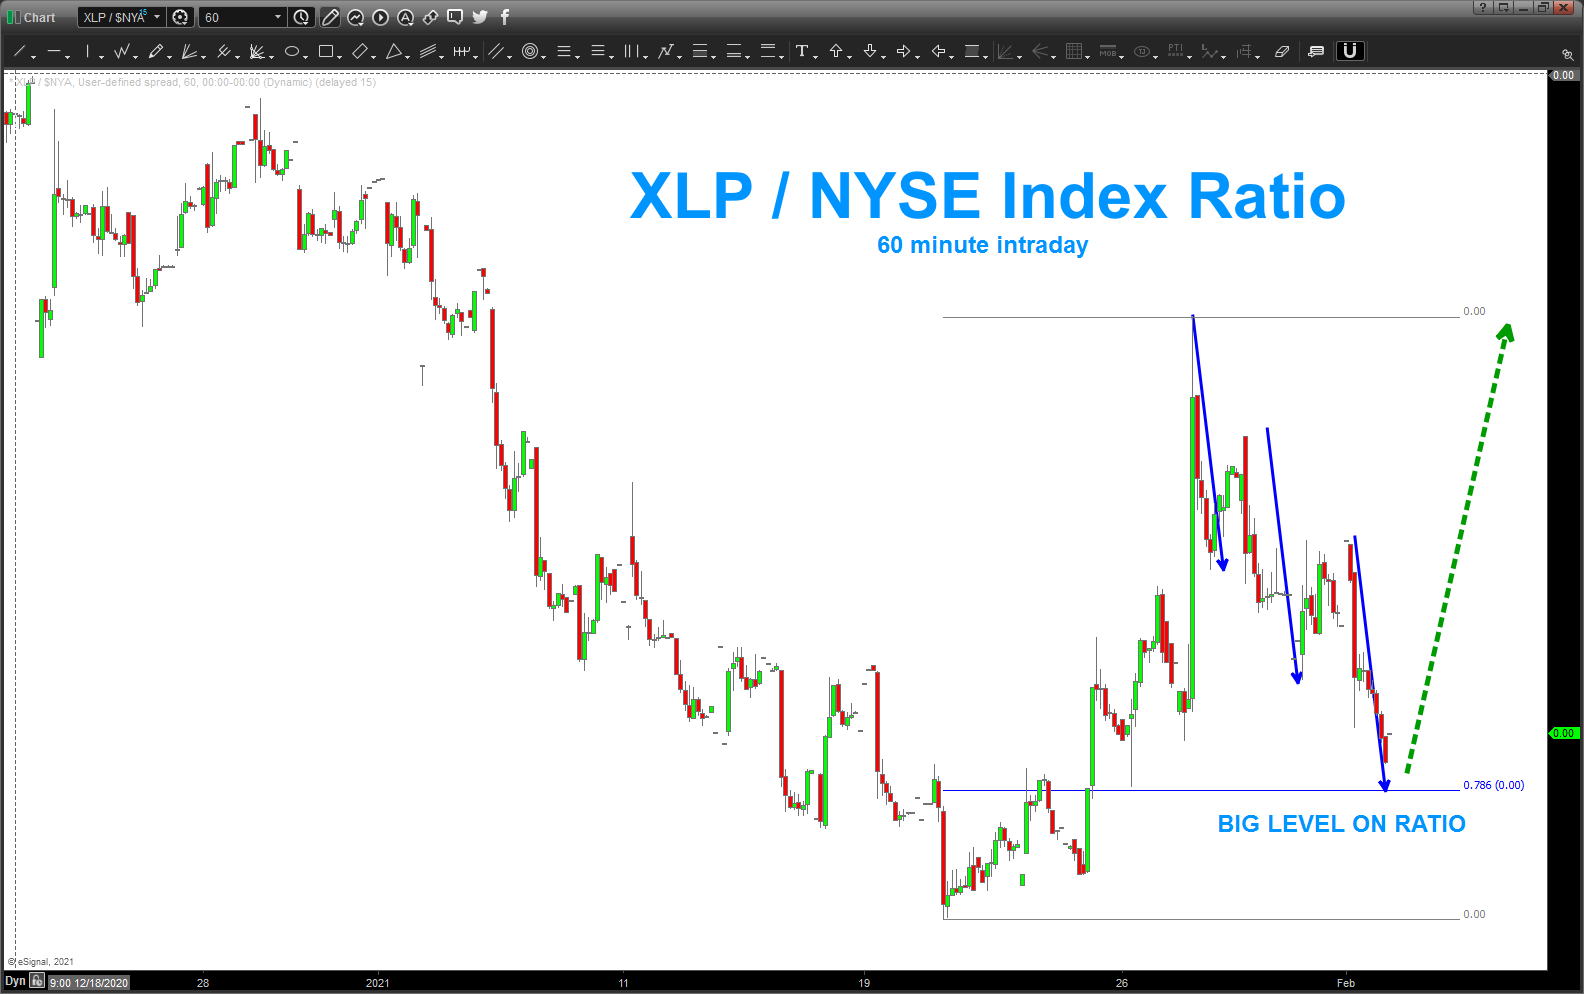
XLP/NYA ratio update
Posted on February 1, 2021 Leave a Comment
the PATTERN failed this AM and the market pushed higher. for a correction in the market to continue in earnest, you can see we need the .786 level to hold. right now, the low back in late/mid January should not be taken out to the downside w/out a little more pullback in equities.
also, note the blue measured move arrows. probability says we sell off a little if that level does get hit as it has reacted that way the past two times.