TBT – tricky
Posted on April 15, 2021 Leave a Comment
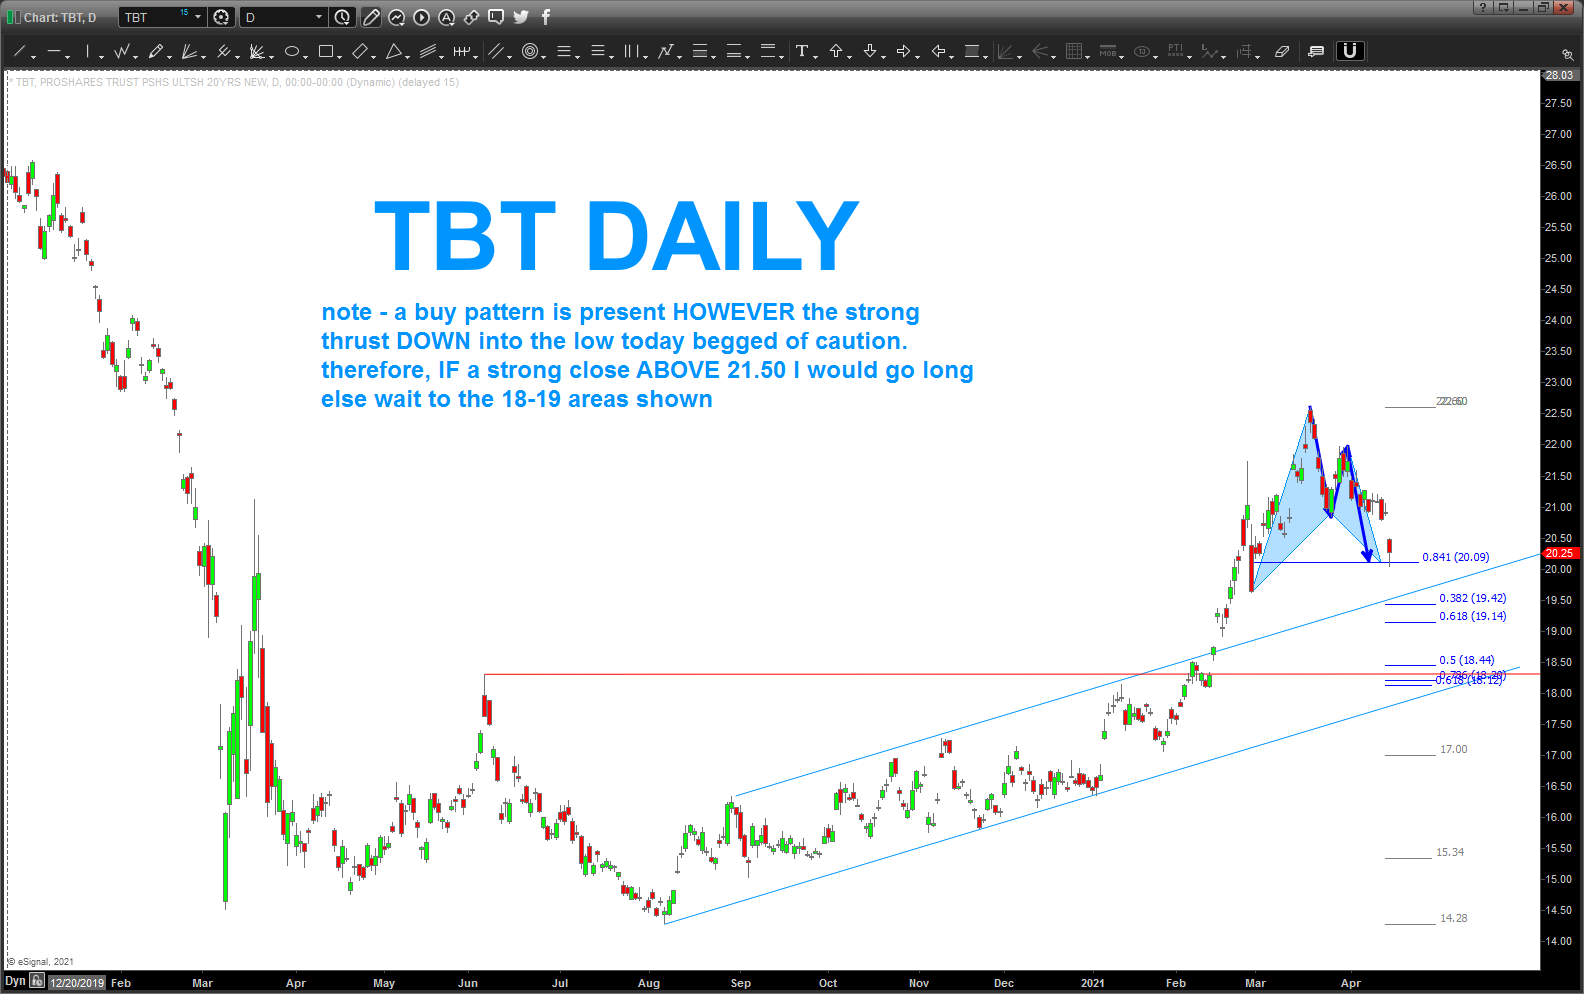
please see chart below … ultimately, it’s about risk control and how much risk one is willing to take.
our thesis is the 14-15 dollar low was a BIG low and we are very early in a multi-year (multi-decade (?)) rise in interest rates. yup, you just read that correctly …so to manage risk, one must understand that there is a potential that the trend has changed and we now have 3 different levels to enter …
here and now … GARTLEY 222 pattern complete at the low however, a nice gap down warns of lower prices. gaps into a level beg of caution …
19.14-19.42 …realistic w/ that gap down and lands basically on the top of the channel w/ polarity in play.
18-18.50 .. a lot of ratios and polarity principle (red line) … that looks good.
so, if the low today was the low but you don’t like the gap down then WAIT for a daily/weekly CLOSE above 21.50 for confirmation and BUY or if you do not think the low was today then WAIT for the two levels below.
either way, risk is basically in the 16-17 former cluster or the low at 14.28. that’s the true support zones. the lower breaks then the entire thesis is 100% wrong.
Global Dow target hit
Posted on April 15, 2021 1 Comment
last post on Global Dow: https://atomic-temporary-44460632.wpcomstaging.com/2021/01/10/global-dow-9-10-higher/
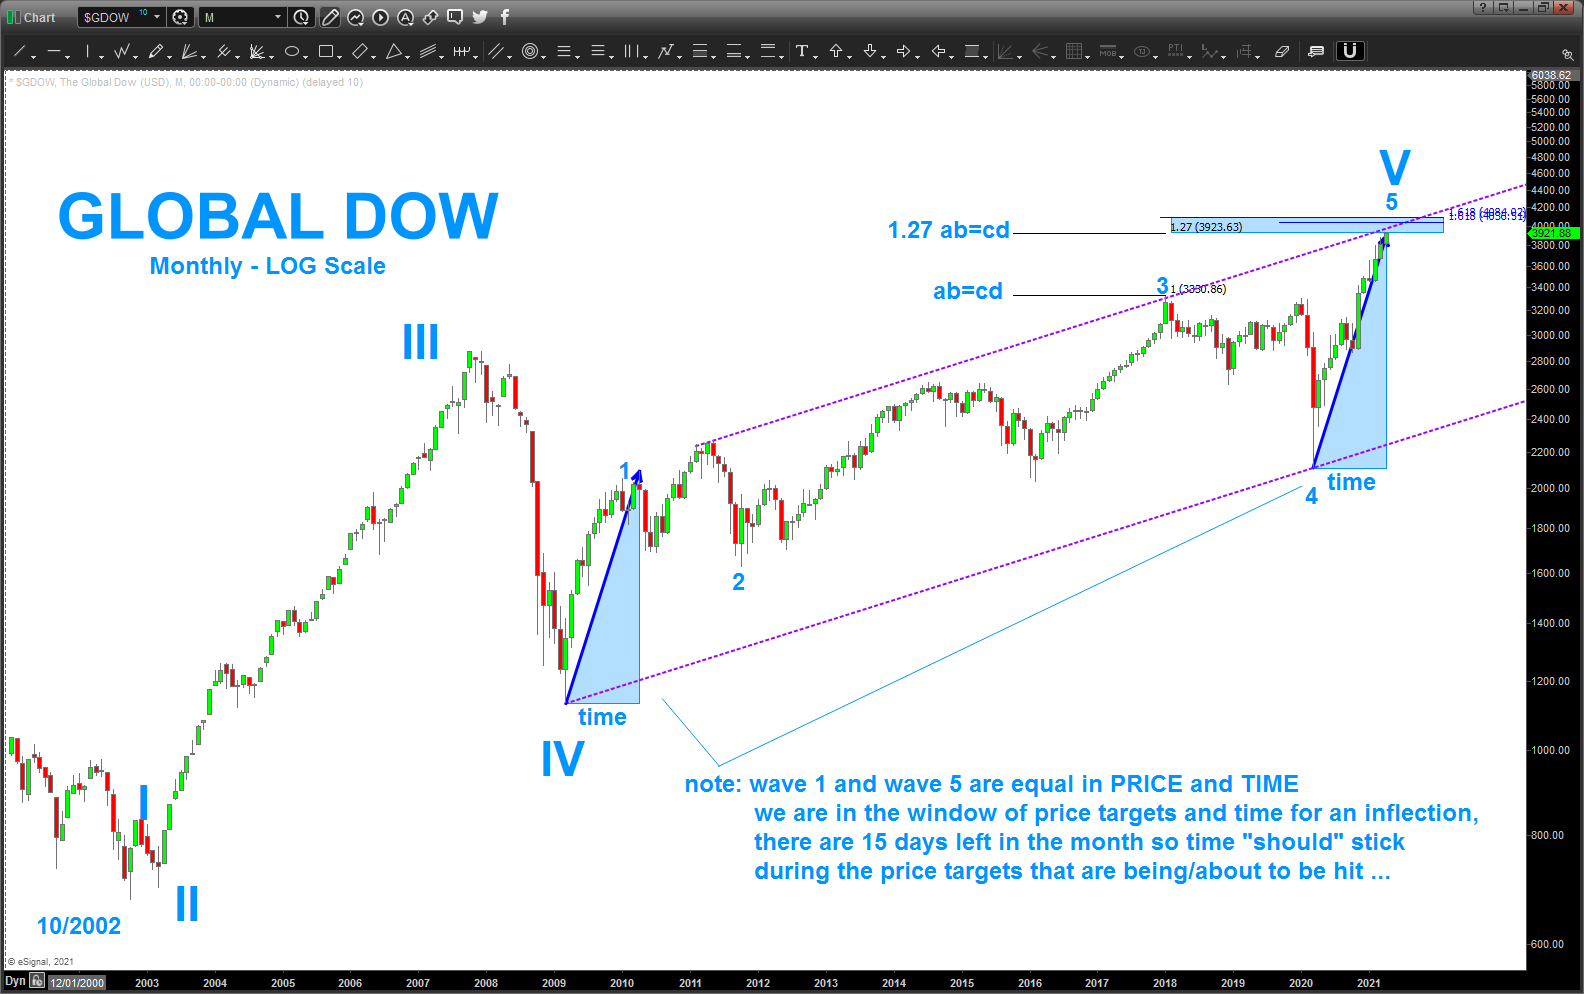
note PRICE and TIME of the wave 1 and wave 5 in this wave starting from 2009.
we are attacking the target zone for an inflection – now.
stay tuned
BITCOIN update
Posted on April 13, 2021 1 Comment
last post on BITCOIN: https://atomic-temporary-44460632.wpcomstaging.com/2021/03/26/bitcoin-futures/
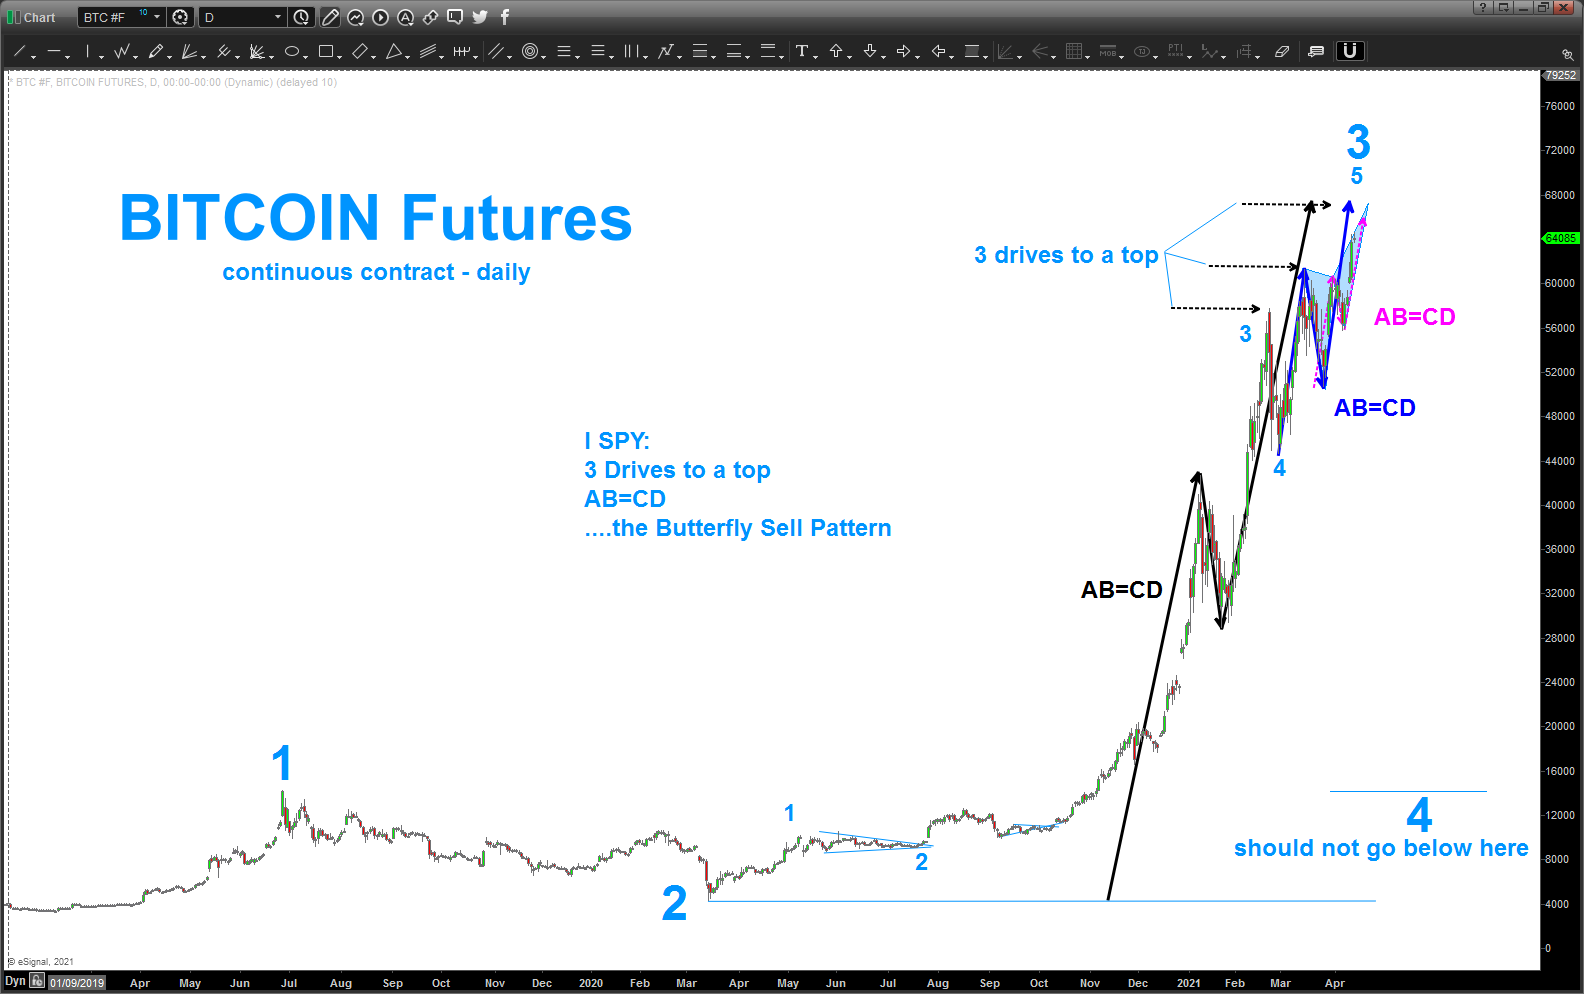
Bitcoin has made, as expected new highs and there is probably some more to go … that being said, the count has worked thus far so I’m sticking with it. always open to get the eraser out, as many of you know, but for now we are advancing in the 5th wave of a bigger wave 3.
I closed my position at 57k and have been sitting on my hands TRYING (it’s hard) to not be greedy and let the waves come to me …
as many of you do and some of you don’t I absolutely LOVE SUP Surfing and I had a board member from my non-profit (www.thesupvets.org) in this weekend and he said it was his “best day of surfing – ever.” peeps – it was amazing.
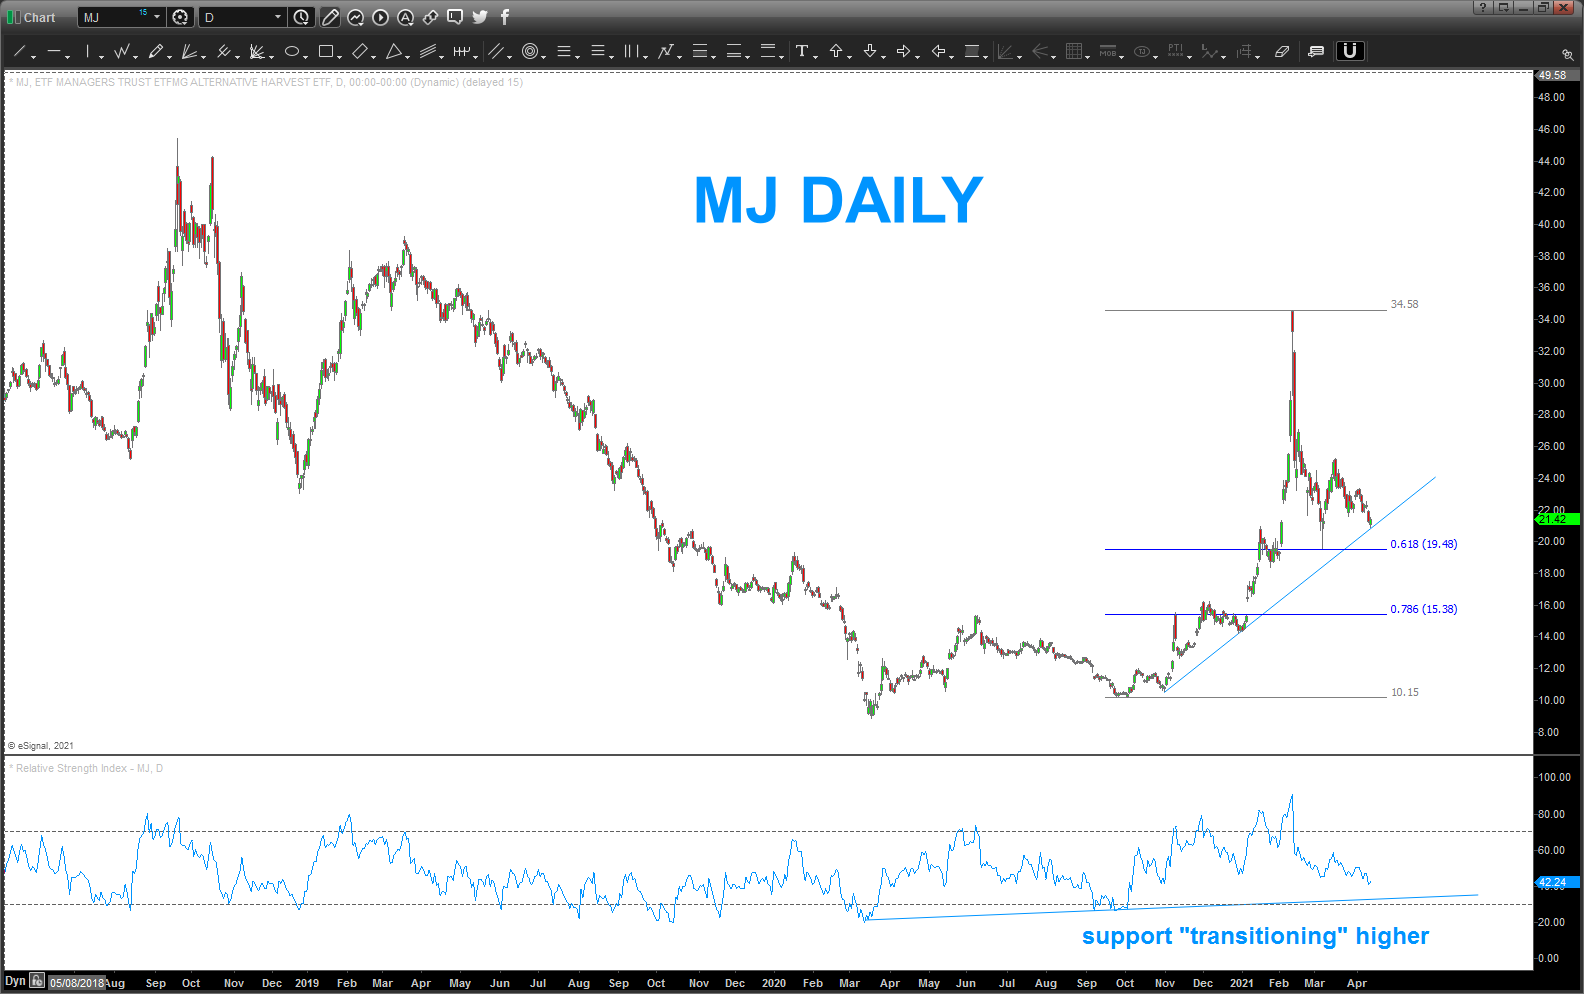
why? reading the waves on which one to take, which one will clobber you (there were plenty of those and which one is a better L or R, etc. same thing goes w/ the market. it’s all number, vibration and … well waves. the chart below is the bigger picture – updated w/ an RSI and commentary. so far, the “set” coming in looks like it could be ridden.
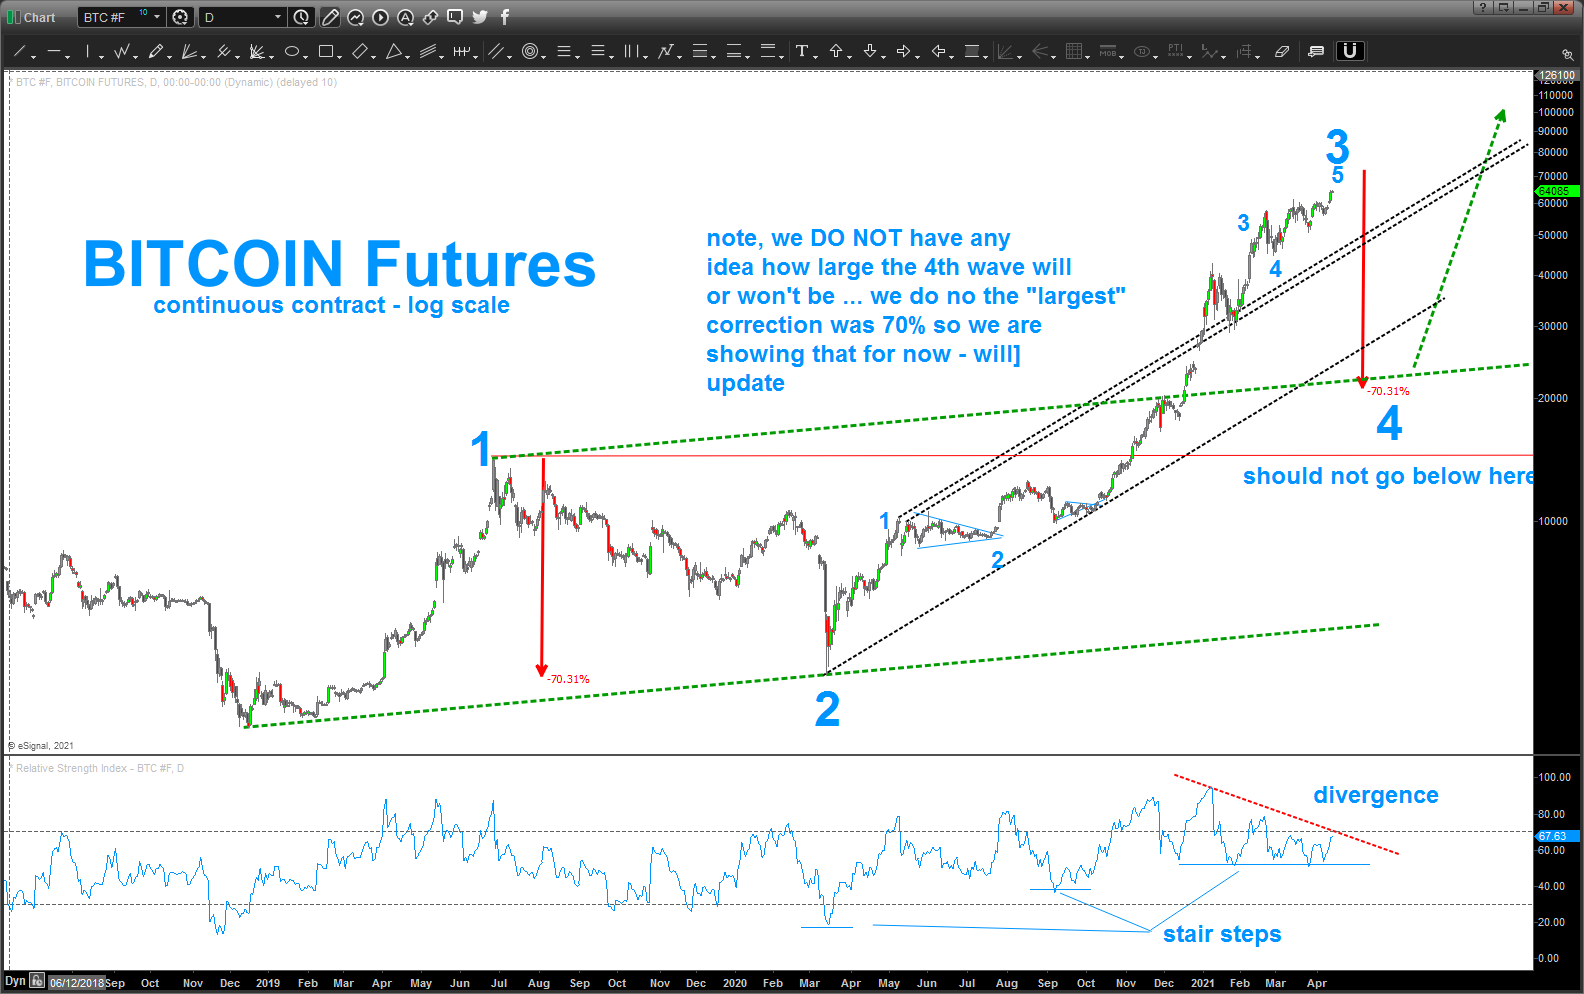
what do I see nearer term(note: trade what you see, not what you believe)is the following:
- RSI: note the stair steps higher, in the bigger picture chart above, as this is the “transition” technicians see when the RSI finds new zones of support and resistance that correspond to a bull or a bear case. in this case – bullish longer term but we also have bearish divergence (new highs in price and lower highs in RSI) that is present in the 5th wave advance of a move … key. so, we can see bearish divergence that corresponds to a 5 wave count and, of course, PATTERNS.
- the chart below is, frankly, a work of art. the synergy that is coming together is remarkable. we have, pretty much, ALL OF THE PATTERNS COMING TOGETHER in/around 66-67. AB=CD, 3 drives to a top and a BUTTERFLY SELL Pattern. WOW.
- so, all this means is this level is REALLY important. if it holds we’ll probably get a BIG correction (the one I’m waiting for) OR BITCOIN WILL EXPLODE HIGHER. it’s just a pattern but man is this one important.
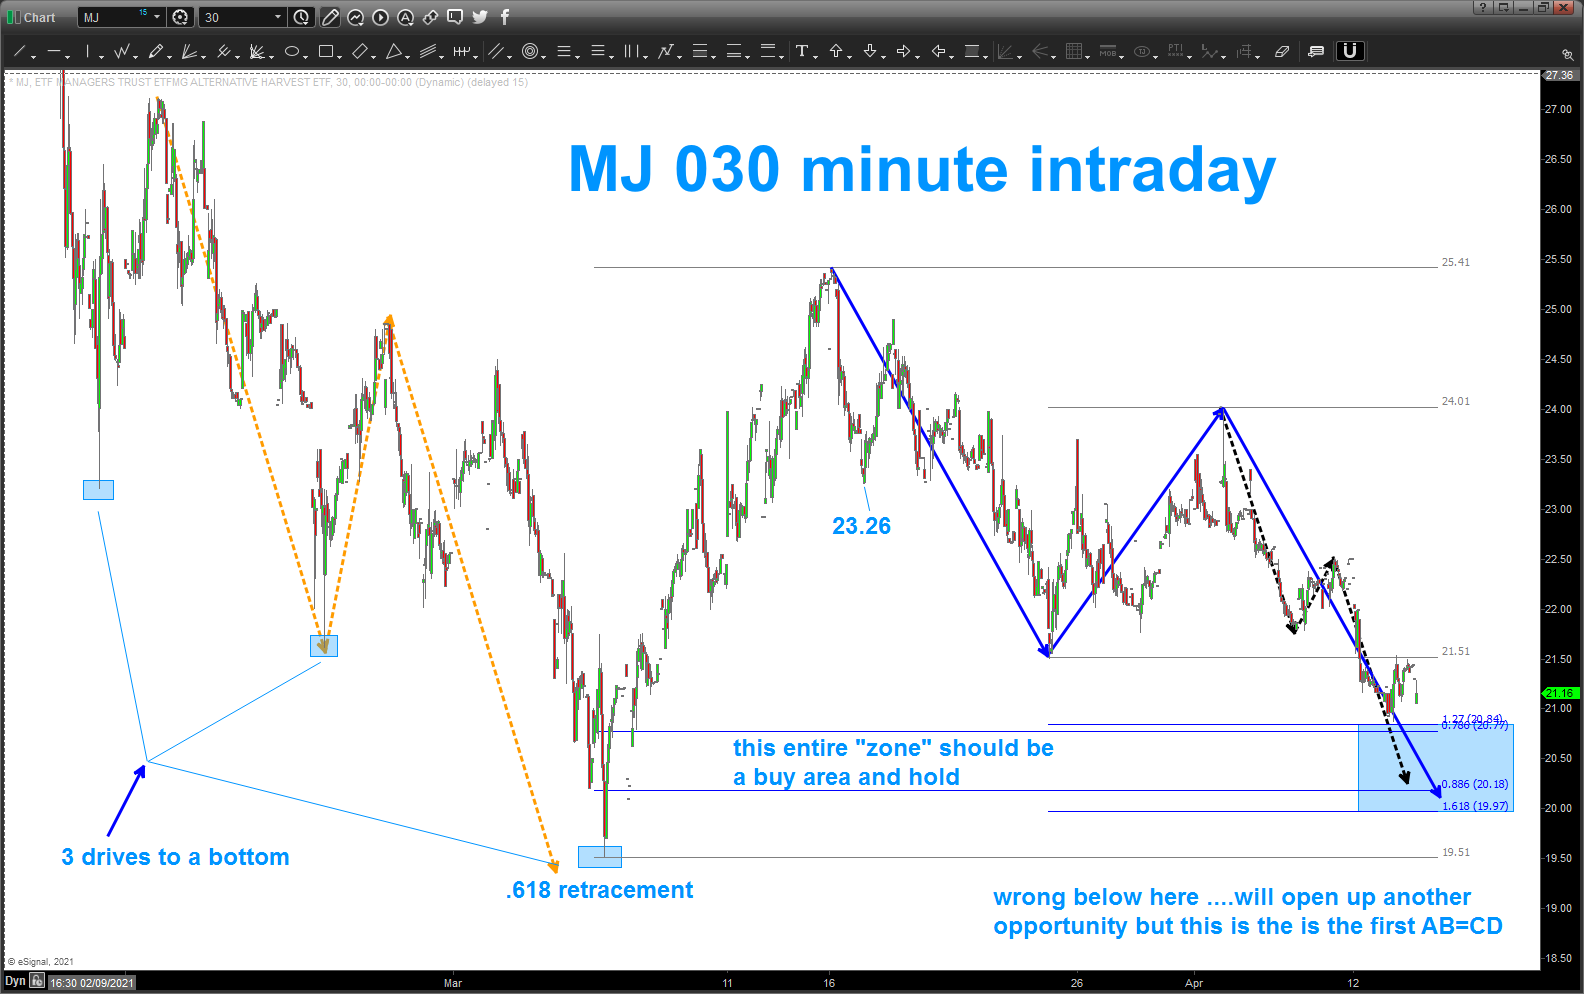
MJ – Alternative Harvest
Posted on April 13, 2021 1 Comment
explosive move upward, 3 drives to a bottom into the .618 retracement and now the AB=CD. taking a crack at LONG MJ in/ around here or the entire 20 price zone and wrong below the low of 19.51.
not a bad risk/reward
EURGBP update
Posted on April 8, 2021 Leave a Comment
last EURGBP post: https://atomic-temporary-44460632.wpcomstaging.com/2021/04/01/eurgbp-2/
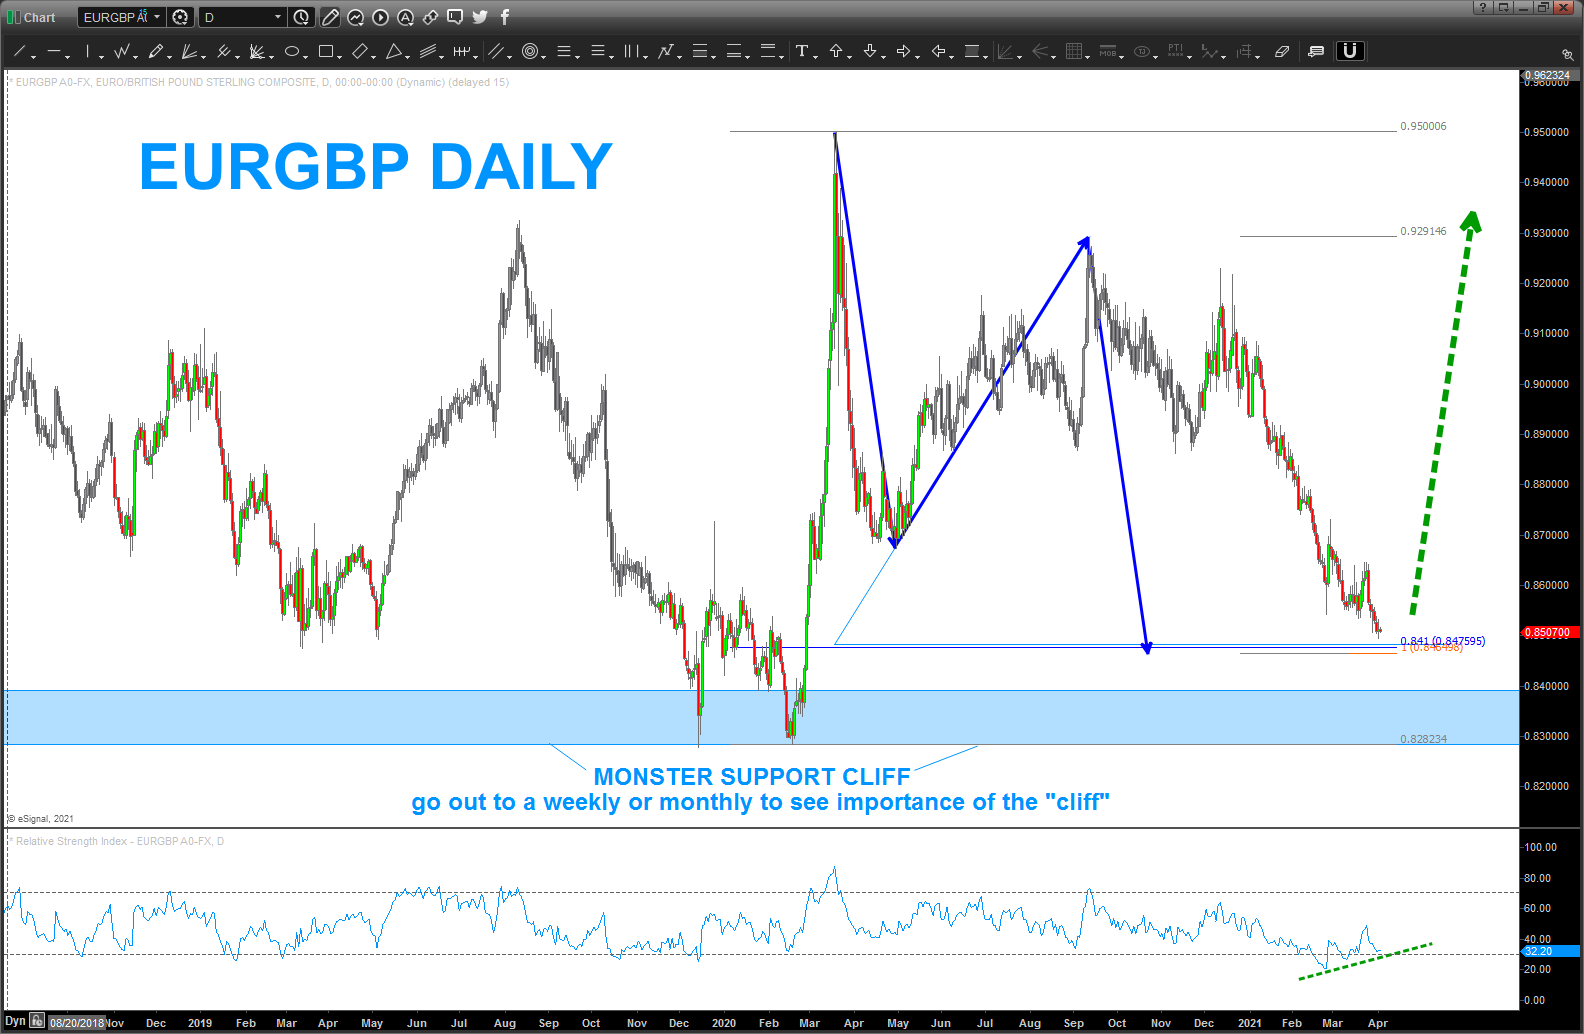
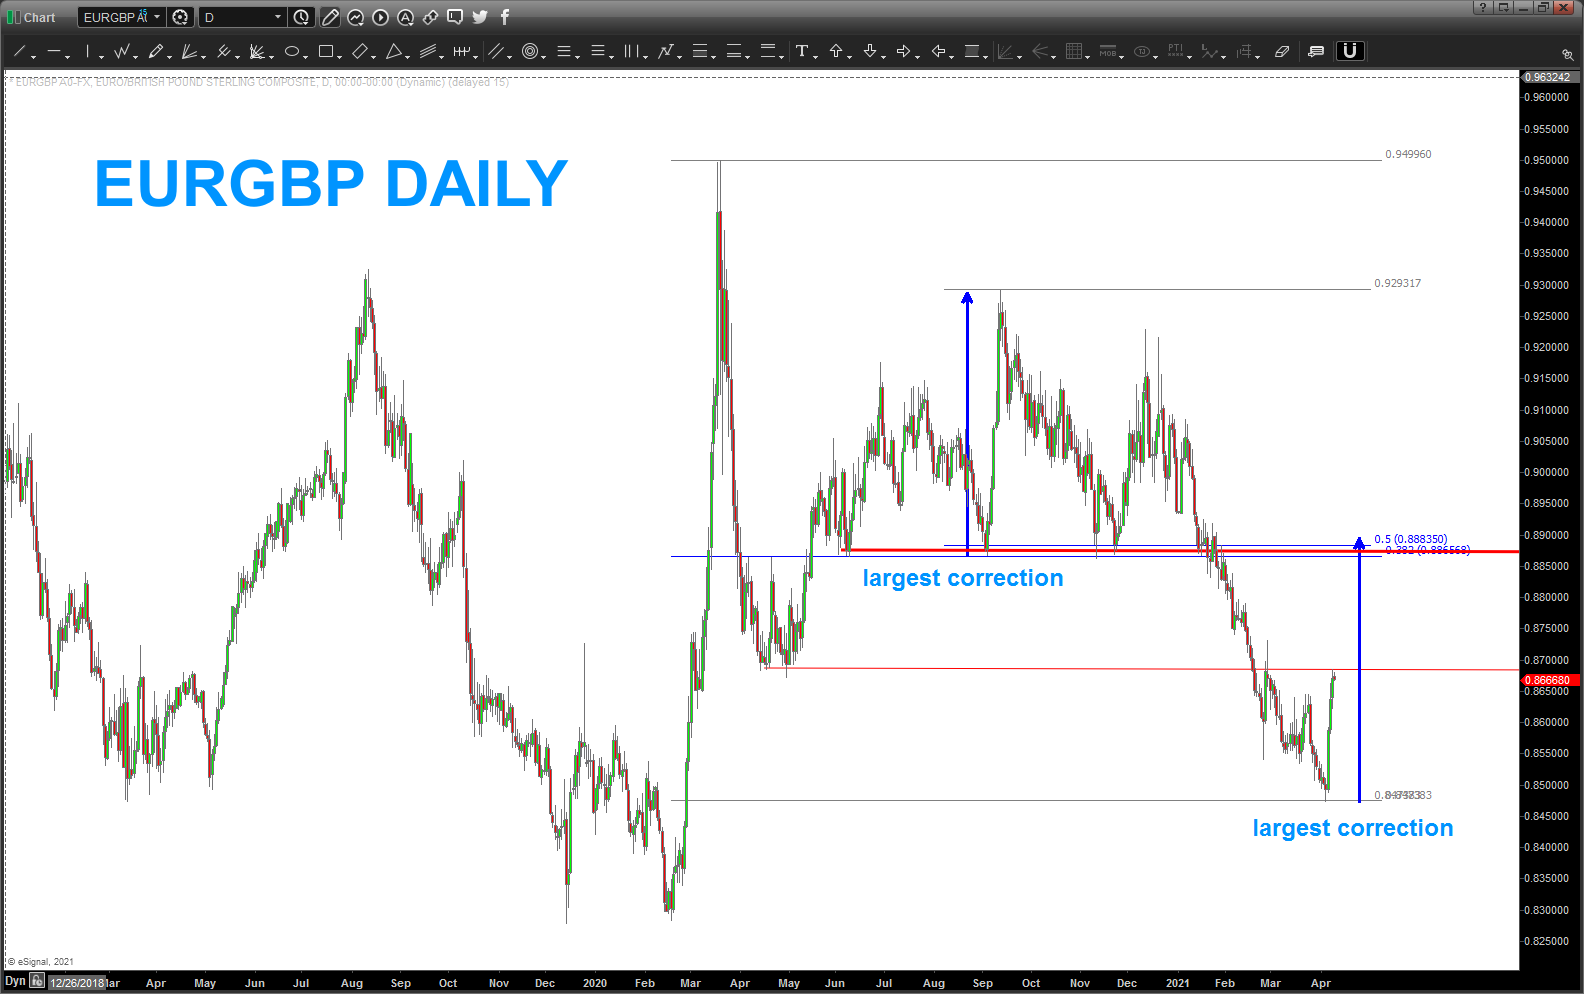
at this point, to protect a position, if you have one open, move stop to entry level at .8475.
you can see the “polarity” principle in play where the support in the spring of last year is now acting as resistance in the spring of this year …. hmmmm.
anyhoo … I’m looking for an initial target to take some off in/around 8850.
note the 38.2 and 50% retracements, largest measured move correction (dashed red line) and he polarity principle again but this time highlighted by a darker/bolder red. why? this level held as support for MONTHS and when it finally gave away, it gave away big …
note, depending on the form of the correction (if it even stops here) I might be looking to add on a pullback into the 8550-8600 area.
Uber Update
Posted on April 7, 2021 Leave a Comment
last post on UBER: https://atomic-temporary-44460632.wpcomstaging.com/2020/12/02/uber/
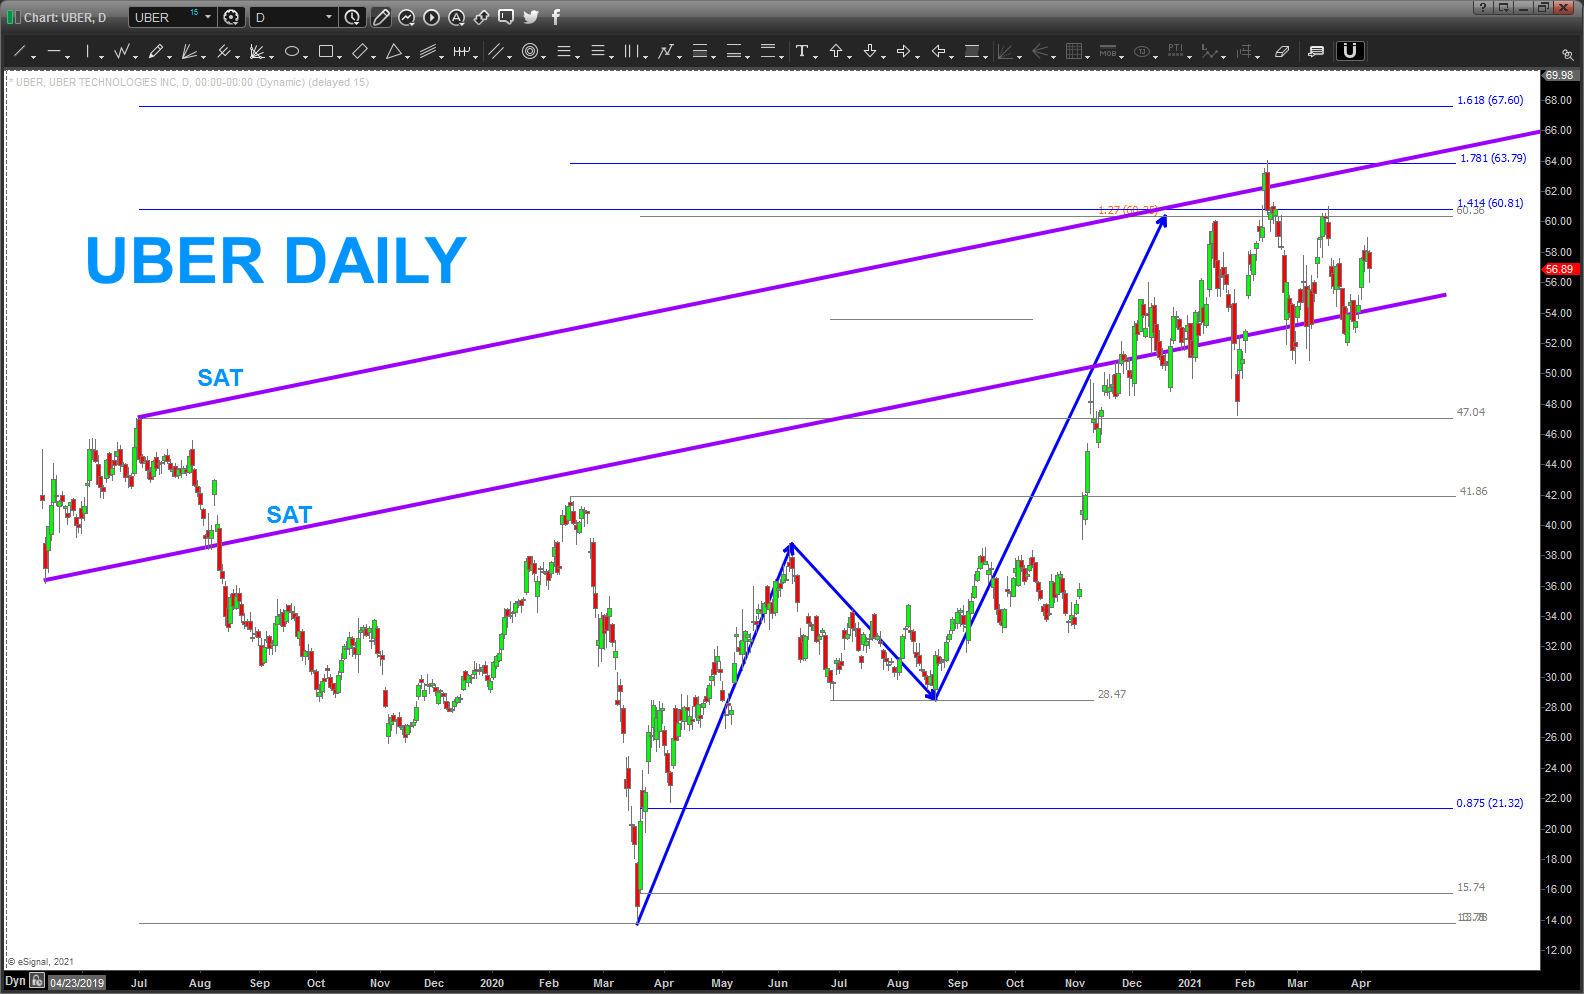
taking a look back at Uber we have reached the objective discussed a couple months ago ” in the low 60’s”
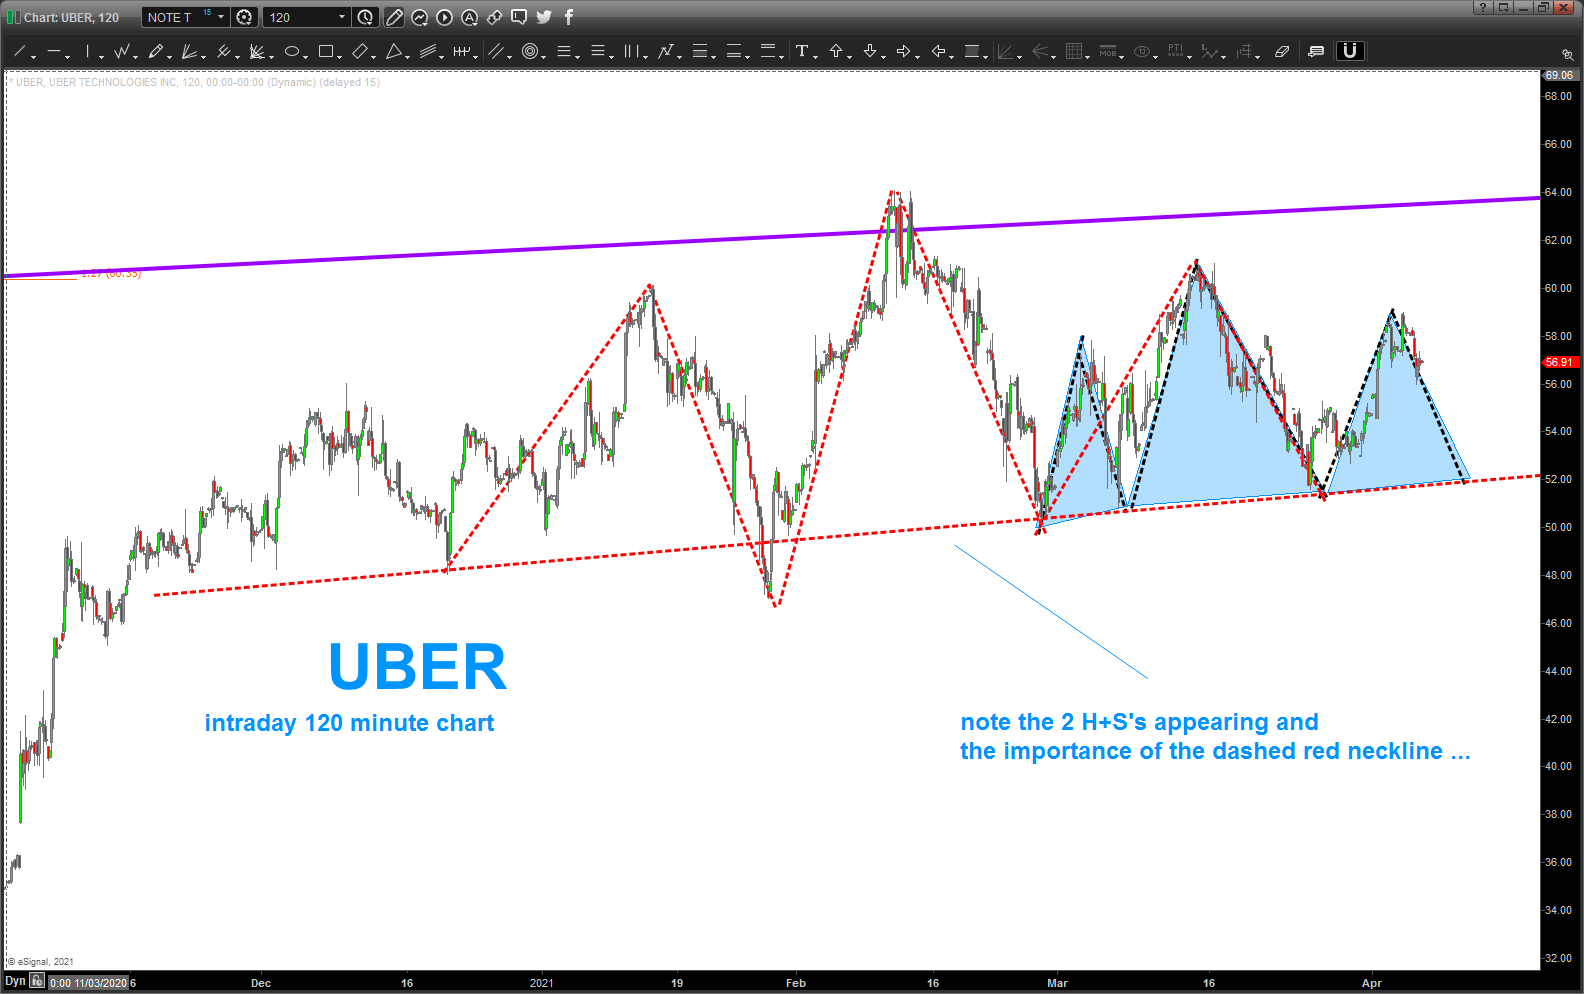
note the SAT trend line .. yes, that is SATURN HELIOCENTRIC. Nice little band it’s been banging into from a support and resistance perspective … certainly looks “toppy” and one could easily draw “another” H+S formation from the beginning of 2021 and most recently … key neckline as shown below.
taking profit and cutting and running
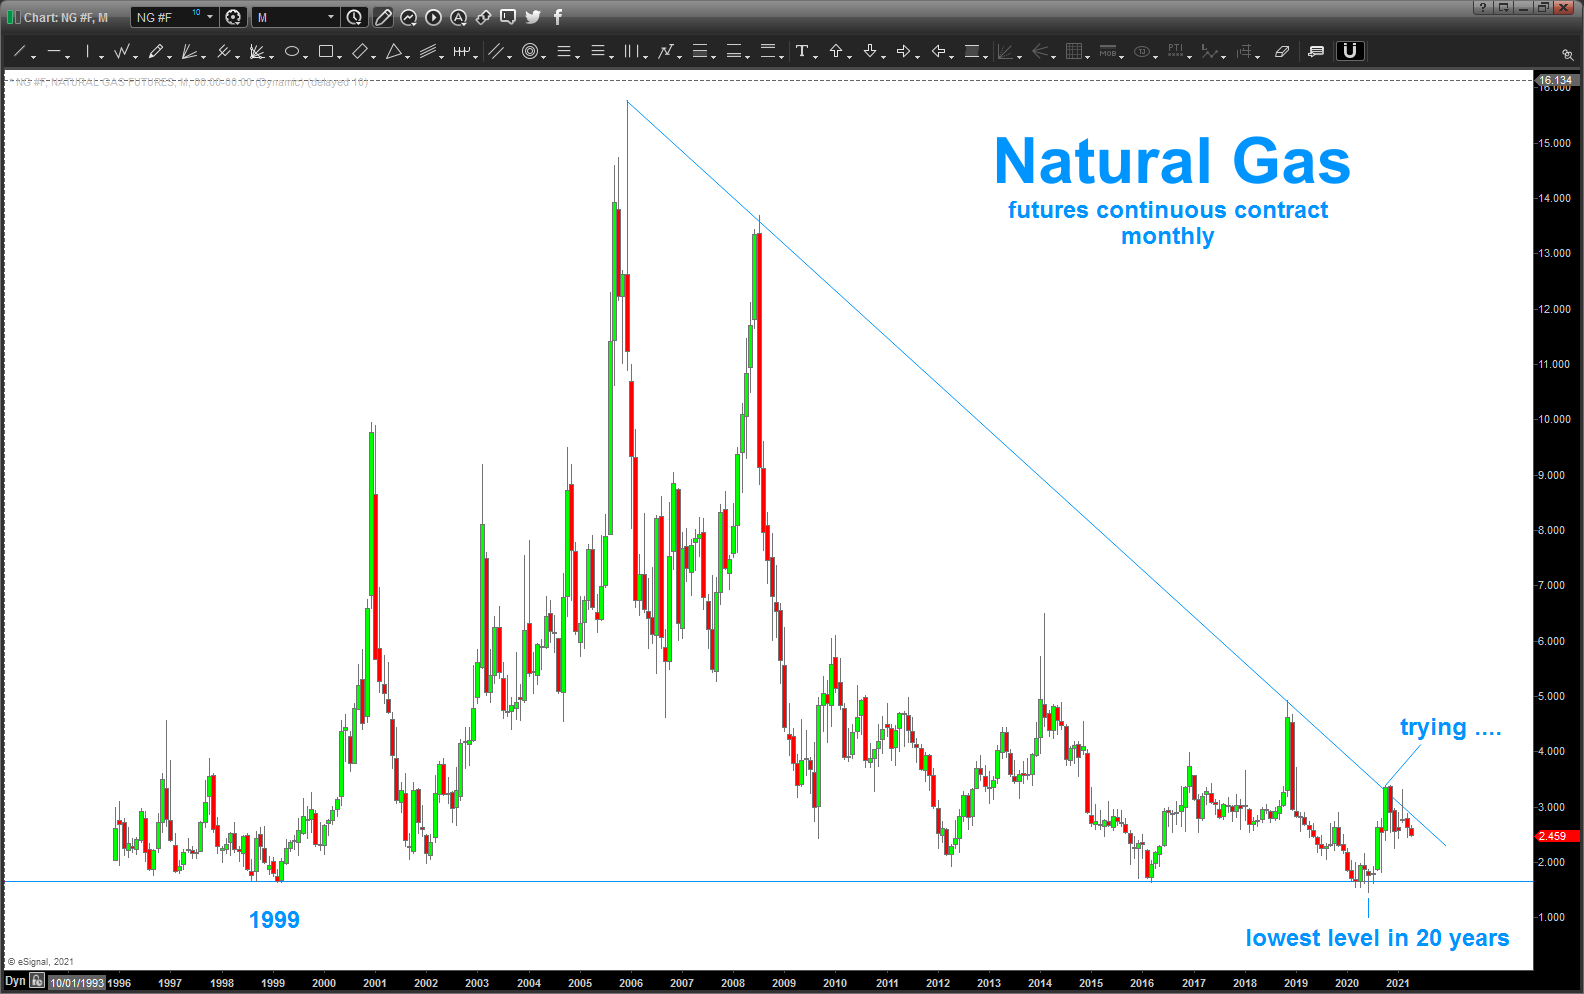
UNG/Natural Gas Update again …
Posted on April 6, 2021 Leave a Comment
last post on Natural Gas: https://atomic-temporary-44460632.wpcomstaging.com/2021/03/14/ung-nat-gas-update/
I’ve had a couple people text me over the past couple days regarding Natural Gas and UNG.
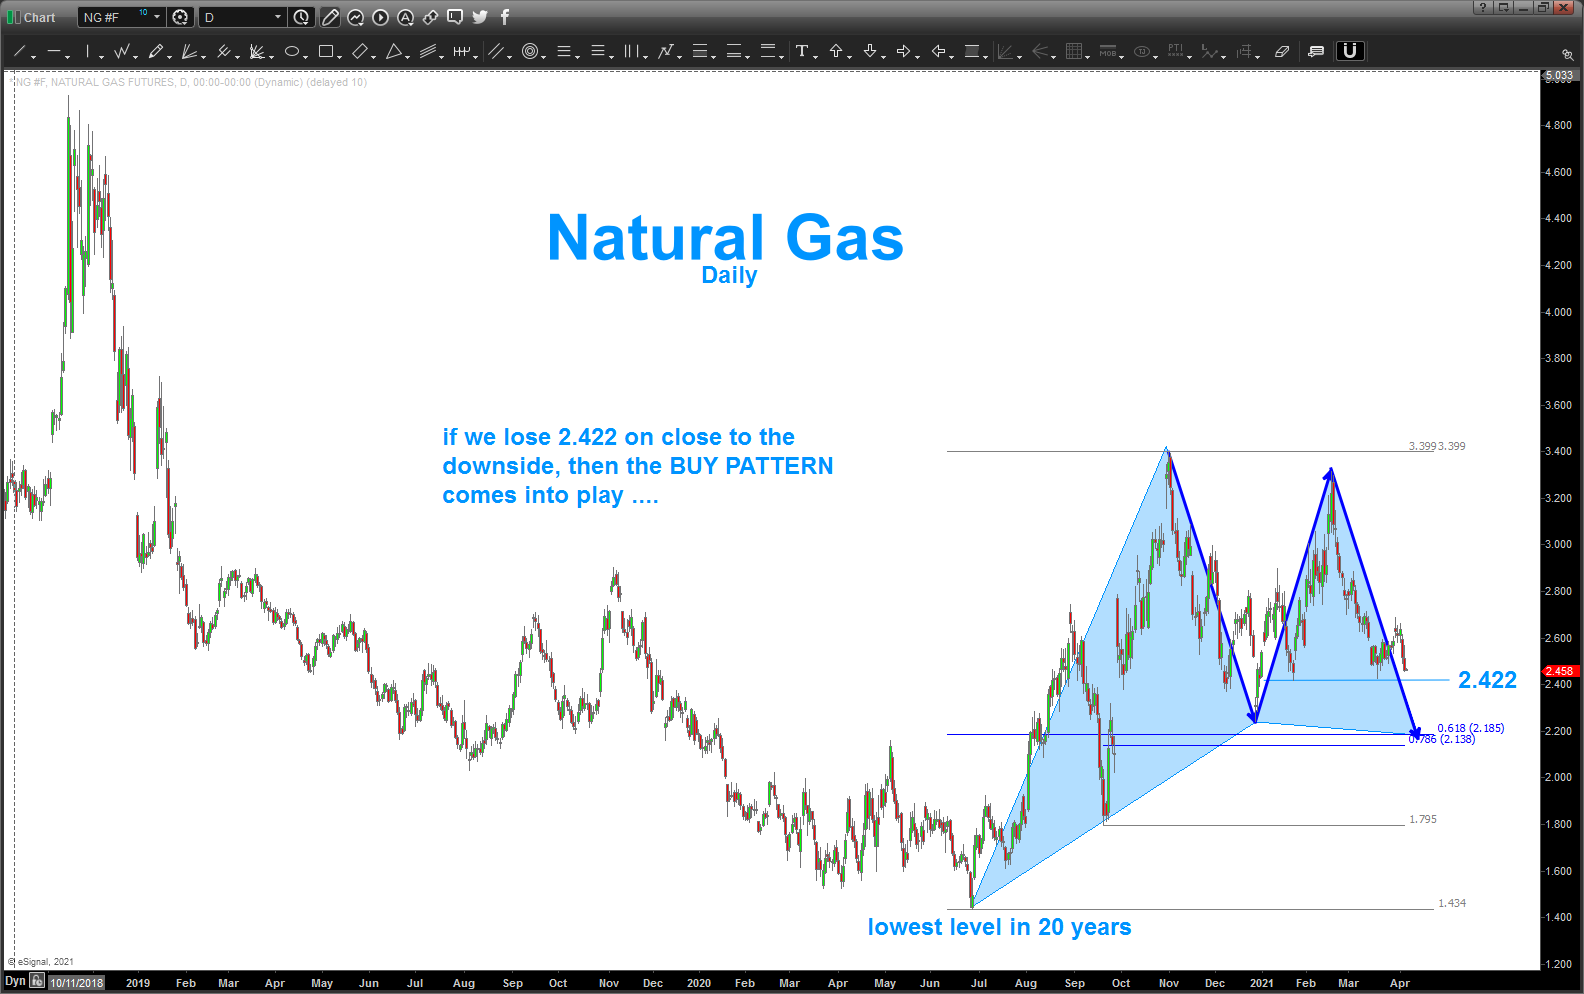
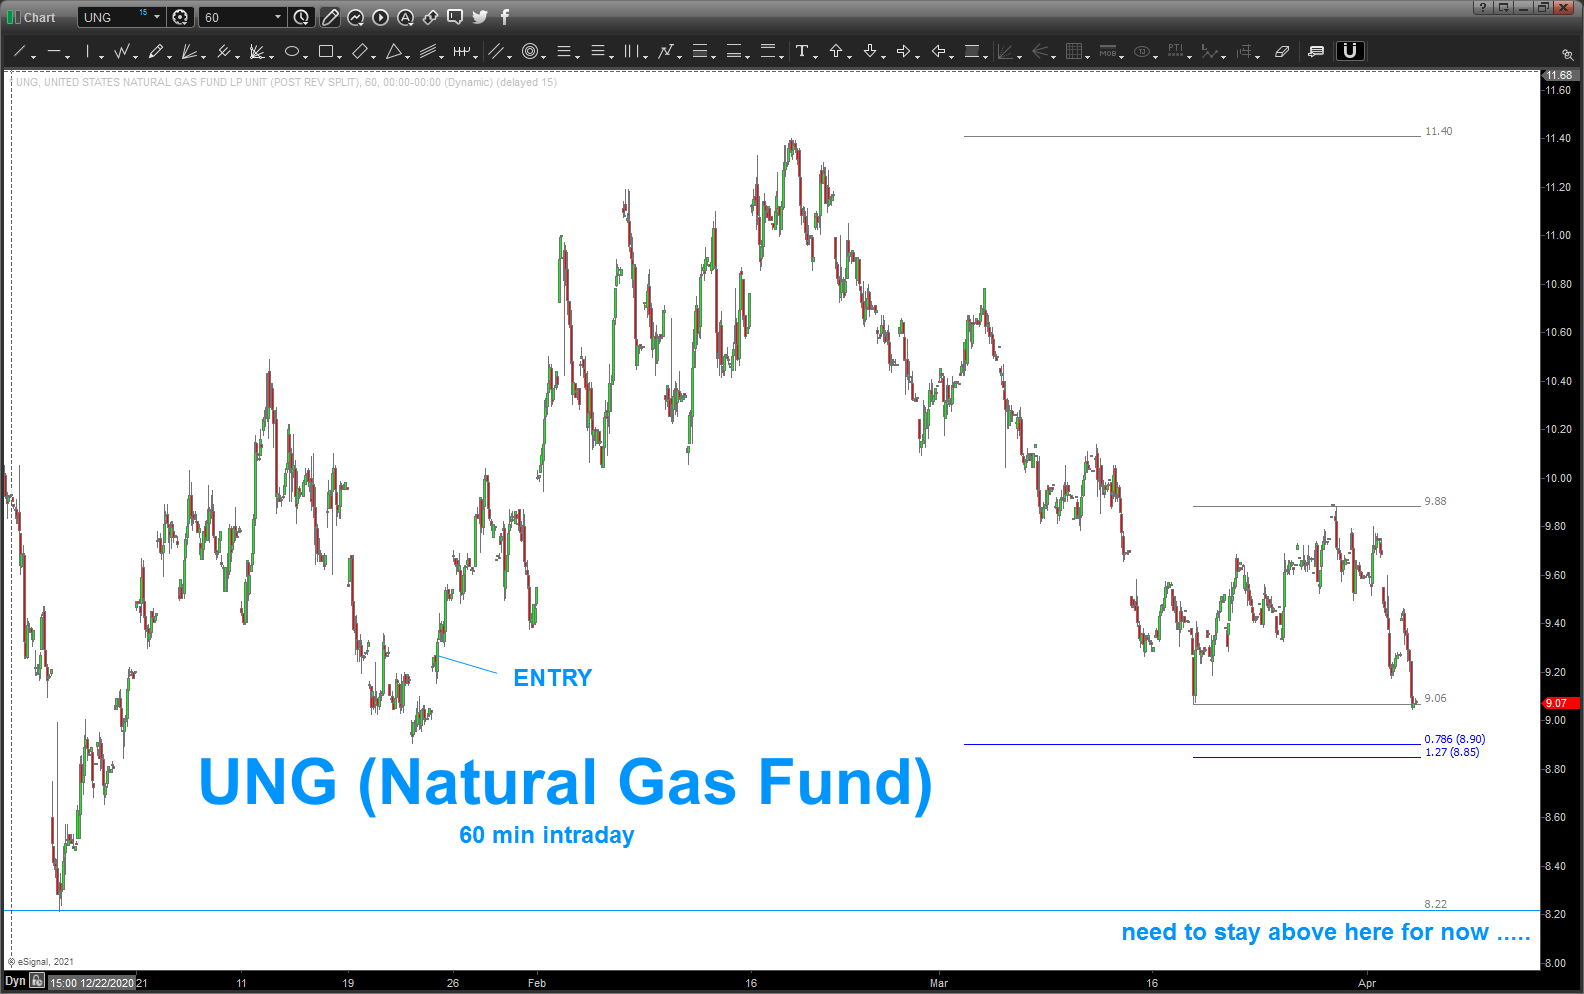
well, right now UNG is definitely a dog and I went a little red today but I’m going to stay w/ this one because 1/ this is a LONG TERM play and 2/ I’ve been watching a SUPERB BUY pattern on the Natural Gas futures as shown below.
certainly looks like it wants to go down and tag that level … I’ll hold LONG UNG until that level is tagged. it DOES NOT need to go down there but it’s a valid pattern BUY ….until that level is taken out to the downside on a daily/weekly close I’ll remain my bullish outlook on Natural Gas.
will I add to my position w/in UNG if it goes down and tags that level … NOPE. as a pattern recognition investor/trader I have been taught to never add to a losing position. so, I’ll WAIT for it to become positive before ever thinking of adding anything and if it blows thru the BUY PATTERN to the downside then I’ll take a loss. that loss NEVER exceeds 3% of the total trading capital.
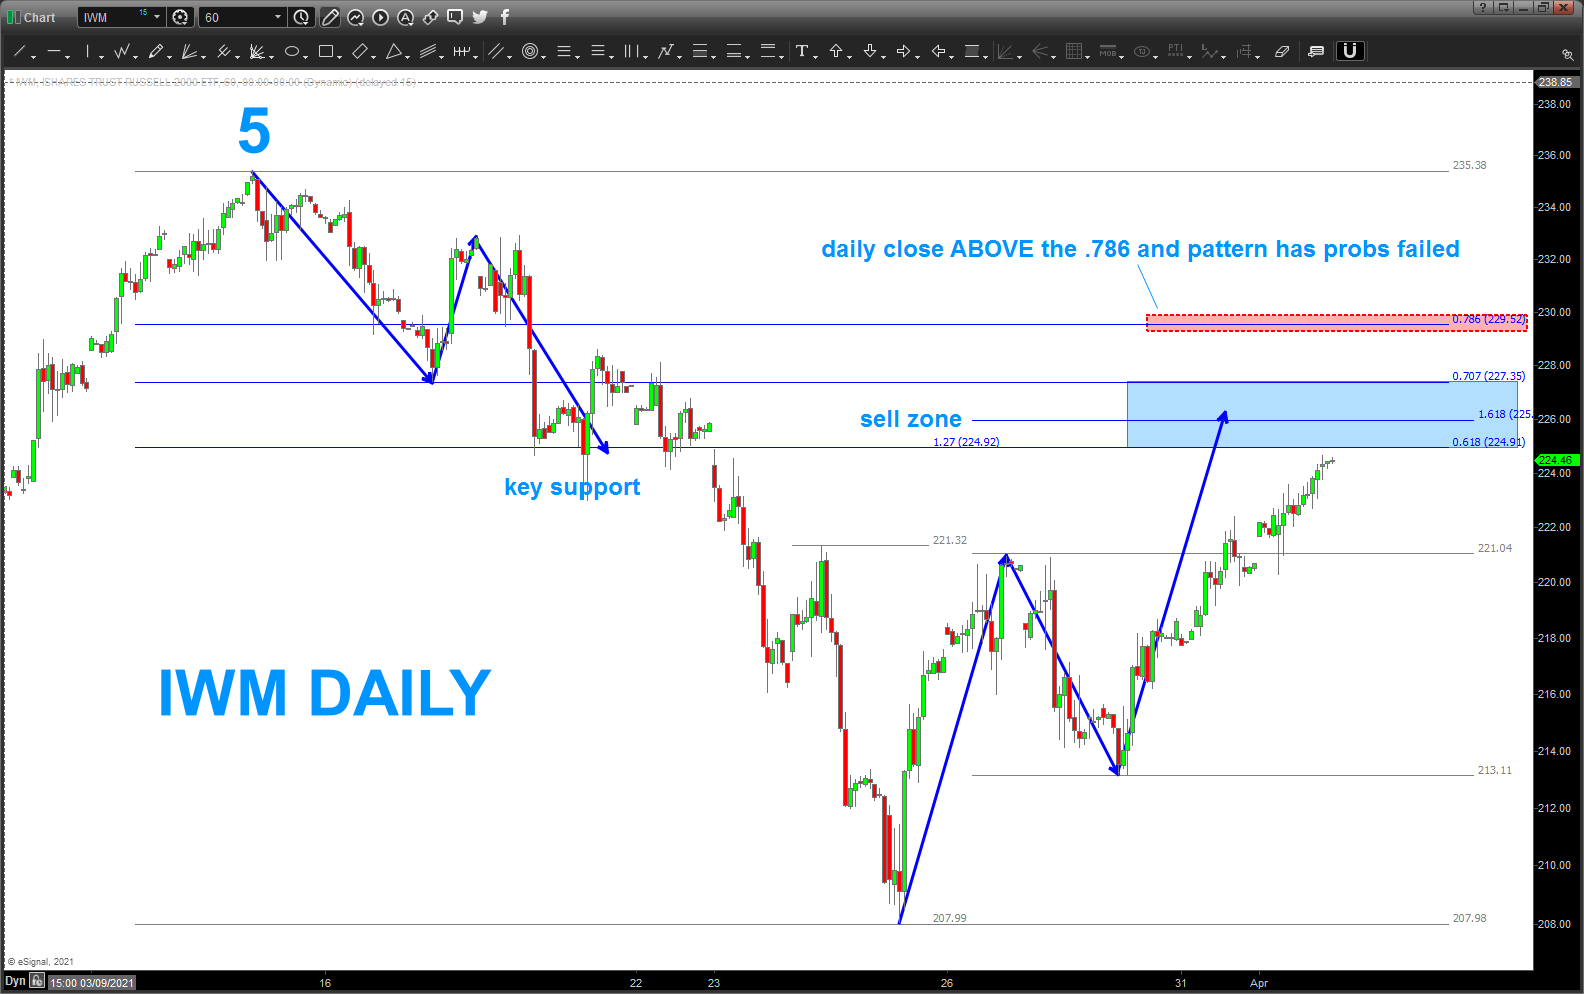
IWM is that REALLY it …?
Posted on April 2, 2021 3 Comments
last post on IWM: https://atomic-temporary-44460632.wpcomstaging.com/2021/02/21/iwm-is-that-it/
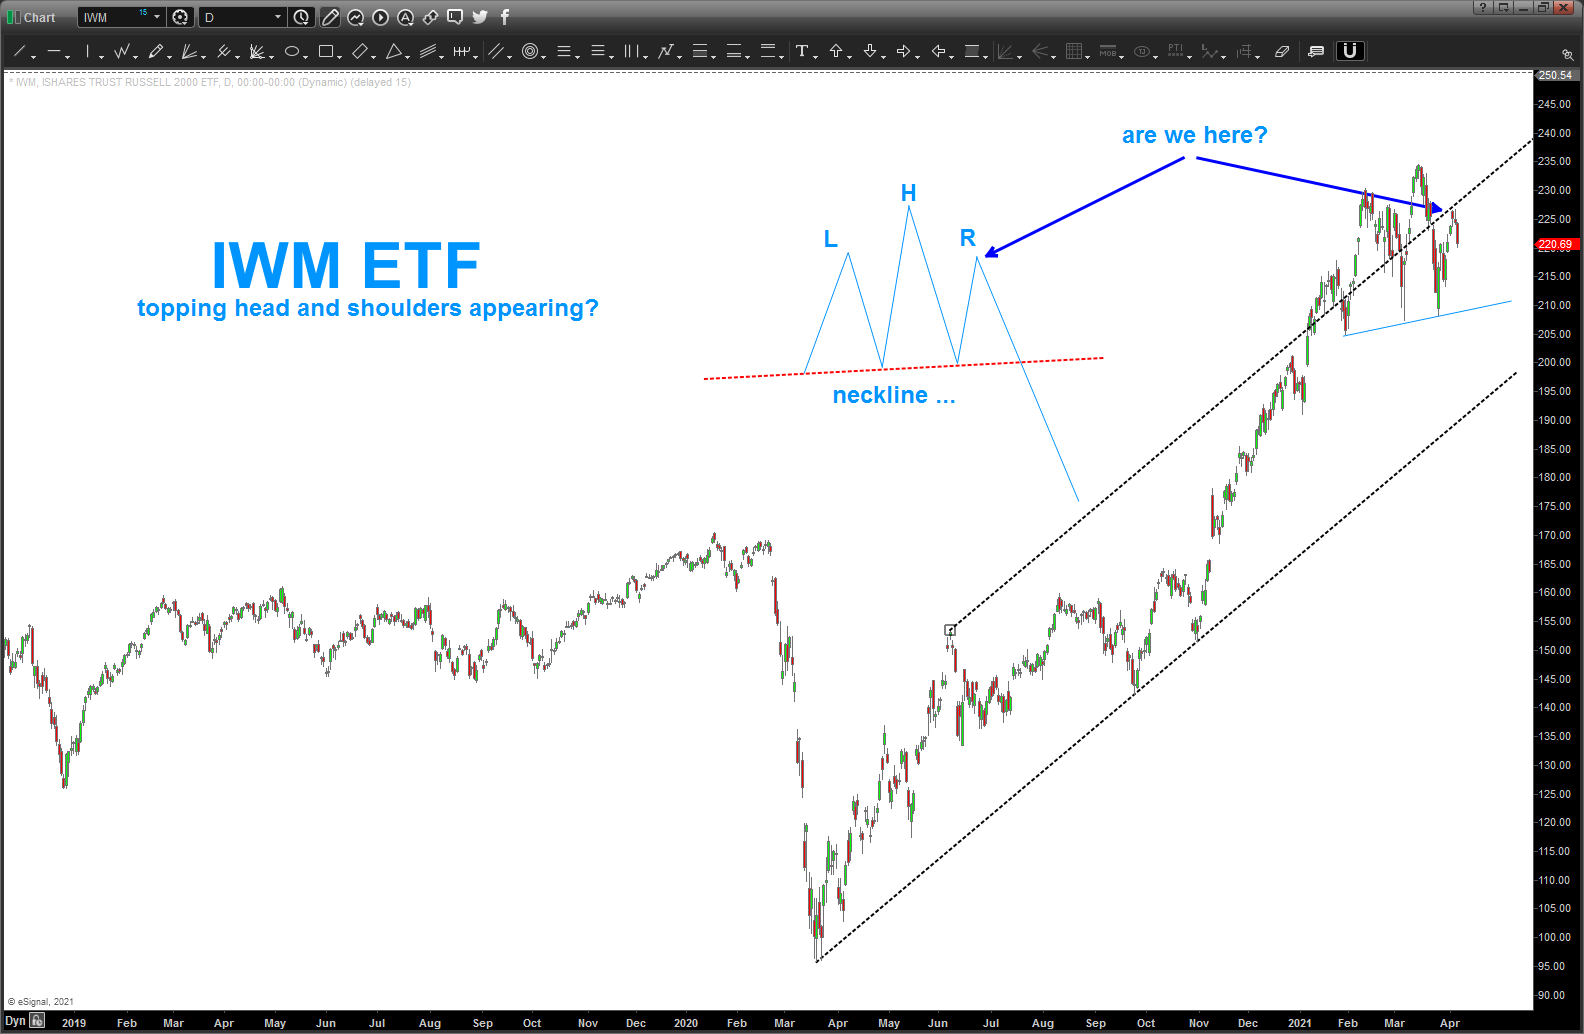
I also blogged about KEY SUPPORT in/around 224-225. that was the FIRST PATTERN BUY in this long term uptrend. is that uptrend still alive?
if you go back to the last post mentioned above, you can see a very clear 5 wave move that, and this is important, BREAKS NO RULES of the Elliott Wave Theory. It’s a valid count …
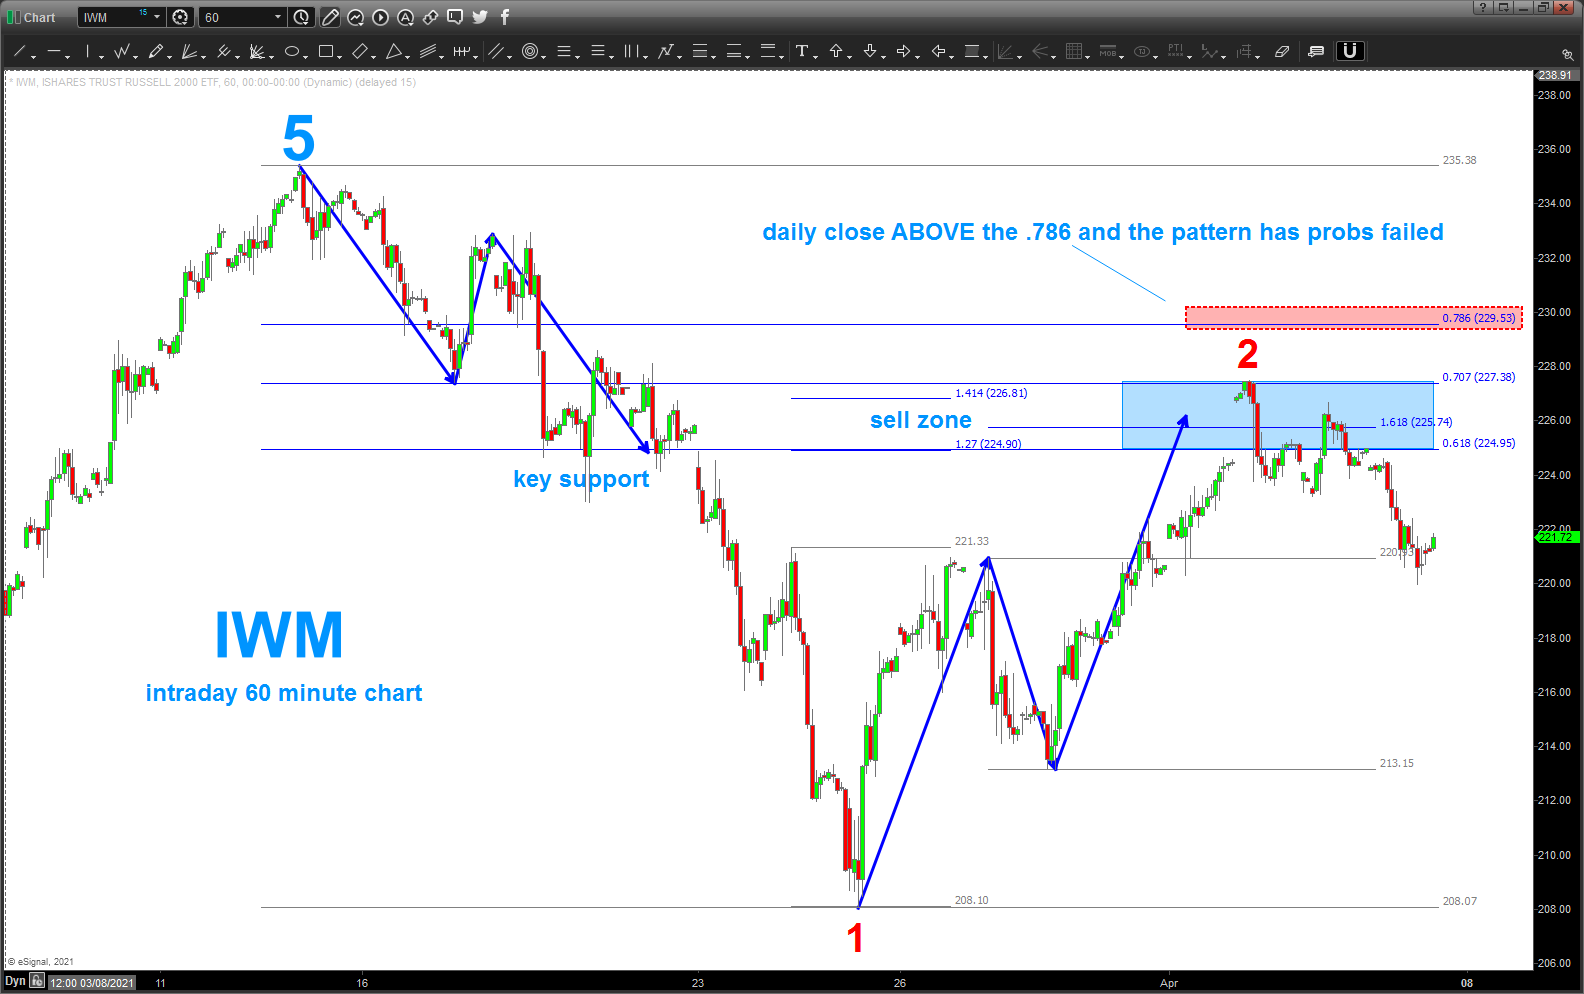
now, is the count correct? we don’t know ….but we can find out rather soon as we have an almost perfect SELL PATTERN in/around the 225-227 level.
now for the IF and THEN
IF the top around 235 is a valid end to a 5th wave THEN this SELL PATTERN shown below SHOULD work.
a valid target will be 198-200 or below ….
have a GREAT EASTER to everyone if this is what you celebrate .. what an amazing time of the year and a time to be alive.
salute – Bart
EURGBP
Posted on April 1, 2021 1 Comment
for us currency traders out there … this is a good one.
here’s to probability …