Bitcoin …so far, making sense
Posted on May 23, 2021 1 Comment
last post on Bitcoin: https://atomic-temporary-44460632.wpcomstaging.com/2021/05/12/bitcoin-update-2/
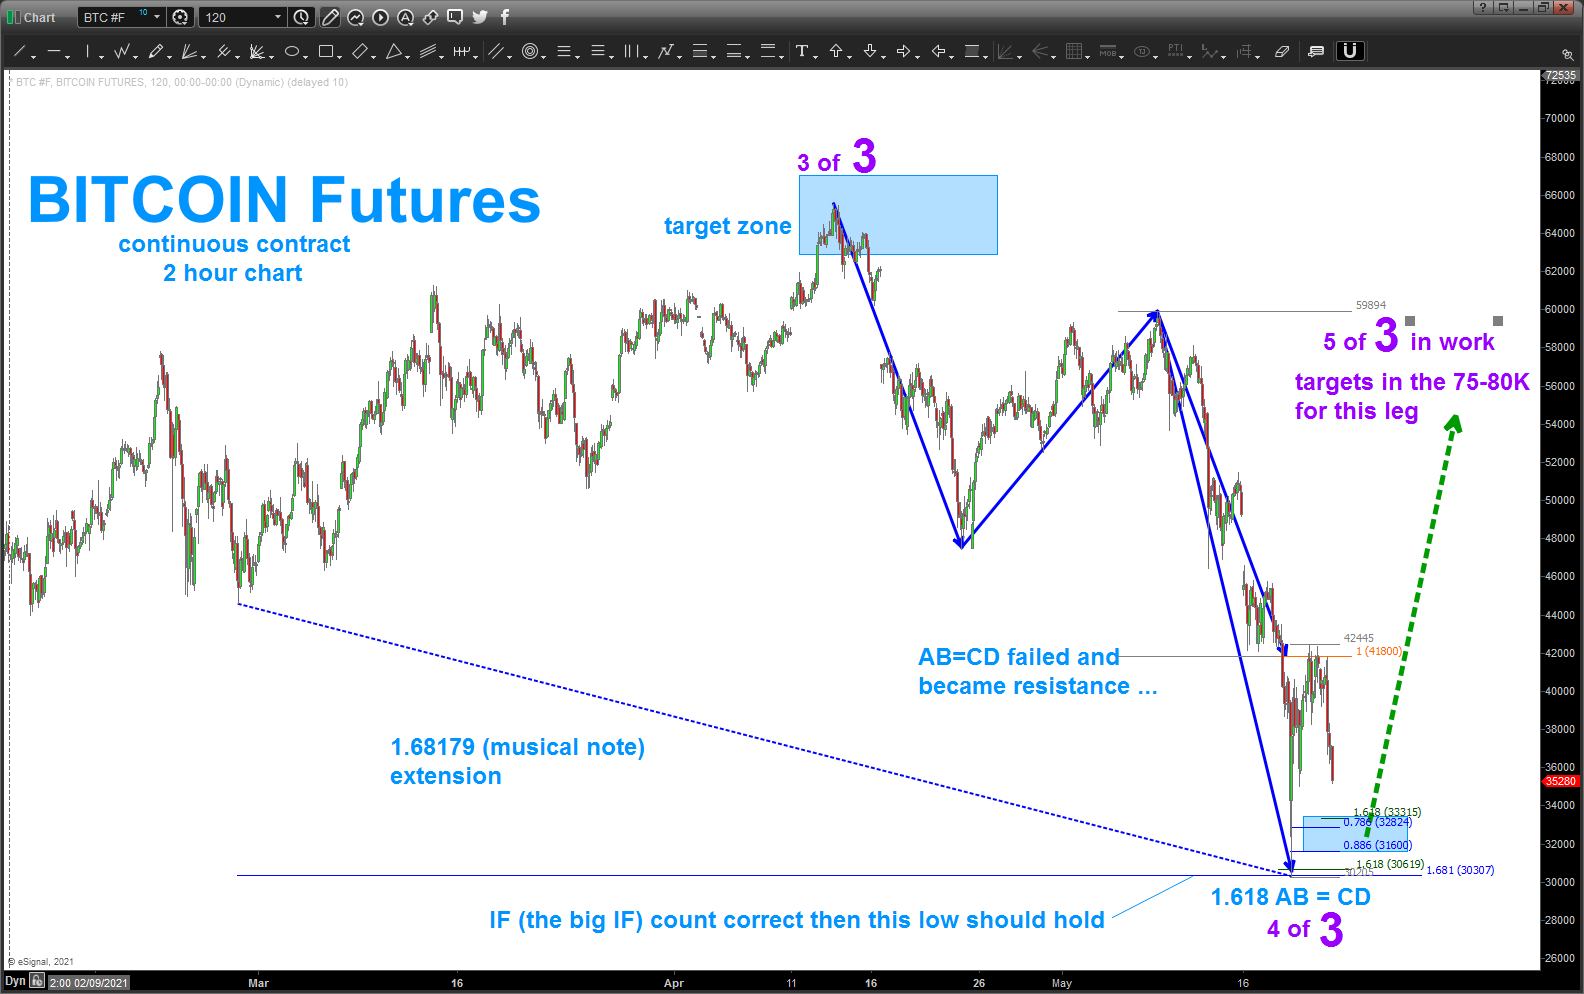
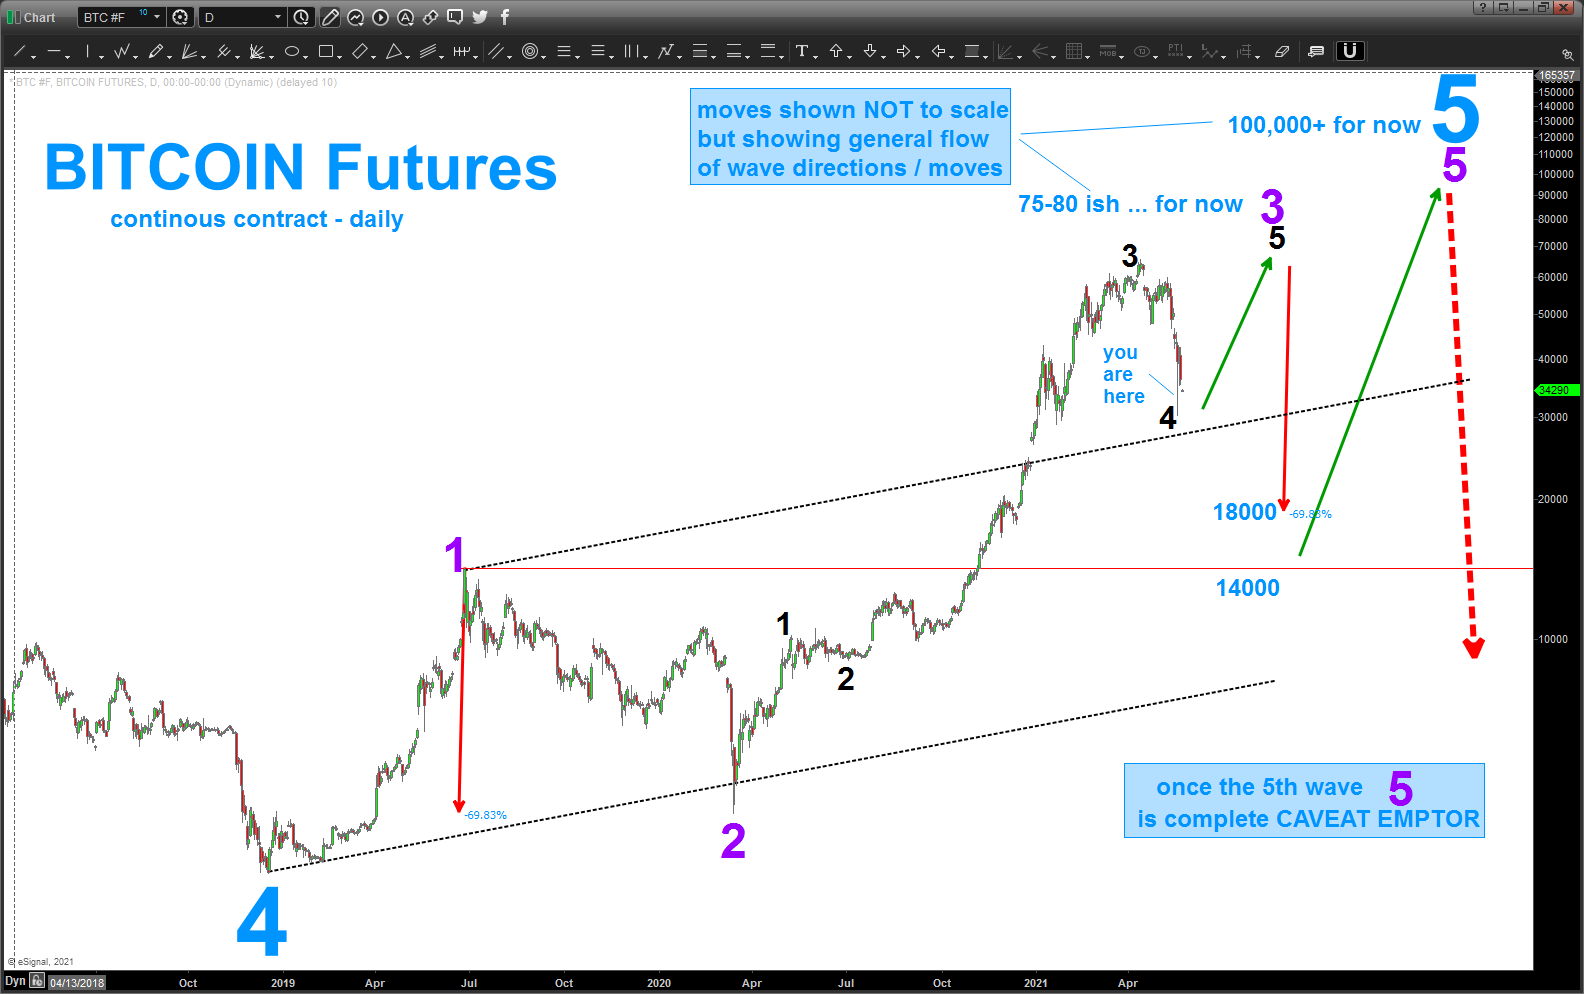
in the last post we created two target zones w/ the “basic” AB=CD and 1.618AB=CD projection technique. doing some rudimentary wave counts I’m going to call the low as a corrective move being complete but I’m updating my count to show that this is still wave 3 of 5 that we are in …
what does this mean?
we “should” (from current levels) move up into the mid 70’s or 80’s and, depending on the chaos of the masses maybe even higher but it is going to be the final wave higher w/in this BIG 3rd wave.
then, expect another nice shake down WHICH SHOULD BE BOUGHT for the final leg that should take us into the 100k’s …
XLP/NYA at it again …
Posted on May 13, 2021 1 Comment
the ratio at it again …
last post on XLP/ NYA: https://atomic-temporary-44460632.wpcomstaging.com/2021/05/05/xlp-nya-our-favorite-ratio-and-a-twist/
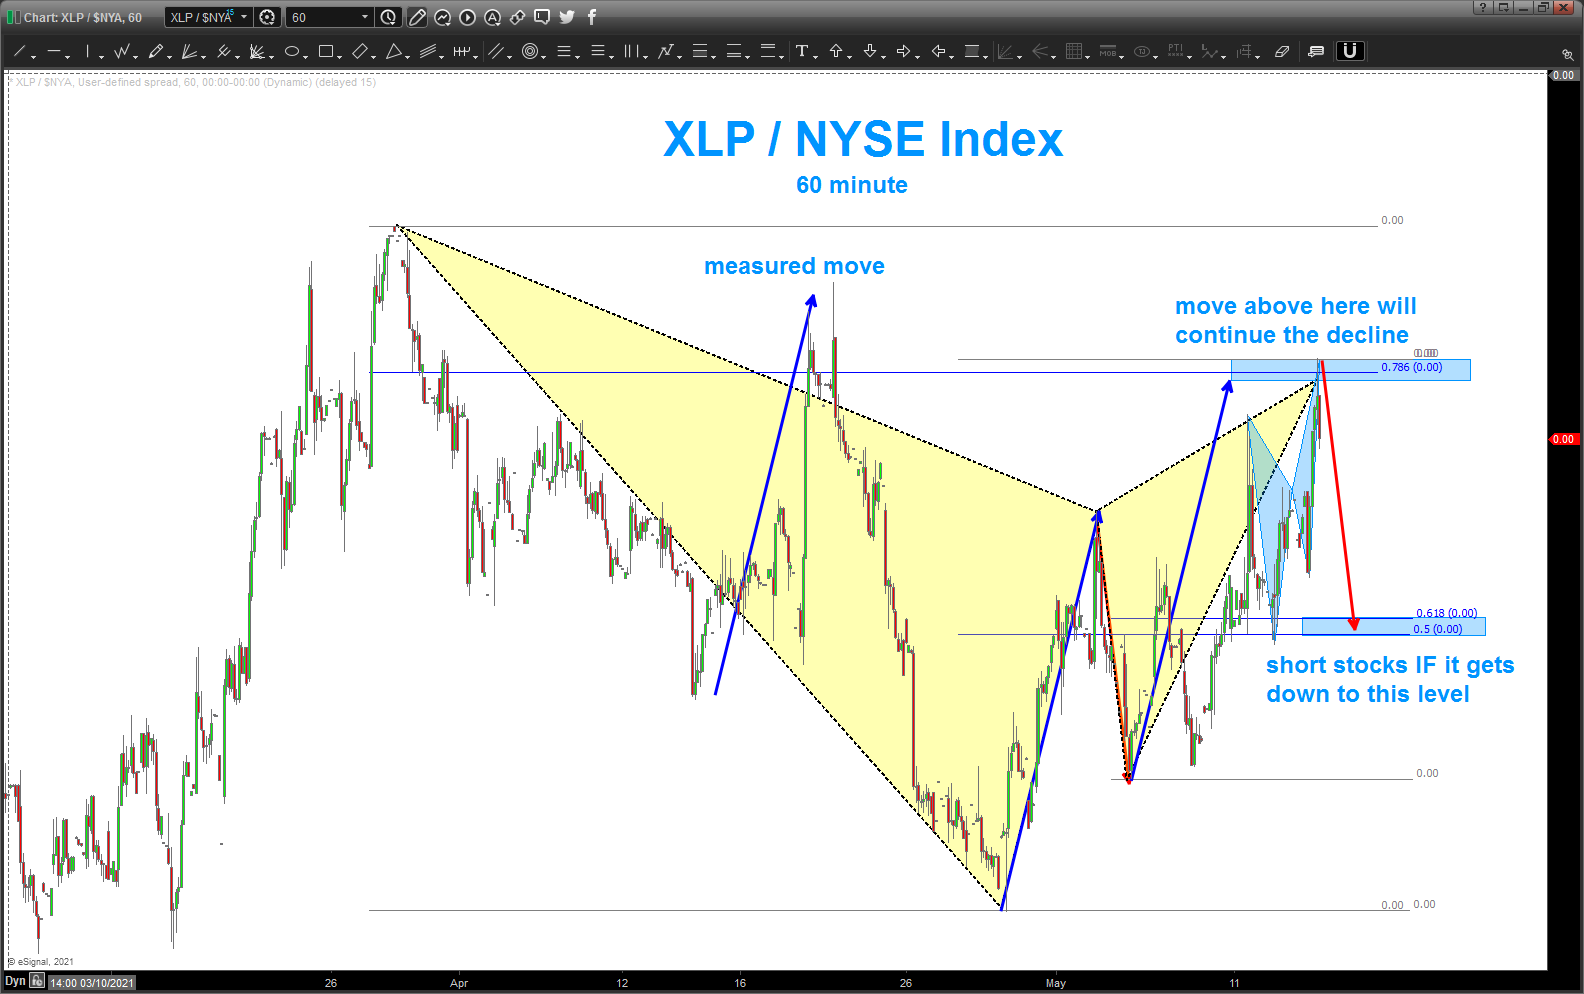
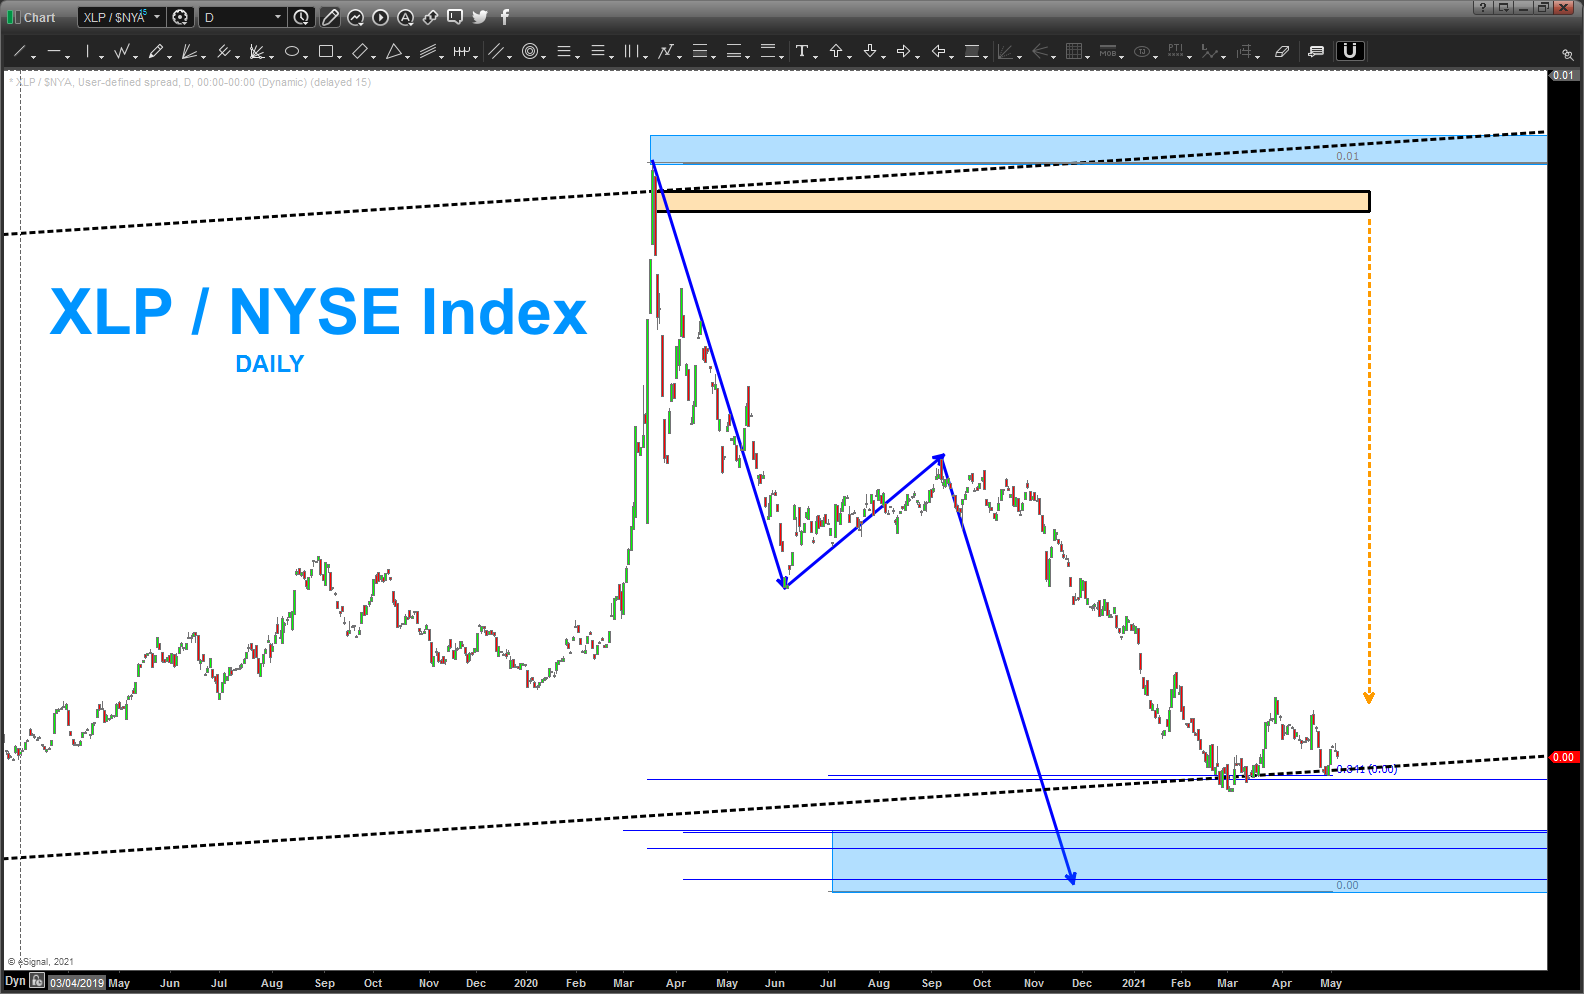
today, the ratio went and smacked right into an hourly pattern SELL (yellow highlight) and a 15 minute butterfly sell (light blue) …
when the ratio goes DOWN the market goes UP. pattern hit perfectly and the rally ensued …
now, it’s time to WATCH the next day or weeks action to see if this pattern fails and the sell off continues OR the ratio continues down causing sustained rally. I don’t recommend being LONG any indices right now as we are in a TIME and PRICE window that might prove significant.
FUTU updated target
Posted on May 12, 2021 1 Comment
last post on FUTU: https://atomic-temporary-44460632.wpcomstaging.com/2021/03/23/futu/
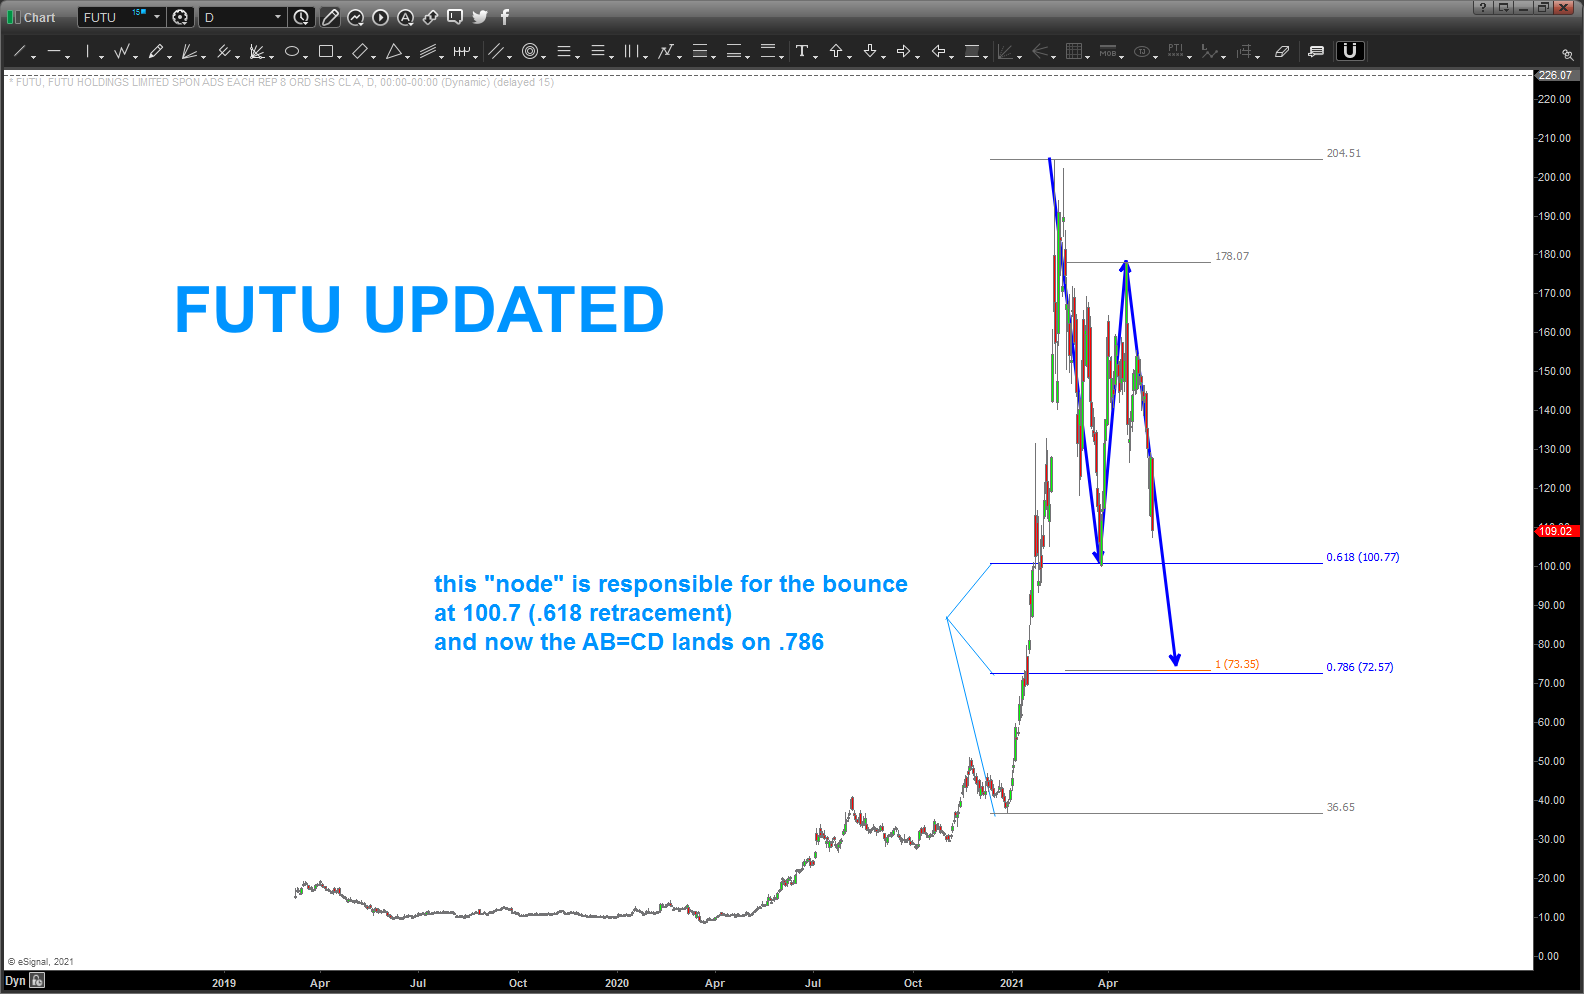
thesis – markets correct in 3 waves.
in this case 1 down 1 up and then 1 down.
we are in the 3rd wave down and in Elliott Wave parlance – this is a C wave …
target to BUY and, perhaps, start another entire bull run is 72.57
Bitcoin update
Posted on May 12, 2021 1 Comment
last posts on Bitcoin: https://atomic-temporary-44460632.wpcomstaging.com/2021/04/18/bitcoin-update-island-reversal/
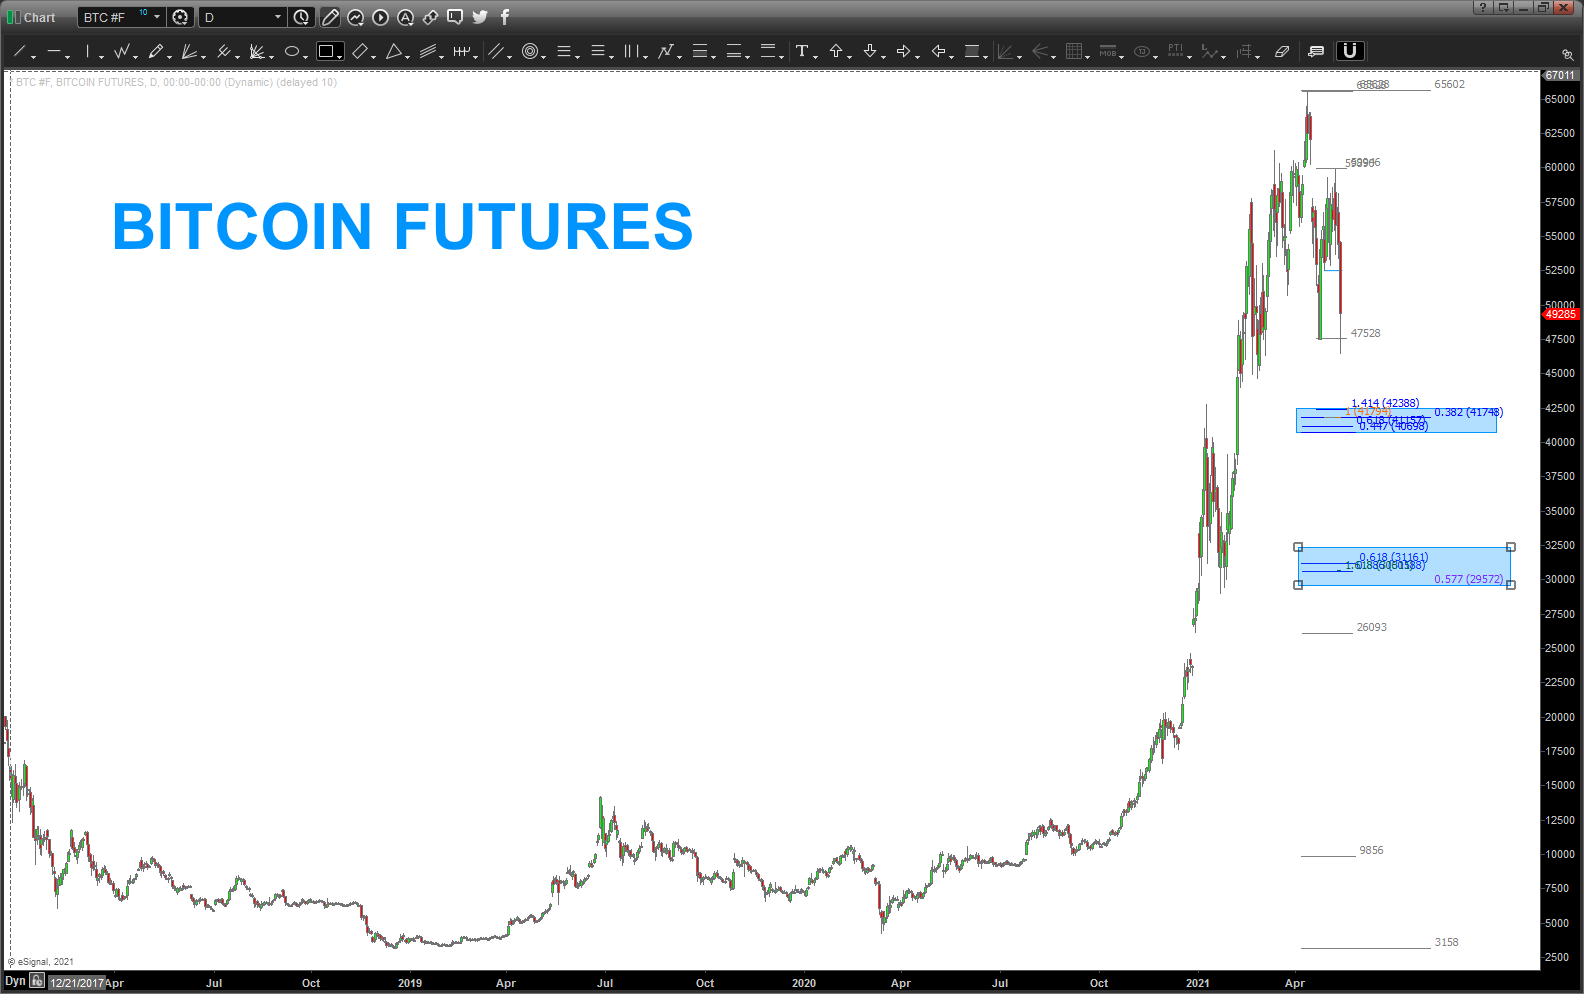
today’s “Musk Induced” Sell off certainly smells like a C wave … that supports a zig-zag correction and it certainly smells like we are in a 4th wave correction … targets of low 40’s and, depending on thrust into this level forewarns of a move below into the low 30’s … we’ll just trust the patterns and the count.
but, for now, the lower targets are opening up nicely …
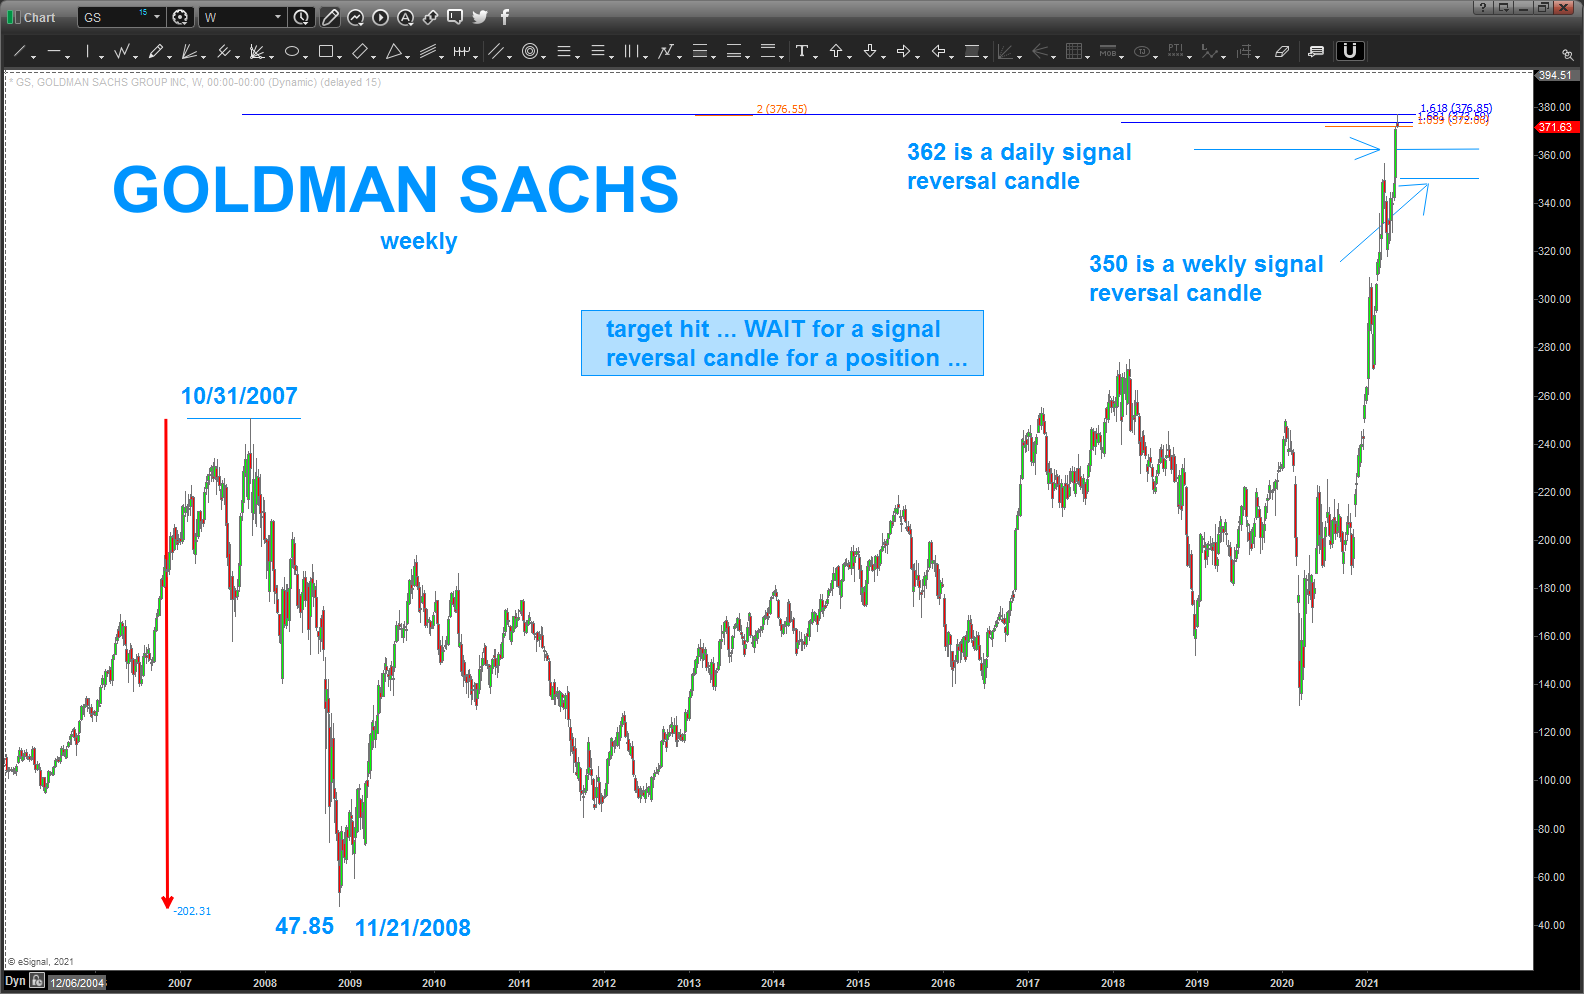
GS Goldman Sachs Target HIT
Posted on May 10, 2021 Leave a Comment
last post on GS: https://atomic-temporary-44460632.wpcomstaging.com/2021/03/17/goldman-sachs/
monthly SELL pattern on Goldman complete.
note the thrust into this level .. begs of caution so either WAIT for a daily (<362) or weekly (<350) signal reversal candle to initiate a short OR HERE but out above 377.
either way, when you have multiple monthly projections and extensions all coming together in/around here one should take notice.
of course, it certainly can blow thru this level to the upside (it’s only probability) but this is some very STIFF areas of resistance so only time will tell.
also, for those who might understand why I write the following OR want to go and dive into a rabbit hole … 373 is a prime number. we’ll leave it at that …
Bart
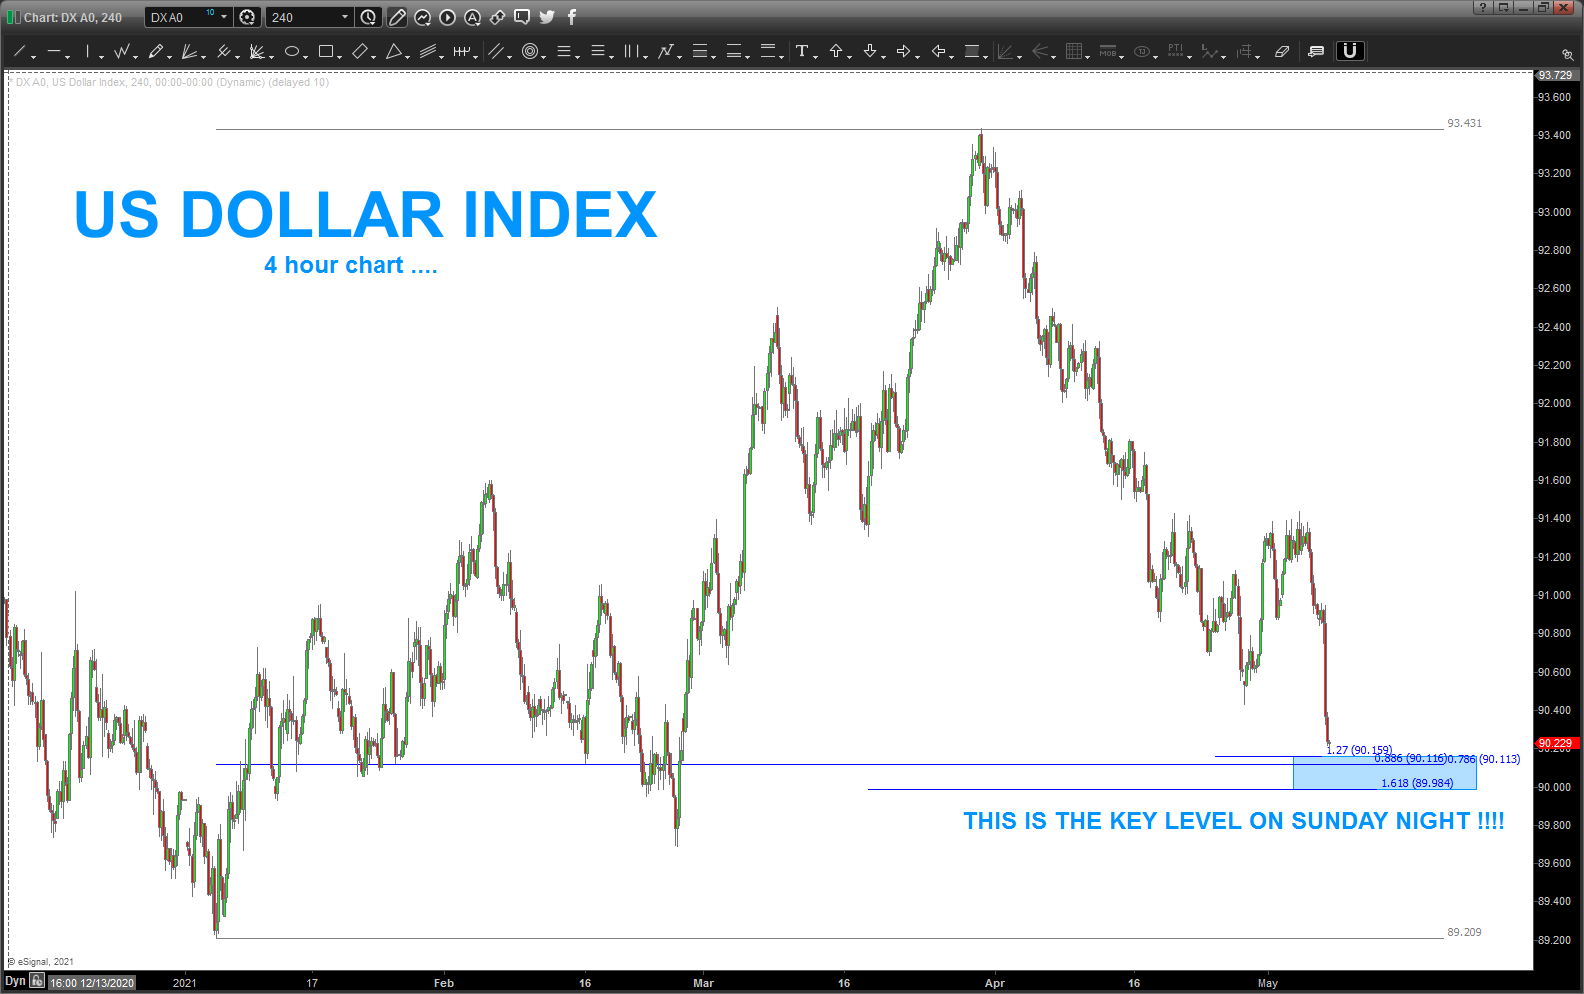
FX Currency update
Posted on May 9, 2021 Leave a Comment
last post on US Dollar Index: https://atomic-temporary-44460632.wpcomstaging.com/2021/02/22/usd-index-close-to-a-big-move-up/
well, it’s certainly getting interesting.
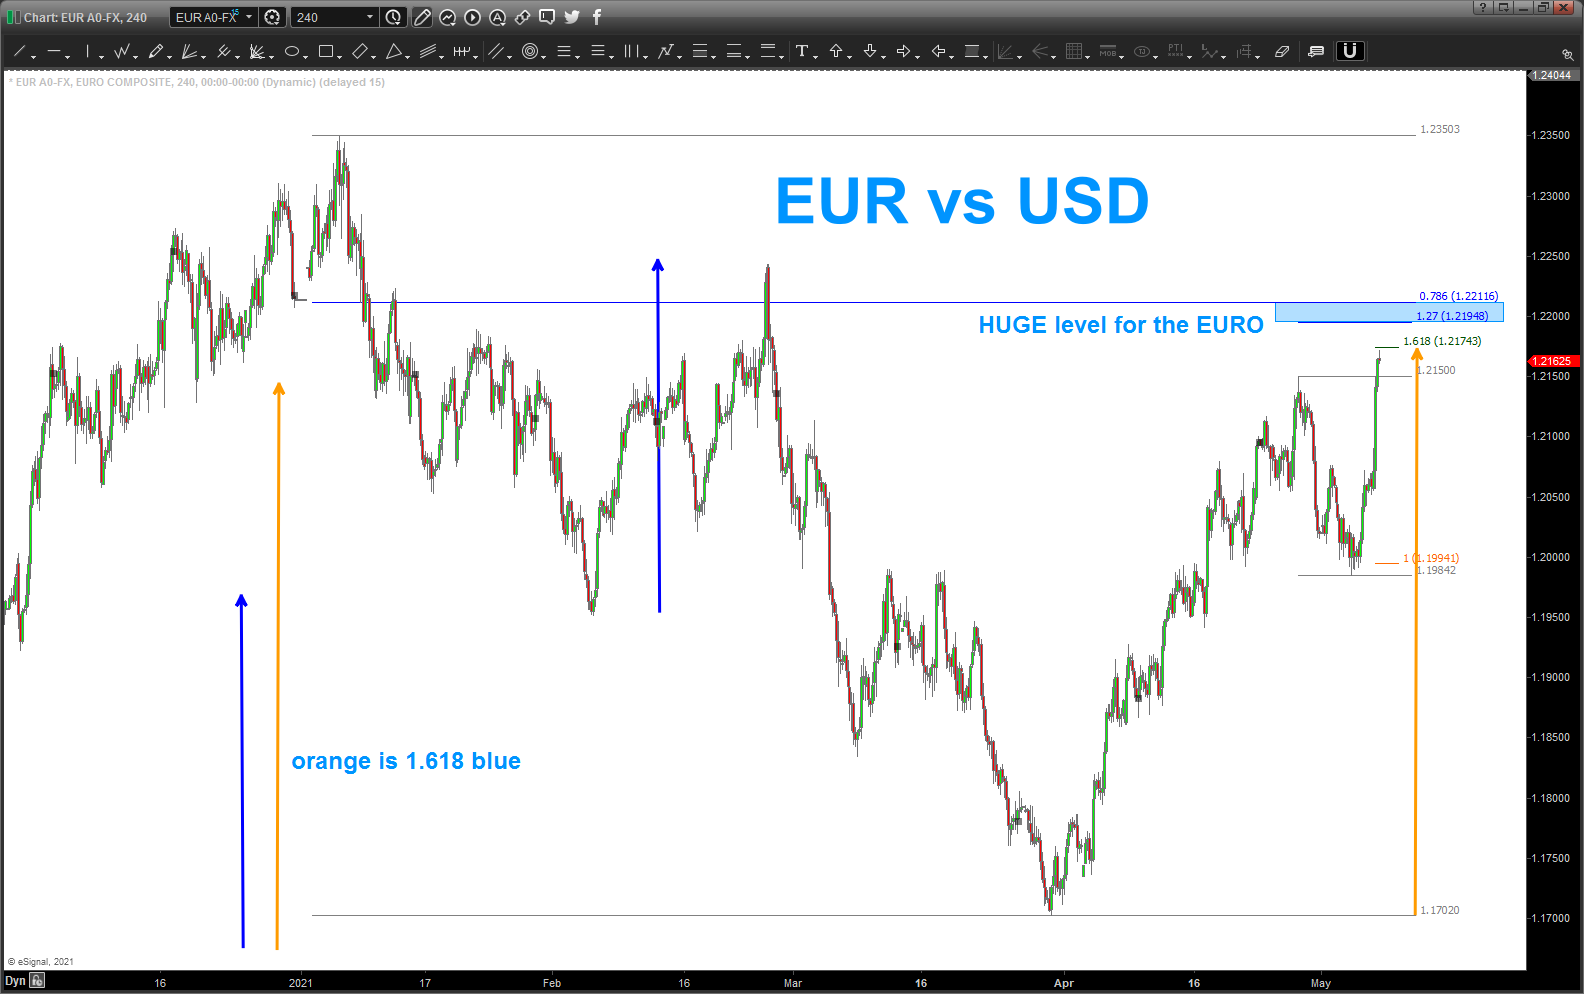
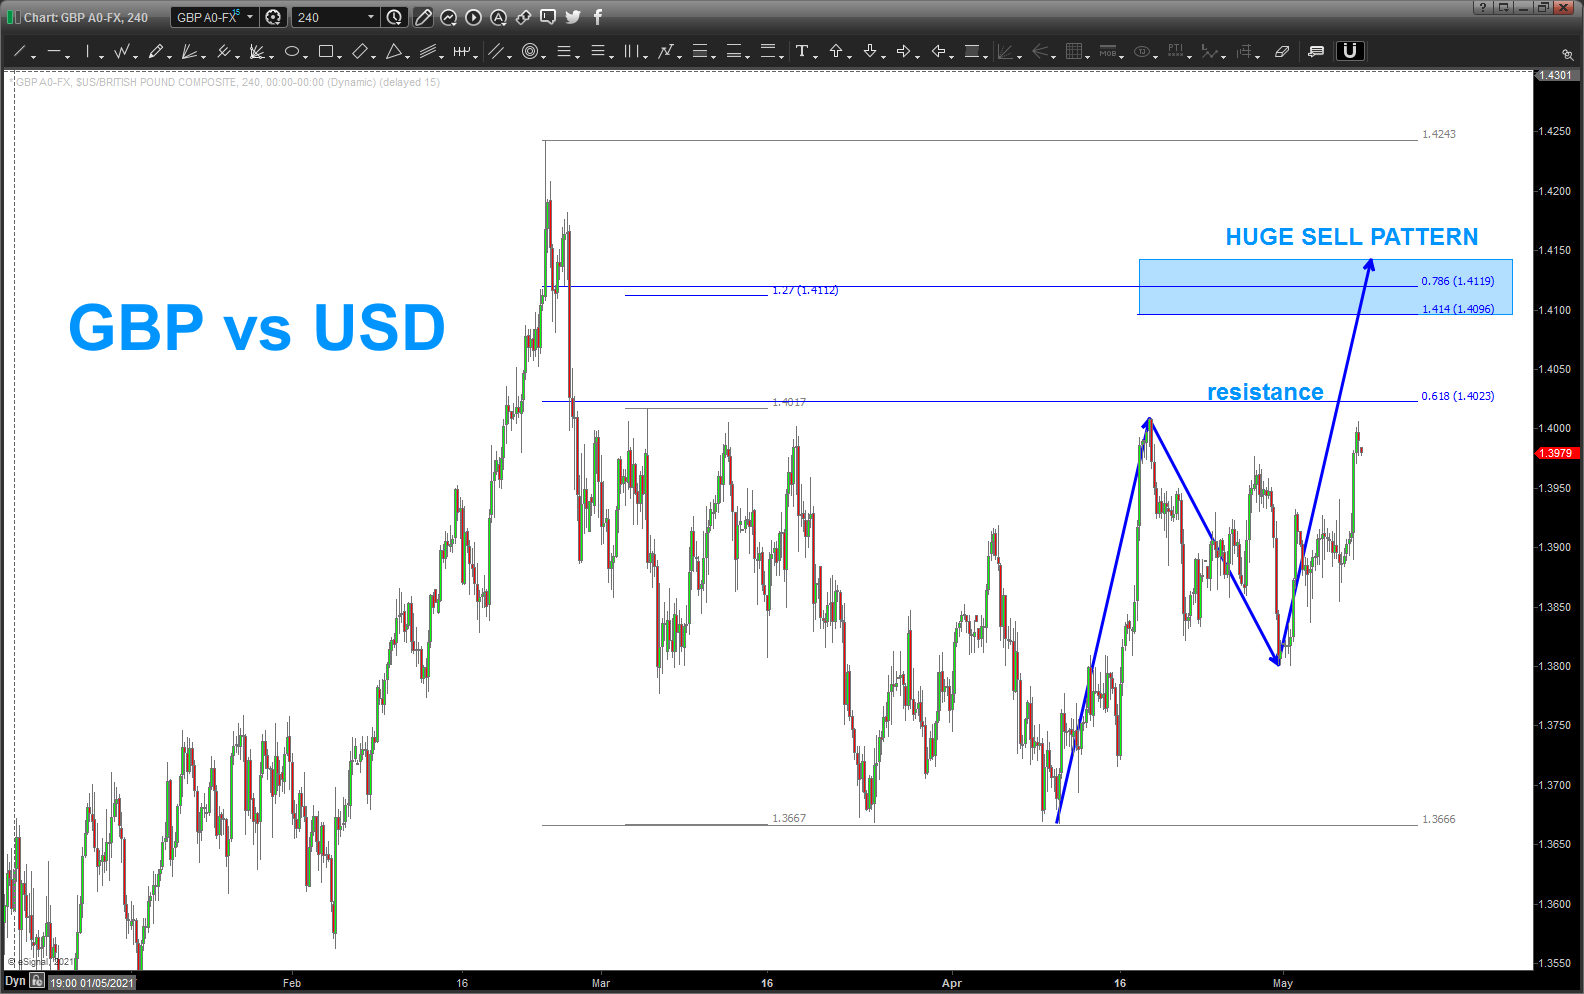
watch the levels shown on the GBP and the EURO and USD Index to get a feel for what might be coming this week.
IF we hold these levels then expect dollar strength .. EURO and POUND weak.
IF we FAIL on these sell patterns for the EURO and the POUND then the dollar will take a pounding and go right into the level we have been waiting for what seems like a LONG LONG time … stay tuned tonight.
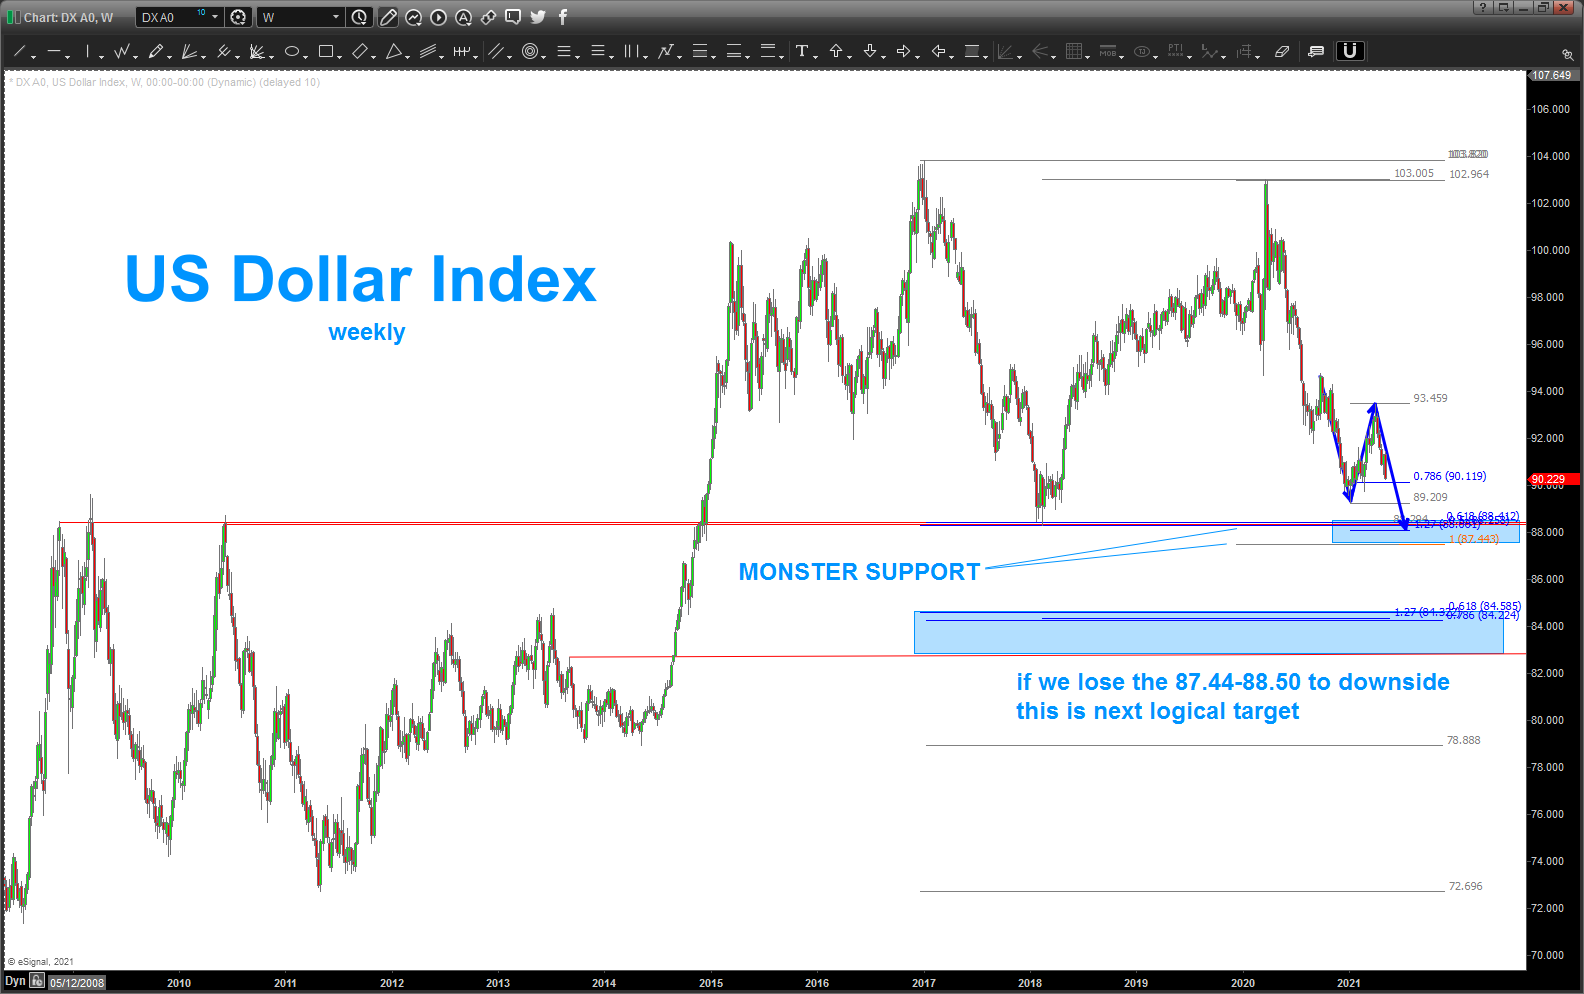
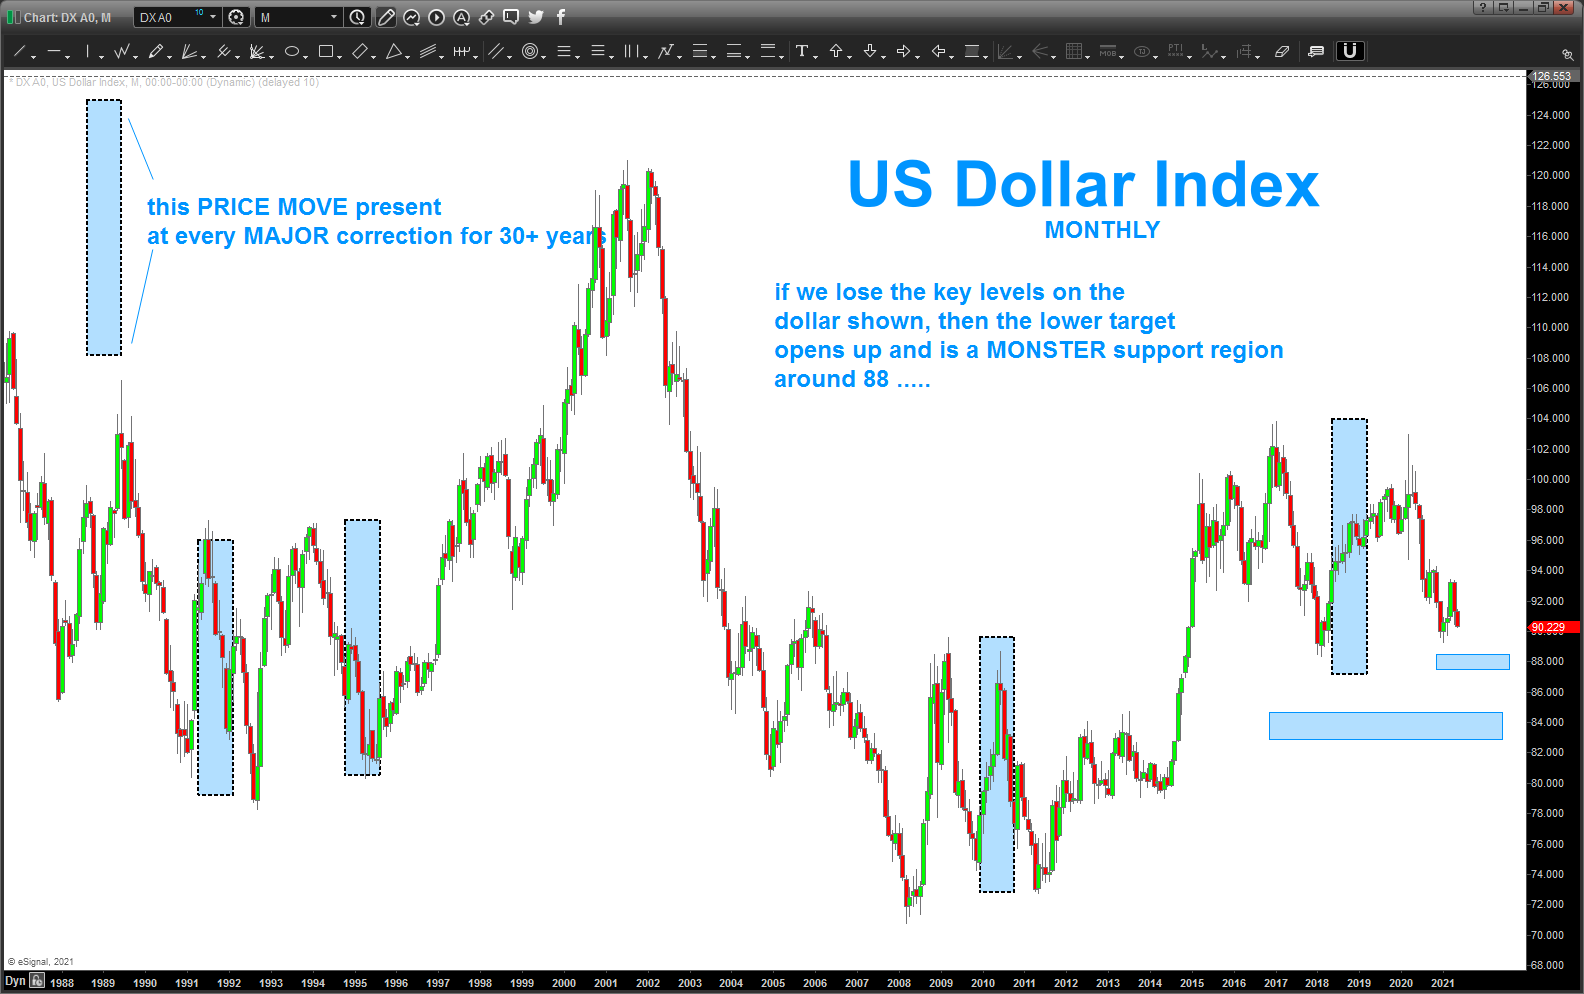
personally, WAITING and have a “hunch” that the levels will fail (USD weakness) and go forth and attack the lower level shown on the USD Index which is the SAME level equal to EVERY move lower in the USD in the past 30+ years. worth waiting for … don’t you think?
XLP/$NYA – our favorite ratio and a twist…
Posted on May 5, 2021 2 Comments
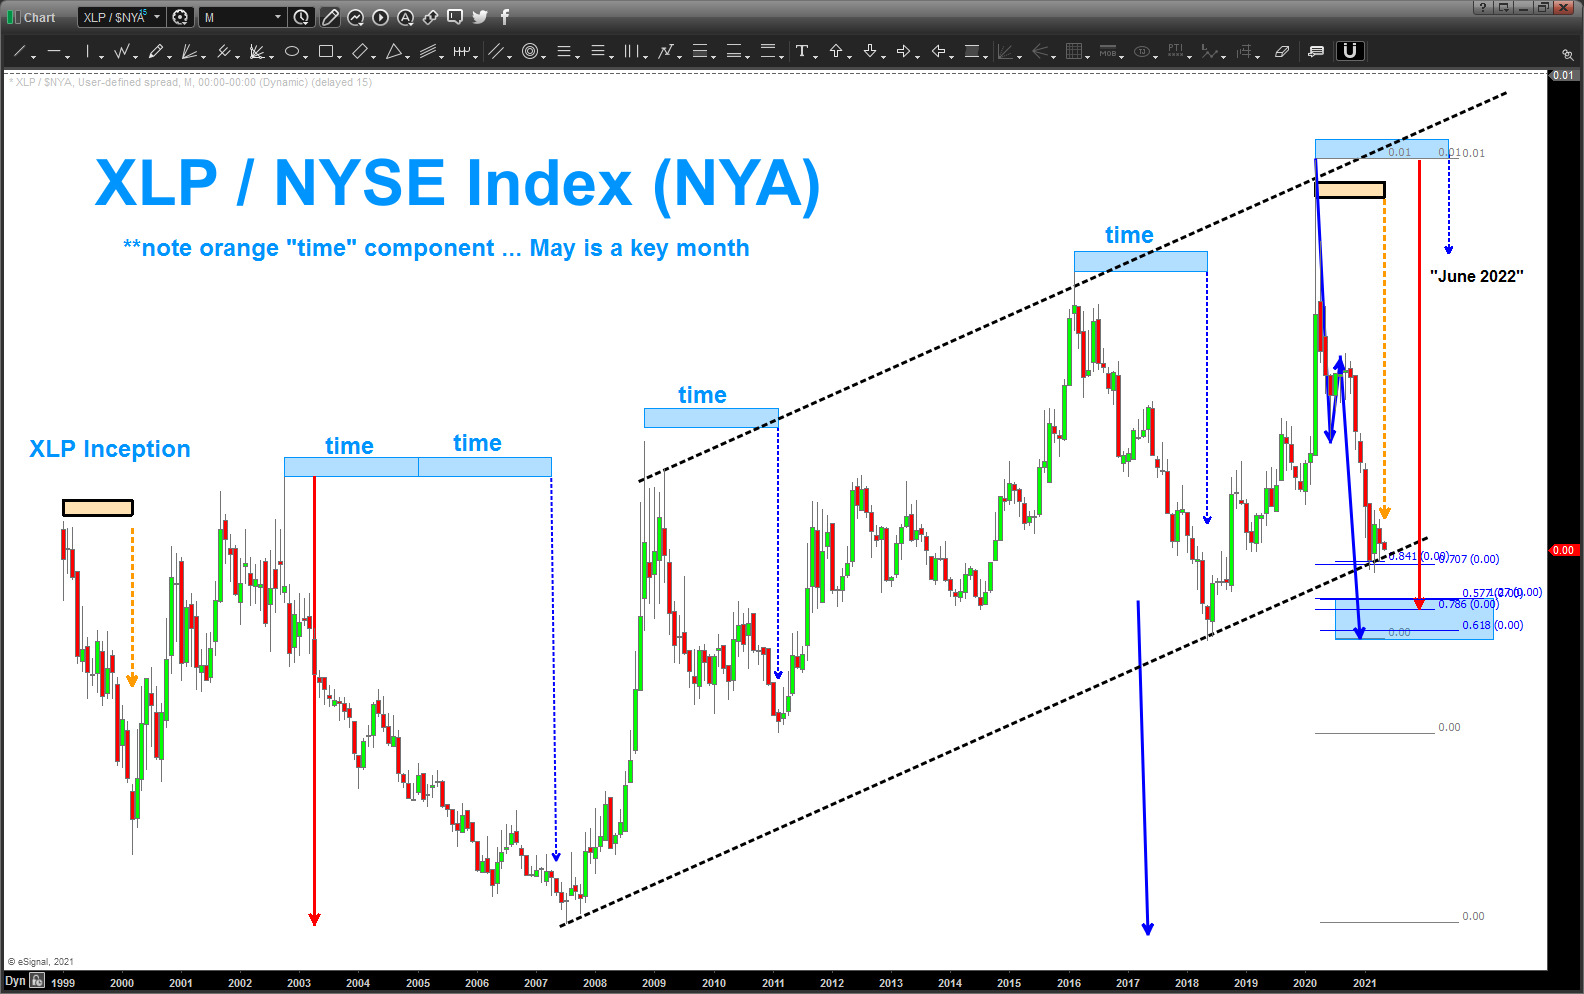
you realize I watch the XLP/NYA ratio – a lot – and one of the things that I never did till today is look at the “time” component of the first leg down from the XLP inception. today I did and that “time” component aligns nicely w/ a “May” timeframe to really be on the look out for HUGE support in the ratio (which equates to weakness in equities) just a little further below.
if you look at the most recent action certainly looks like we have one more wave lower into the HUGE SUPPORT zone and then, well, it’s judgment day in my humble opinion.
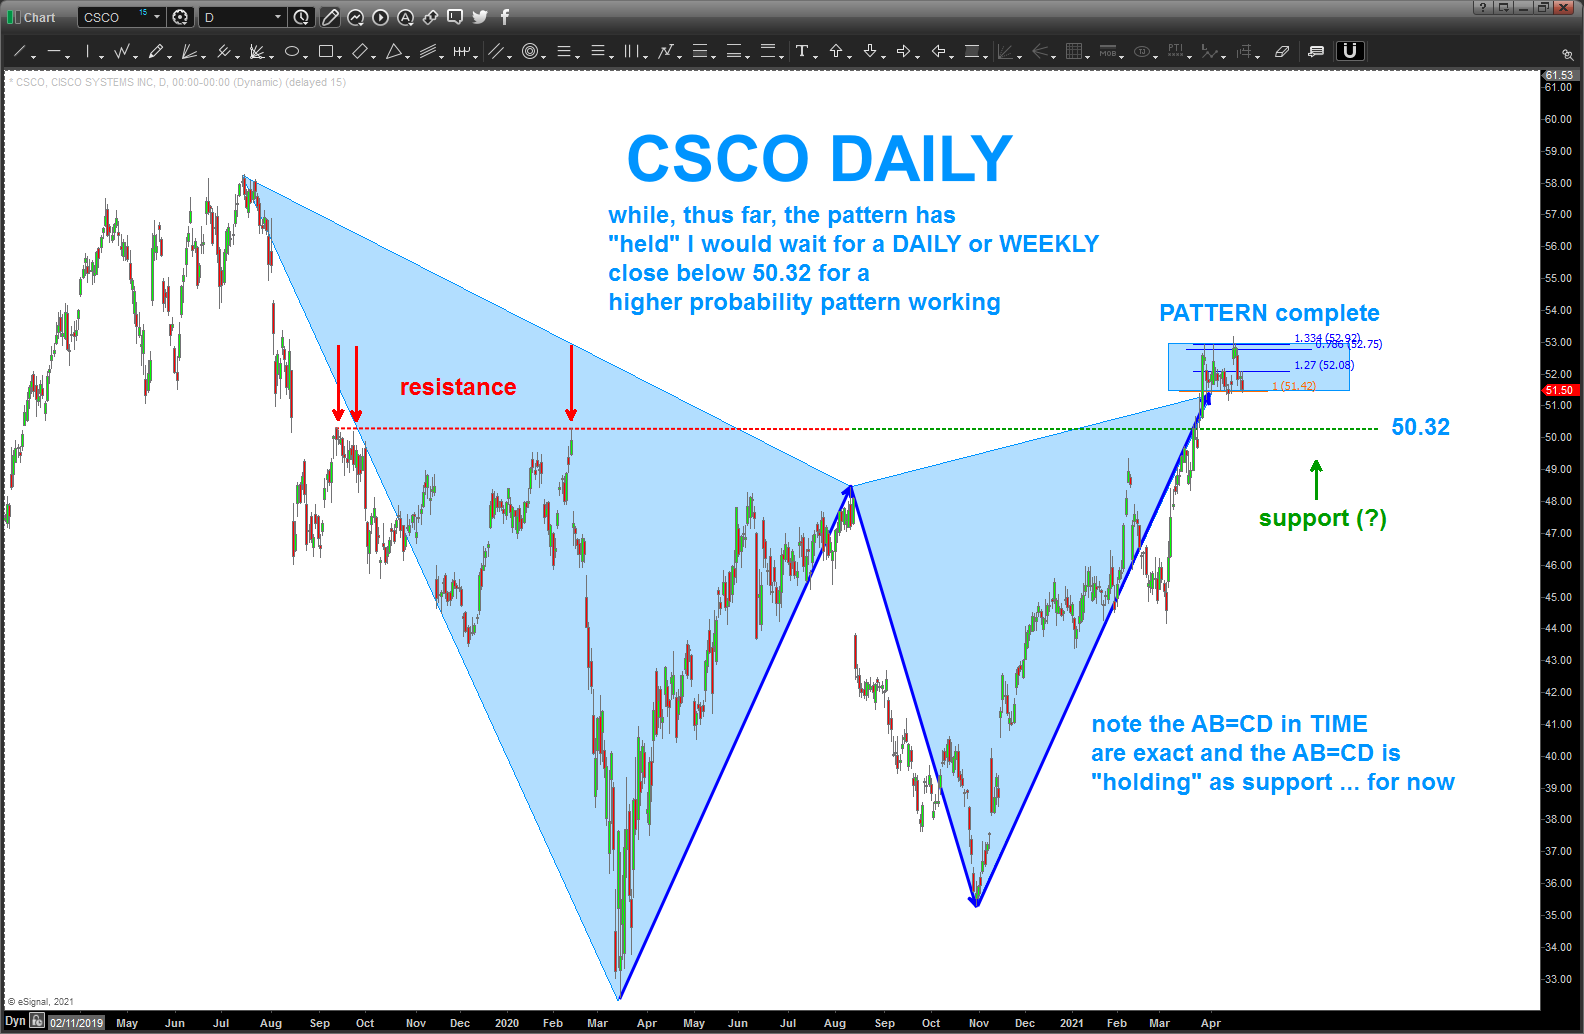
CSCO – getting interesting
Posted on April 22, 2021 Leave a Comment
last post on CSCO: https://atomic-temporary-44460632.wpcomstaging.com/2021/03/28/csco-follow-up-and-important-level/
note the BIG polarity principle shown from the dashed red and green horizontal lines .. waiting for a daily or weekly close below 50.32 is probably the most conservative play …
also, note that the support at 51.42 is the AB=CD level and is holding as support
last, while the AB=CD was taken out most/all the ratios hels in the zone of 51.42-52.92.
an interesting pattern w/ big ramifications upcoming …
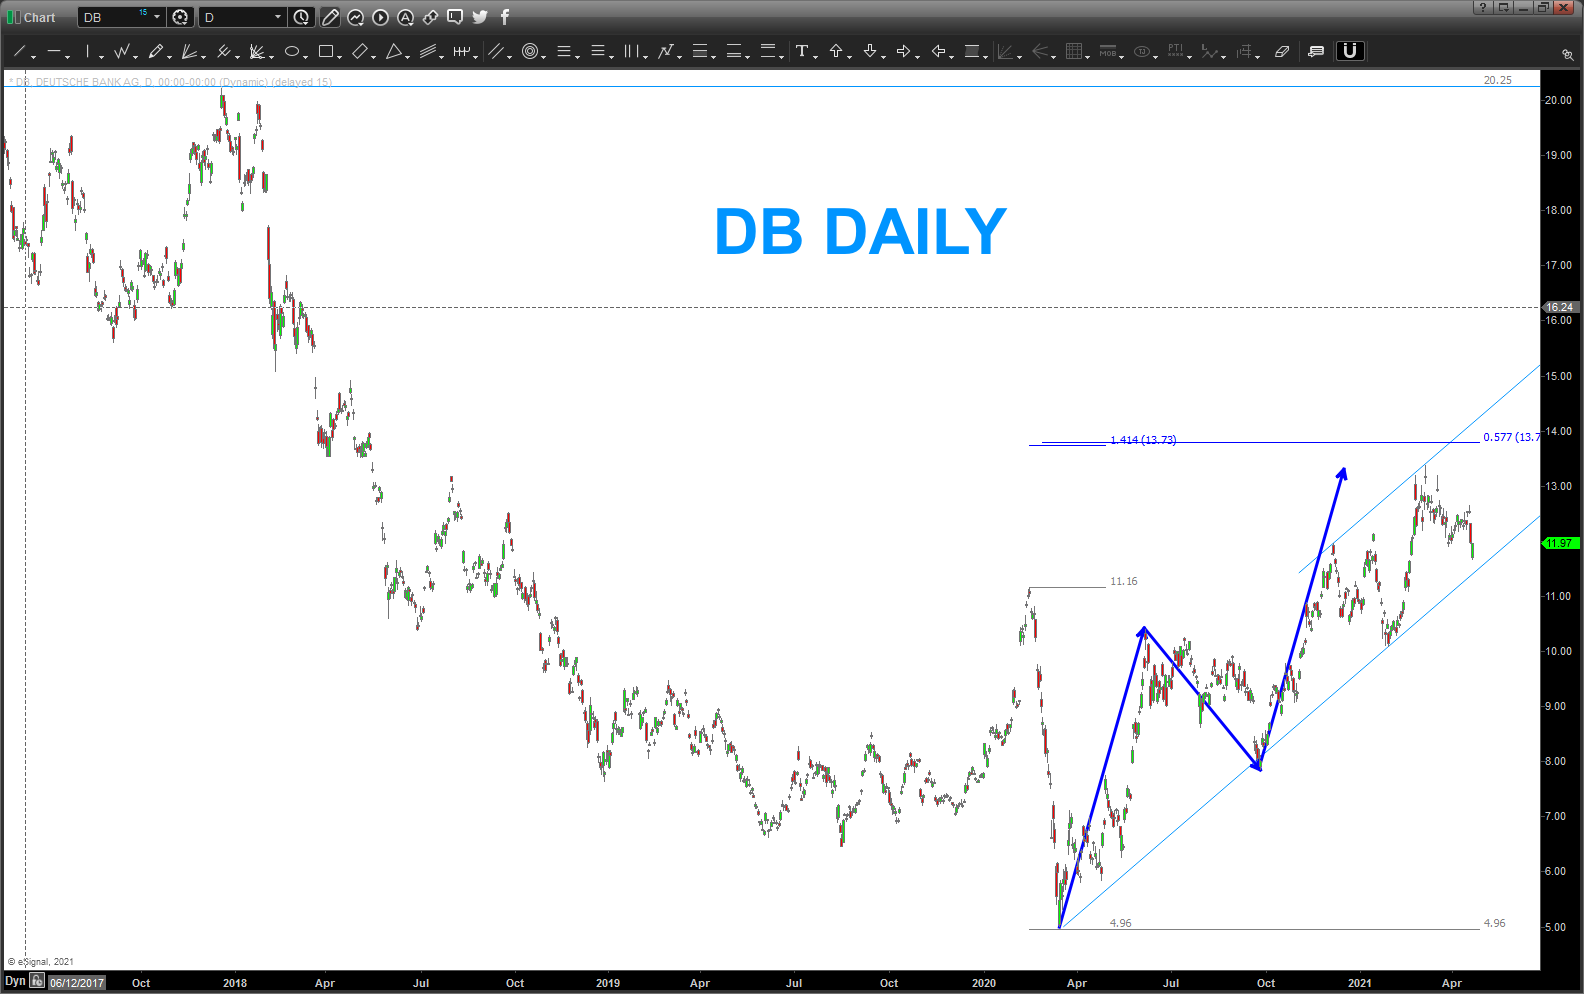
Deutsche Bank
Posted on April 21, 2021 Leave a Comment
if you have been following my blog for a while you know I keep a steady eye on DB (Deutsche Bank) for as long as “they” stay solvent the band will play on … that being said, DB is fraught w/ peril as is the entire world economy and financial infrastructure. yes, I just typed that …
DB finished an AB=CD off the all time lows … it starts getting liquidated you might want to run for the hills.
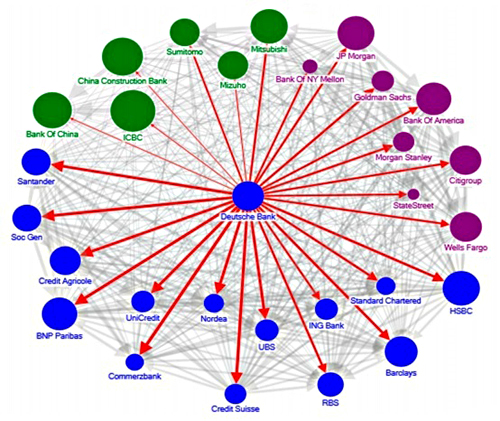
not trading/investing in it … but watching it big time simply due to the second graph below.