AMC – heads up – in the ZONE
Posted on August 4, 2021 1 Comment
last post on AMC: https://atomic-temporary-44460632.wpcomstaging.com/2021/07/13/amc/
buy pattern is completing, completed. let’s see what happens now … again, it’s ALL PROBABILITY but the masses who have been hanging on might see some light IF (the big if) this PATTERN holds.
I have no idea if it will or won’t but some buds were crazy enough to TRY (operative word) to play this w/ the masses so .. here we go!
the COIN update
Posted on August 2, 2021 Leave a Comment
last post on BITCOIN: https://atomic-temporary-44460632.wpcomstaging.com/2021/07/26/el-coino-the-coin-aka-bitcoin/
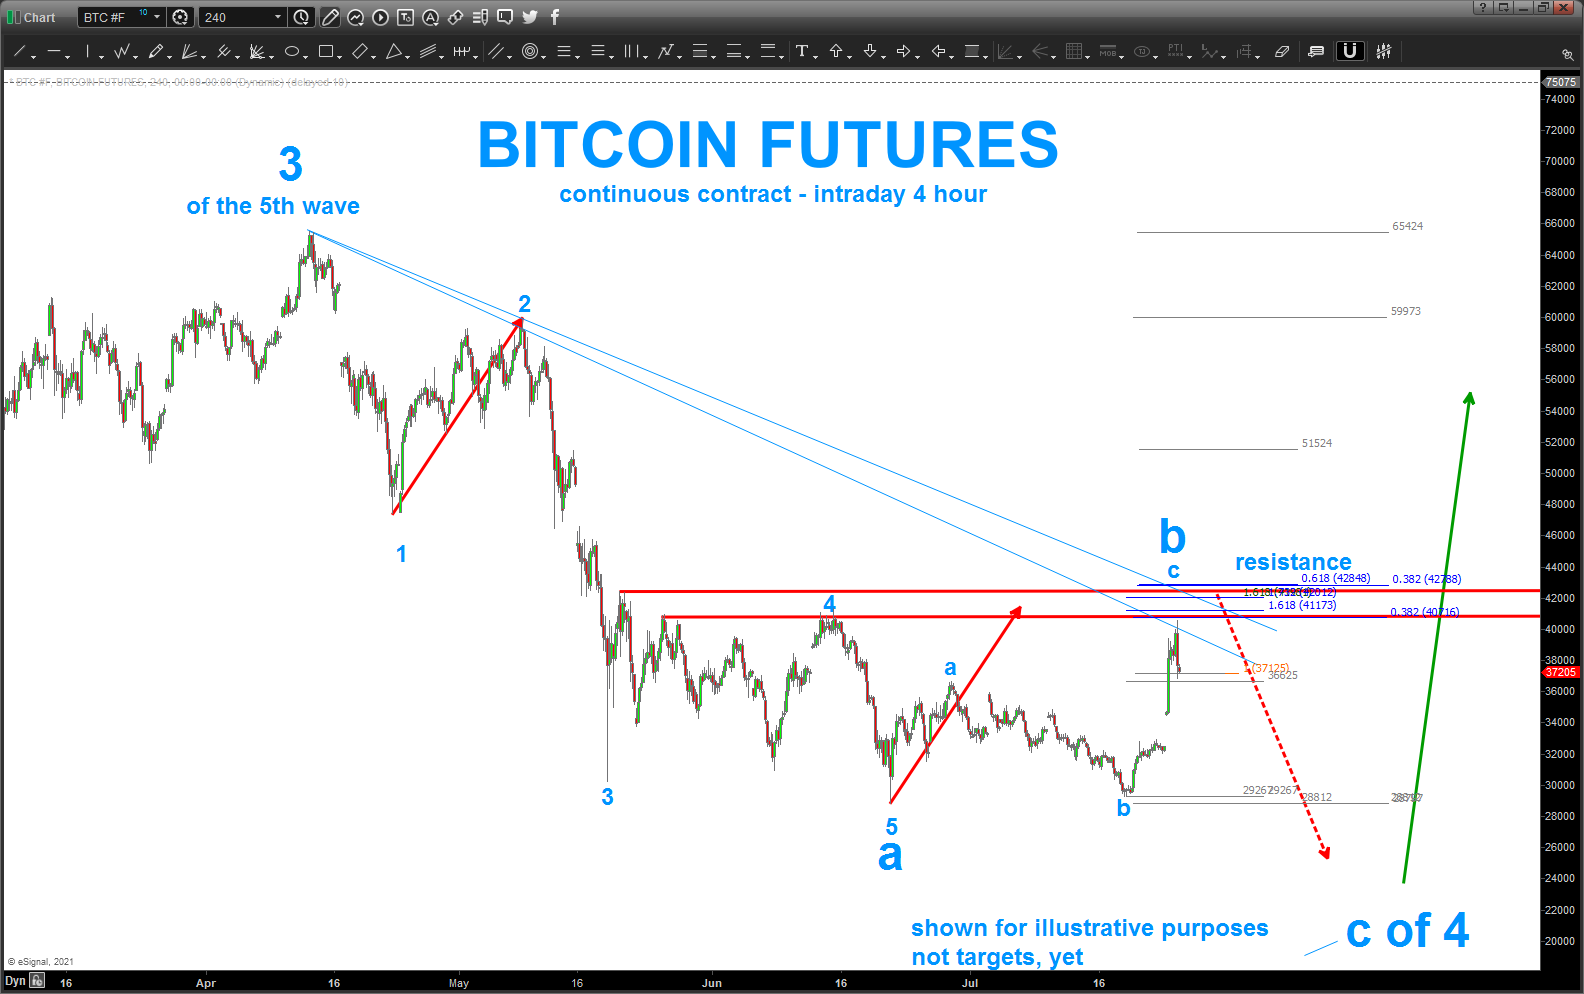
the coin marched right into our target zone and has backed off .. in fact, it hit, exactly the 1.618 projection. if you remember, the “c” leg is often 1.618 “a” so we hit that …
there are still some higher targets but the theory is that we are in the beginning of a C wave down and then a BUY in, potentially, the low 20’s.
could we be advancing and wave 4 already complete – yes – but for me, it’s too early to tell. for now I’ll watch and monitor ….
Transports – clear 5 waves down and example of PAYING ATTENTION TO HARMONIC #’s
Posted on July 26, 2021 3 Comments
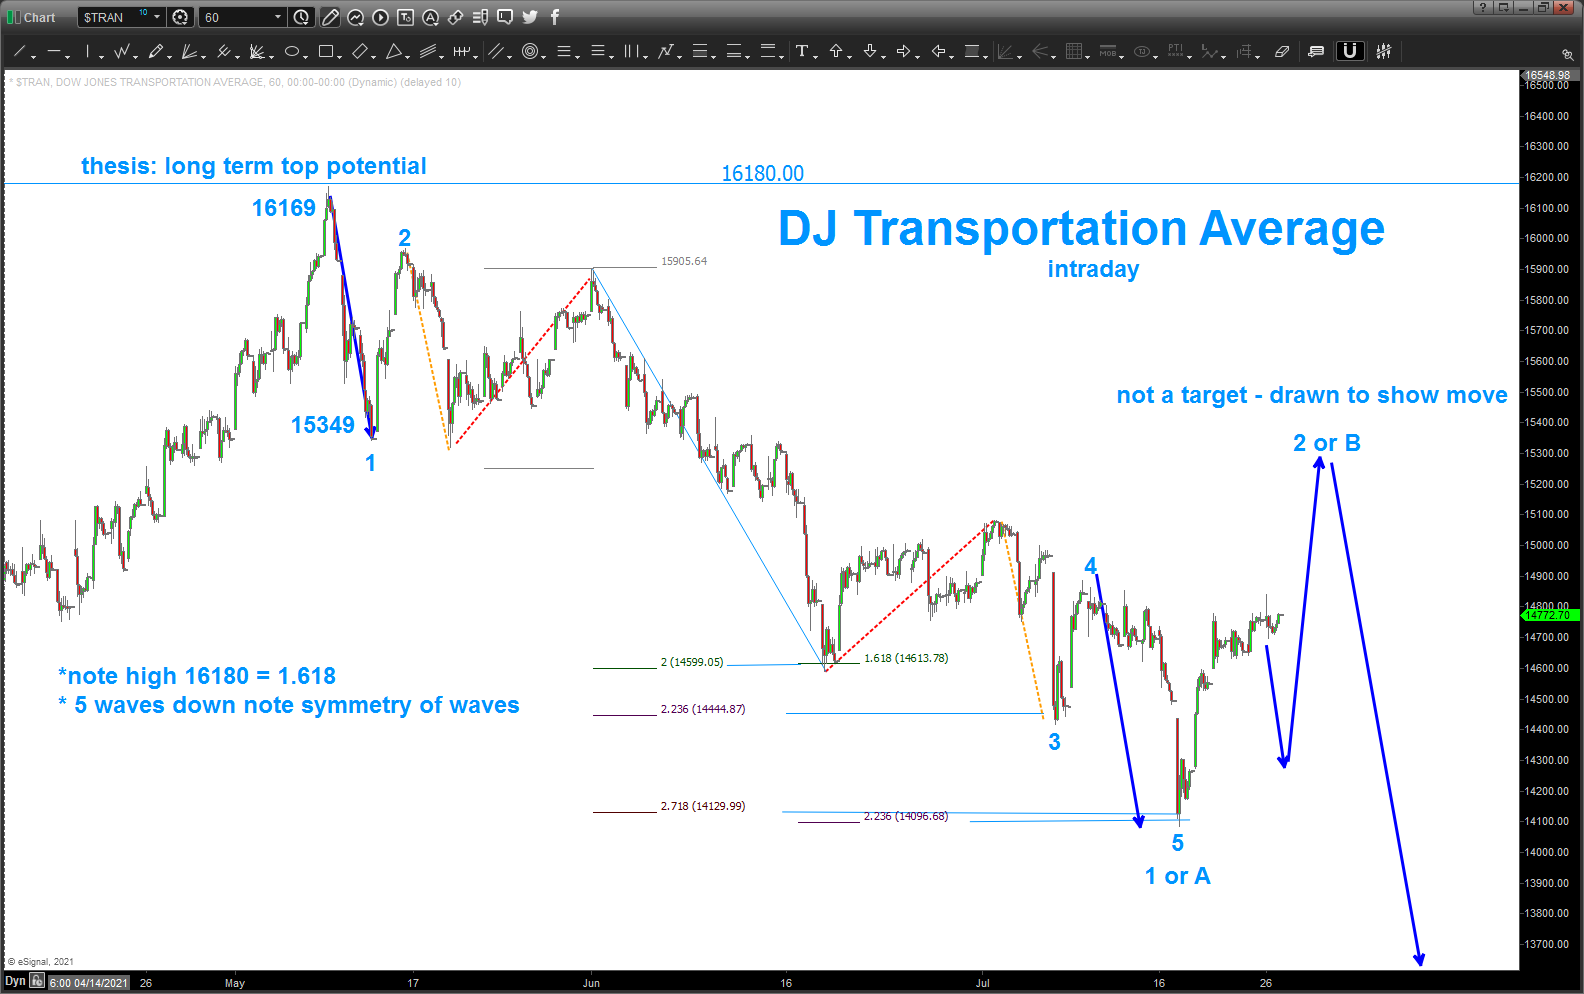
note, 5 waves down after hitting a MAJOR target zone. last post on Transports: https://atomic-temporary-44460632.wpcomstaging.com/2021/02/21/transports-a-lot-of-degrees-of-trend-coming-together-heads-up/
note, the symmetry of the moves … wave 1 = wave 5 and the internals of wave 3 are perfect … 1 = 5 and 2=4.
you’ll also see some numbers to the side those are projections showing the clear symmetry in the waves
lastly, we were so so close to hitting the 16180 or 1.618 high .. off by .1 percent. anyway…. if you open your eyes to the harmonic ratio you will see a ton of examples.
just to show you … here’s the USD versus the LOONIE on a LONG TERM monthly and note the top …
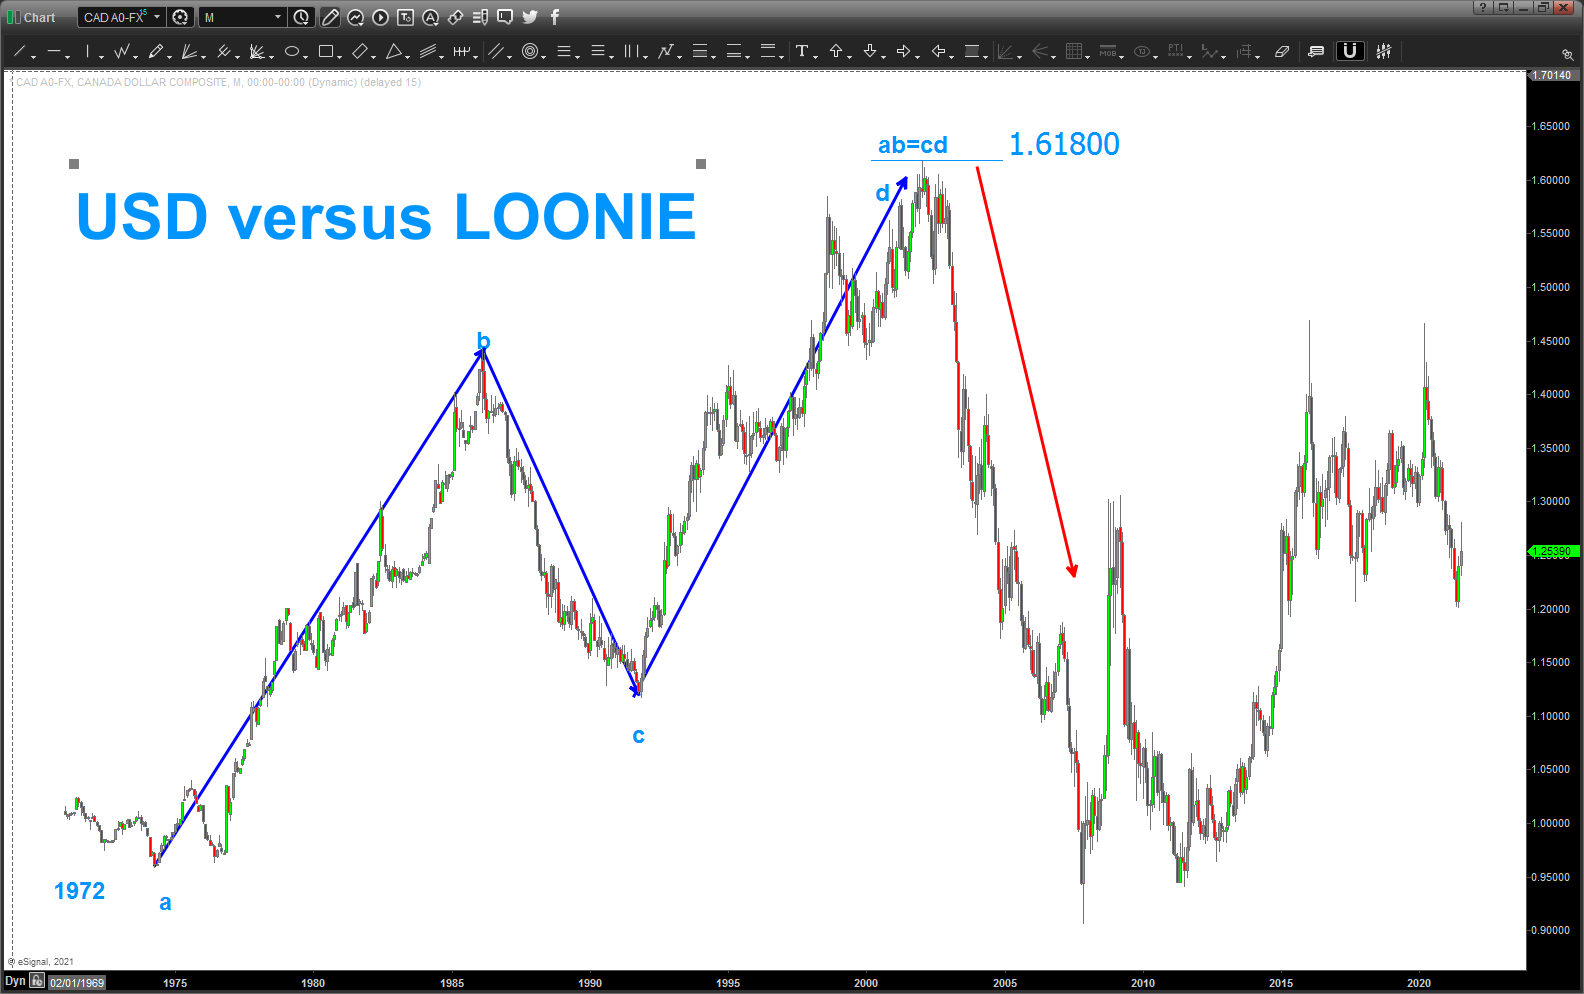
yes that’s a MONTHLY AB=CD and then, just for shits and giggles went up and tagged 1.618 and “night night.” Just saying … pattern on a harmonic number, pay attention.
anyhoo .. here’s the chart for the transports …
El Coino (the Coin) aka Bitcoin
Posted on July 26, 2021 1 Comment
that was QUITE the pop today and we are getting close to resolving “one more leg lower” or was that it …
either way, my BULLISH outlook on Bitcoin remains … the chart below is the bearish option and the one I’m going w/ for now … but, we will know soon.
be ready to shift to the “low” is in place and we are advancing in a 5th wave (foot stomp) but the move should be big ..
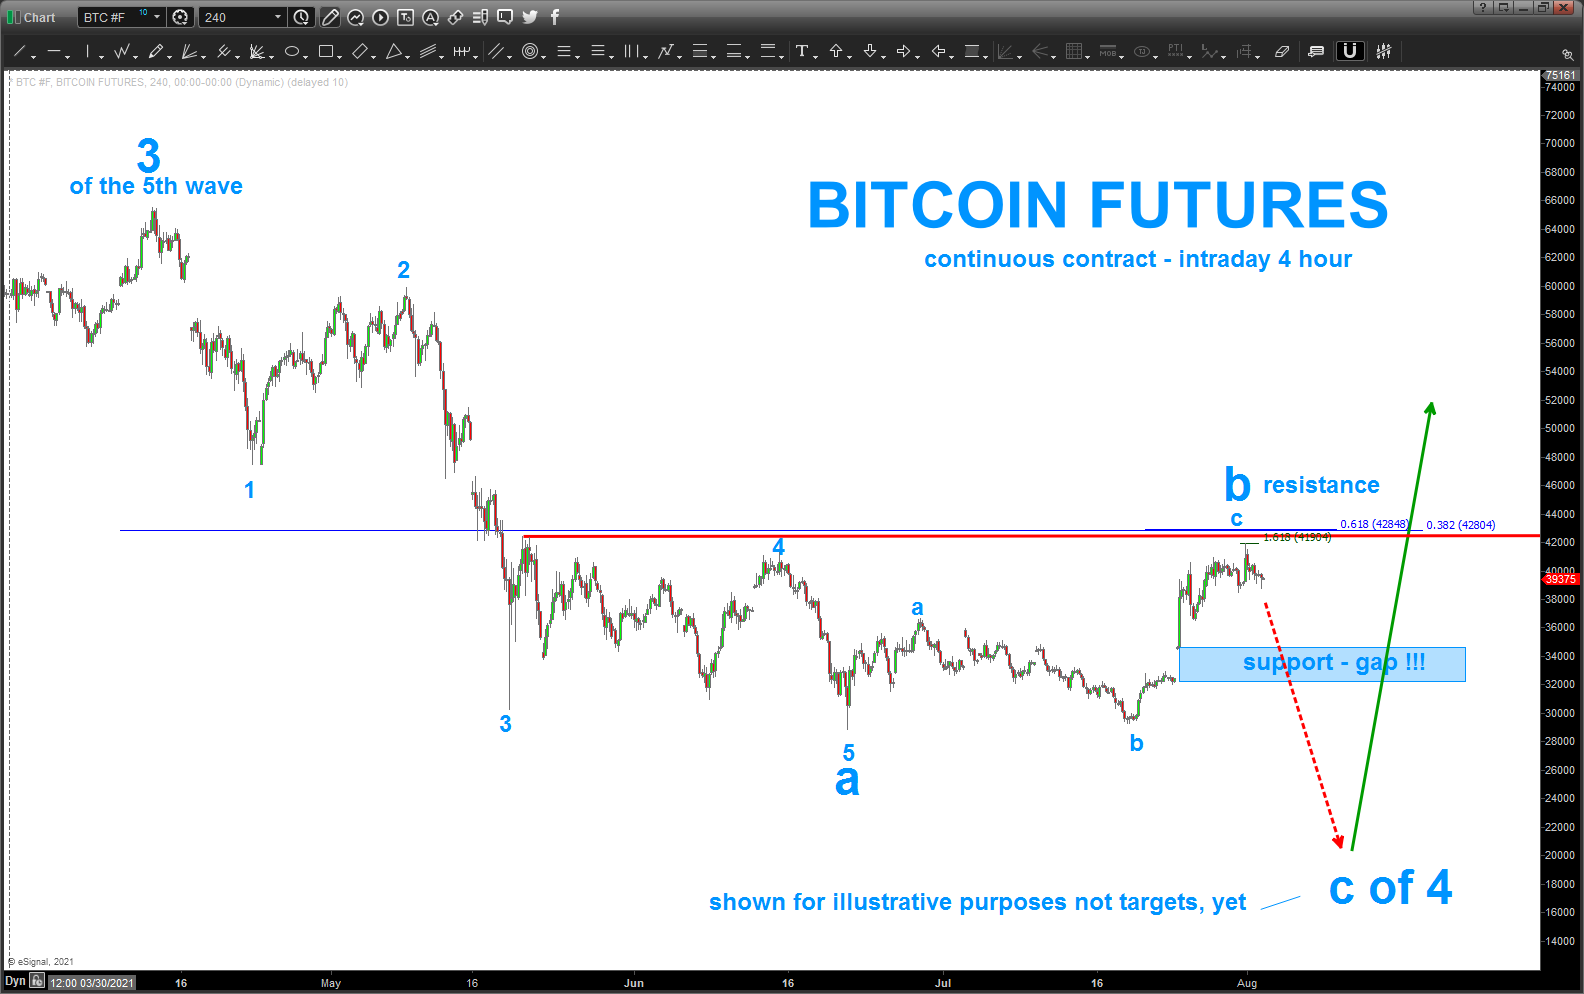
so, in the more near term bearish you can easily see we did 5 waves down and now we are simply doing a 3 wave B move and then a BIG C wave to come …
I’ve noted a very important level for resistance .. if that holds and we start down lower then it should be impulsive and powerful (like a classic C wave) …
I want to see that “resistance” level noted above to being take out to the upside before going long. truthfully, would love the a-b-c to be in play as it will give us a better AND a rule of life is that the C wave HAS TO BE 5 WAVES (EWT) and it’s usually very violent and harmonic and pretty easy to count so when we do go long, we should have a very risk controlled entry to go long.
yes, big spike today, but don’t get fooled or too bought into the bullish case, just yet.
hope makes sense .. let me know if I’m missing anything.
Bart
XLRE – Real Estate
Posted on July 13, 2021 2 Comments
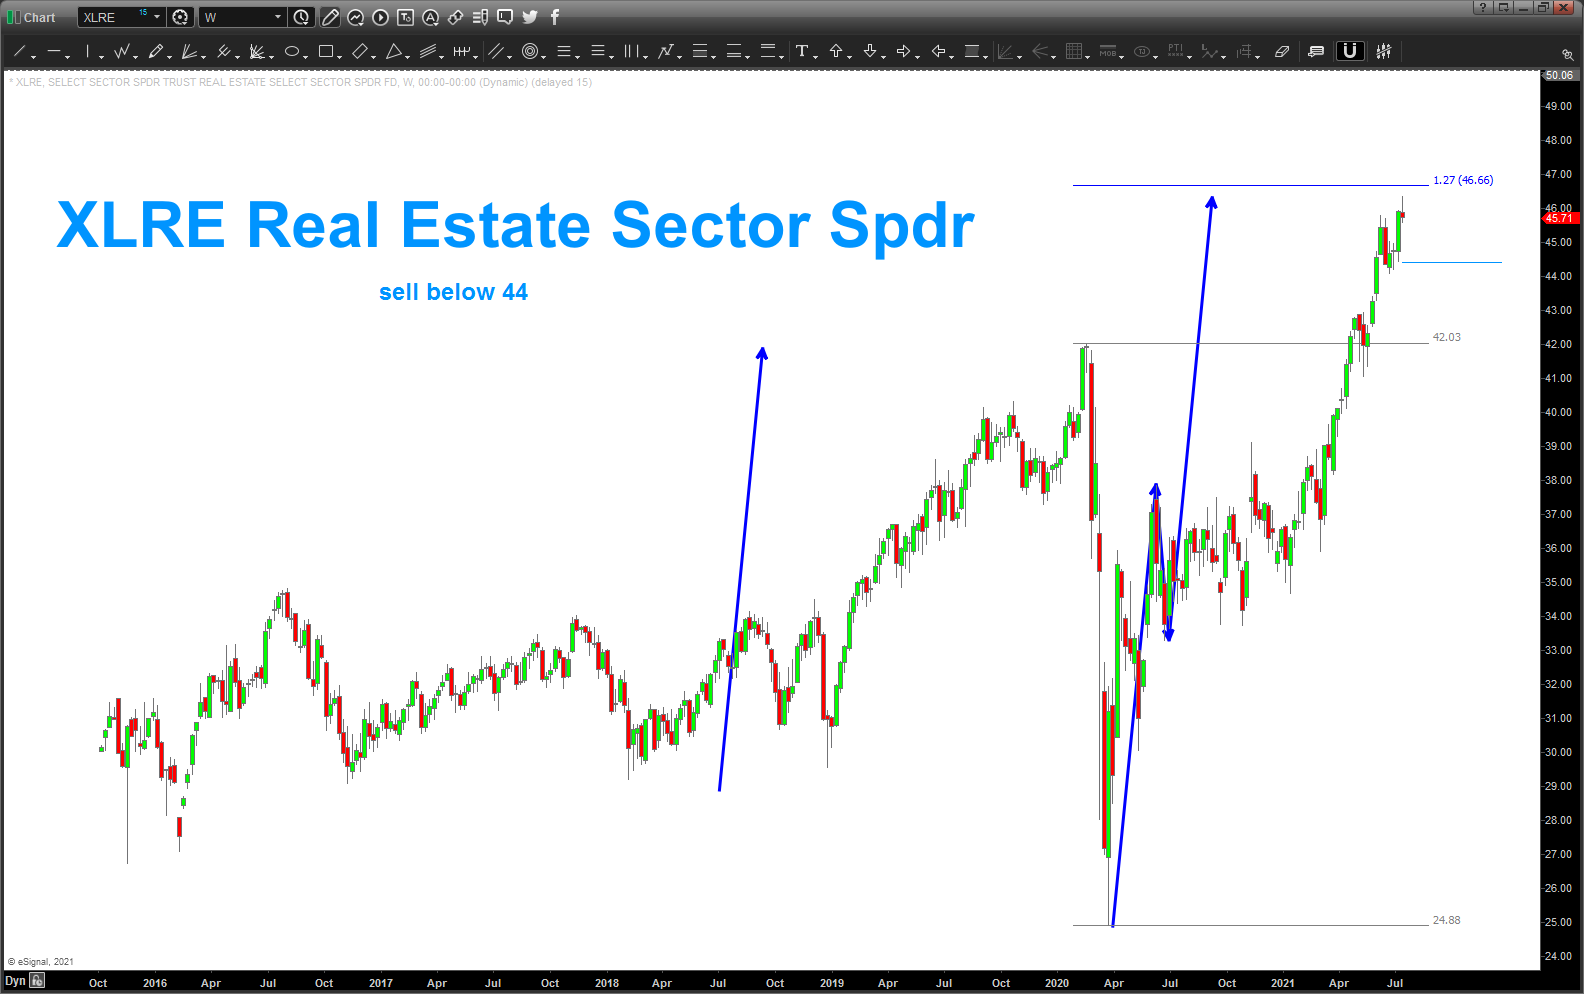
if the blue measured moves tell us anything … corrections usually occur at their completion. right now, we are at that extreme and we are banging up against a 1.27 extension. would use that level ( or a little higher) for stop out point and would look to sell on a close below 44.50.
night night red hot real estate? nah, never …
Bart
AMC
Posted on July 13, 2021 1 Comment
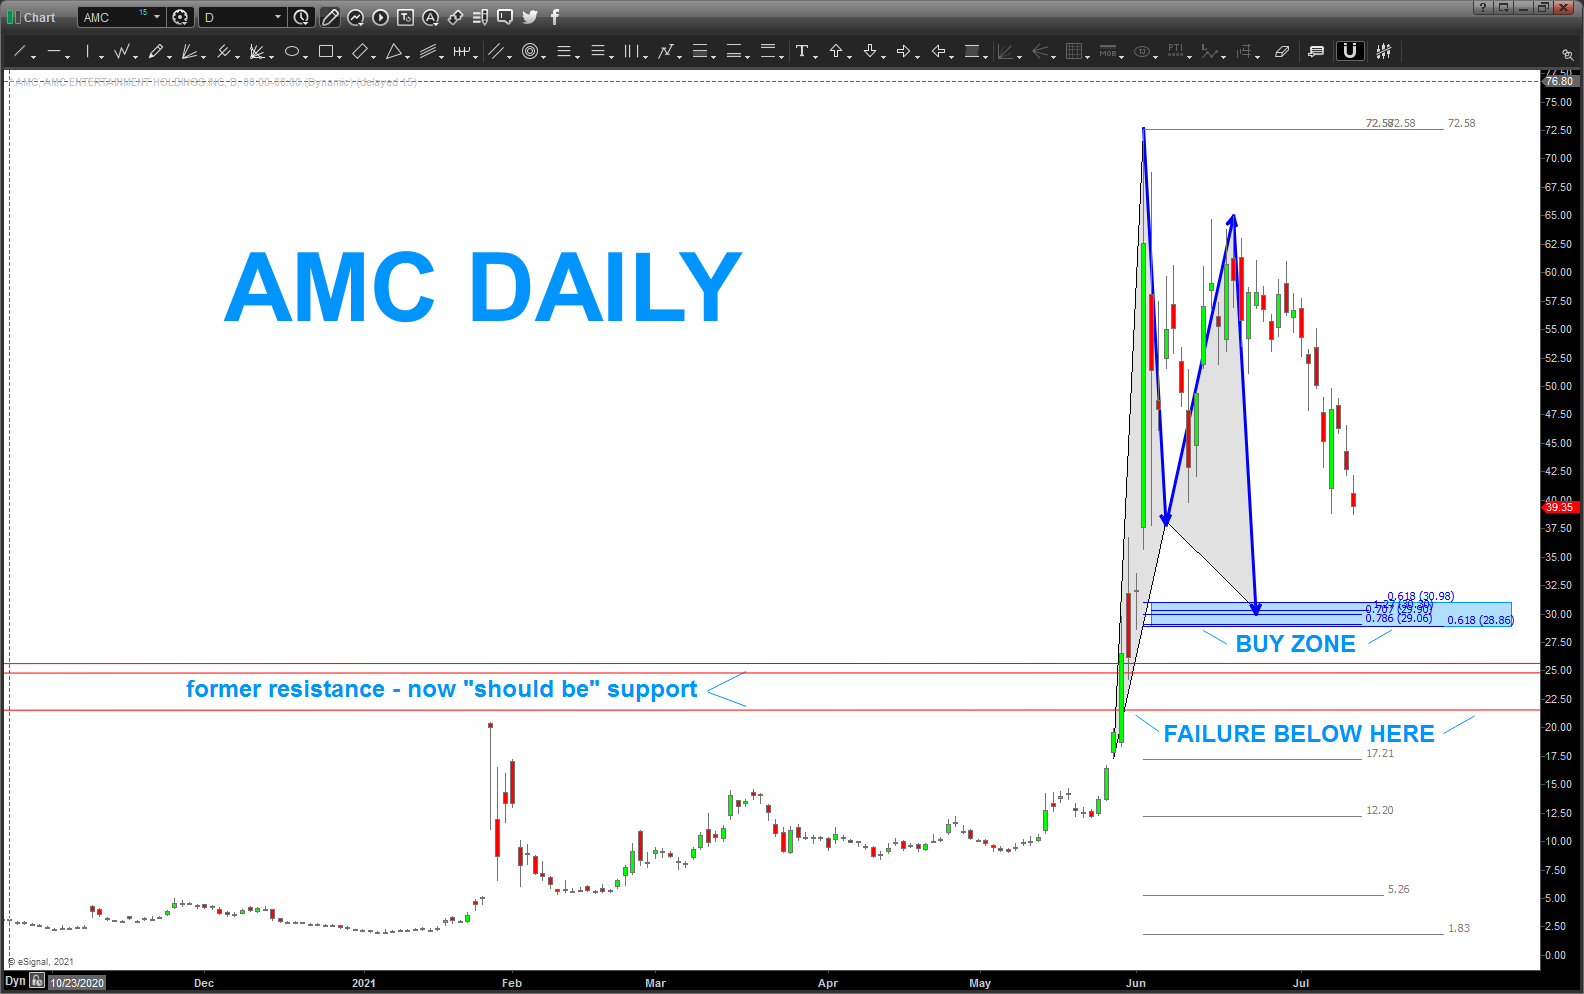
the masses are at “play” here w/ AMC and what a better laboratory to test harmonic patterns than on THIS stock …
the only caveat – it’s all probability. that being said, w/ the balance of thousands upon thousands of our fellow retail traders holding 2 shares portfolios at risk, we can enter w/ a defined point and another defined point of where we are wrong …
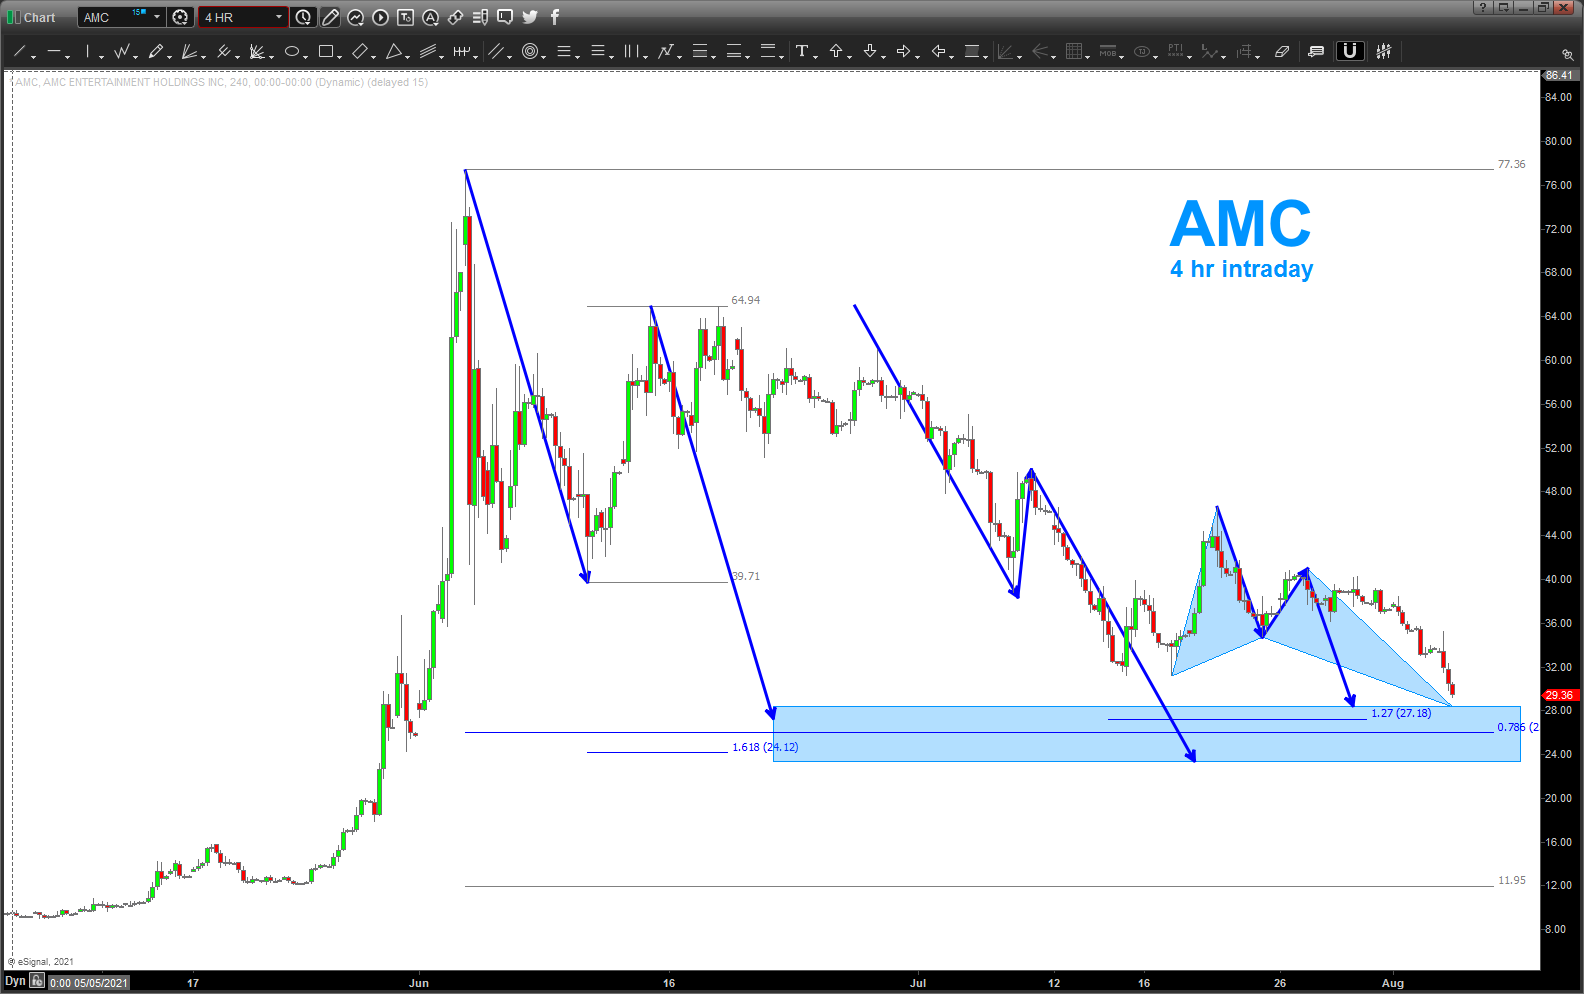
so, the GARTLEY PATTERN buy is 28.80-30.98.
the red lines are back from the weekly/monthly and are horizontal lines placed upon former resistance that should (operative word) act as support .. the polarity principle.
anything below the above and this puppy is cooked …
thanks for reading …
TBT update
Posted on July 11, 2021 1 Comment
last post on TBT: https://atomic-temporary-44460632.wpcomstaging.com/2021/06/20/tbt-3/
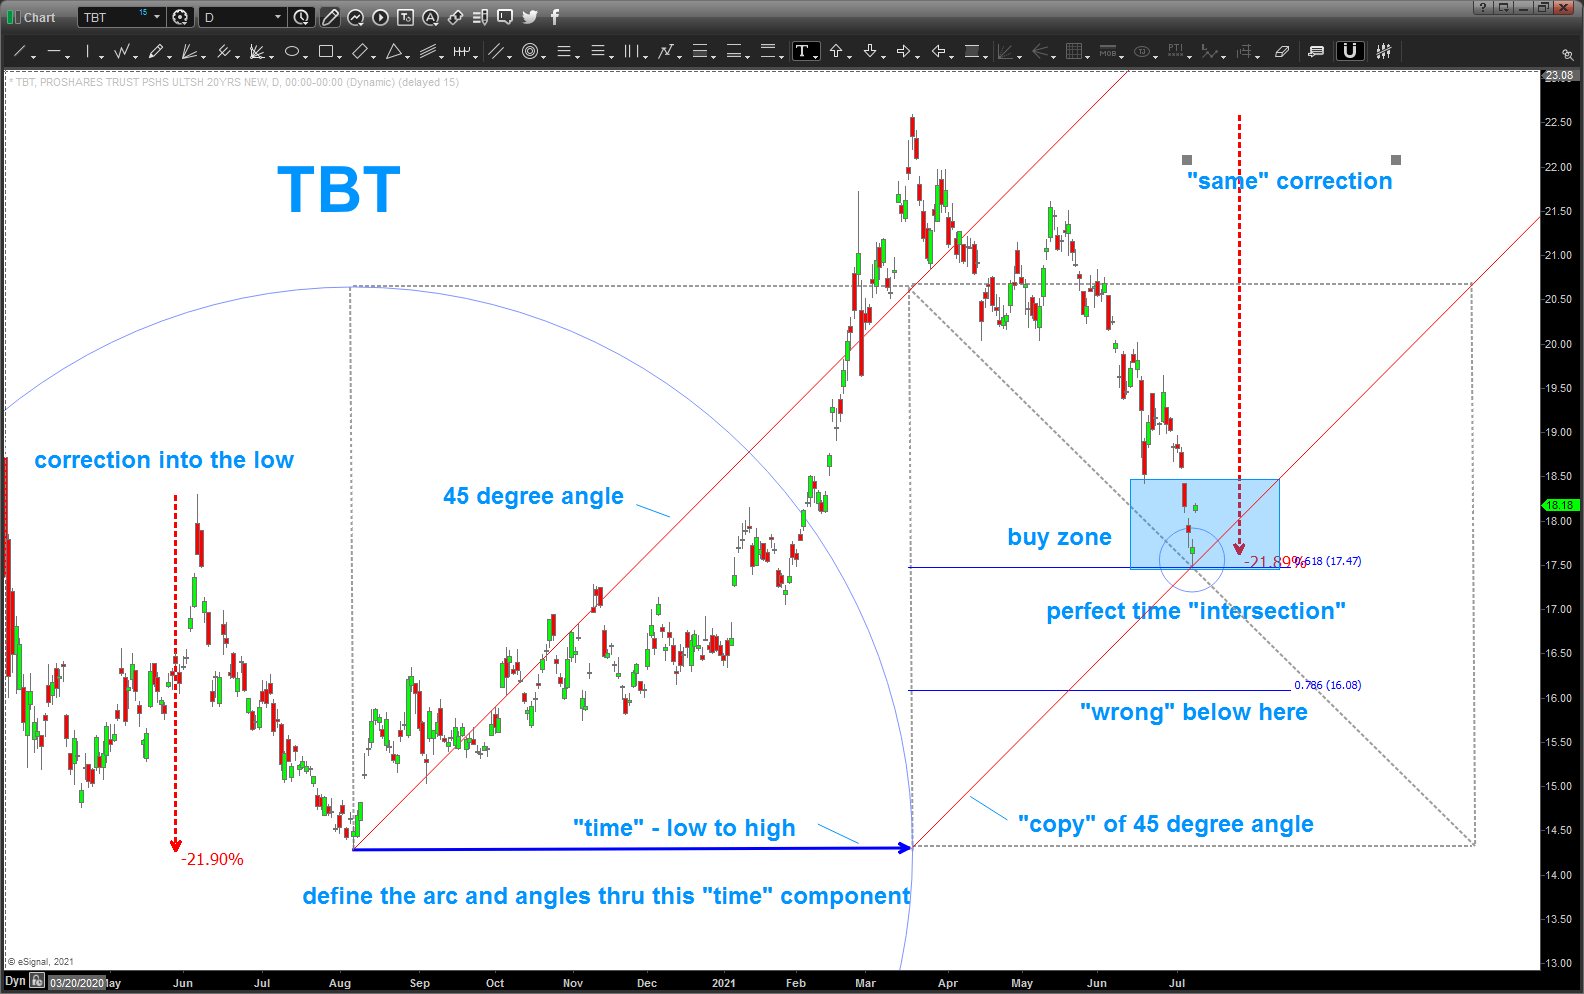
TBT has fallen into the bottom level of BUY zone and I’m long TBT in/around 18.
A lot going on w/ his chart but wanted to show you some “other” geometry that I was working … you see, we can make arcs and develop trend lines using the geometry of the chart but also, using the TIME and PRICE to define the vectors.
in this case, we take the all time low and draw the bottom of the square to intersect the “time” of the high. that will define our arcs and the square. the most important aspect of a square is the 45 degree angle (red line) and that line we then “copy” and “paste” to the bottom right of the first square and, well look at that … it intersects the LOW almost exactly. we also draw another square (and we can/will keep drawing these squares to find the trend lines running the show) and notice how the two 45 degree angles TIMED the low almost exactly .. (FWIW, this was a precise 1.618 AB =CD and a .618 retracement along w/ the same percentage corrective move that drove price into the all time low … came in around 21-22 percent decline.
so, while we do have the traditional “slap a retracement grid and look for the .618 retracement and a whole lot more …
take some time to study this chart .. try to understand it as it’s very helpful, indeed.
and, w/ all this work, I’ll consider it “wrong” if we get a daily close below 16.08 (.786 retracement)good weekend to everyone …
Bart
Bitcoin .. short term still favors the bears
Posted on June 28, 2021 Leave a Comment
last post on Bitcoin: https://atomic-temporary-44460632.wpcomstaging.com/2021/06/21/bitcoin-update-3/
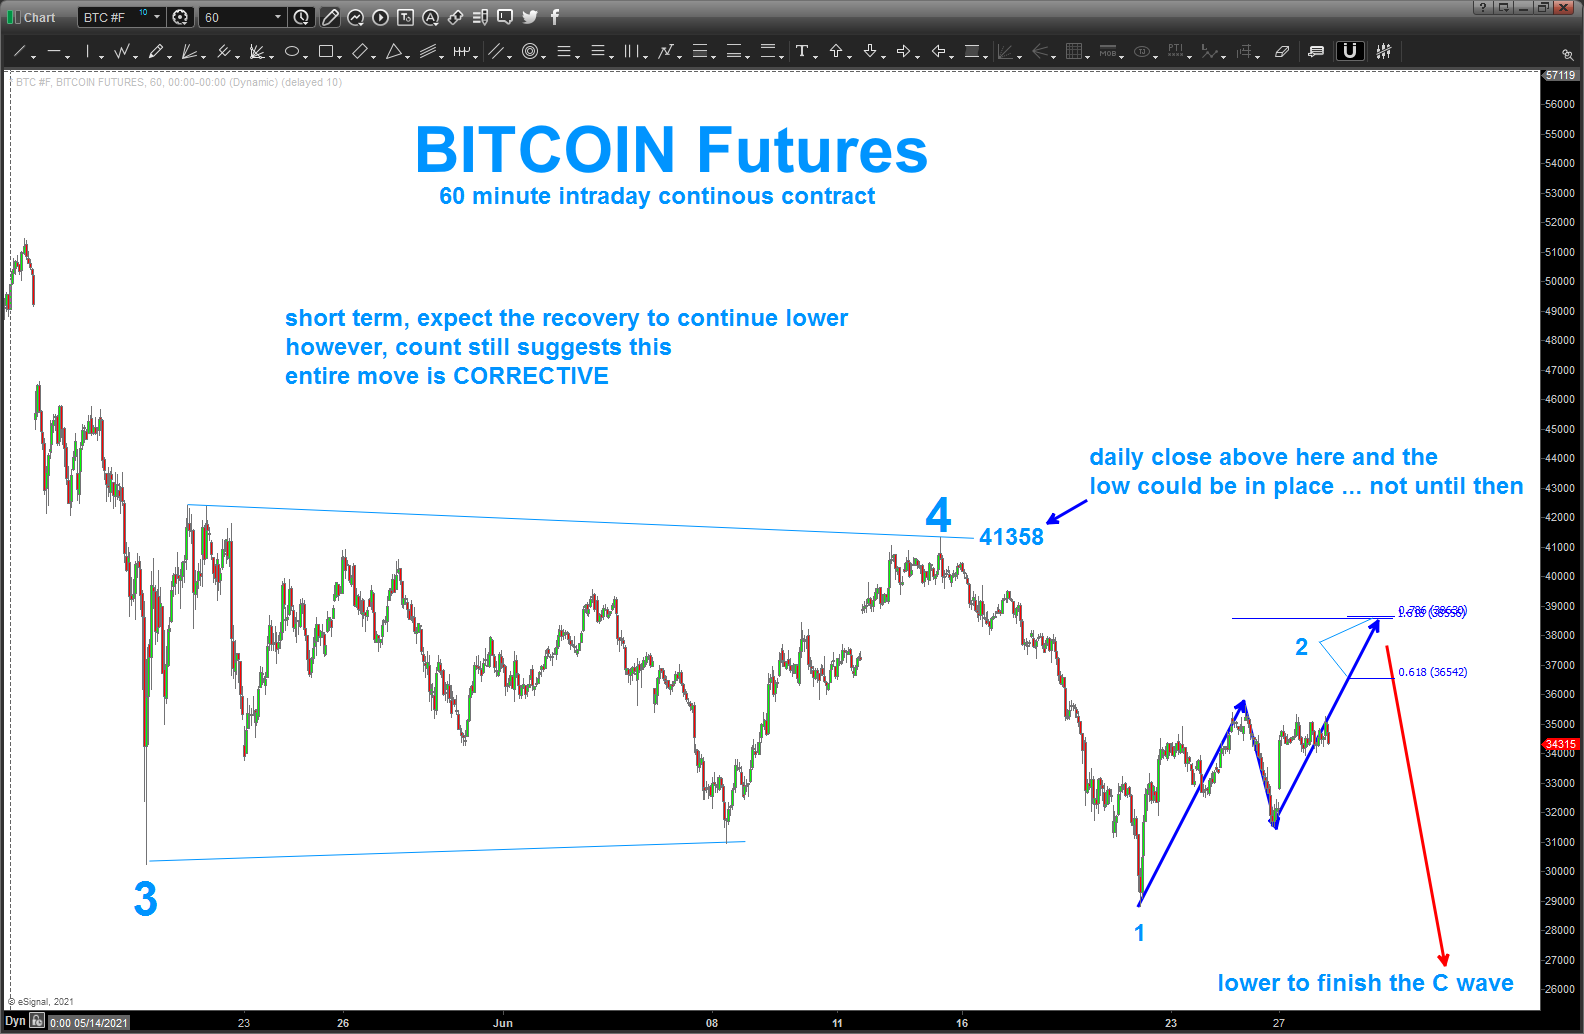
nice rally from the fresh lows in the high 20’s .. but, for now, still suggests a correction in a ongoing 5 wave C wave pattern.
if we blow thru 41358 (note futures contract – other prices may vary) on a daily close above then, more probability that the low is in place for an advance.
for now, a near perfect Gartley Sell Pattern exists in around 38-39K
Bart
Bitcoin Update
Posted on June 21, 2021 1 Comment
last post on the Coin: https://atomic-temporary-44460632.wpcomstaging.com/2021/06/02/bitcoin-need-some-energy-thrust-to-prove-low-in-place/
lot’s of pressure on the Coin … certainly doesn’t look like the low will hold and will plunge into the 20k’s.
here’s the deal, this smells, feels (I’ve been “scrambled” (surfing term being caught inside) by a C-Wave before) and while it’s a fools game to pick tops or bottoms, I’m trying to find the pattern that will give us the best entry.
I’m long the Coin and getting some egg on my face (see scrambled above) but am going to hold to look for some support and the possible low to be in place to begin the march higher … what do we have going:
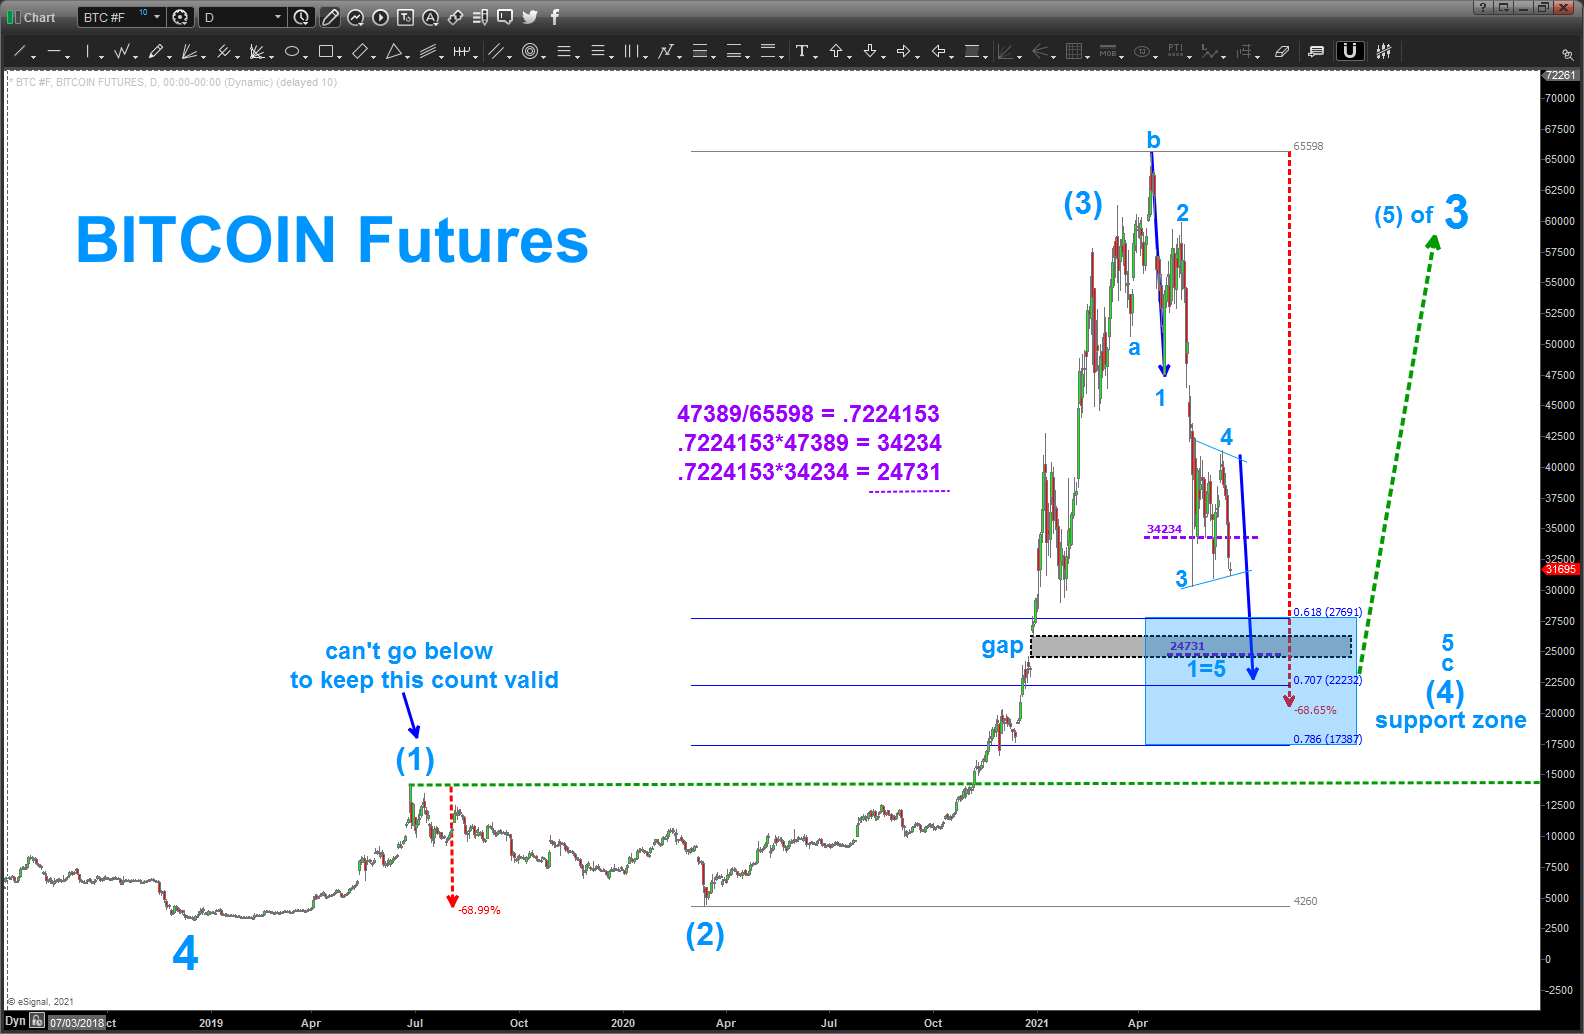
Note (3) up near the all time highs .. I REALLY LIKE when a new high is made on 3 waves. that is a classic “b” Wave into the new high and then C wave wipes everyone out – like right now.
the wave count (if this is correct) shows 5 distinct waves down from the high … a “guideline” NOT A RULE is that when 3 extends (in this case 1.618) then 1 = 5 (blue arrows into/around 23K)
a RULE is wave 4 (we are in an expanded flat wave 4 correction right now – if correct) is it cannot go below the end of 1 .. (dashed green line) around 15K. If we go thru 15k to the downside then wipe out the count and this is 100% wrong.
I threw a “basic” retracement grid up there and highlighted the blue box for a support zone that would 1/ finish 5 waves down, 2/ finish the C-wave and 3/ end (4) and then we go UP into the 70’s to start …
also, threw in the fundamental frequency targets (dashed purple lines) and also used the largest percentage correction (dashed red arrows to find the mid-20’s looks like a stopping point to give another a shot ..
hope this helps.