always have a blast w/ JC …
Posted on November 17, 2021 3 Comments
we follow up on why the 233 – 234 level was such a big deal ….
enjoy – some nerdy stuff talked about- your warned.
VALE
Posted on November 17, 2021 Leave a Comment
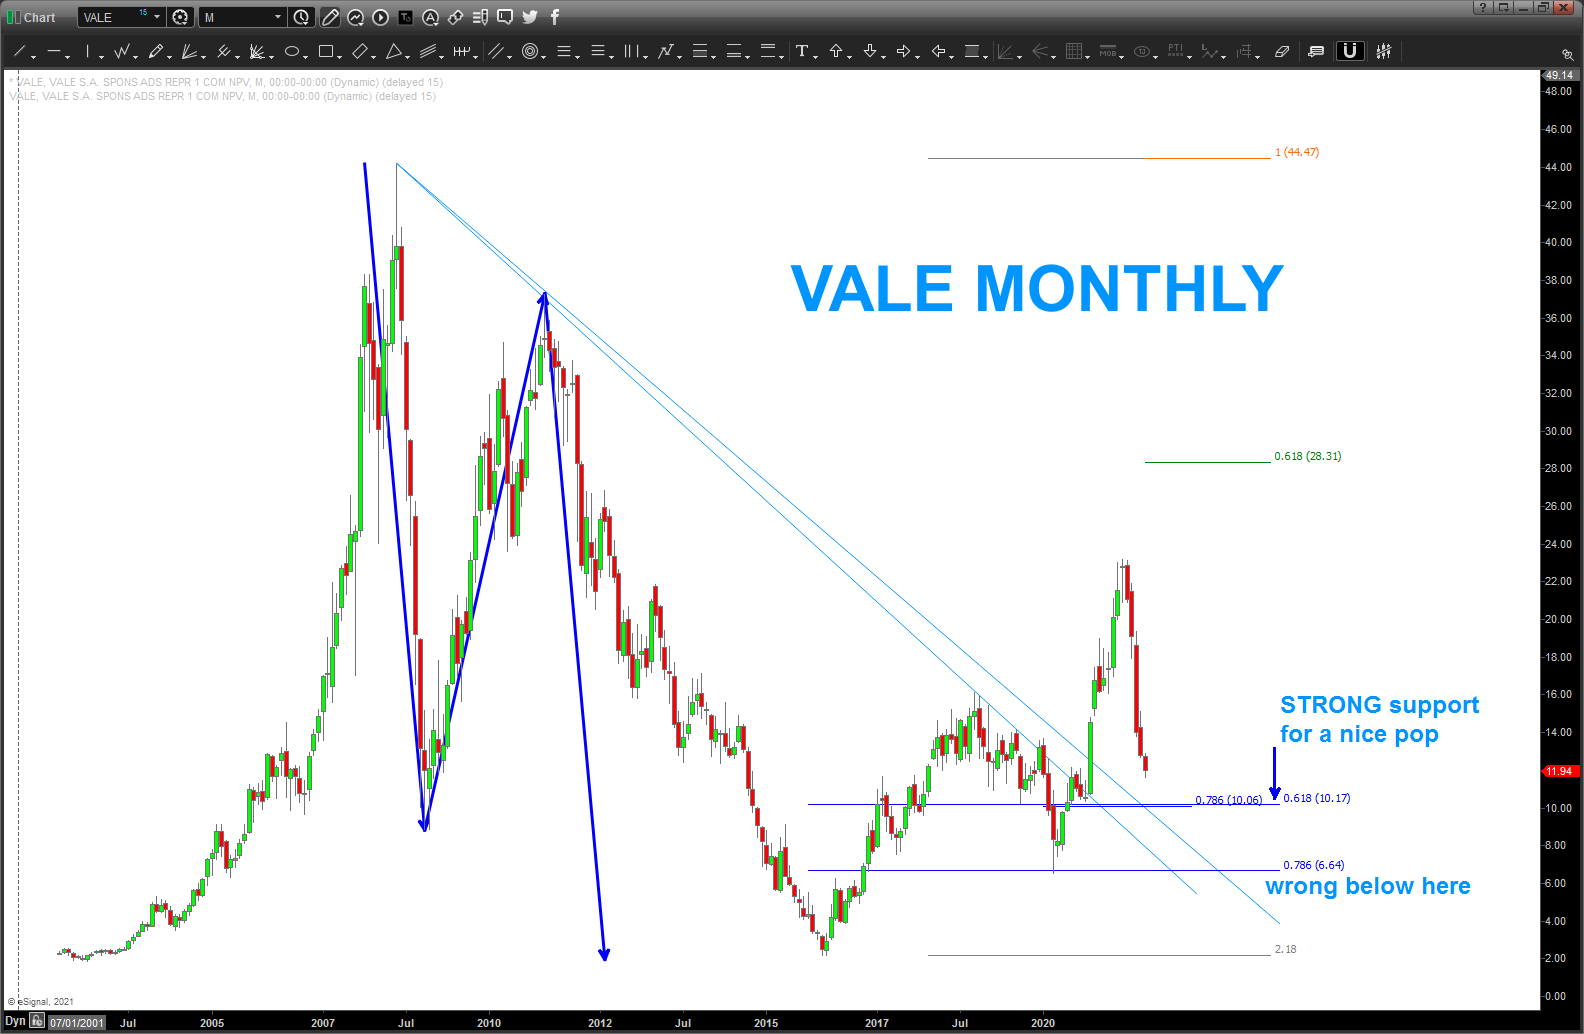
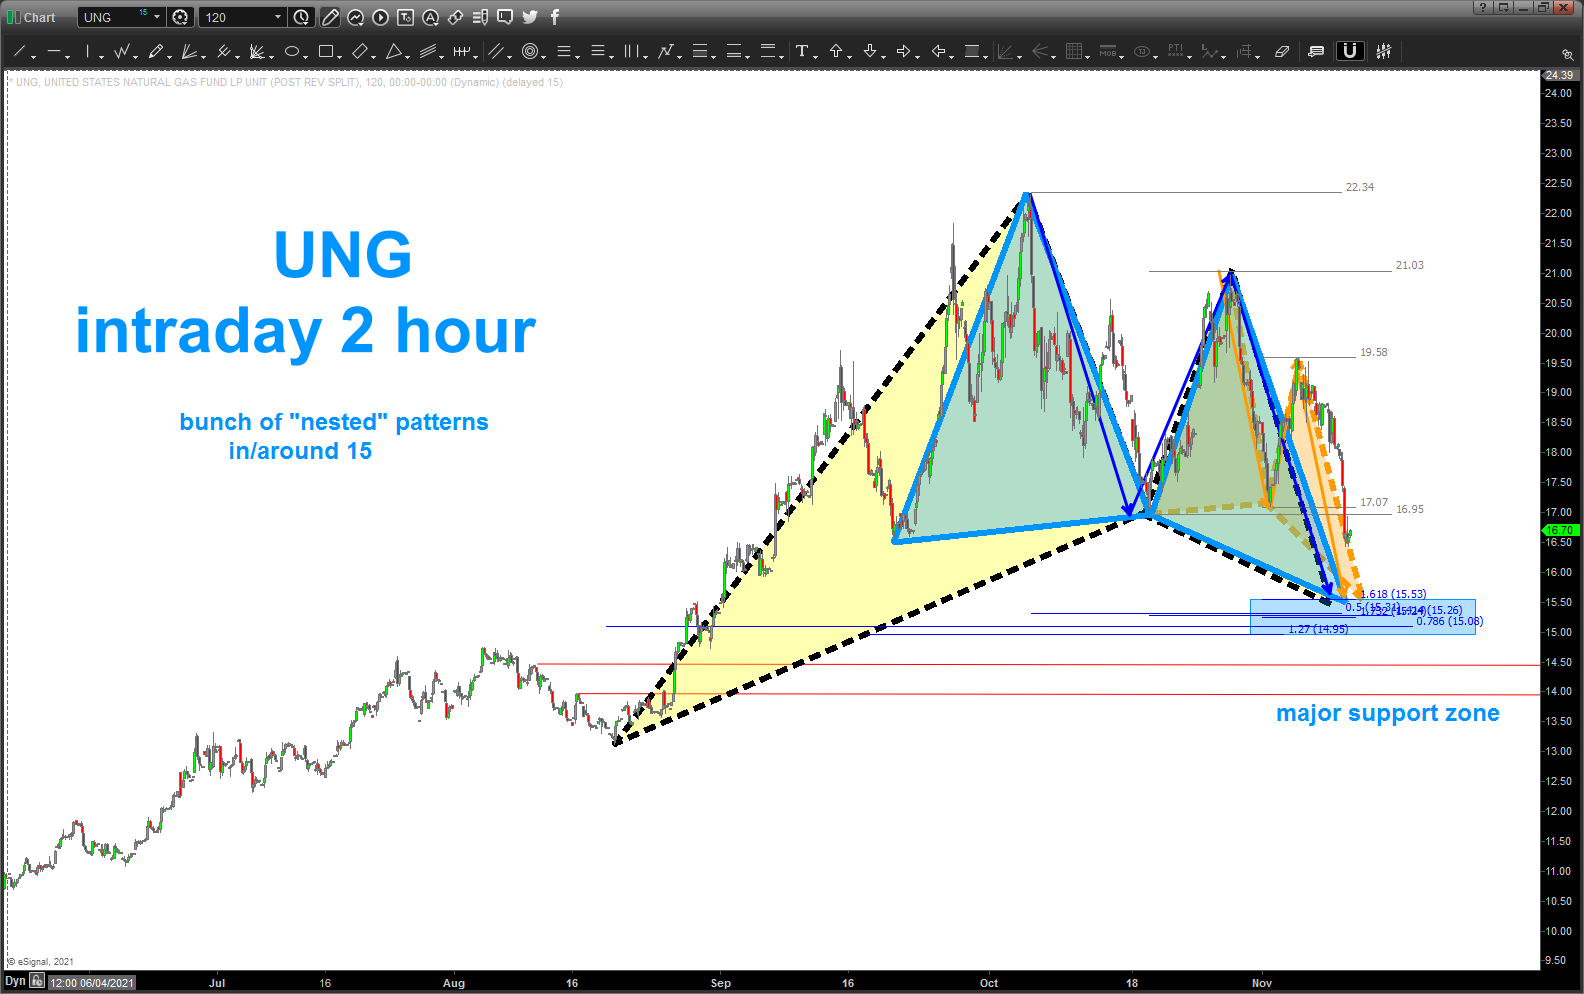
when we have .618/.786 retracement levels on top of each other like below, it is good probability of support or a nice bounce … I’m not ready to call for a change in trend and this puppy goes from 10 to 30 or 40 but a quick options play in/around 10 for a bounce into 20 (?) seems reasonable …
UNG – Natural Gas – catch the next wave?
Posted on November 9, 2021 Leave a Comment
last post on NAT GAS / UNG: https://atomic-temporary-44460632.wpcomstaging.com/2021/11/01/ung/
the game plan/strategy is to BUY the first PATTERN in a “new” trend and if it works then probability is that the trend change is real …
Energy, Ags, etc. are exploding of late and GLOBAL shortages that are becoming apparent pretty much every day are REAL. so, if one thinks (trade what you see not what you think) that Nat Gas prices are due to continue to rise then we have UNG that will give you exposure.
if we break thru the low at 13 then I would consider this a failed pattern but we have some MAJOR support coming in/around 15 for the BUY to get long nat gas and, perhaps, hold this position for a LONG time …
it’s all probability folks …
below, you will see a MONTHLY on UNG since inception. wanted to post this chart so you could see why I wrote the above .. have we broken out in Nat Gas? have we begun a new bull trend? full disclosure, I’m long UNG down in the single digits and will be looking to ADD to my position at this pattern completing – if it ever does.
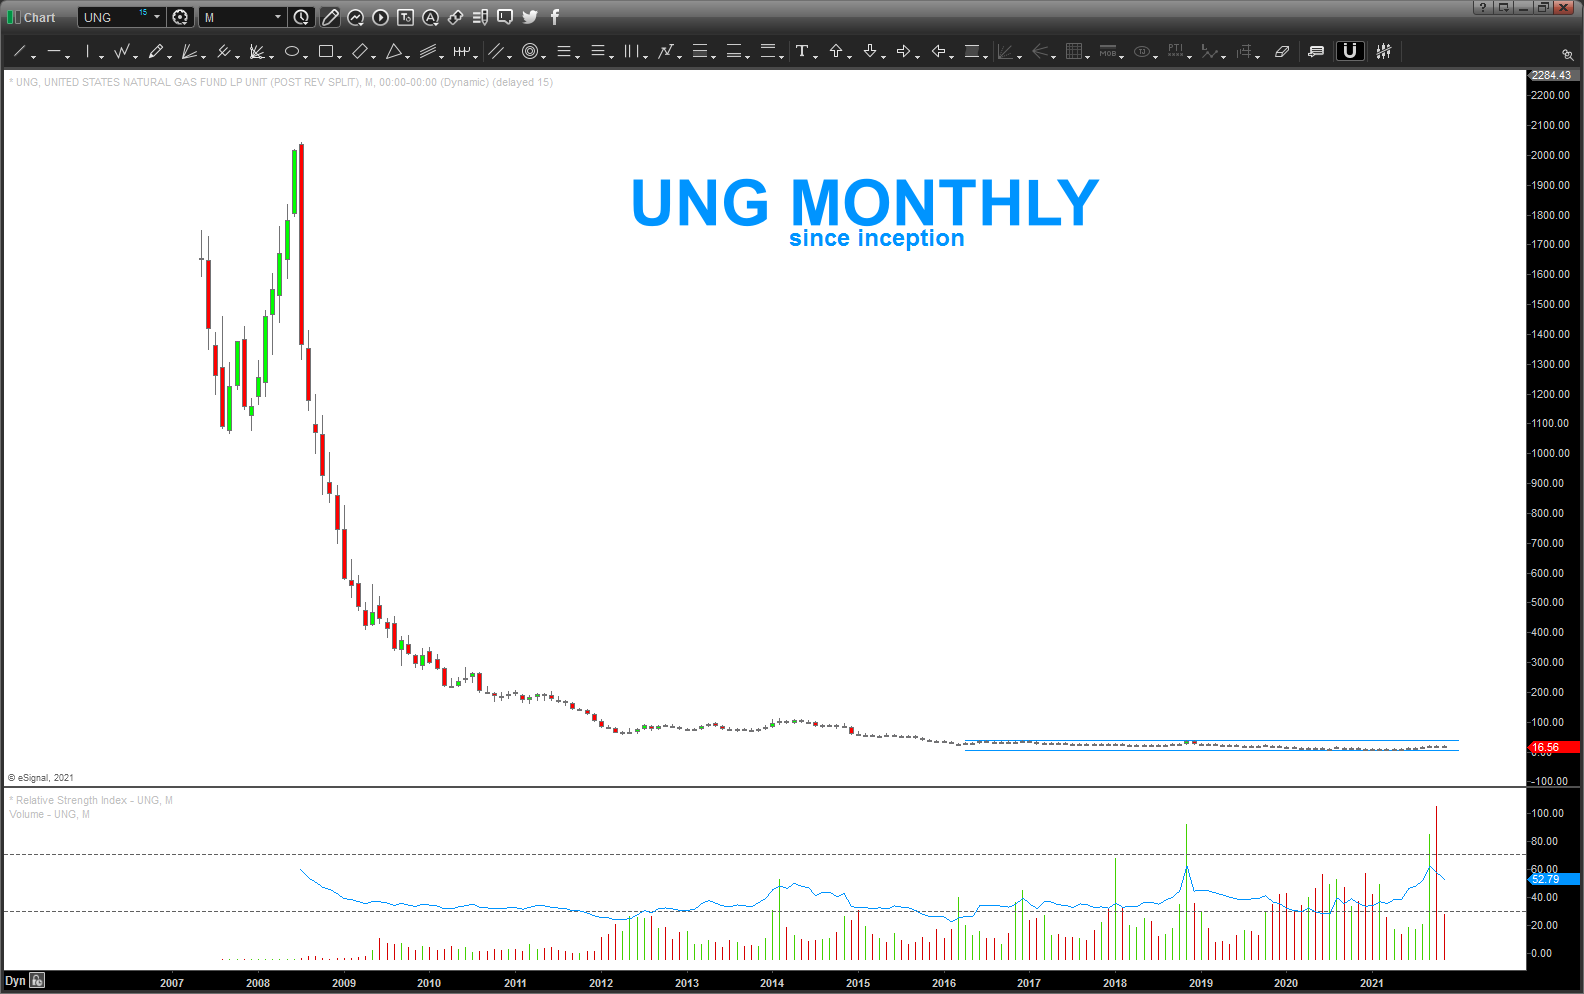
take note of the volume picking up and the fact that the RSI is at it’s highest level .. the key here, in the coming ongoing pullback, is where the RSI finds support … if we find support on the BULL ZONE (around 40ish) then we can start giving our change in trend some more probability … but, for now, we are speculating that a very investable low is in place .. don’t throw the farm at this one .. nibble at it … as we will see the breakout occur and there will be more time to get LONG if the “low in place” thesis is correct.
additionally, the “length of the base equals the price target potential is also nice here .. we’ve been basing for 6 years and, if you want to split hairs probably 10 years once that low was put in place 2012. bottom line, if this things goes higher, it’s going to go ….
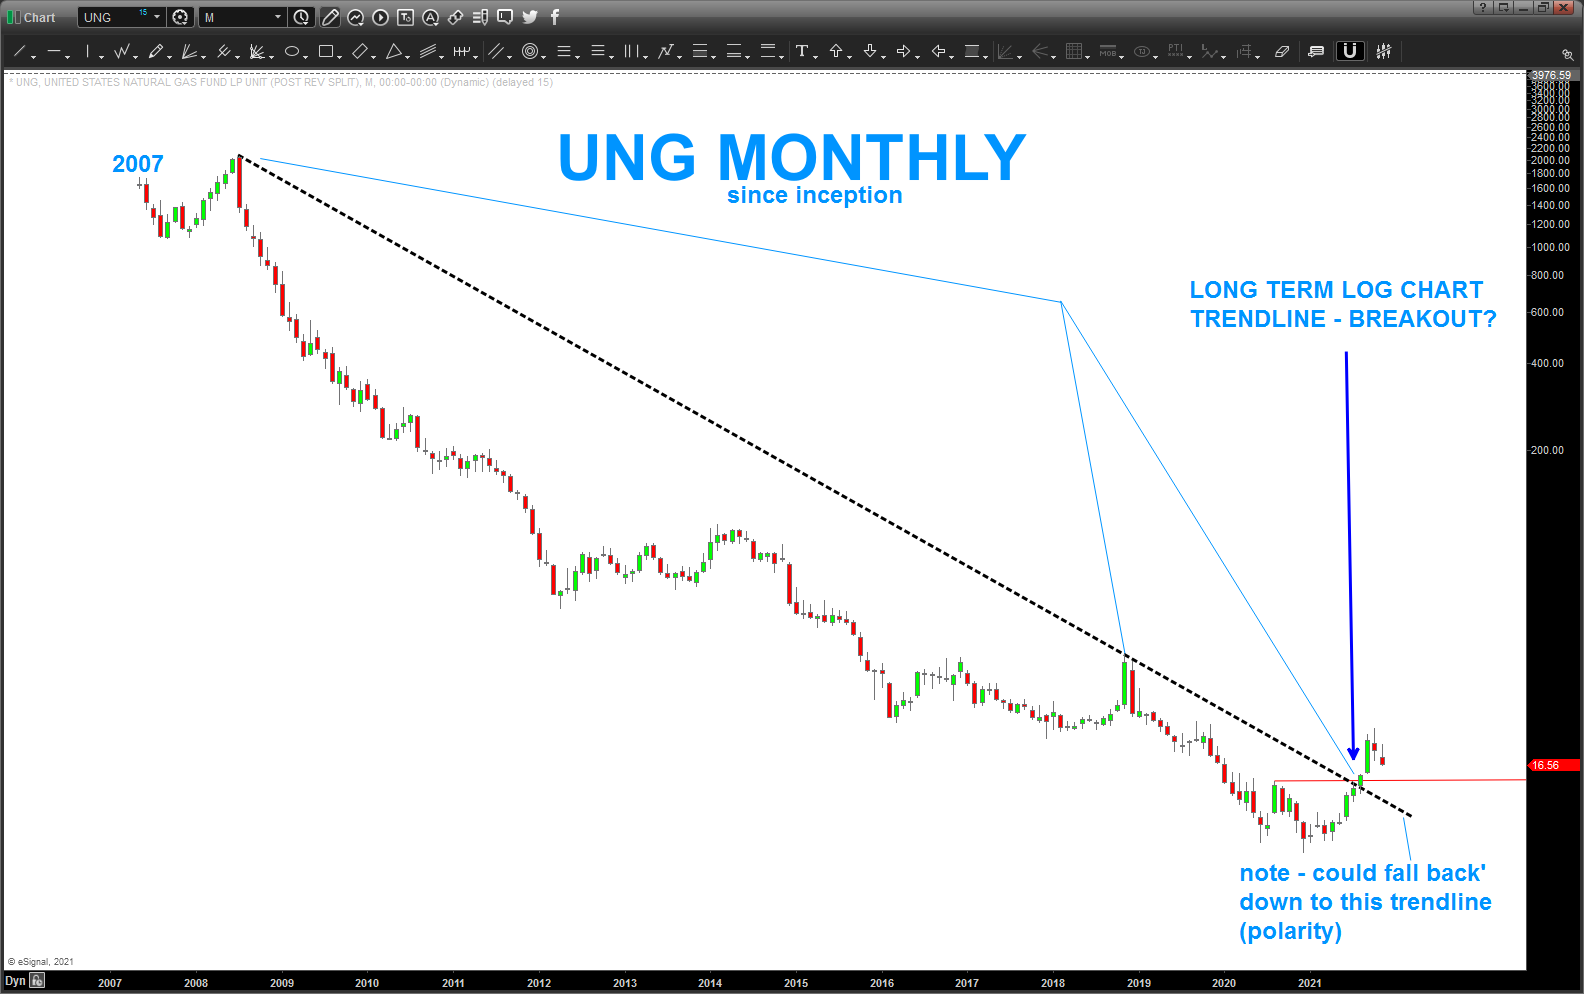
another way to check trend is via long term LOG charts .. LOG’s help you understand rates of change and are very good at giving first hints of big changes in trends or inflections …in looking at this on the long term log scale, certainly appears to have broken the long term log trend line …
last, when you are building a position, it’s wise to see how “strong” or “weak” that security is compared to high fast flyers .. in this case, for no other reason than randomness, I chose UNG/NFLX.
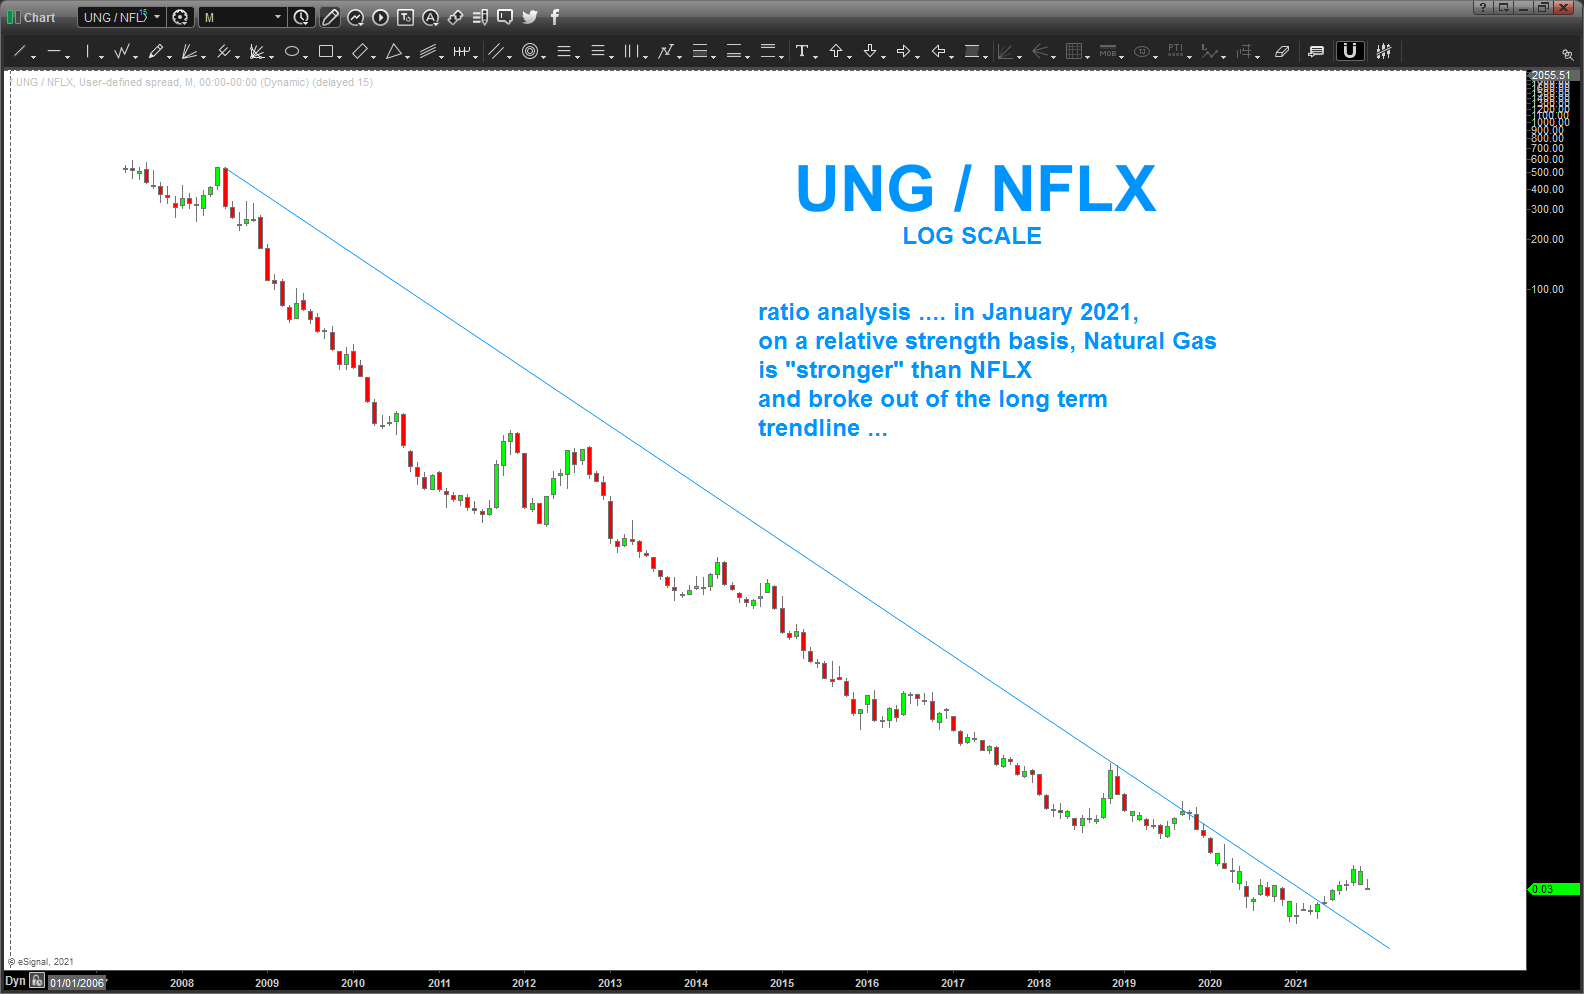
yup, Natural Gas has out performed (on a relative strength basis) NFLX for all of 2020
there you have it …
manage the risk.
Bart
NFLX
Posted on November 7, 2021 Leave a Comment
last post on NFLX: https://atomic-temporary-44460632.wpcomstaging.com/2021/10/13/nflx-abcd/
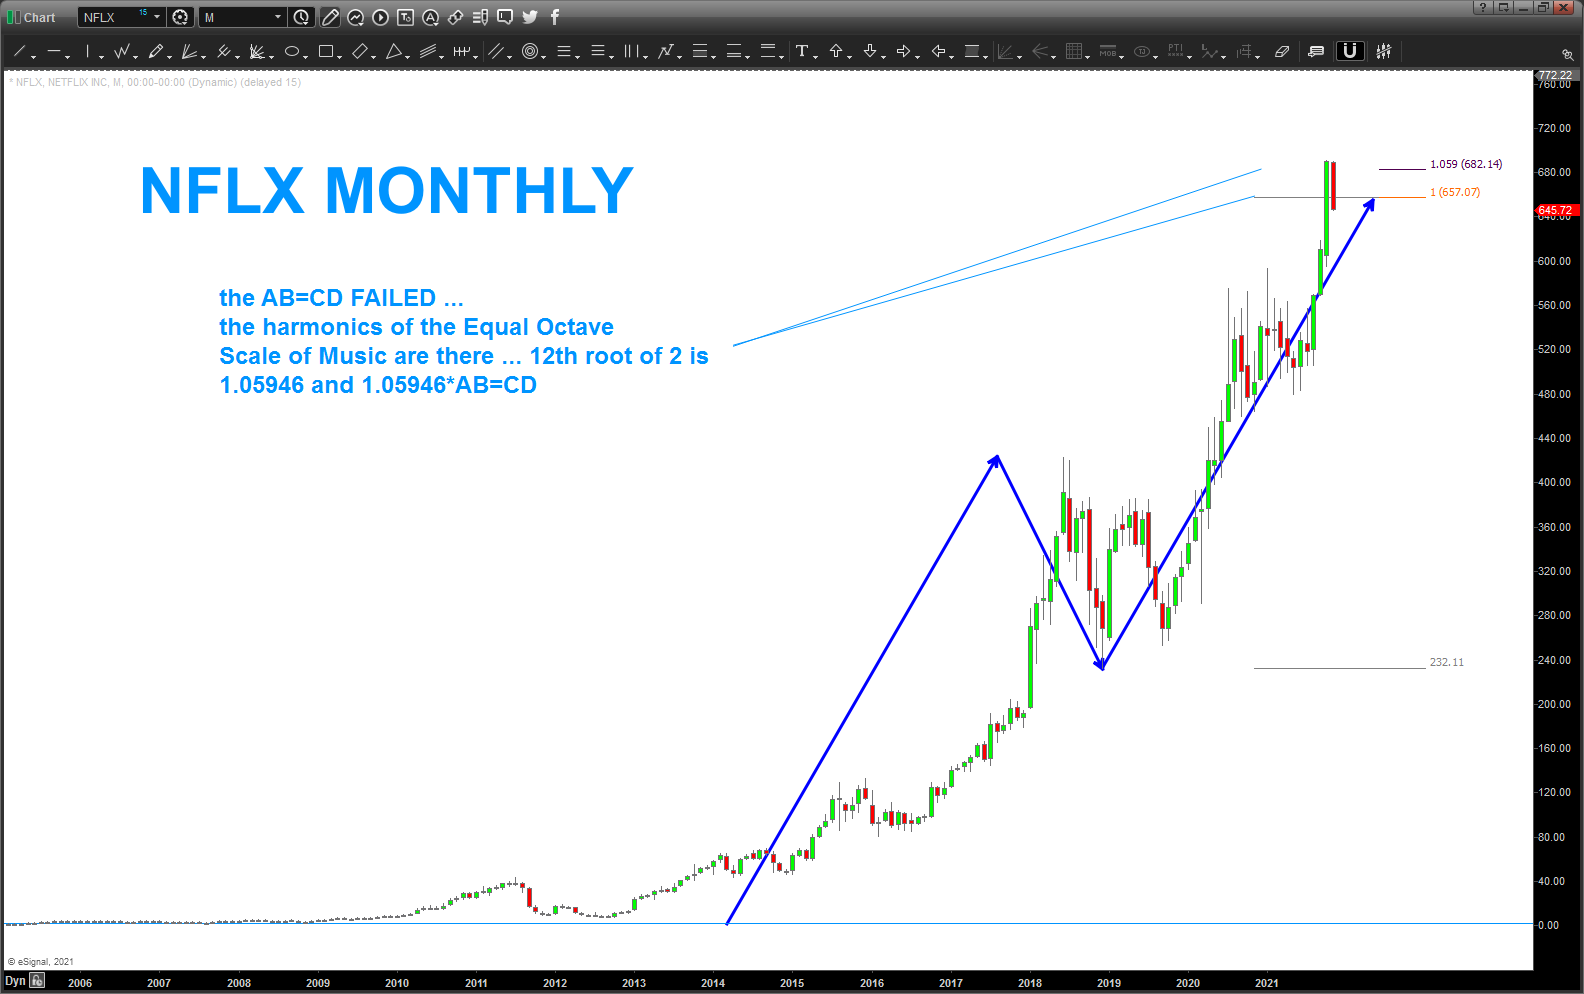
as you can see, the NFLX AB=CD failed by, roughly, 4% and w/ this price point one would have some pretty big exposure if playing single shares ….. I considered that PATTERN failed.
that being said, it was a PRETTY HUGE pattern (hence I called it chart of the year) so I went back and looked at the “form and proportion” of this move up into the high and I saw on a daily that we had some more “count” to go and a projection smacked us right into the high (for now, it’s all probability)I realized my ego got in the way here, putting something out like “chart of the year” … I can’t stand when NFL or NBA players make a big deal out of play … why would I fall into that trap? my apologies.
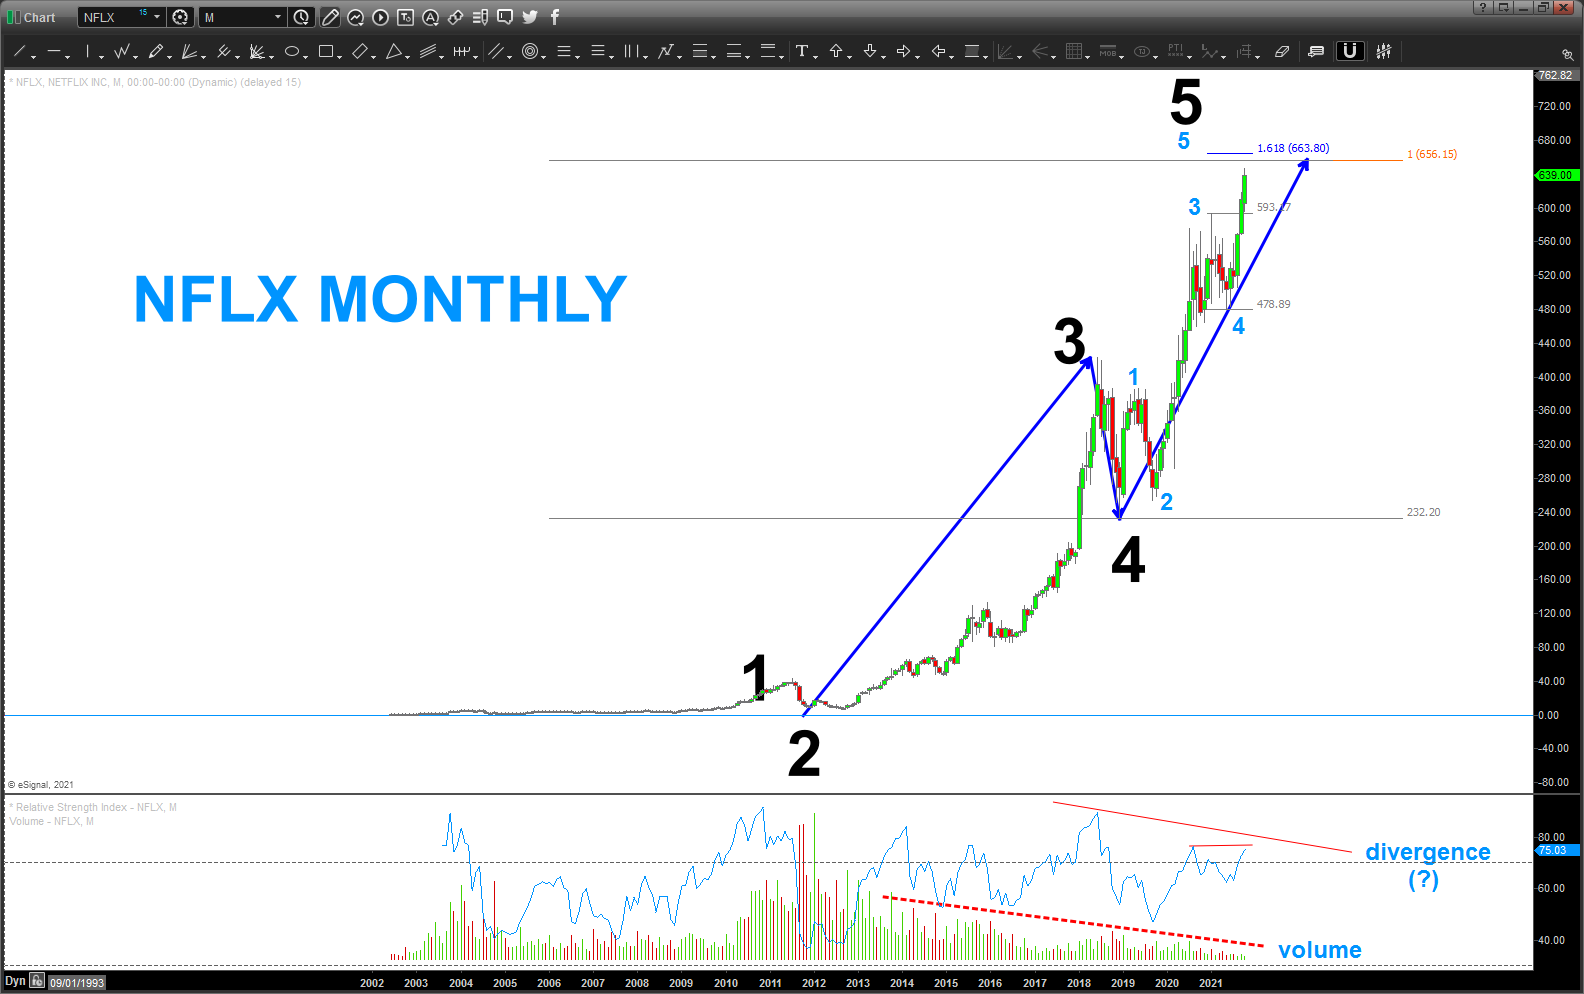
that being said, this is a pretty big target zone so I do think we need to take this top seriously. however, a REAL change in trend would be a MONTHLY CLOSE BELOW 600 as shown below on this DAILY NFLX chart.
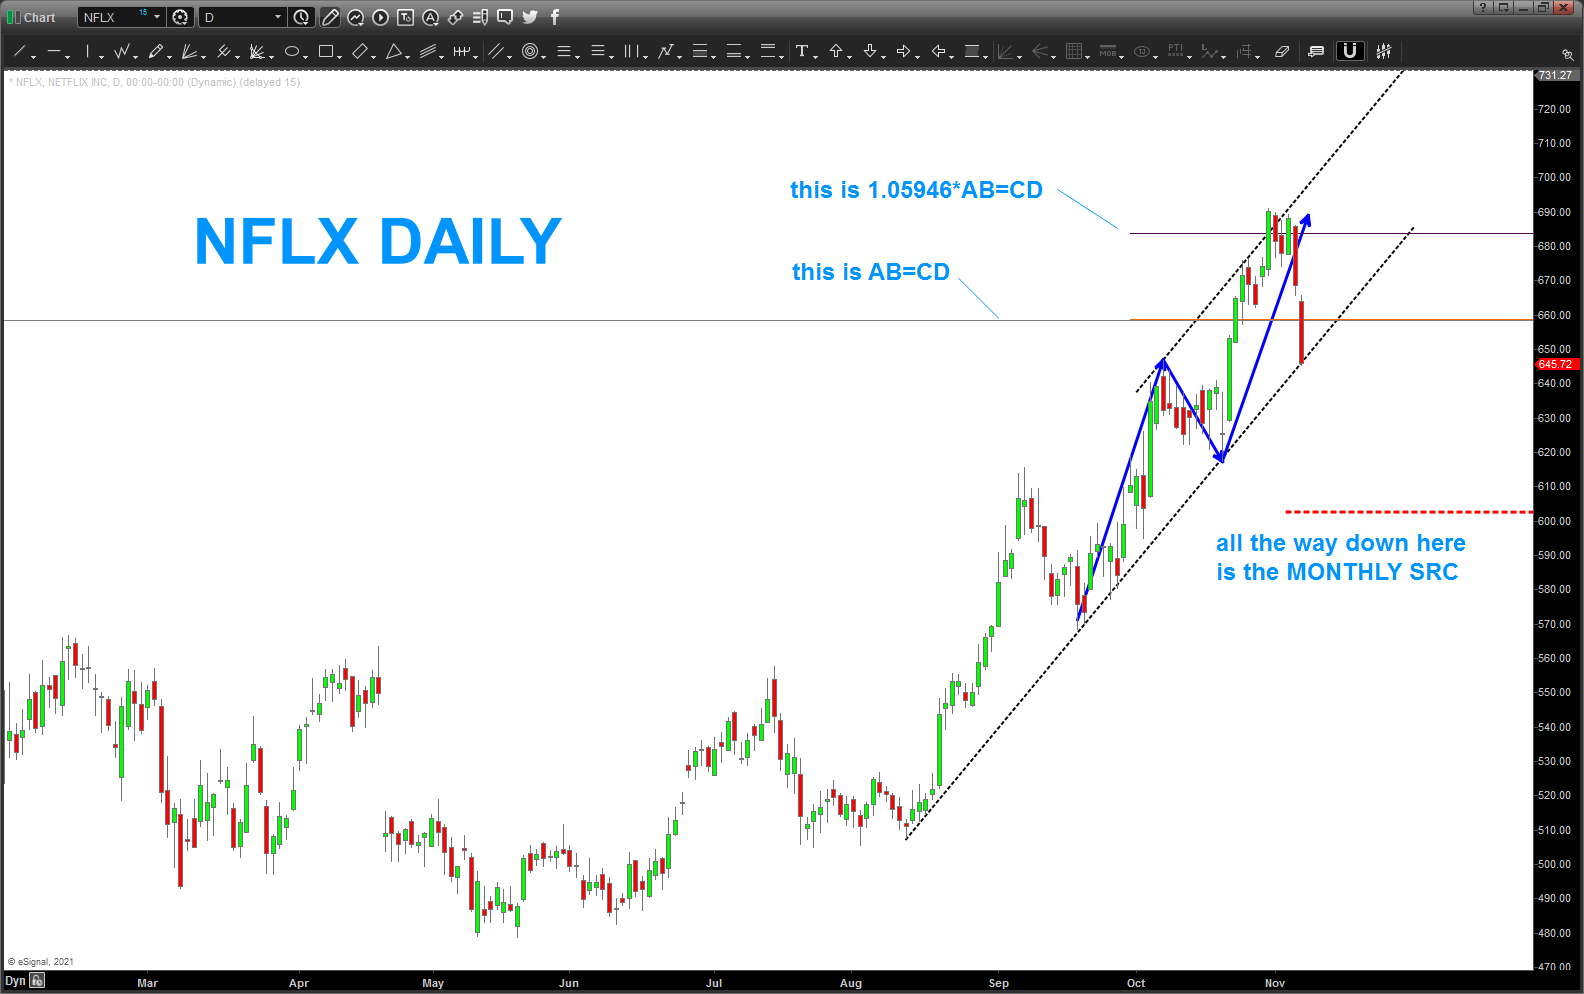
in order to fully understand the SRC or Signal Reversal Candle please pay attention to the chart below:
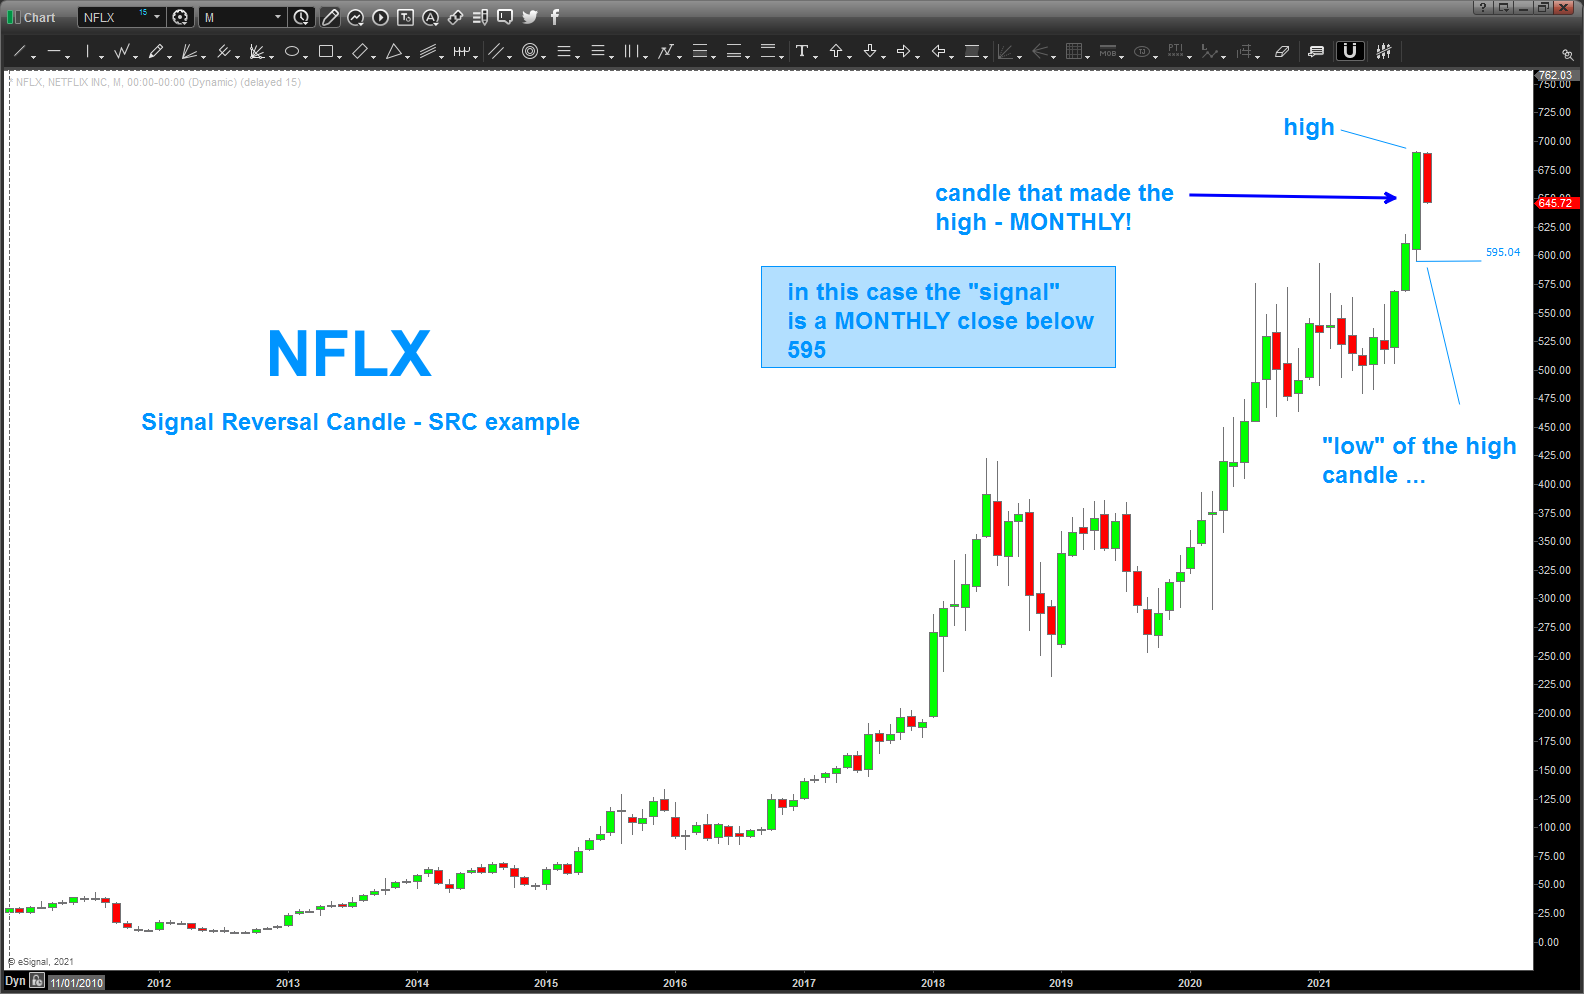
as you can see above, the SRC is a MONTHLY close below 595. a REALLY conservative play … however, you could do an intraday 60 minute SRC or daily, weekly, etc. it all depends on your risk tolerance.
perhaps a BIG pullback is in the works for NFLX?
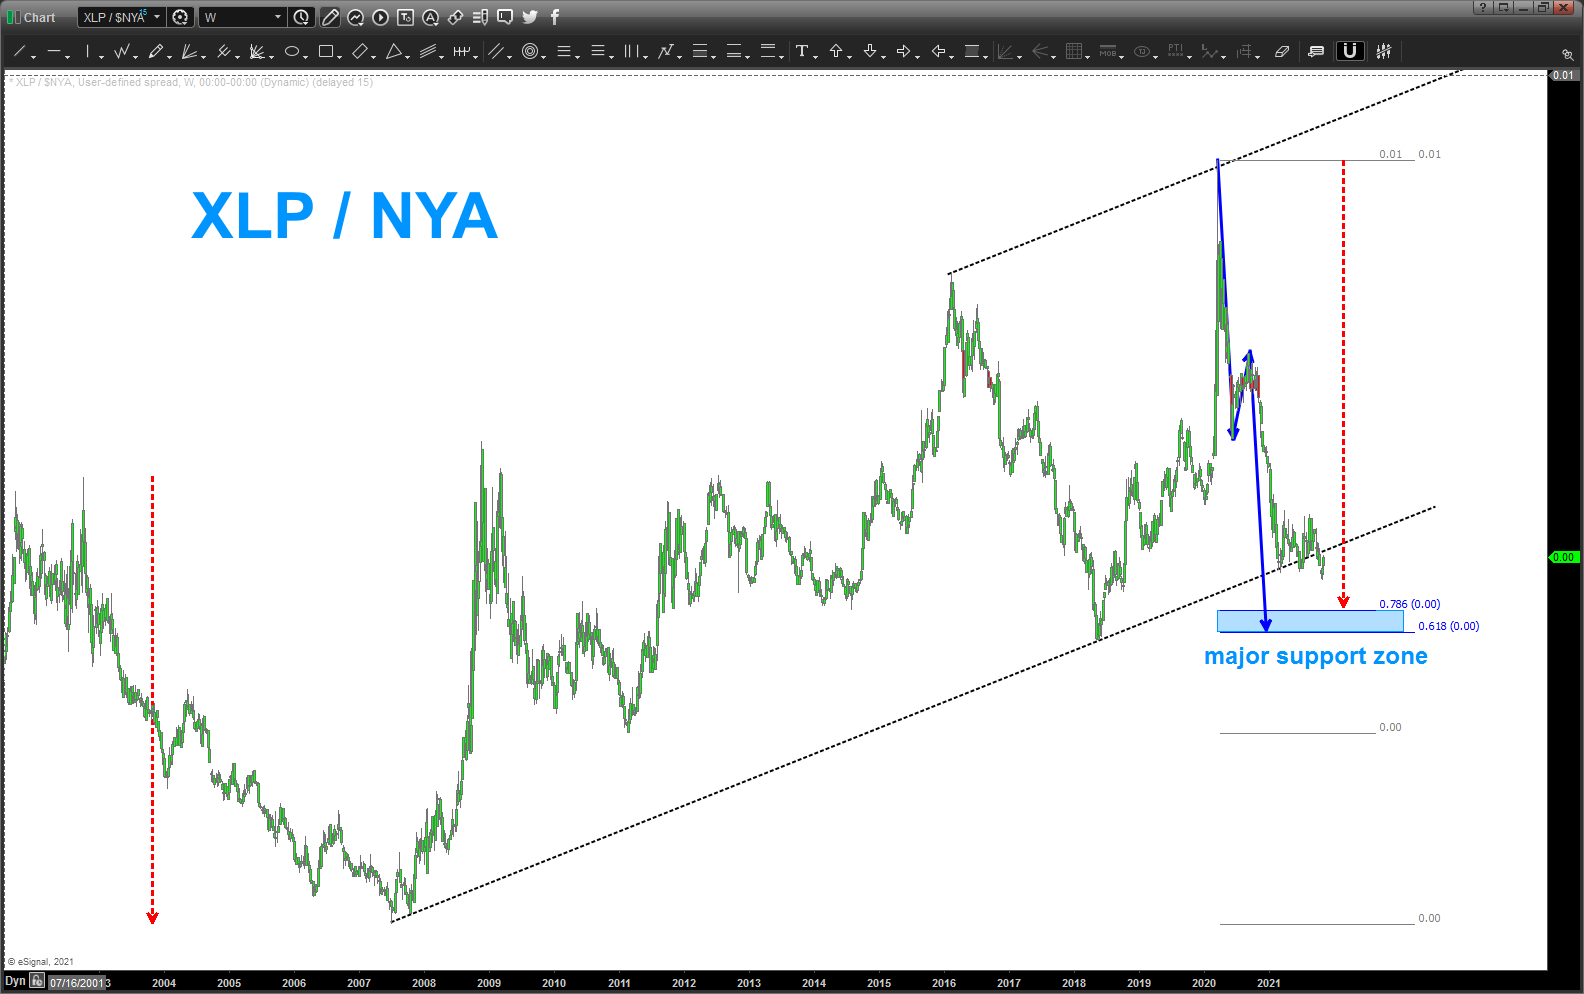
XLP / NYSE Index Updated
Posted on November 7, 2021 Leave a Comment
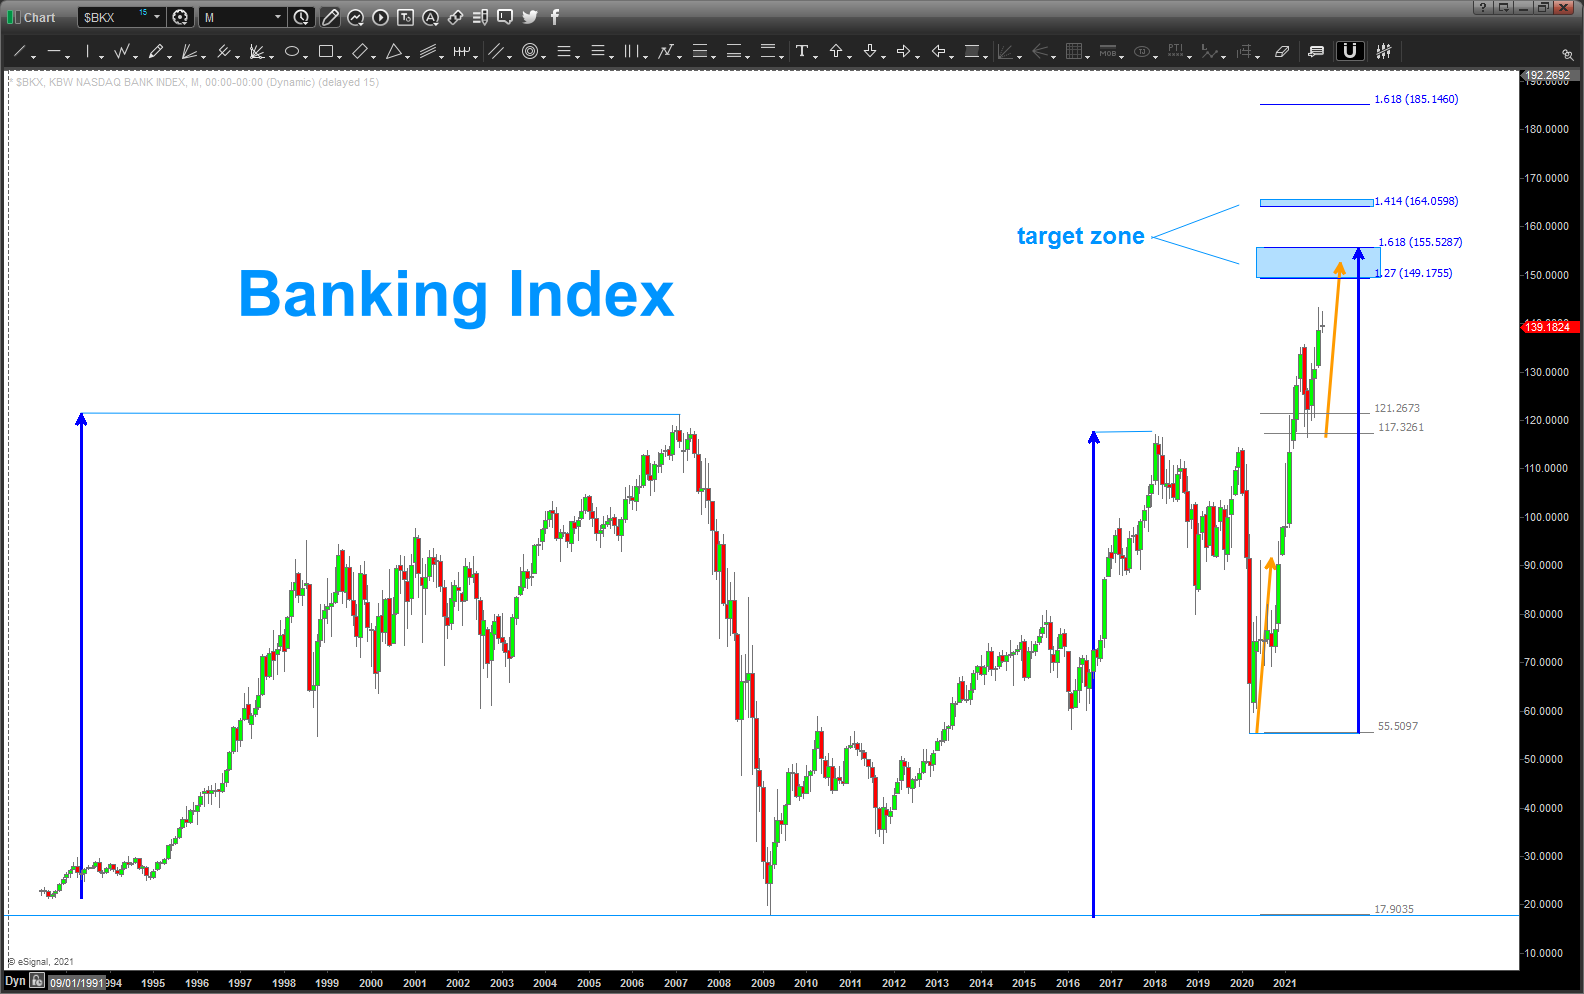
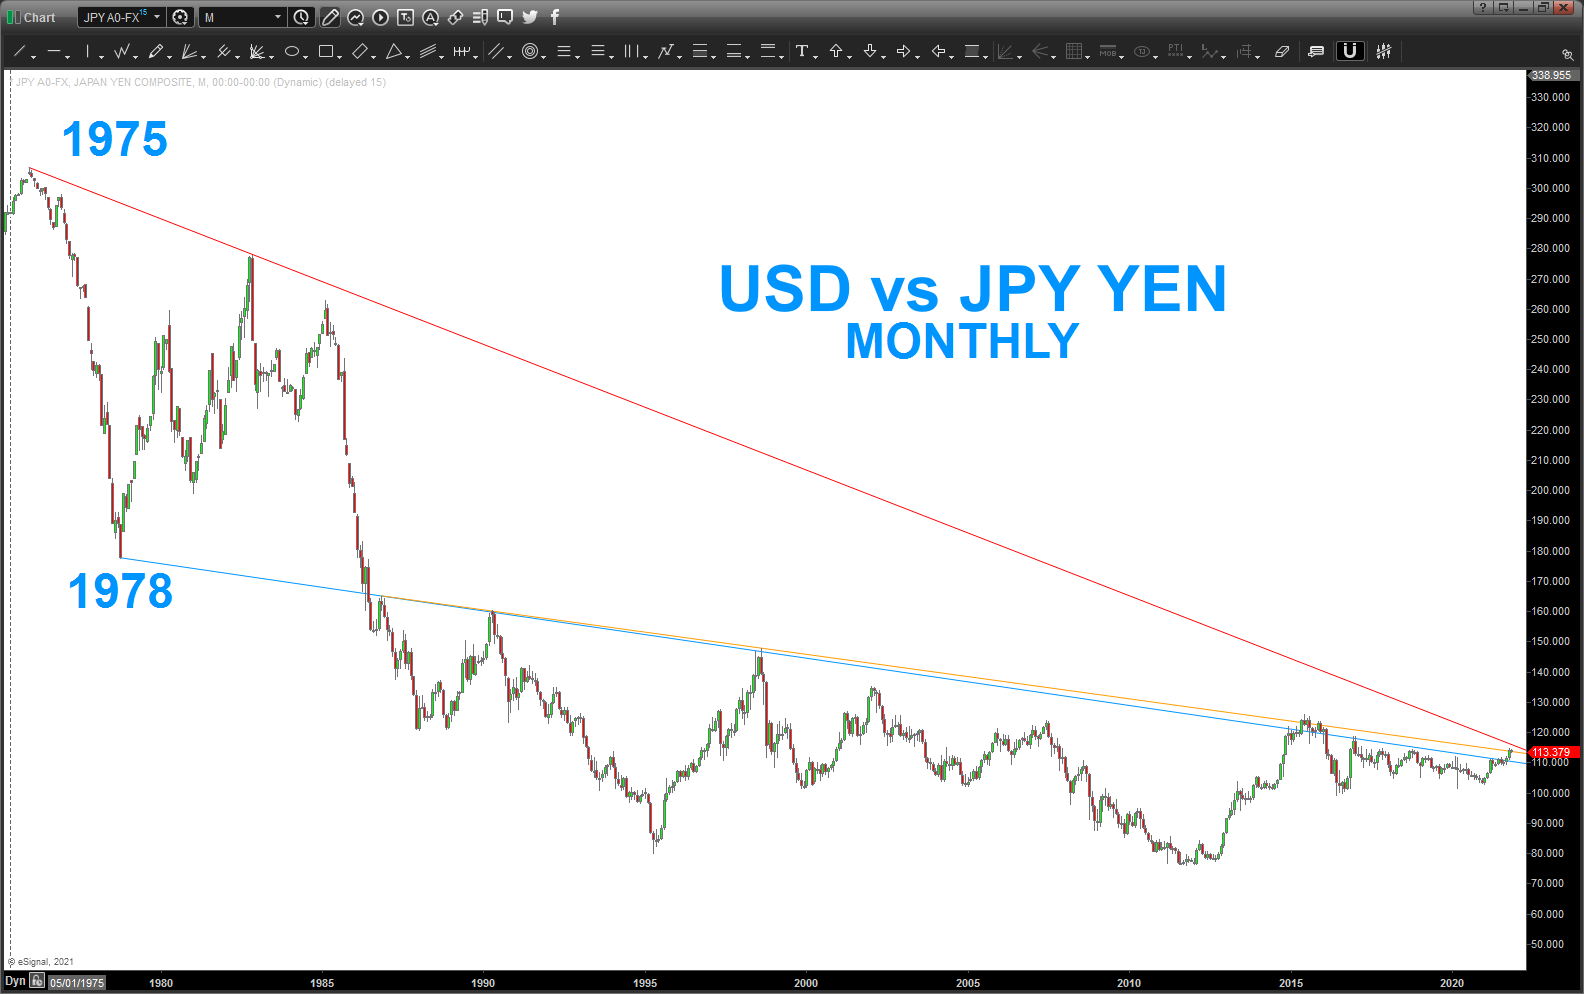
would still like the ratio to get down to the “major support zone” to get a real feel for the continued bull run. also, continue to watch Banking Index.
IWM … read this post to get your mind blown … if you want
Posted on November 3, 2021 Leave a Comment
last post on IWM: https://atomic-temporary-44460632.wpcomstaging.com/2021/08/30/iwm-and-another-upcoming-chat-w-jc/
holy smokes .. the underlying BULL market that we have right now is pretty amazing …
I went on to chat w/ JC of @allstarcharts.com a couple months ago and we talked a LOT about IWM. we went over the MATH of why it stopped where it did and, folks, the math on multiple time frames and multiple techniques was PERFECT. he still hasn’t “published” our podcast – maybe because he knew it was going to break out? 🙂 who knows …he’s a lot smarter than I am but still a GREAT dude. follow him peeps!
and guess what ..IWM pattern, it wasn’t WRONG but it certainly wasn’tRIGHT.
BOOM- we broke out today so guess what? I have to get my eraser out and start over and, unfortunately, that’s happened many many times. 🙂 why should I be surprised? well, keep reading.
the market went up to our target area and hit in/around 233. as we describe above, in an irrationally exuberant bull market, WAIT for the SRC and the signal reversal candle was finally hit the week of my birthday (note a fun fact – the HIGH on crude oil hit on my birthday 7/11 – shown below- synchronicity?)
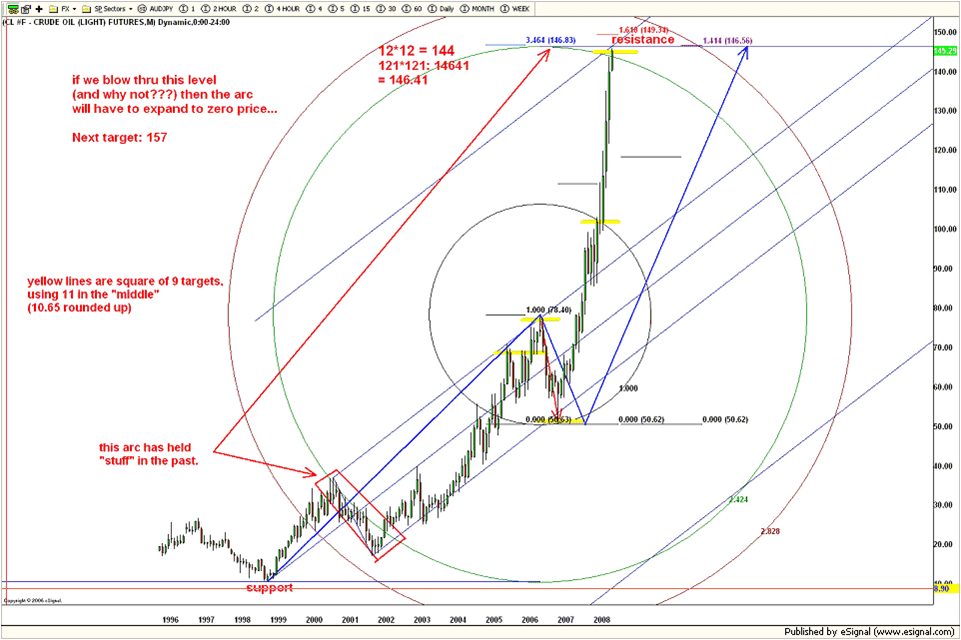
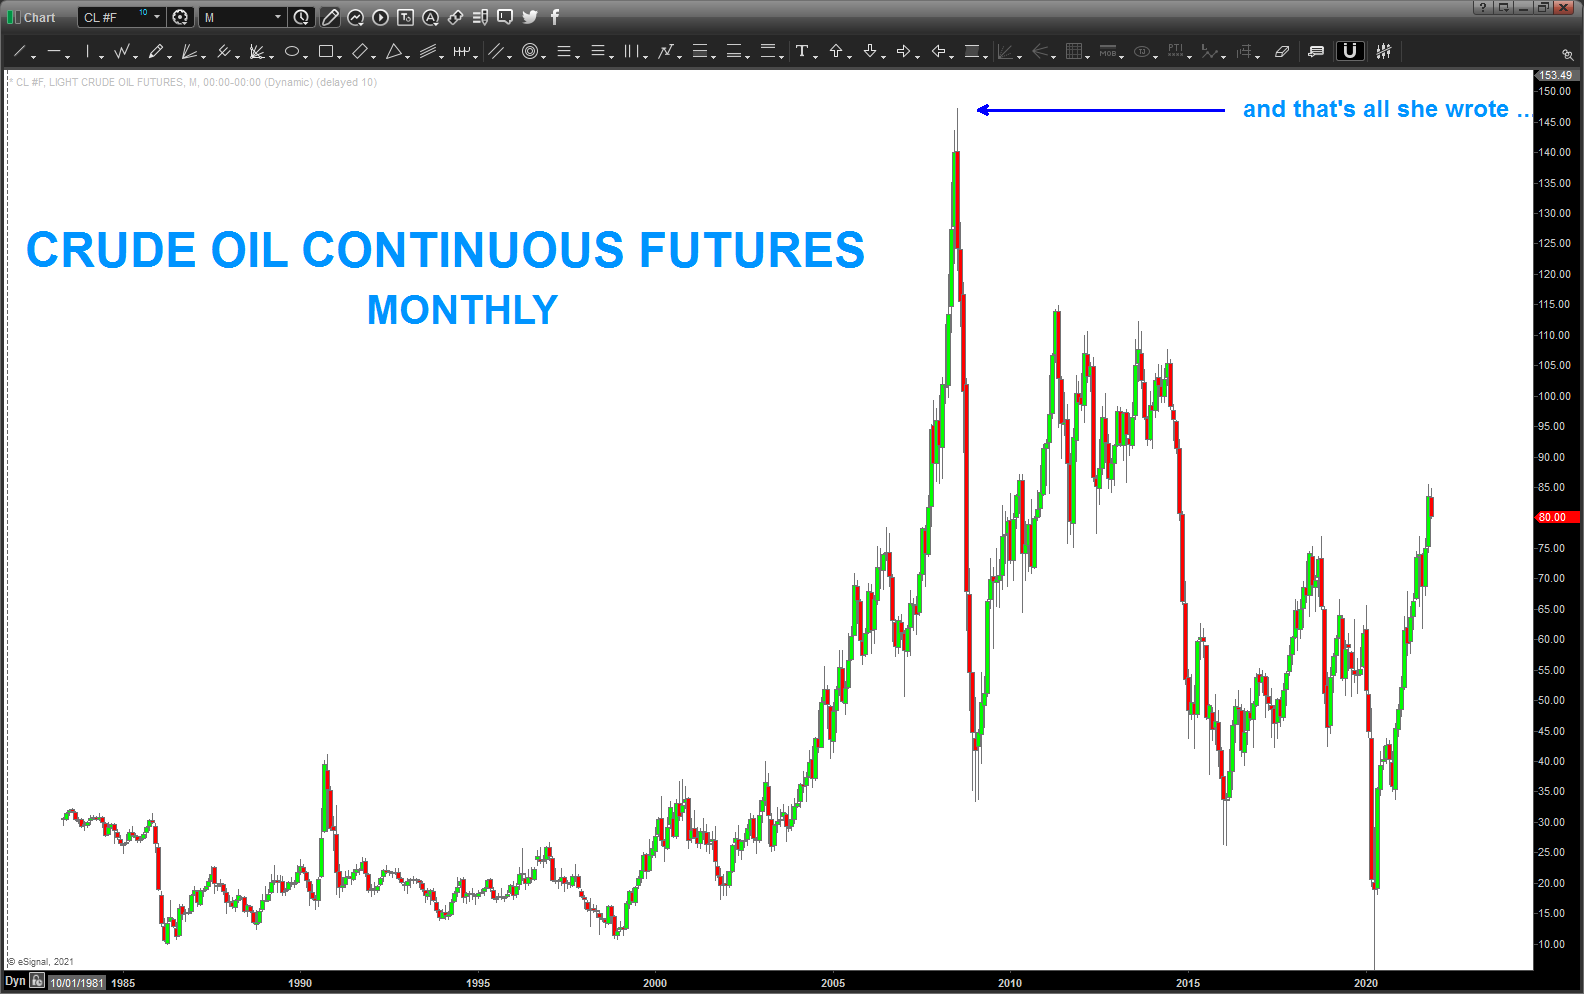
I show the Crude because of my birthday but also because of the PROBABILITY of what can and can’t happen when a TON of math comes together.
folks, MORE math came together (see the last post linked at the top) on IWM .. so only being human I EXPECTED it to dump and the rest of the market to, well, at least follow along … ? unreasonable?
well there it sat … and sat … and then an SRC
Here is the SRC for IWM:
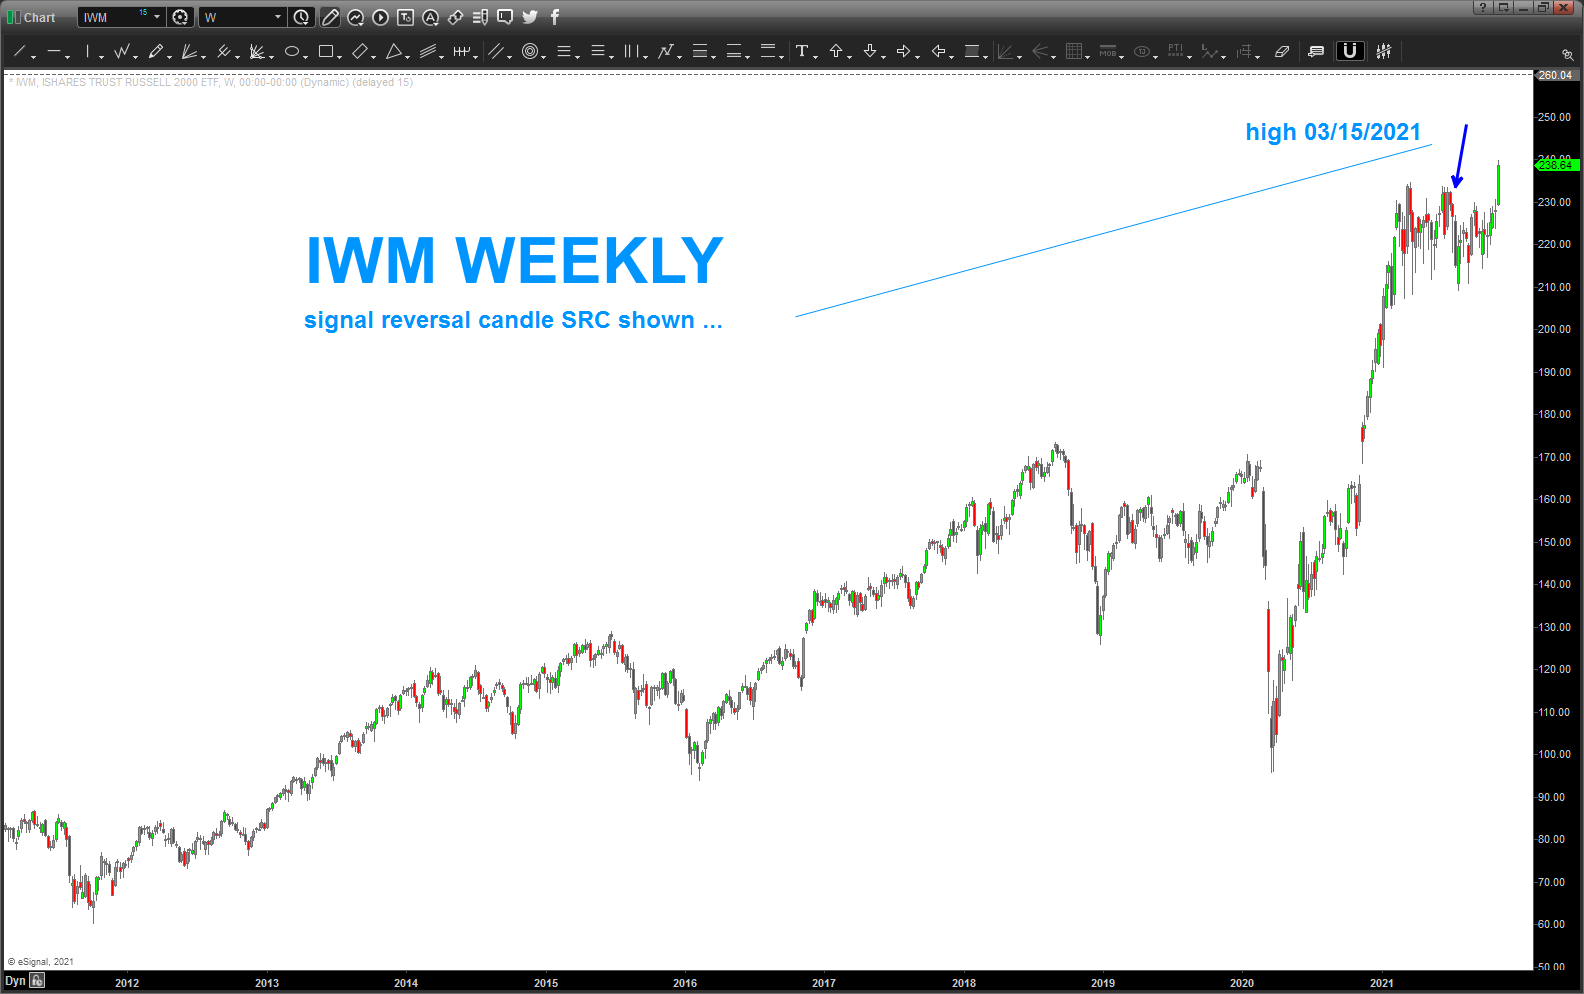
more than likely, a short would have been initiated and we would have been stopped out ….
end of story – right? well from a P+L perspective, yes. folks that is ALL that matters.
from a form and harmony and balance perspective this IWM continues to amaze me.
please see the chart below:
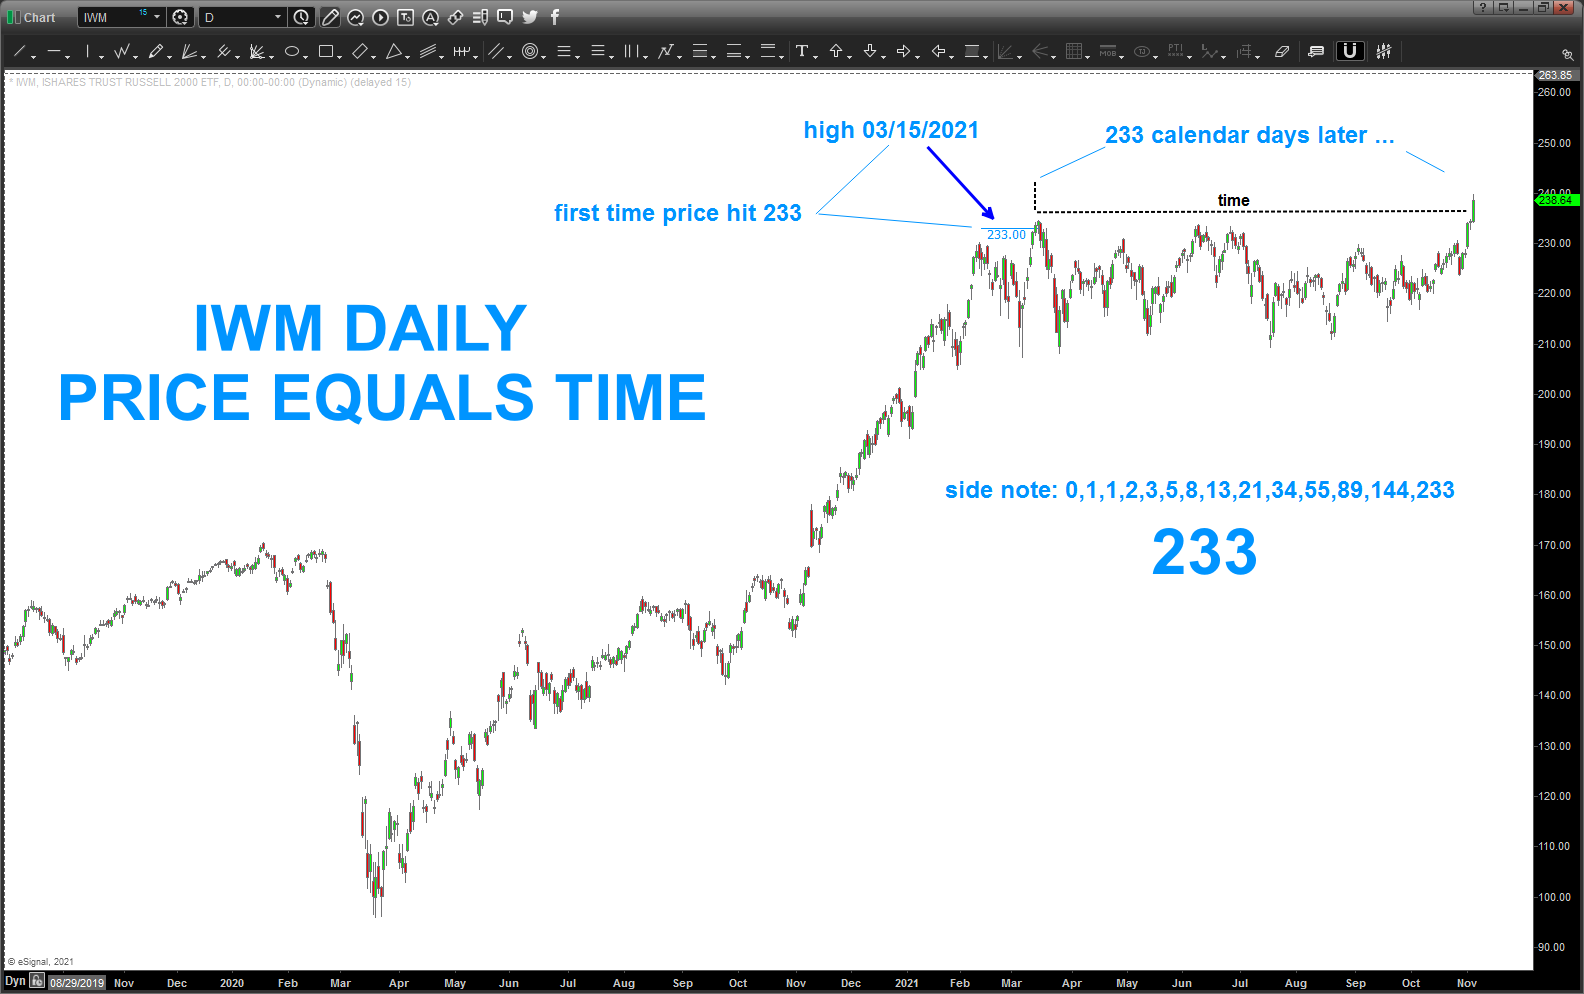
if you have been reading the blog you know we had been targeting this price zone for a while and when it hit you know I (most of the time) say WAIT for a signal reversal candle because it’s probability – right? of course … so sometimes the pattern will act as support or resistance (this is what IWM did for 233 days but ultimately it failed.) and sometimes it will work and inflect to your favor or it EXPLODES continuing the trend … it’s all probability. but I think I’ve shown that “stuff” happens around the patterns – fair enough?
what’s key for me, even though we are dealing w/ probability, is I KNEW there is still a “beat” or “rhythm” to it … that’s why the patterns help you manage risk, right?
so, at the end of the day today, I saw that the market was up again and I thought … “I bet (no kidding, I KNEW this was the case in my gut) we made the PRICE high the same many days (TIME) ago … “
there you have it above … 233 calendar days ago the price HIGH was hit and is it any coincidence that we BROKE OUT when PRICE equals TIME? NO – that is how it works. our job is to figure out what the key master has in store for us regarding the harmony and balance of what we are dealing with … it’s all based on math and music but it’s also a multi dimensional chess game …
why would I type that last sentence?
well, 233 is a Fibonacci number as shown on the chart above … the Architect, what a sense of humor she has ….
Bart
UNG
Posted on November 1, 2021 3 Comments
nice pattern and structural support (based on polarity) in/around 14.60-16.09,
do not believe this is done by any stretch, for now.
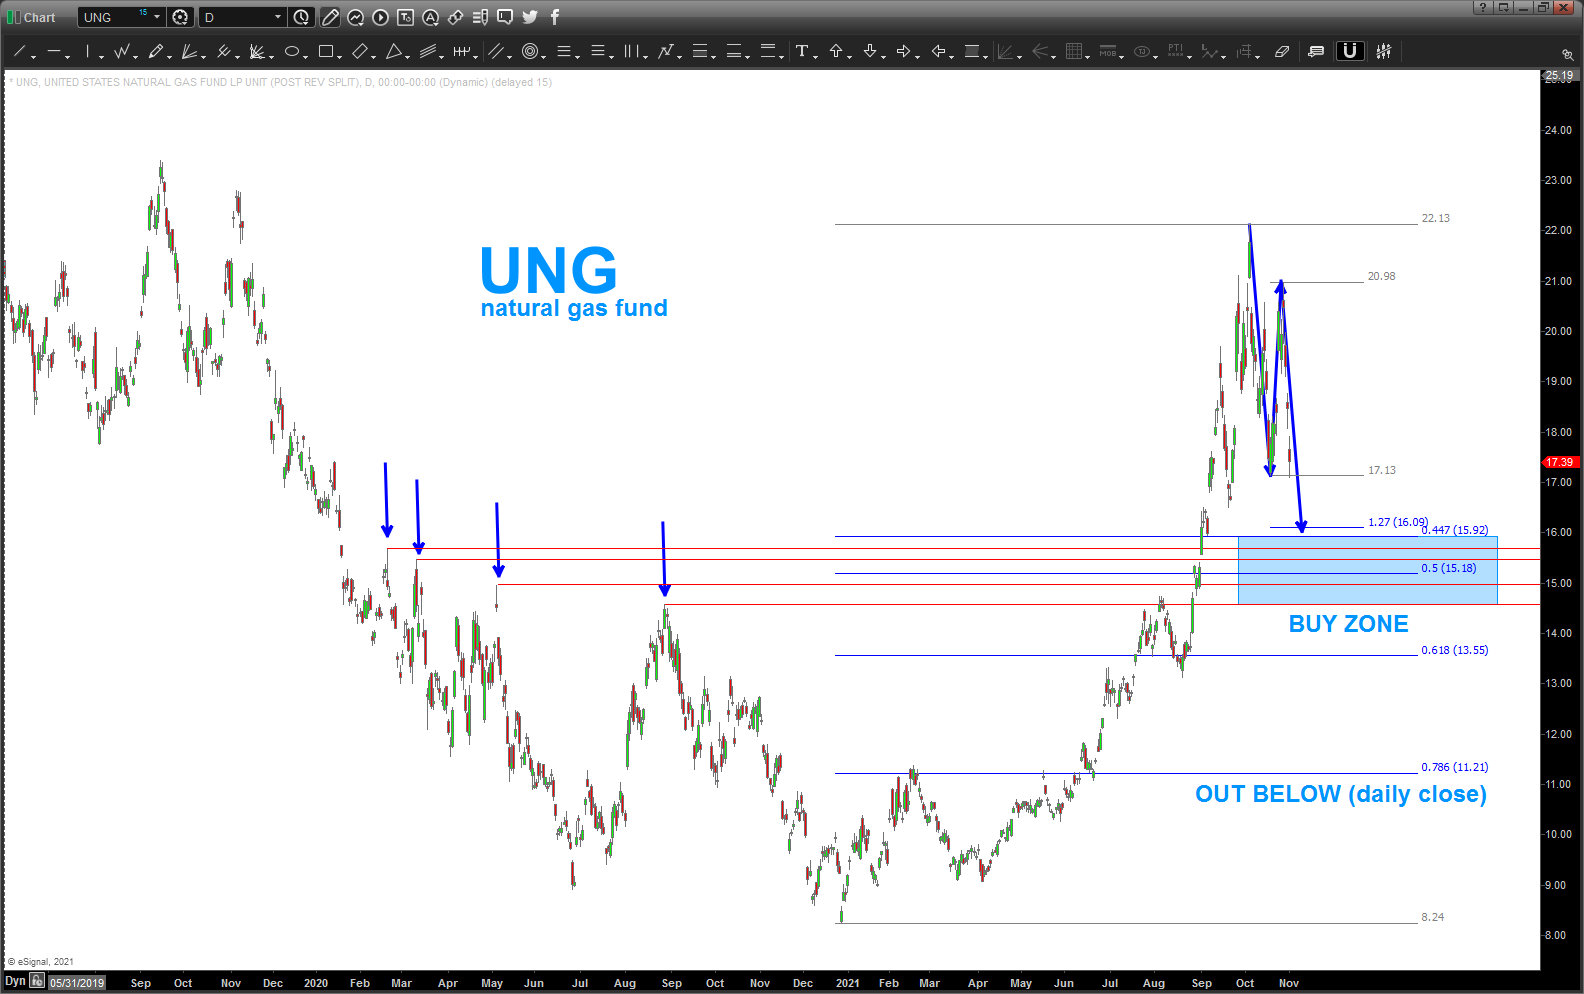
Chart of the Year …
Posted on October 19, 2021 1 Comment
there was and still is (for those who have the PRIVILEGE to do it) something so amazing about the feeling of going BONS (Boots On Non Skid) of a US Naval Aircraft Carrier.
it wasn’t a ‘bravado” thing as people would believe from the characterization of Naval Aviators but – for me – it was simply amazing. being on the flight deck as engines were turning, the ship was moving and everyone from 18-50 (?) was moving in elegant and frictionless dance .. it was that amazing.
and when you walked up to your jet and there was an AMAZING YOUNG SAILOR (note no identity needed because WE DID NOT CARE) told you your jet was ready you simply took it as fact .. how cool?
so you would jump into the jet and get this multi-million dollar tax payer funded rocket ship ready for the catapult shot and – I believe EVERYONE – asked themselves before Mr. Toad’s Wild Ride “have I done enough to manage the risk” and “yes” was always the answer and for me … BOOM I shot off the pointy end of American Diplomacy. What an amazing privilege and honor.
what does this have to do w/ NFLX? EVERYTHING ….
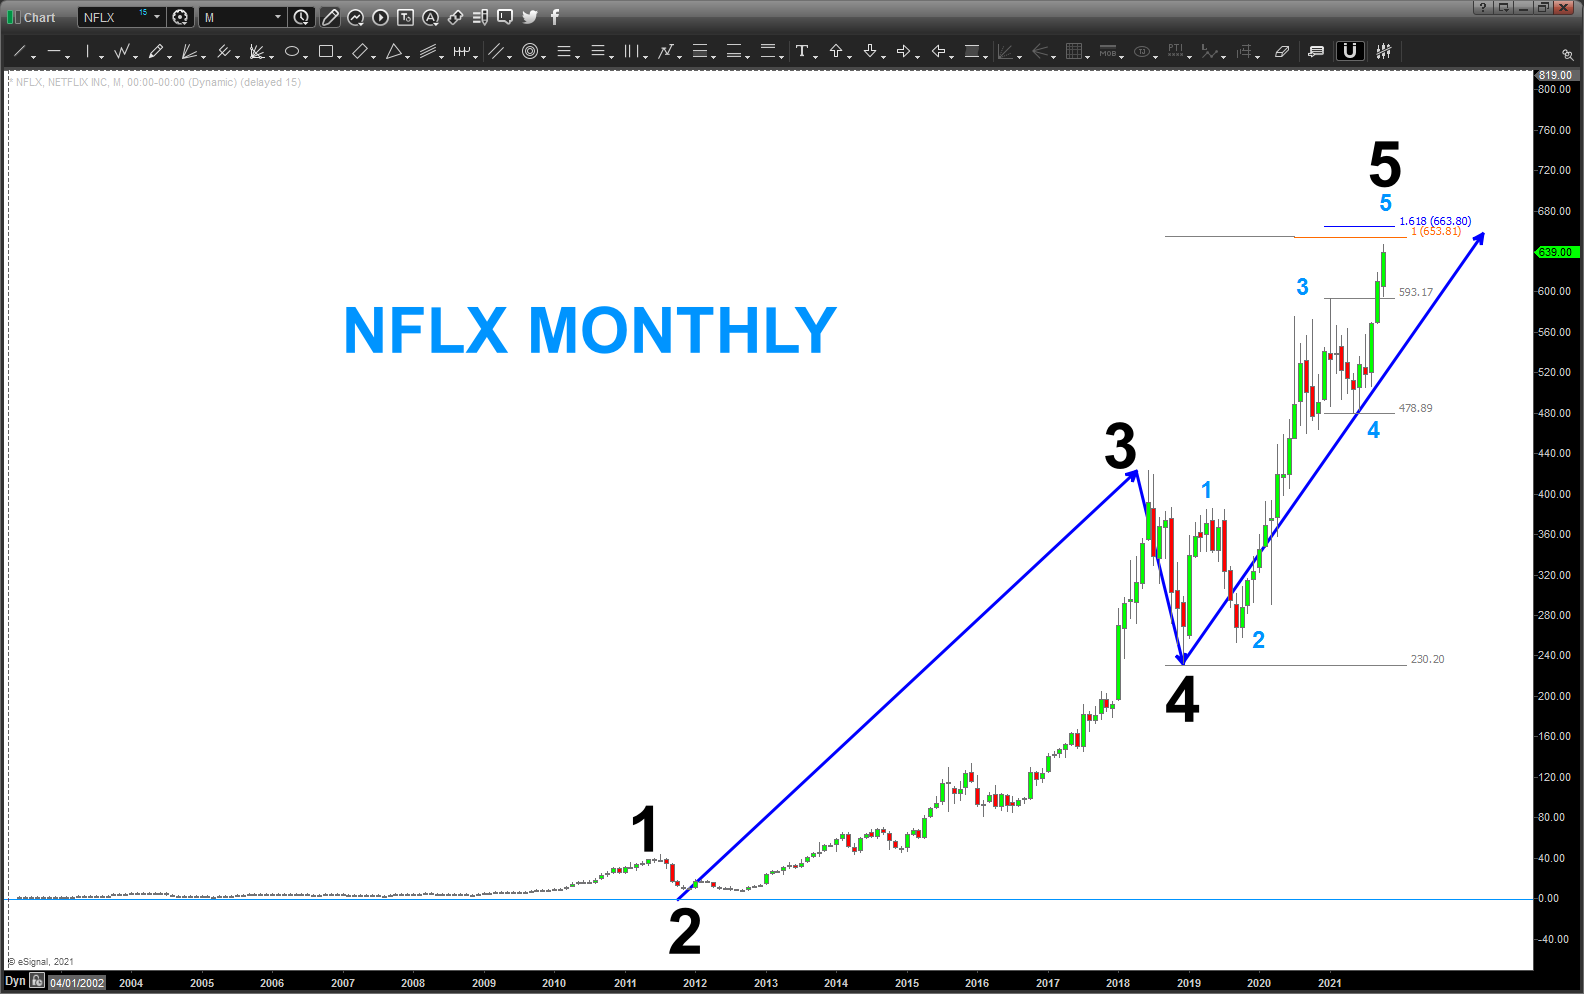
folks, we have an near perfect AB=CD, a 1.618 extension into the target zone … and, at least for me, an Elliott Wave count that breaks NO rules is present on multiple degrees …
maybe it’s time to PUT your money where your mouth is Bart when we reach the 650-660 area?
chart of the year folks …
xoxox – Bart
so … who is eating who?
Posted on October 19, 2021 1 Comment
last post on current market conditions: https://atomic-temporary-44460632.wpcomstaging.com/2021/10/17/sometimes-you-eat-the-bar-and-sometimes-it-eats-you/
if your someone trying to get short – sure looks like the bar is eating you …if your trying or are long looks like you are eating the bar … man, this is interesting.
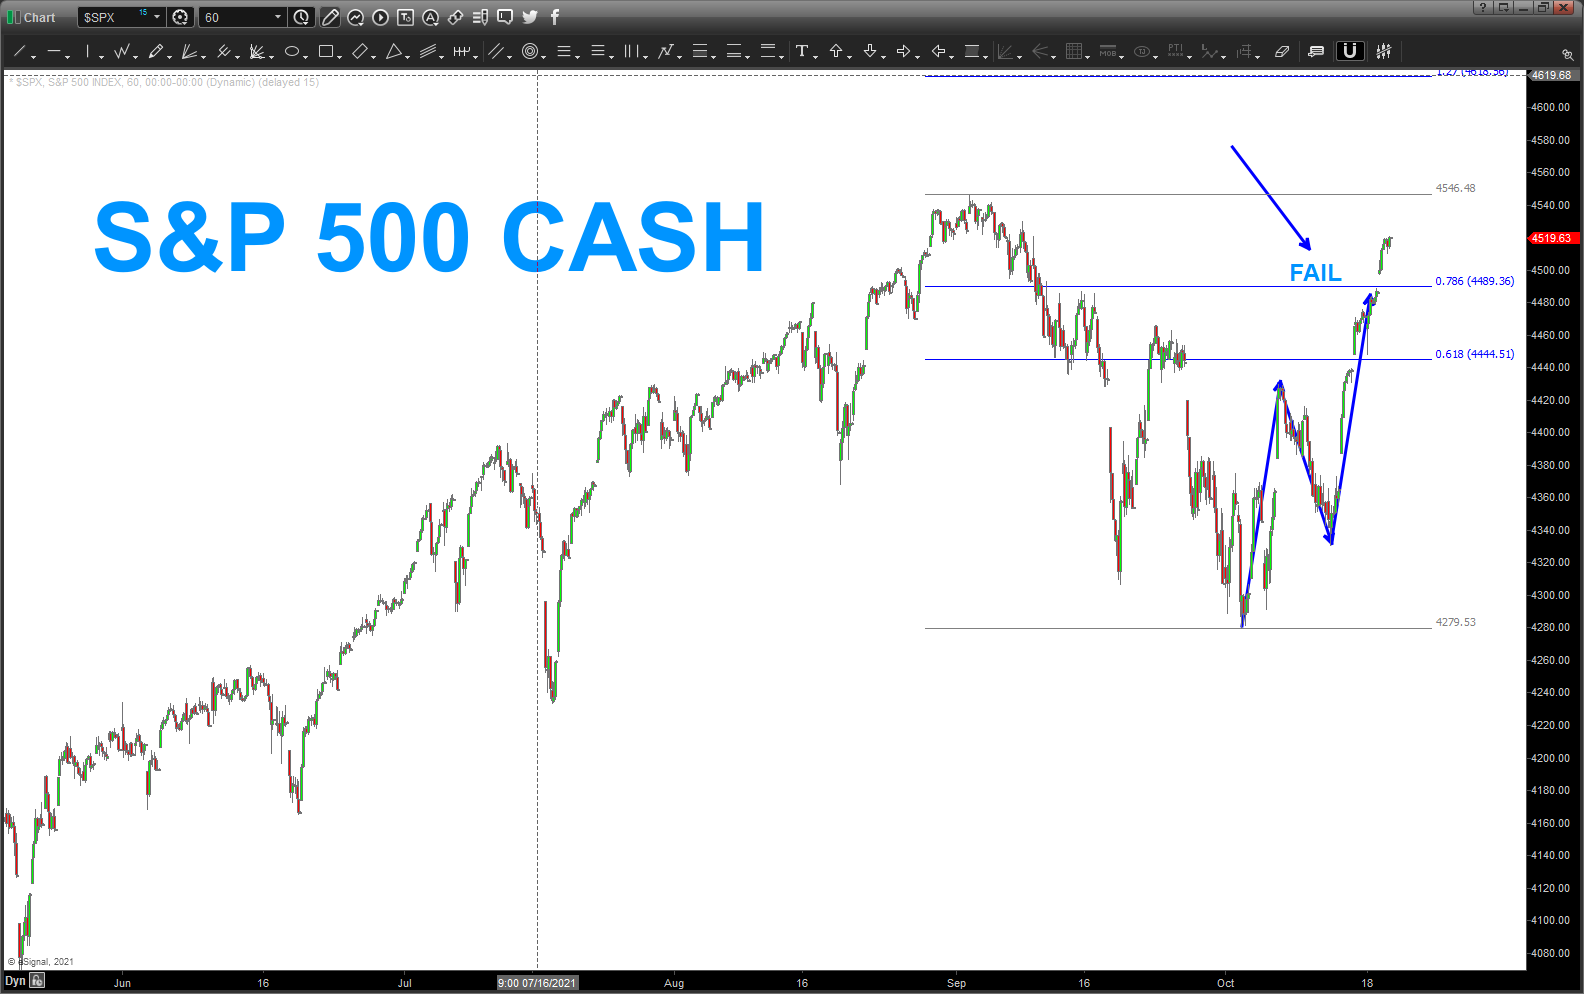
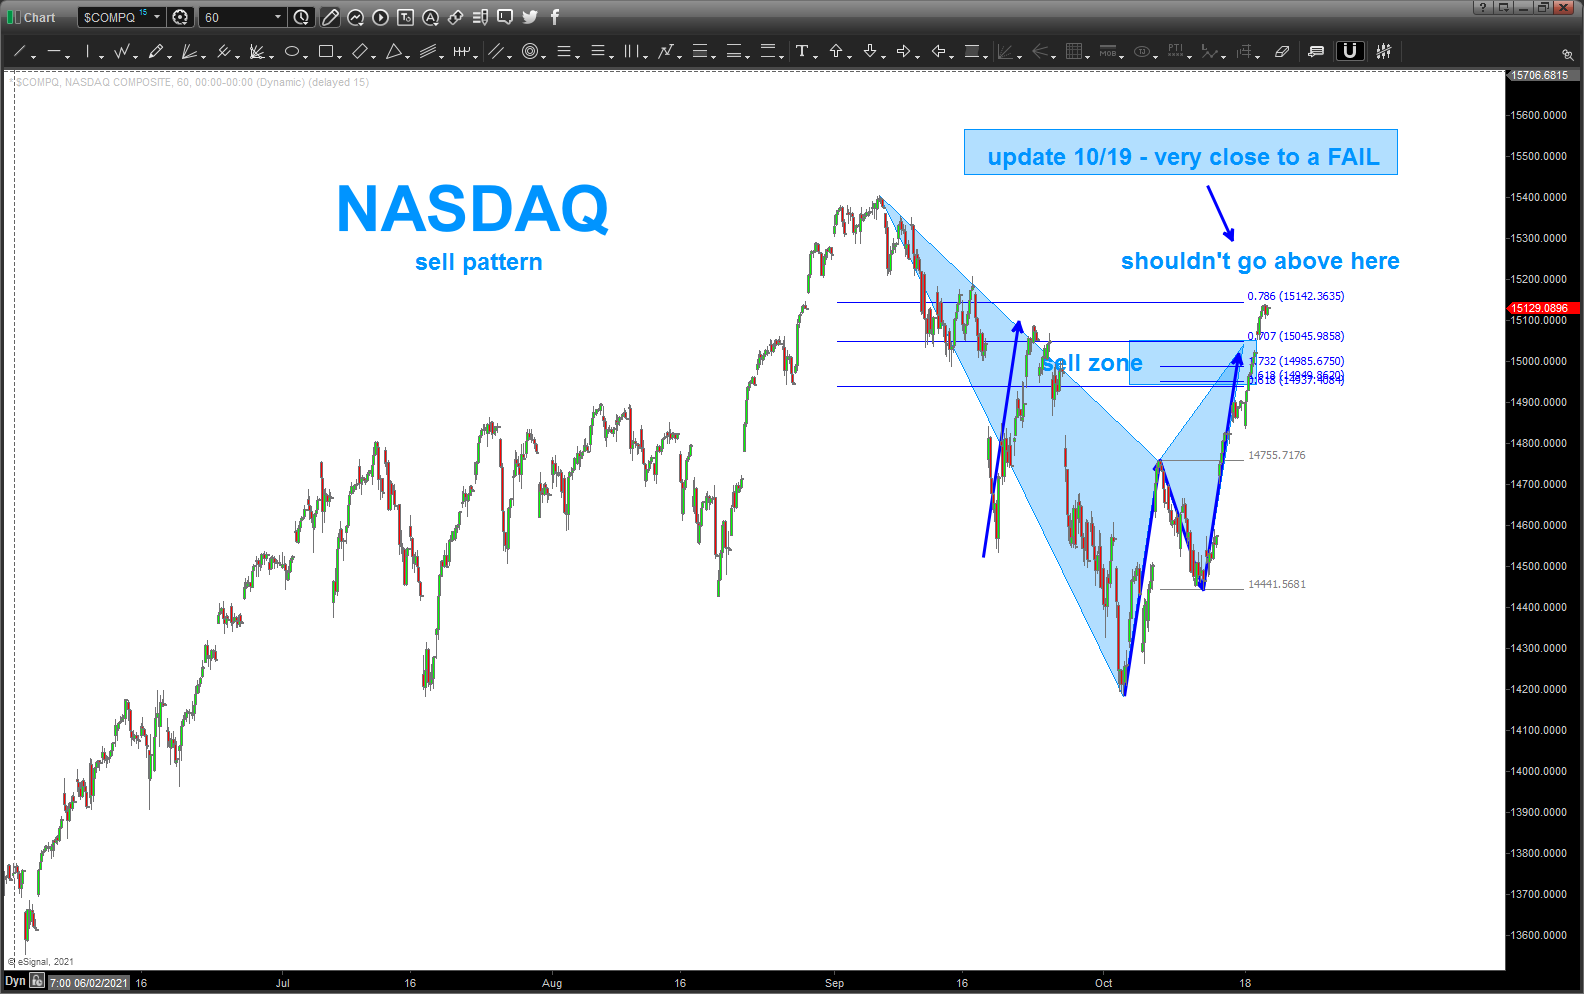
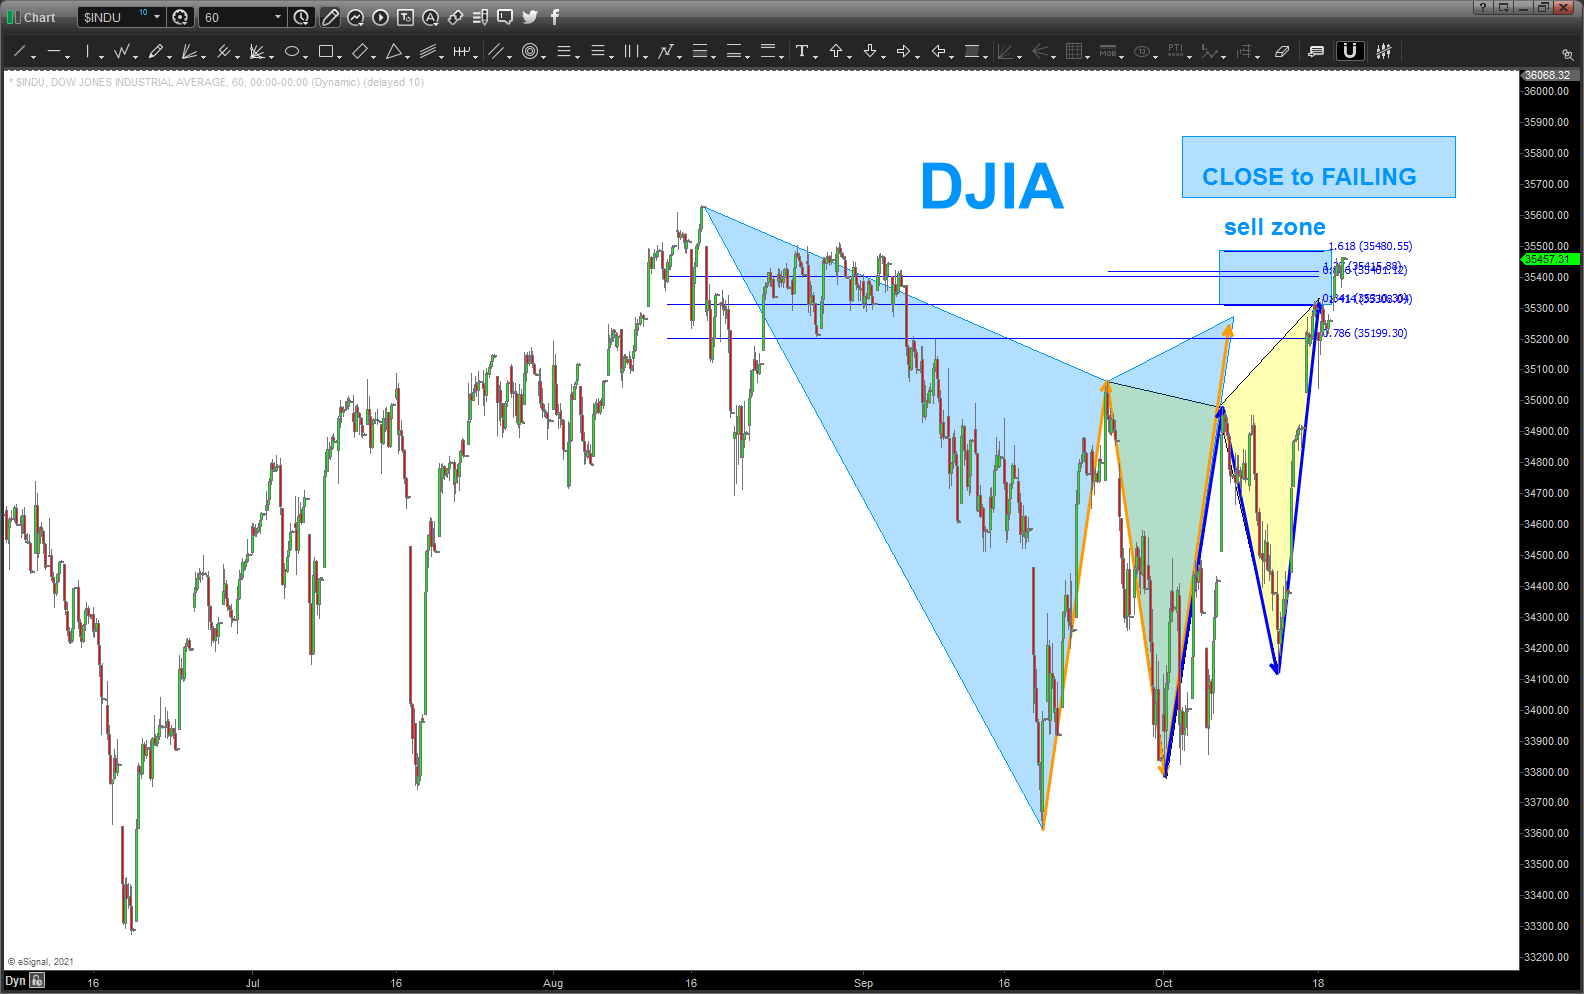
1/ as a PATTERN recognition expert I can say that the PATTERNS for selling equities FAILED over the past two days.
2/ as an intermarket musician I try to look at everything ….
3/ so lets do that ….
- the PATTERNS have failed
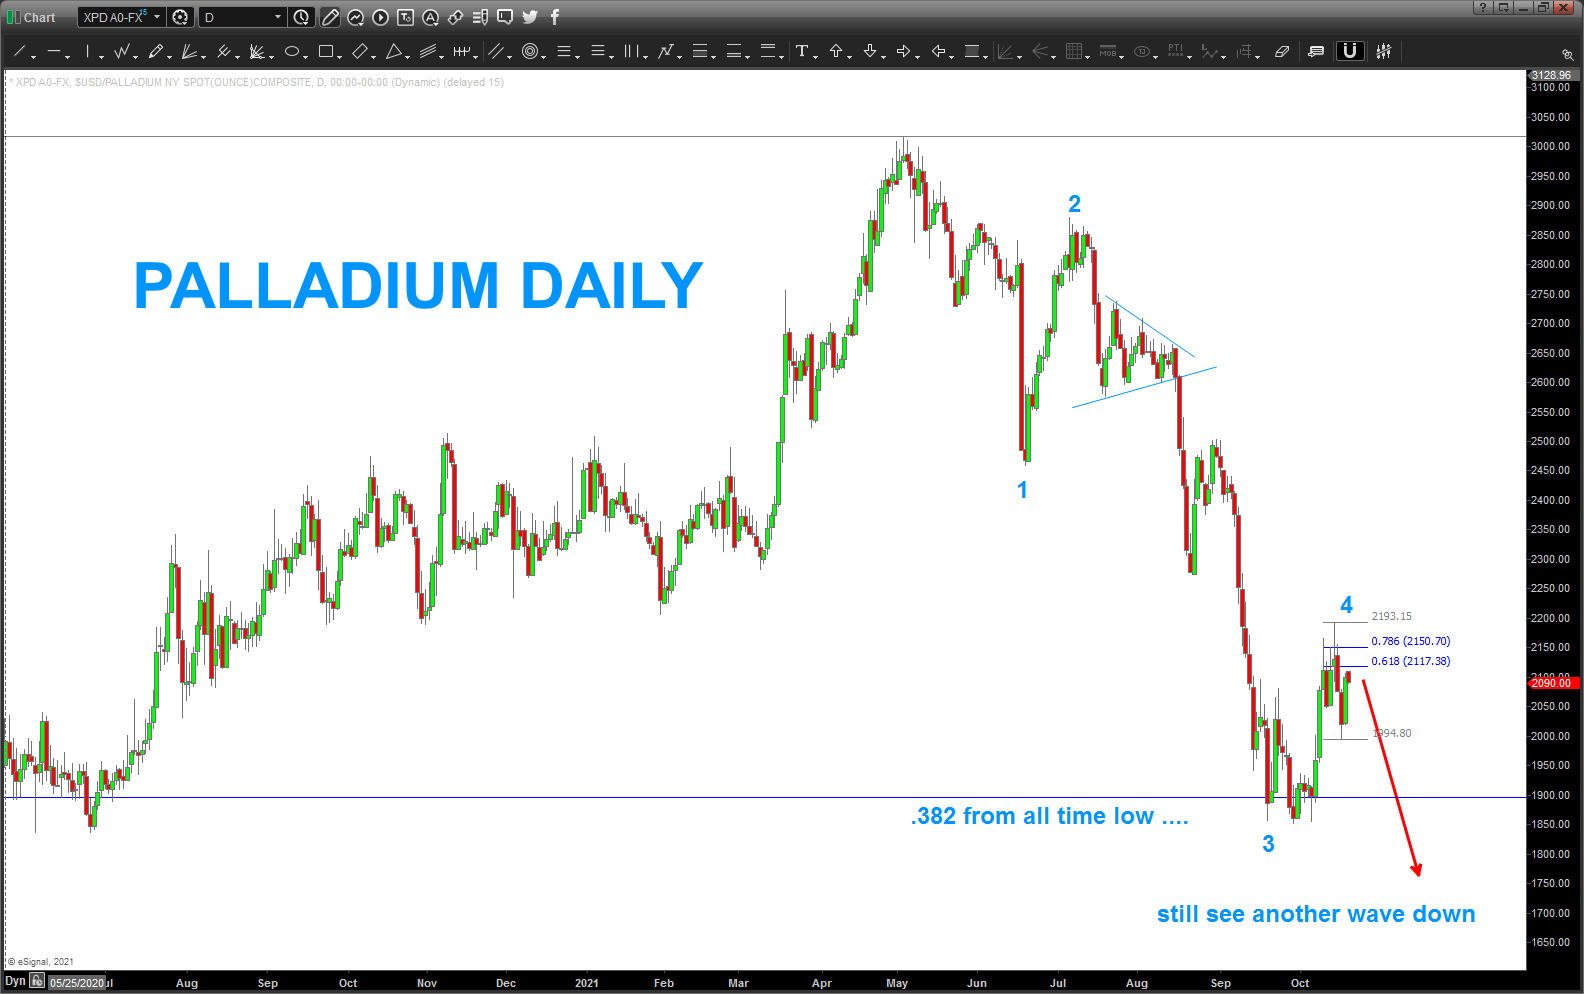
- Palladium really looks like another leg down … Palladium down has been equated to NASDAQ down and, to a certain extent, equities down
- NFLX … man, that pattern is REALLY close …
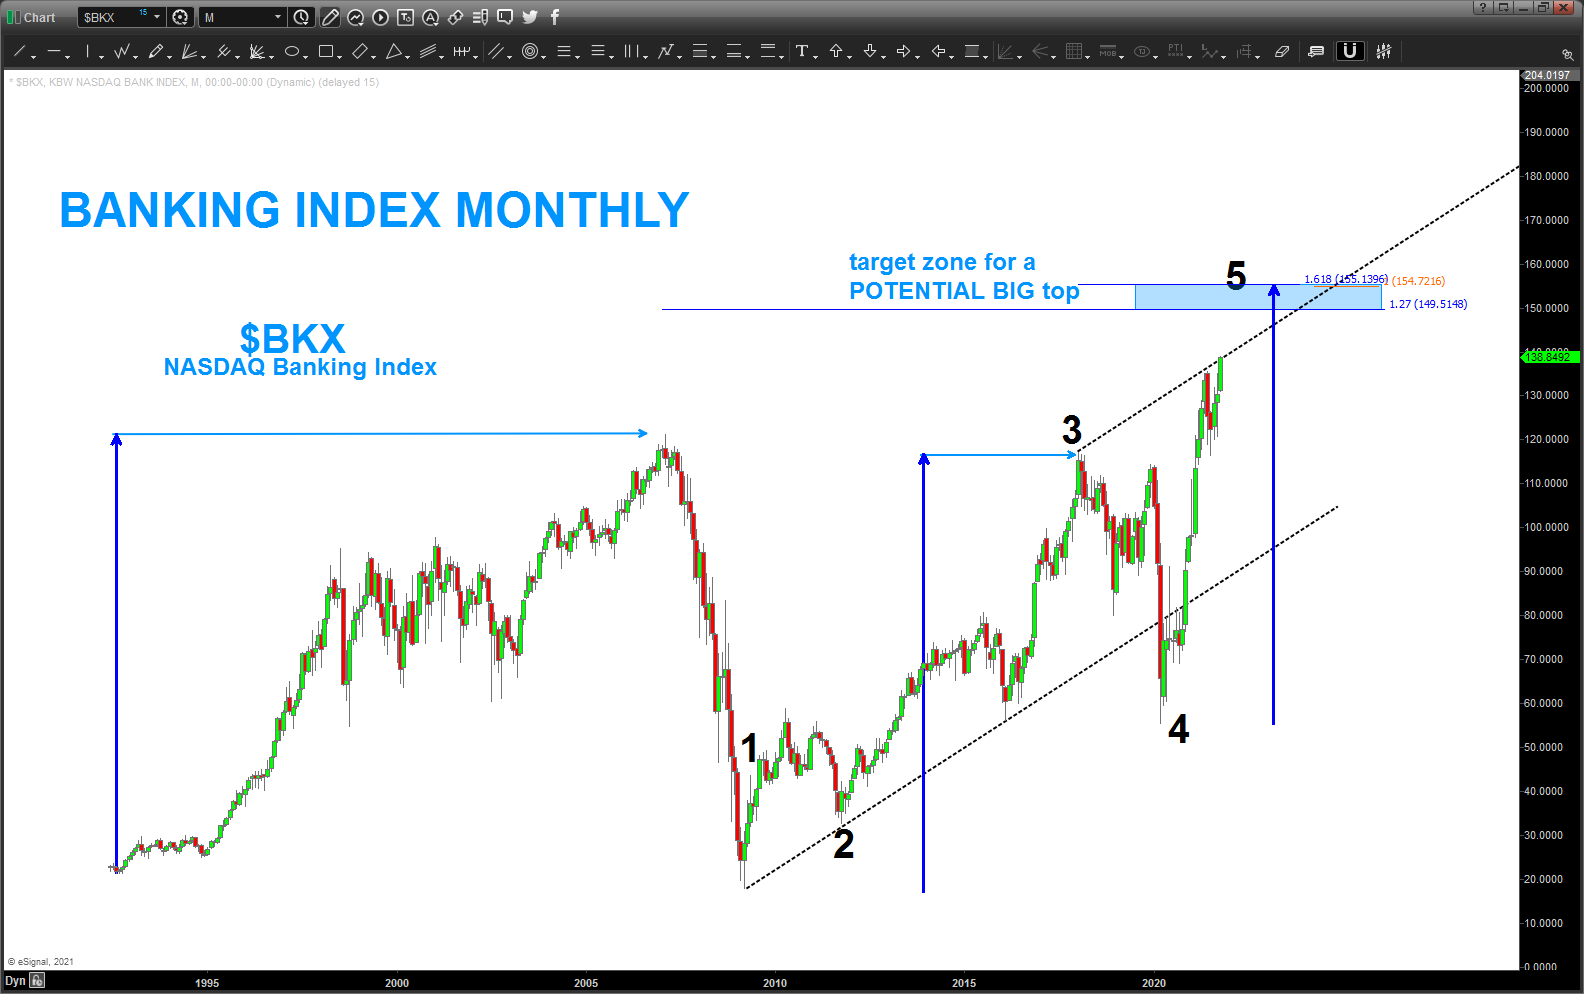
- Banking Index – again, a MASSIVE pattern a little higher …
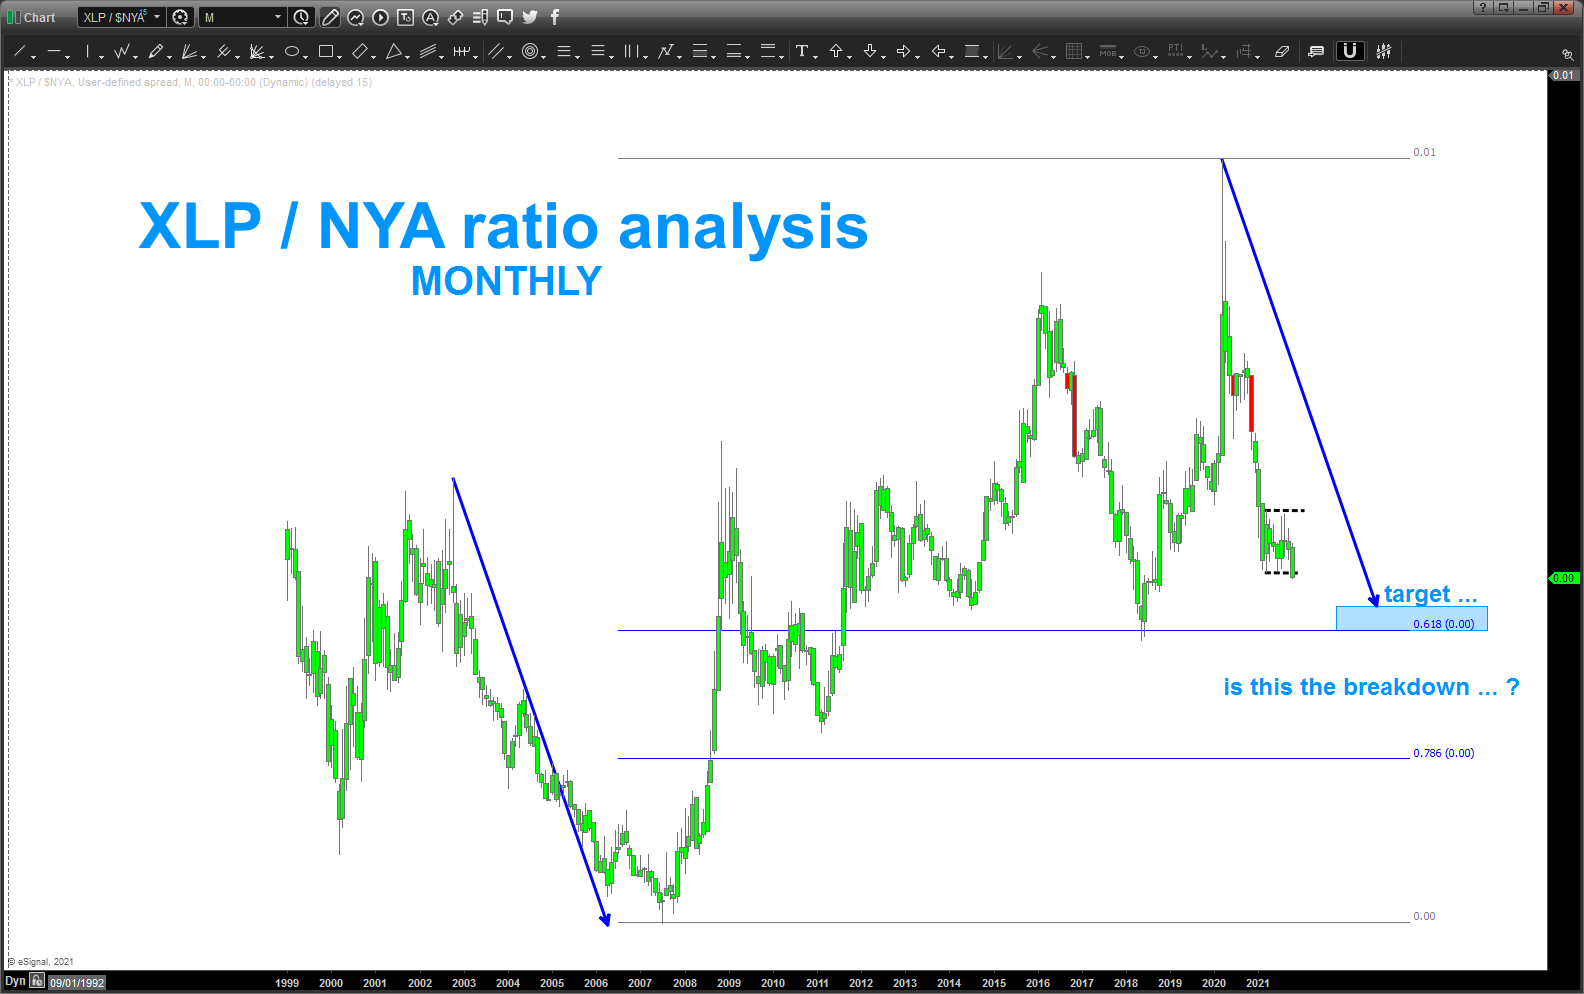
- XLP/NYA – certainly might have BROKEN DOWN (equity strength) of the 7 month channel …
so what do we do ..
me?
sitting on my hands and looking for a simultaneous 1/NFLX target hit and 2/ BANKING INDEX hit and 3/ XLP/NYA target hit and then SHORT the NASDAQ w/ a vengeance ….
until those 3 criteria are hit I’ll continue to lick my wounds on MJ 🙂 but … seeing the “numbers” come together for NFLX makes me think I might have to break out my timing work … as a side note I recommend you go and BUY Connie’s book (novel, war and peace) the 32nd Jewel .. it’s mind blowing and I’m only on the 3rd chapter because I find myself against a wall and then I go and “find” (I wonder how I find them) books on number theory and Planks constant and inverses and … the rabbit hole just spirals so I’m reading Robert Edward Grant’s “Philomath” and – total mind blown – but it’s helping me go back to Ms. Brown’s expose and the TIME factor becomes understandable but – it’s still elusive in nature – so when I get a bunch of numbers coming together I work backwards to figure out – what- exactly – is the VIBRATION that NFLX is rolling along with …..
the KEY is the DATE of the IPO and, I think (I’m still learning) that first “long term” pullback from the initial impulse move … that is where the rock hits the water and the height of the drop, the weight of the rock , the wind, the moon, the tide and ANYTHING that is PRESENT and PHYSICAL interacts w/ the waves to create the moves we see … it’s really that simple.
IF (and trust me it’s a BIG IF) that’s the case then wouldn’t the mathematics of the ancients (note, probably you and me and anyone else present right now … ) that govern natural harmony work on the markets?
YES .. join me going deeper and deeper and deeper into the rabbit hole …