NFLX update
Posted on December 21, 2021 1 Comment
last post on NFLX: https://atomic-temporary-44460632.wpcomstaging.com/2021/12/13/nflx-3/
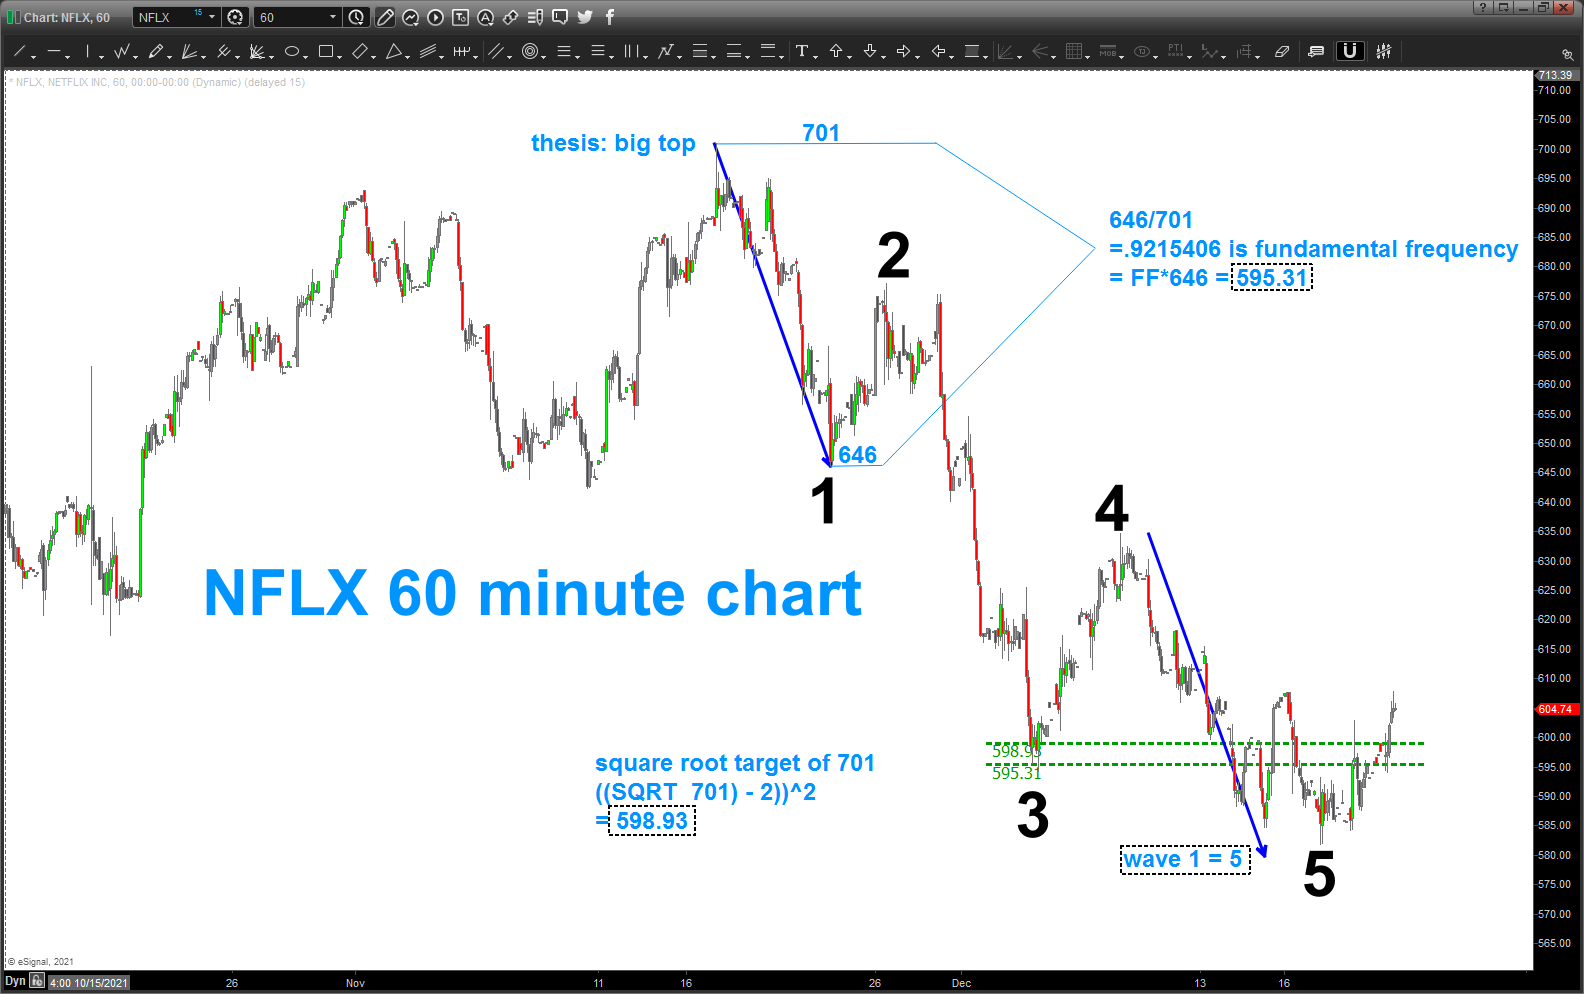
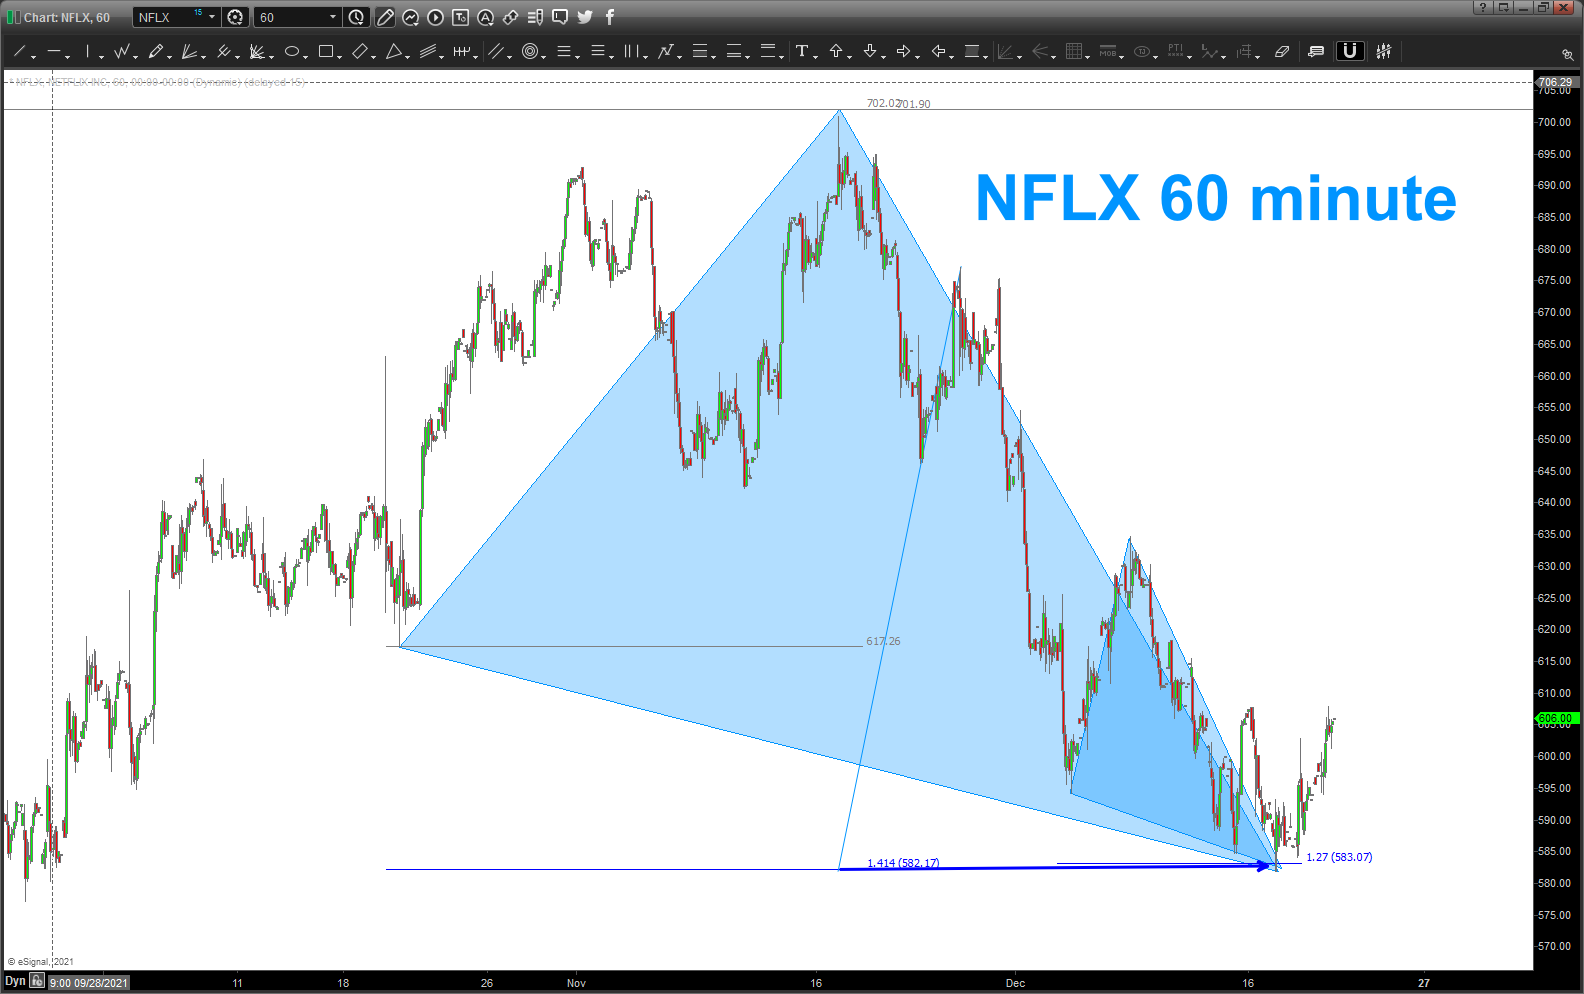
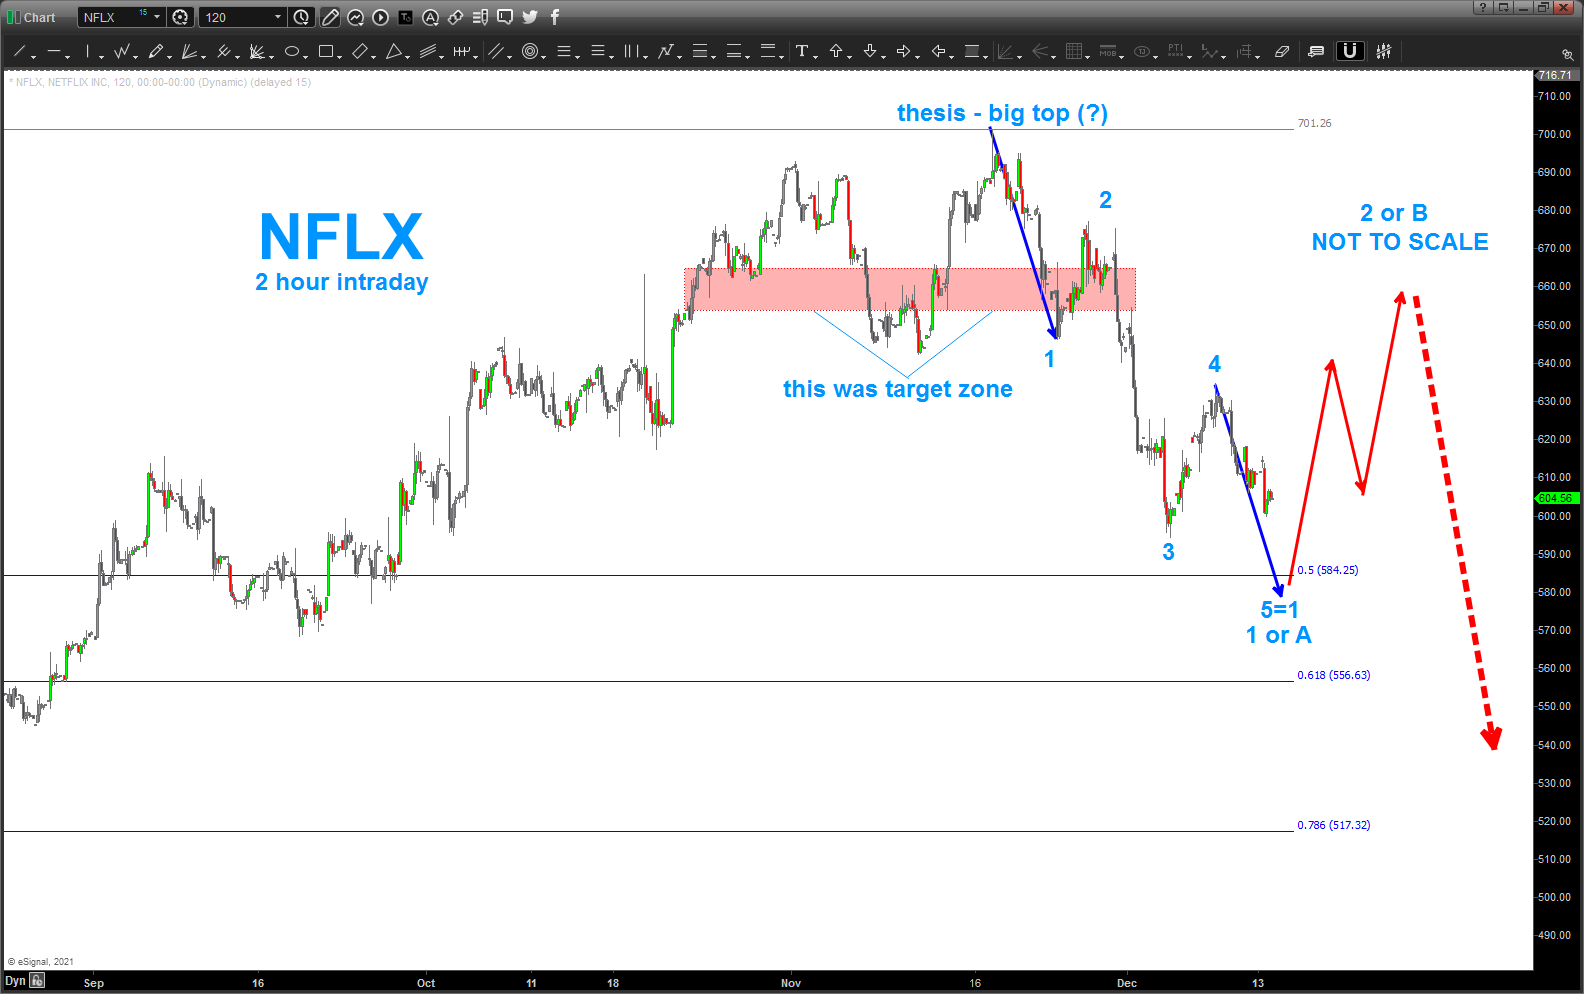
in that post we did some “basic” work using EWT going w/ Wave 1 = Wave 5 and some “basic” retracement work. as you can see below there was a LOT of math and geometry coming into this level … fundamental frequencies, square root targets, geometry, extensions, etc. all made this an “interesting” area for sure.
where are we NFLX?
if you go back to a couple posts of NFLX you will see that I called it a “chart of the year” because of the very “ray charles” like count of 1,2,3,4,5. we blew thru the target zone by 3-4% probably because my ego got the better of me in coming up w/ that title (digression complete) but either way, we completed 5 waves up into 700 … and we just completed 5 waves down.
what is so important about that?
5 waves either complete a corrective C wave (they are ALWAYS 5 waves) and now we bounce OR they could show a change in trend. certainly believe it’s way too early to be calling for a change in trend for NFLX but our thesis, for now, is the 700 level was a potential big top. so, w/ 5 waves down we need to pay attention.
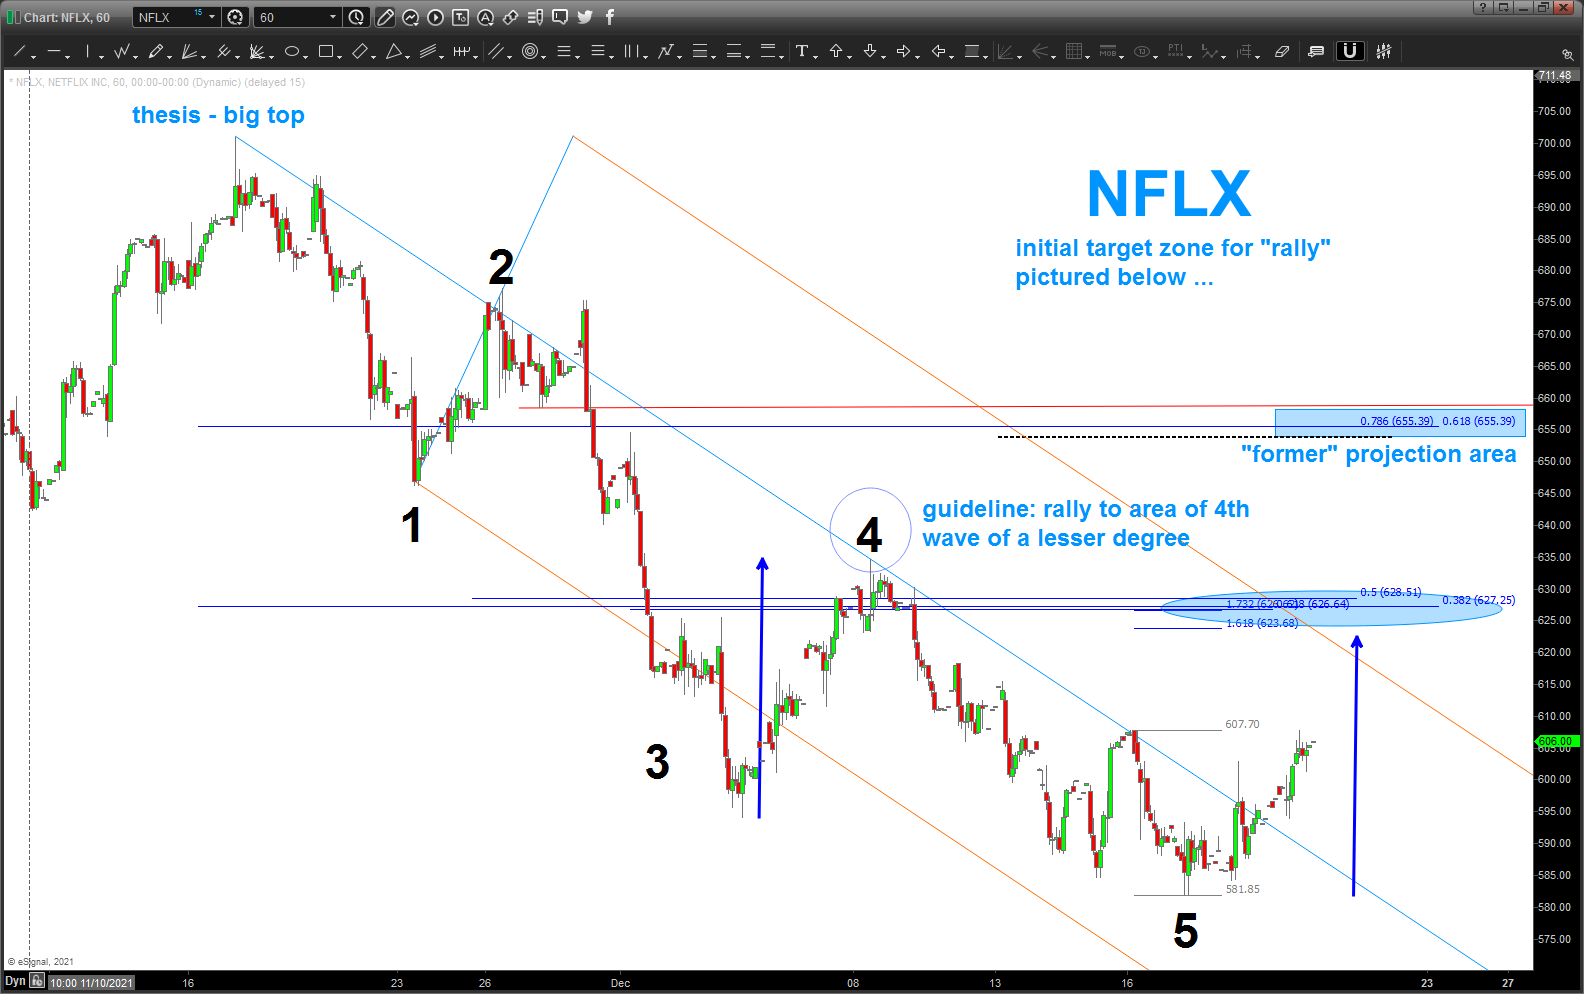
anyway, our targeted zone held as support (note there are at least 9 different methods showing this to be a good zone of support) and it appears our rally is on … from an Elliott perspective, a guideline (NOT a rule) is that a counter rally will go to the vicinity of the previous 4th wave of a lesser degree and we can see a LOT of math coming together in that zone/area. I do believe that area will work as resistance but I “expect” that the higher target will ultimately be the rally point as this entire NFLX bull run has had a lot of momentum …
so, for now, let’s see how this PATTERN plays out and watch the 625-630 area and also 650-660 for now …
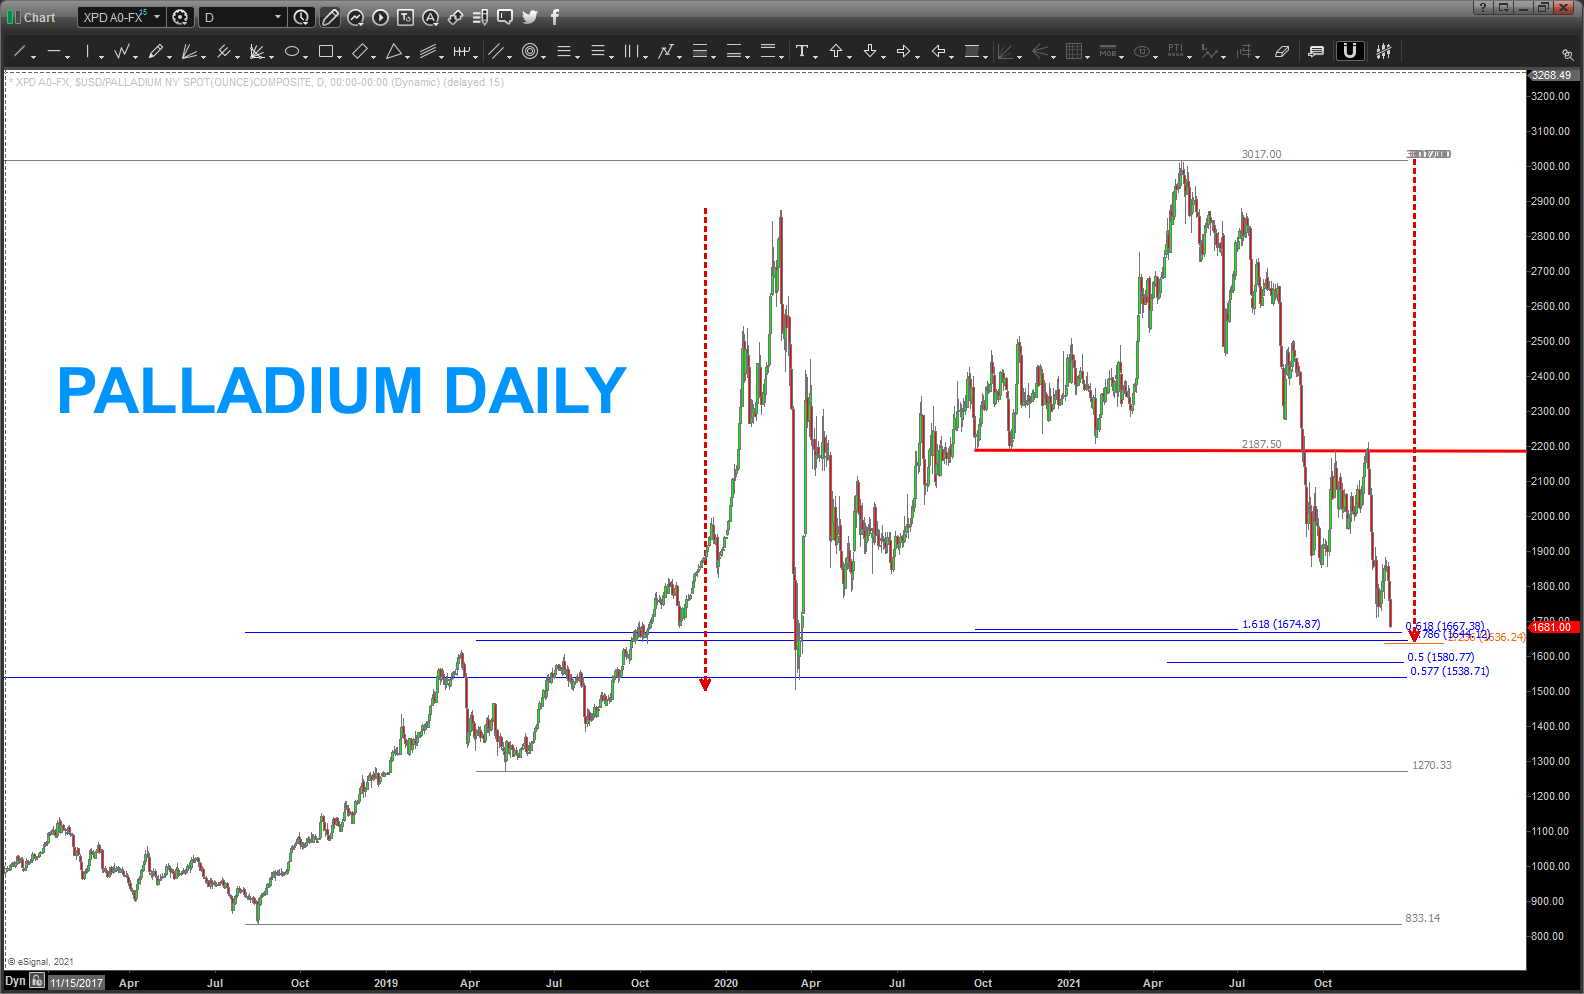
also, note below, that Palladium also hit the target zone and found support …
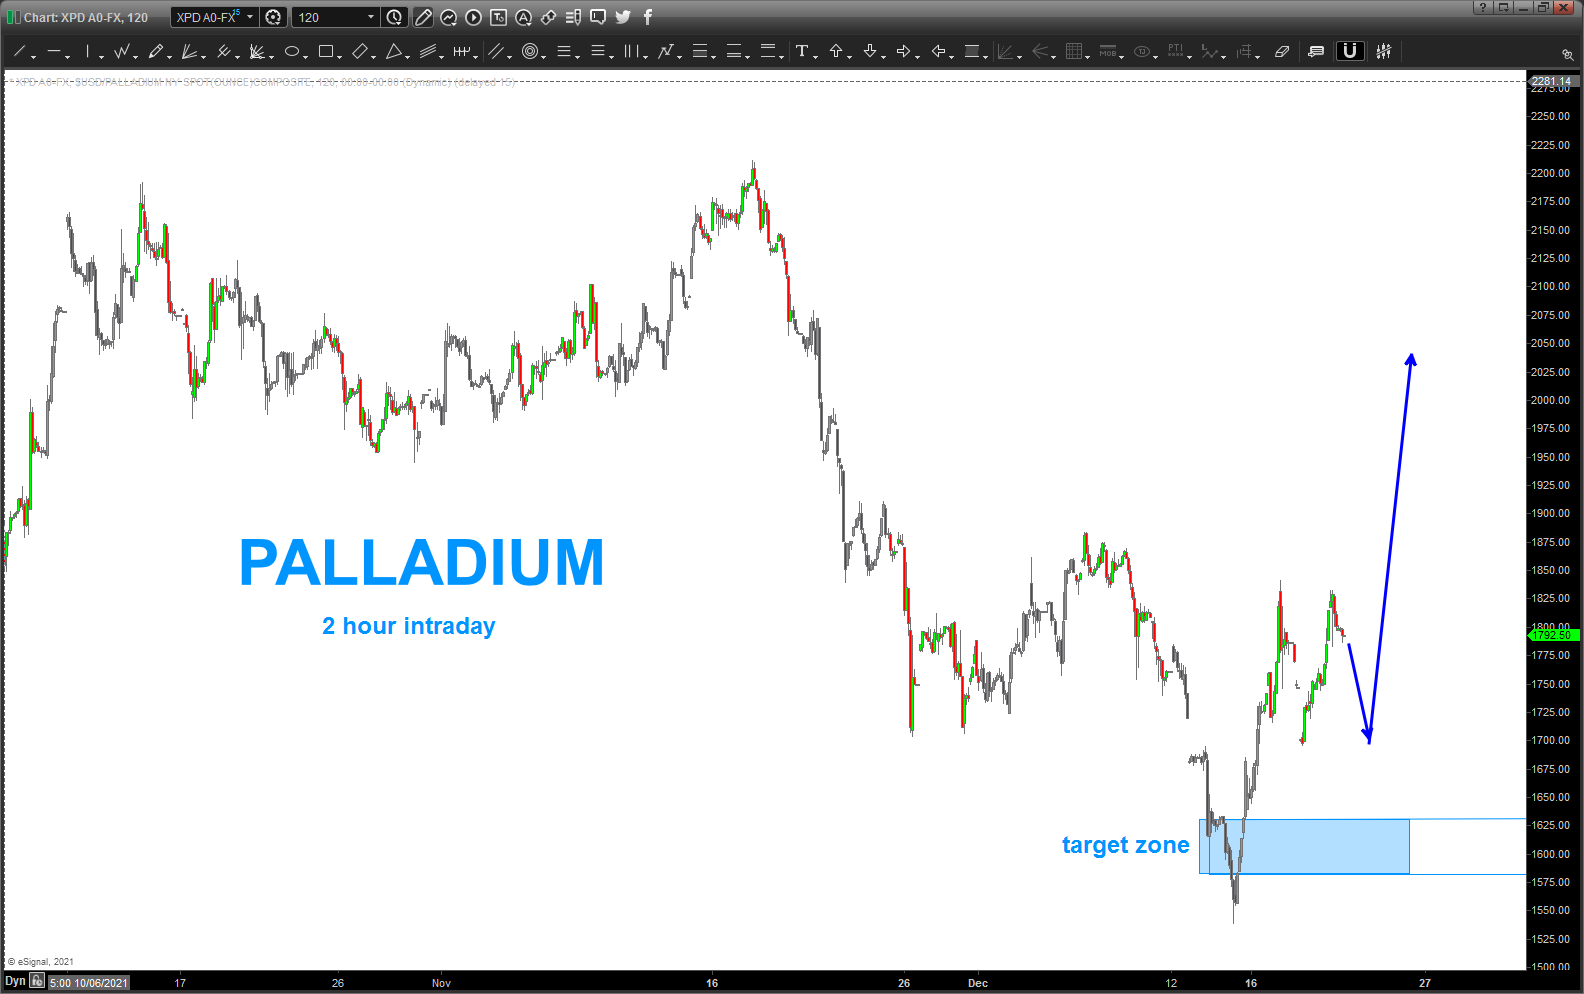
Palladium rallies .. so does tech … so watch a potential really in Palladium also …!
bottom line – this rally “makes sense” and the math worked … so now, we WAIT and look to put a short on NFLX in the coming days or weeks.
thanks for reading and rock on, ok?
also, got a 4/3 wetsuit today … it’s just got plain cold in the Pacific and with a long period swell and a favorable tide, I could stay out there ALL DAY but cold got the better of me …
get some!

WMT – sitting on a cliff of support
Posted on December 16, 2021 Leave a Comment
last post on WMT: https://atomic-temporary-44460632.wpcomstaging.com/2019/06/16/walmart-wmt/
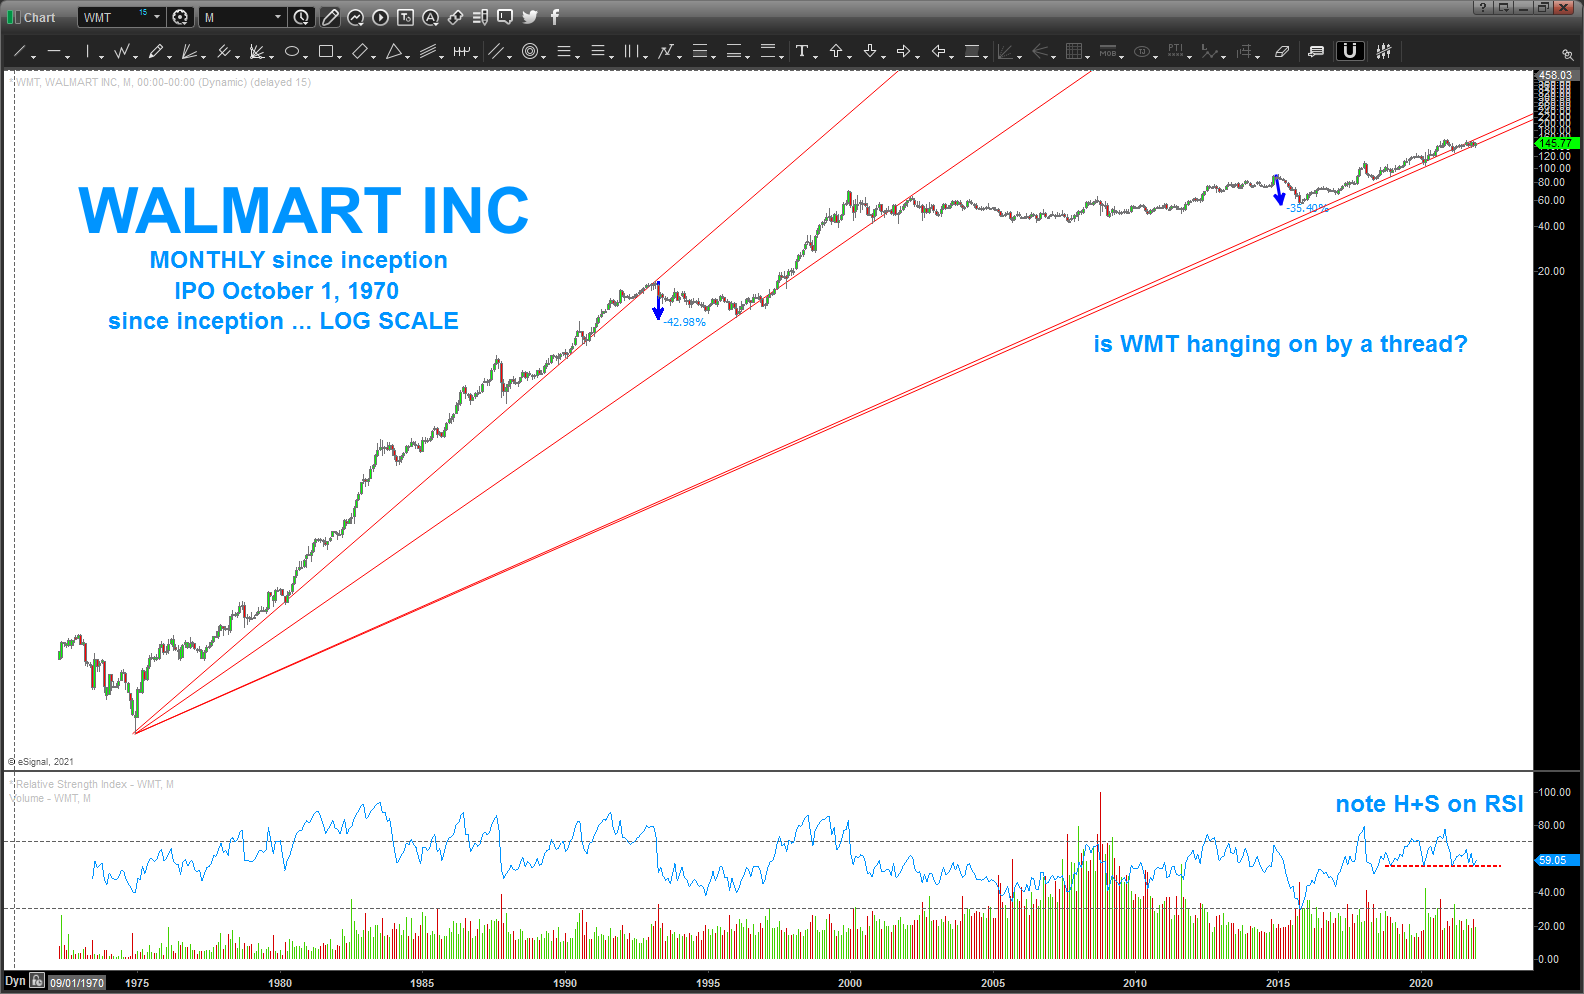
the butterfly sell that we ID’d above worked for a bit but ultimately failed …so, I’ve taken a long term picture of WMT using the LOG scale and the LOG Trend lines …
as long as we stay above the red trend lines the beat goes on … that being said, this is a pretty big trendline support so watch carefully.
UNG update
Posted on December 15, 2021 Leave a Comment
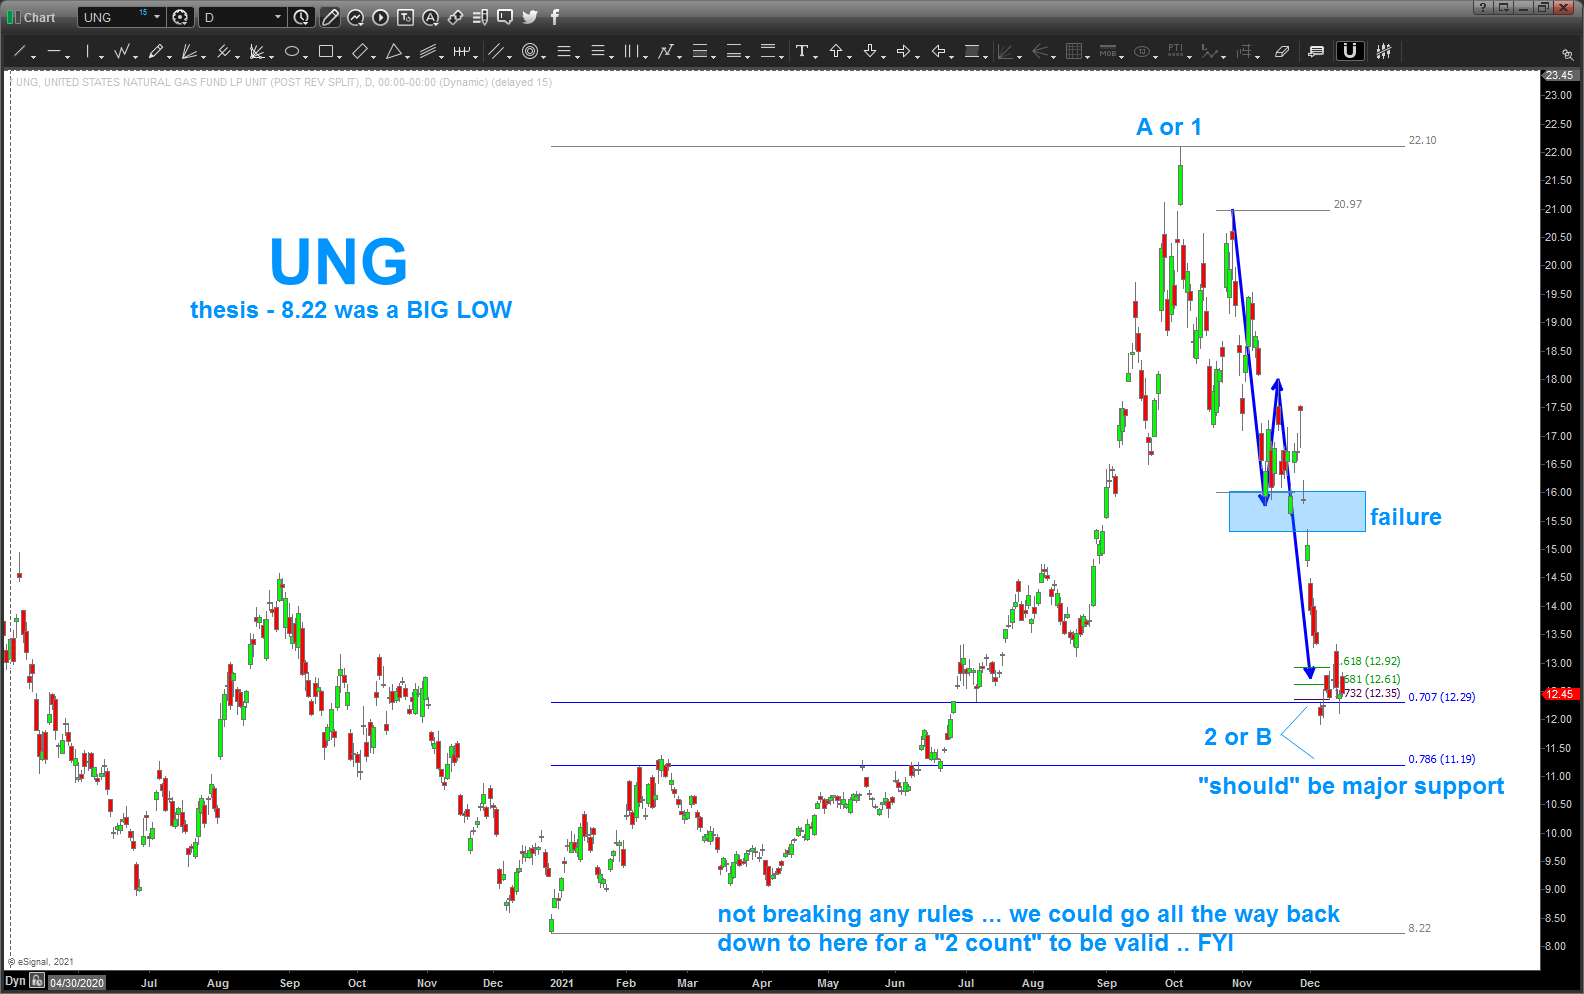
well, if your along for this ride you might start questioning the long thesis – I’m not there, yet, due to my entry down in/around the low 9’s … but, certainly looks heavy.
for now, we stand w/ our thesis that the low 89’s was a major low and this is a retracement in a wave 2 or B-wave w/ a rally to come.
I do like the support found from the polarity log trend line …
staying long …
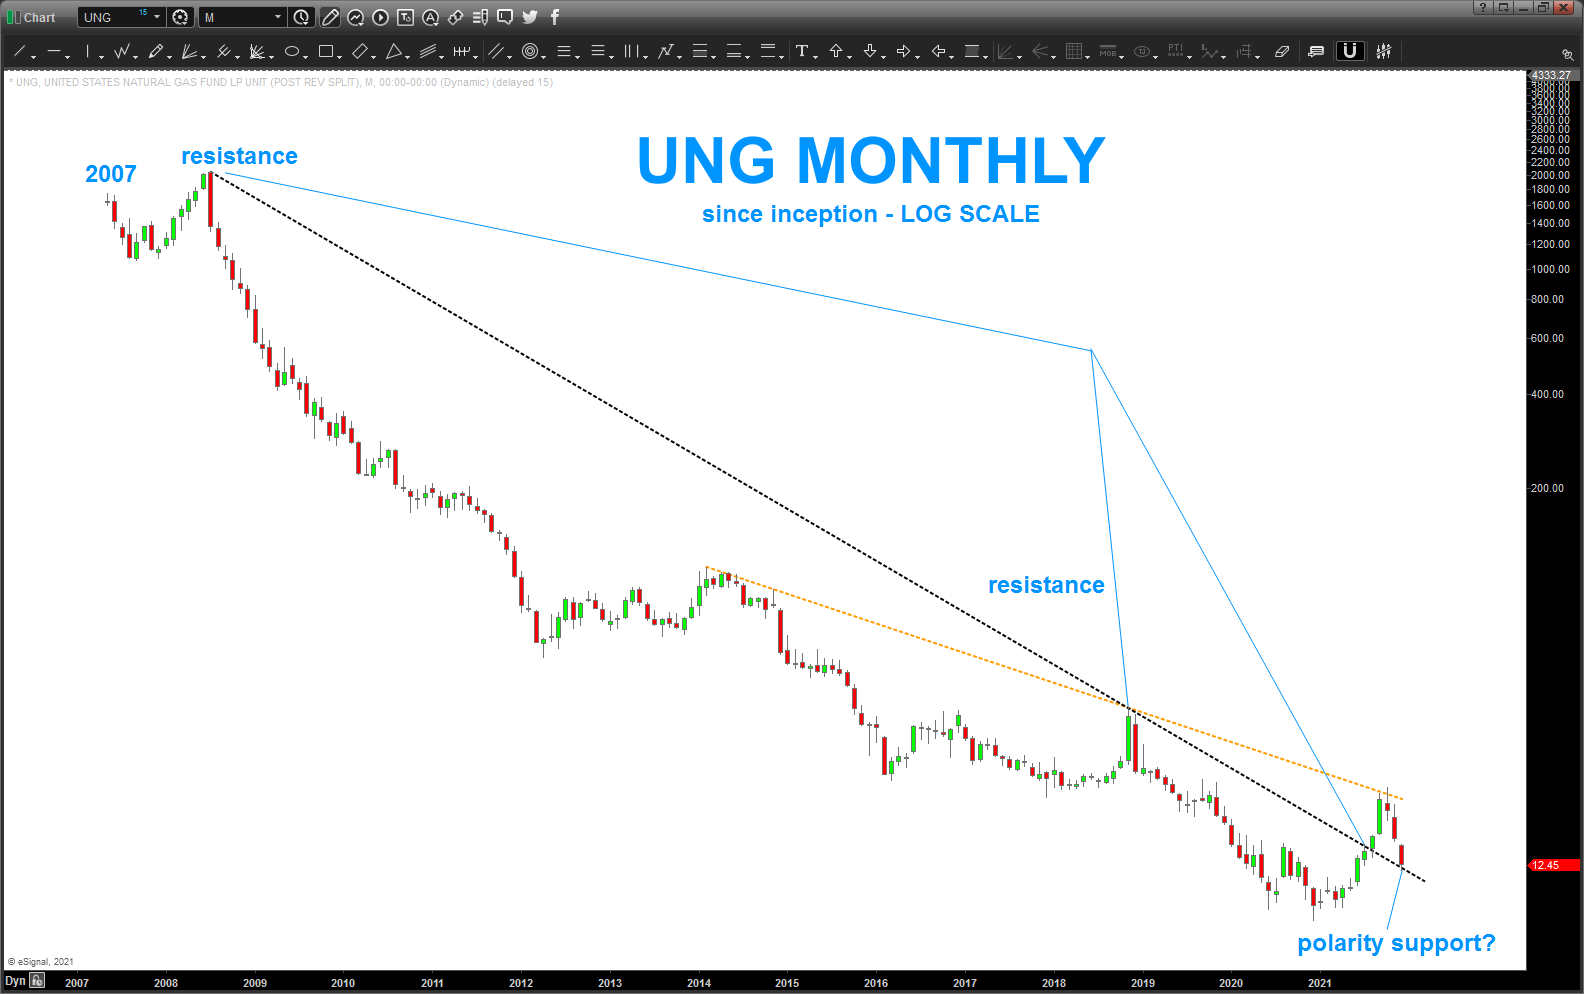
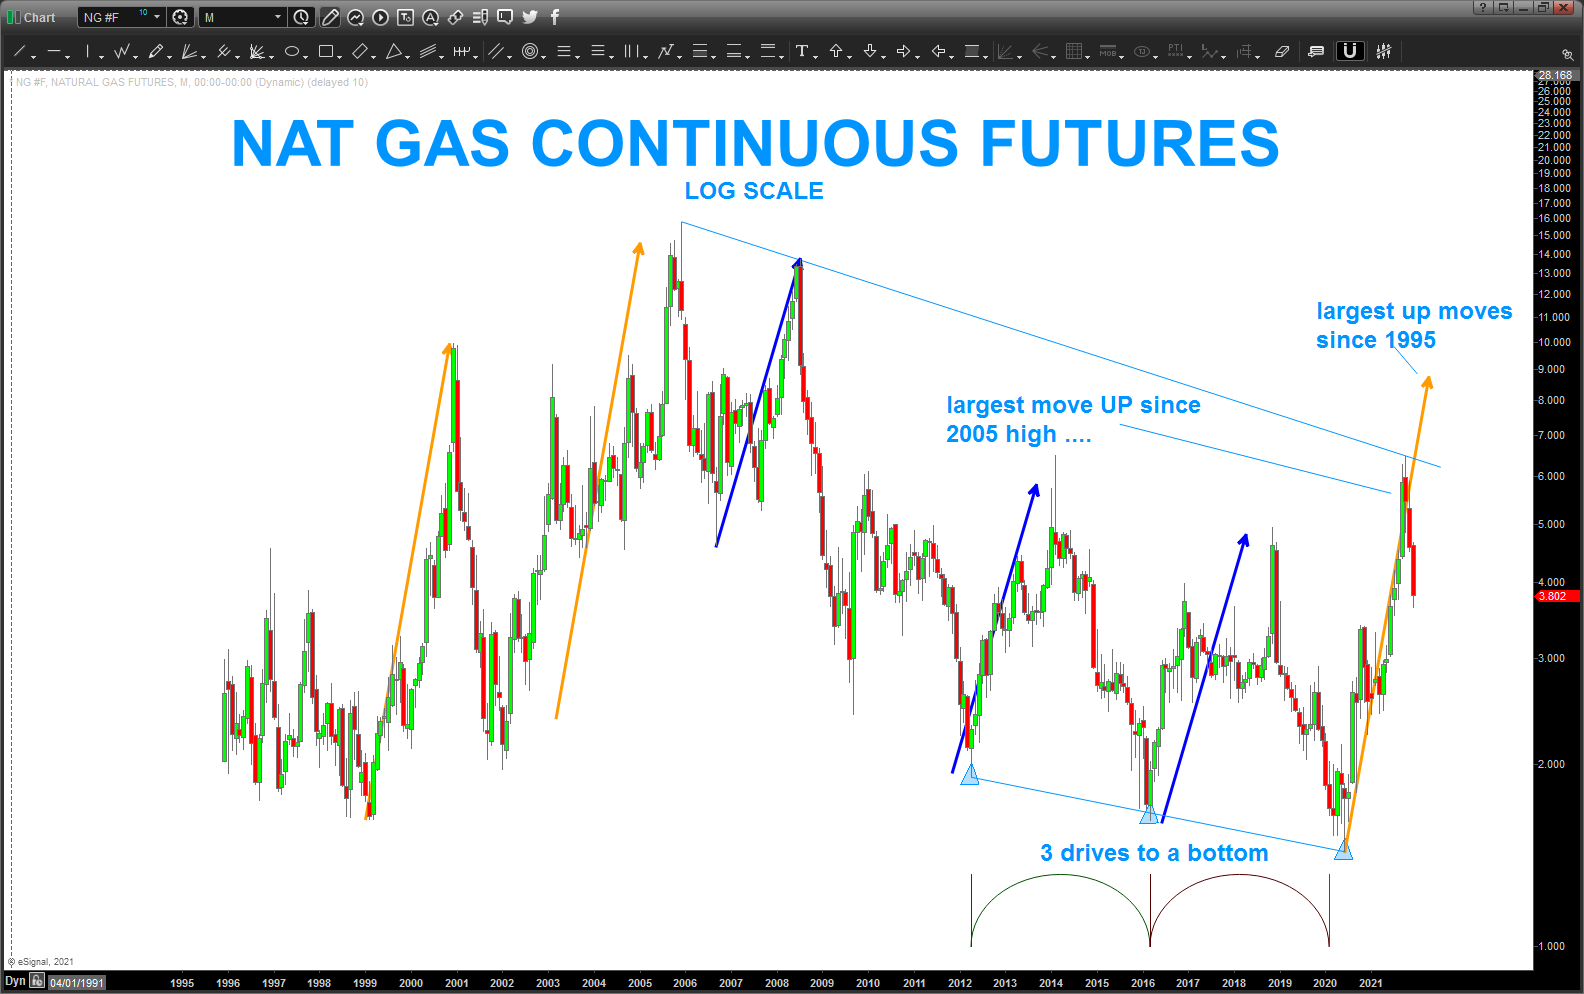
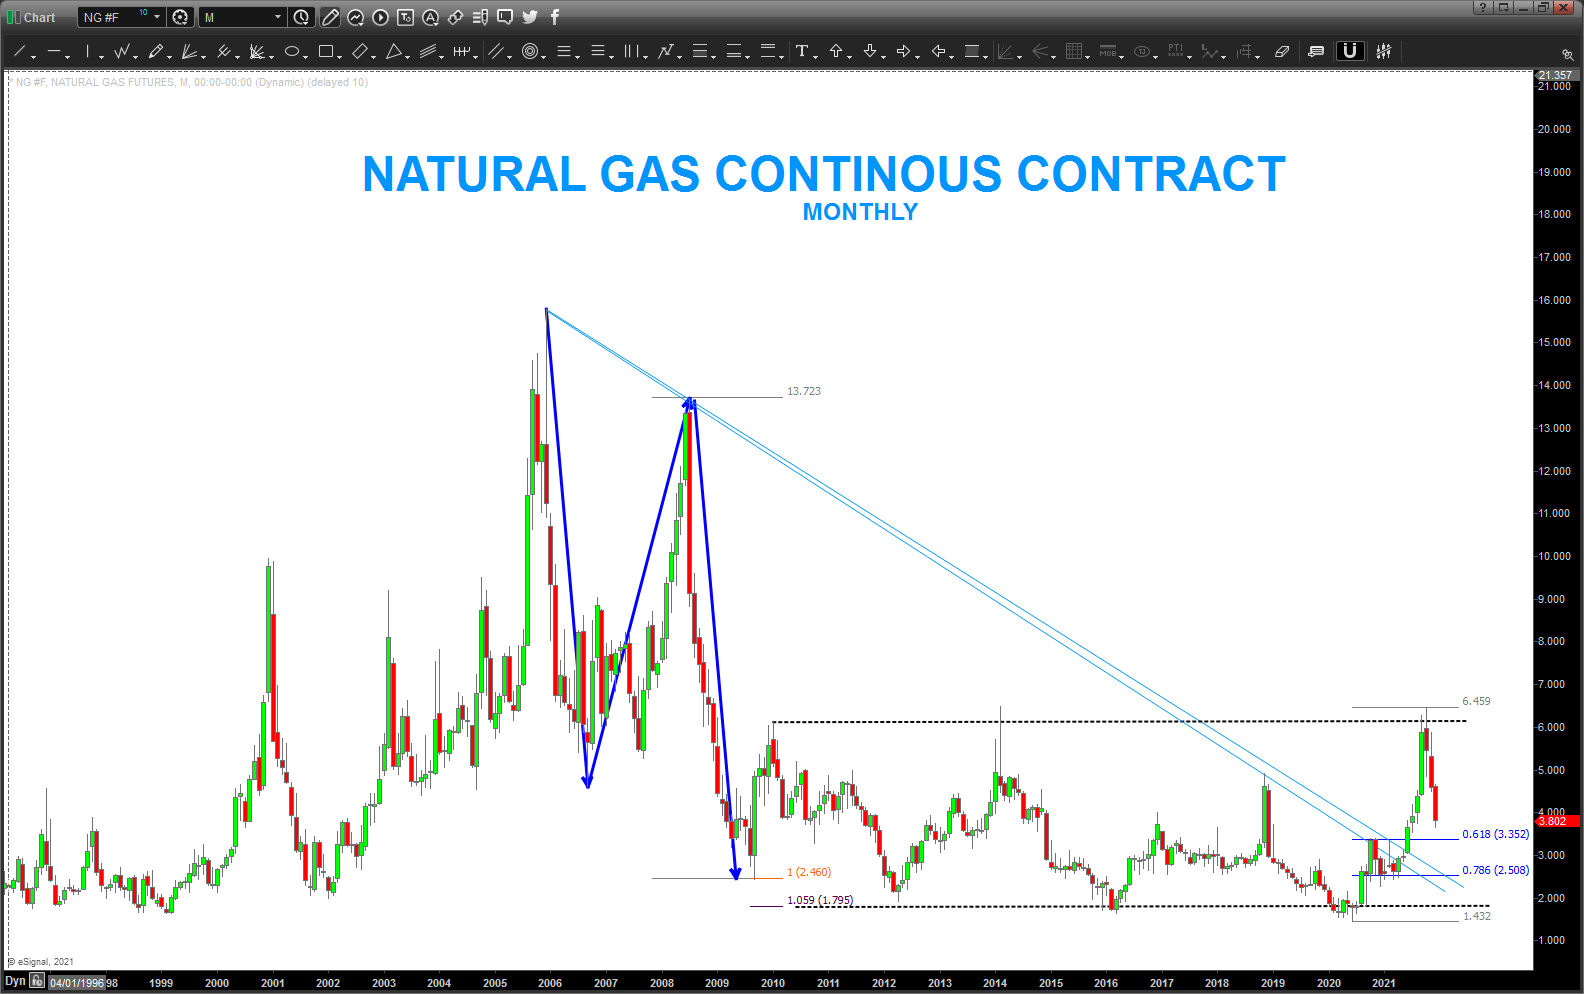
here’s a look at the NAT GAS continuous futures contract … note, we’ve completed the “largest” move up since 2005 (blue lines) … reasonable to expect a move up like the orange ones from the past?
TSLA – pattern complete so off to new highs?
Posted on December 15, 2021 Leave a Comment
last post on TSLA: https://atomic-temporary-44460632.wpcomstaging.com/2021/03/26/tsla-charging-station-please/
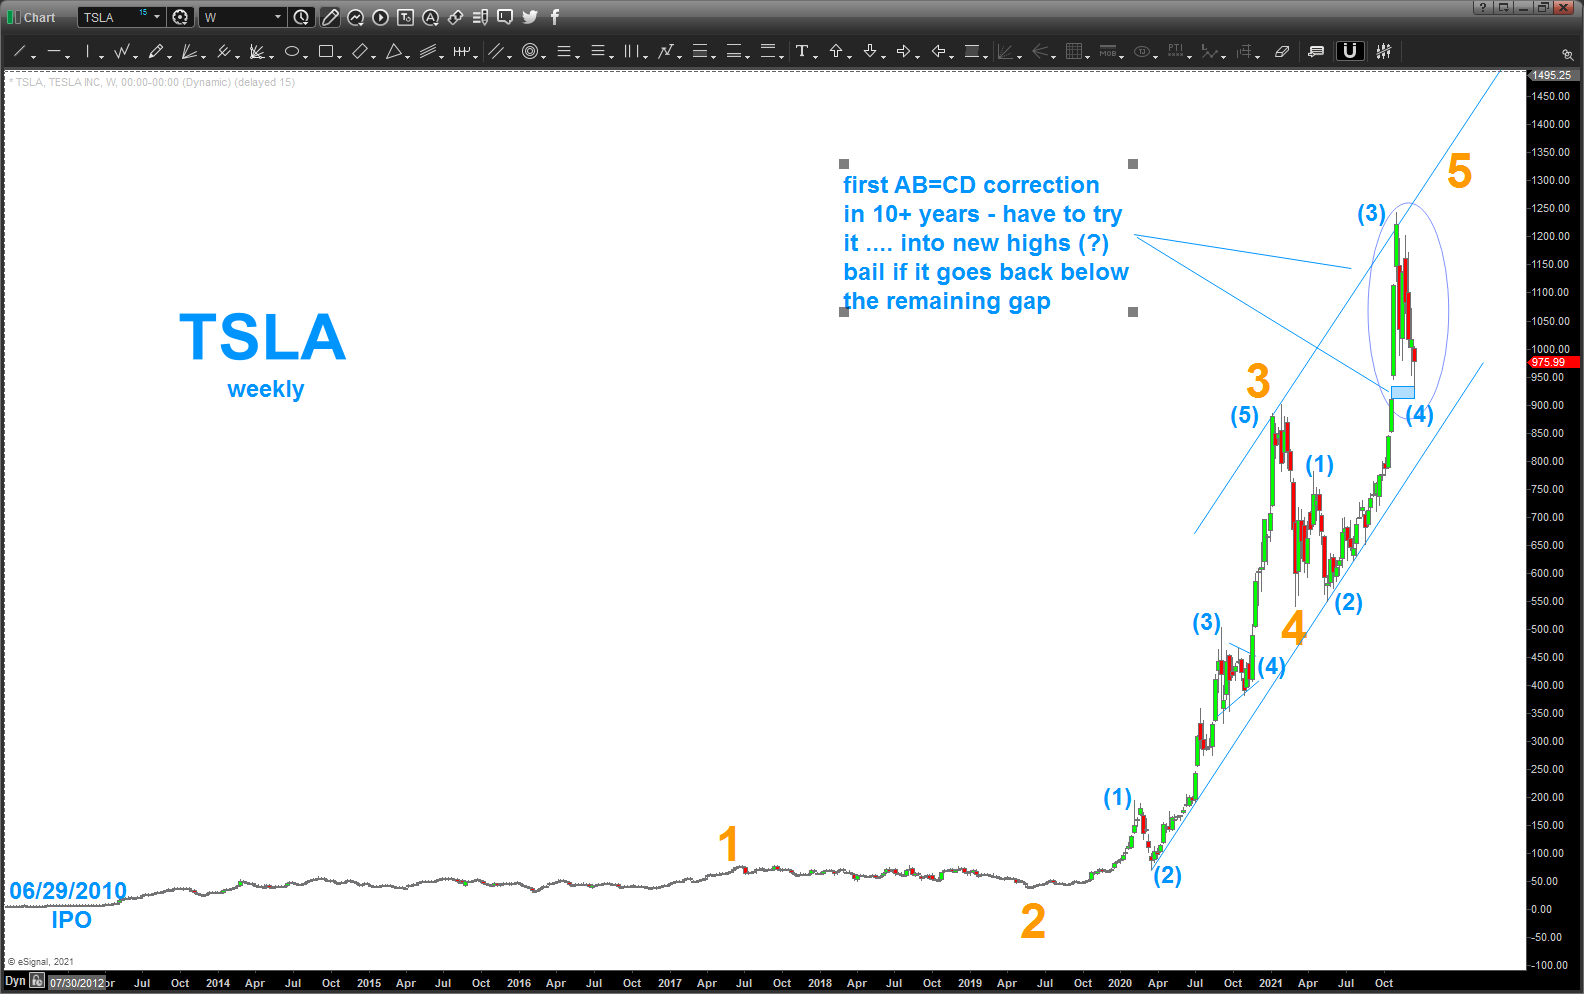
in the last post, looks like the “percentage” or “log AB=CD” worked well and led to a 40% ish decline … that was wave 3 (orange)
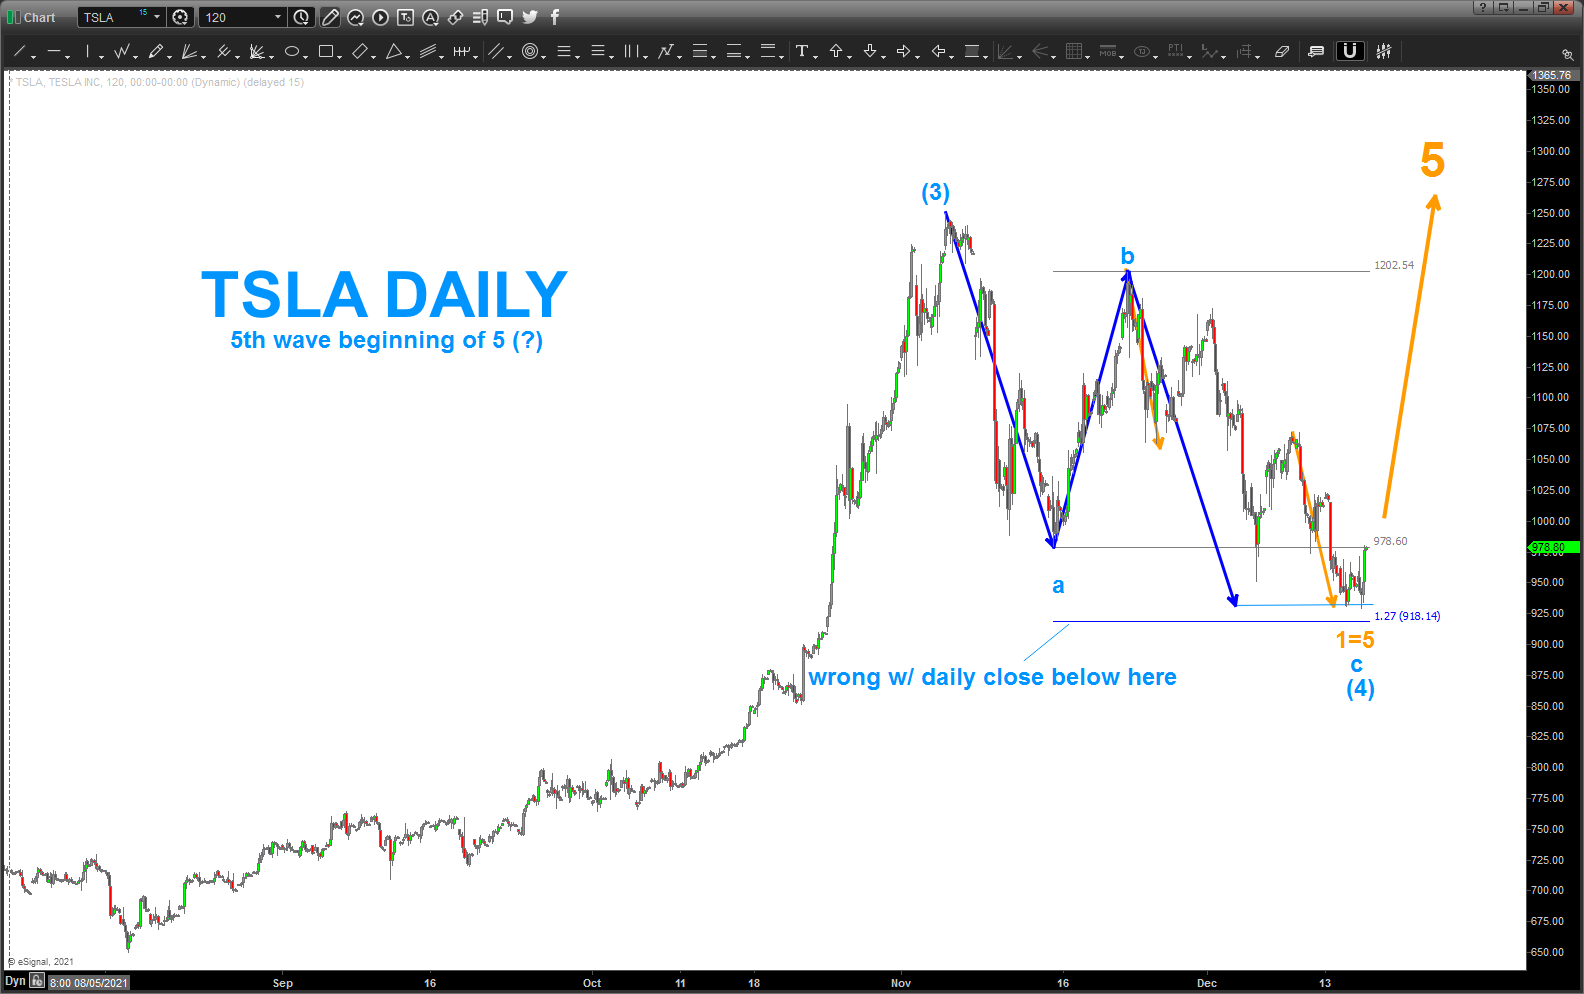
today, we completed the first AB=CD in the entire run … we have a little gap left open but net-net this was a very nice BUY pattern and looking at the count, certainly can make the case that we are going to start a run to new all time highs for TSLA .. then, well, 5 waves complete. will try to update targets in the coming days/ weeks but lets watch price action for now in/around this pattern level.
Bart
NFLX
Posted on December 13, 2021 1 Comment
post on NFLX: https://atomic-temporary-44460632.wpcomstaging.com/2021/10/19/chart-of-the-year/
the target zone ID’d in the post above missed the target by 5% but has been selling off the past few weeks …
a VERY clear 5 wave count is present so I’ve done my best as providing some “guidelines” to formulate a gameplan.
the “thesis” is that we have completed 5 waves up on NFLX and are correcting based on that move …
a lot of times, not always, 5=1 and that comes in around 580 .. .we would like to see that hold and bounce up in 3 waves to prepare for a short … so, hold your powder dry and I expect, in a few weeks, it might be time to put your toe in …
Ratio showing us something …or not?
Posted on December 13, 2021 Leave a Comment
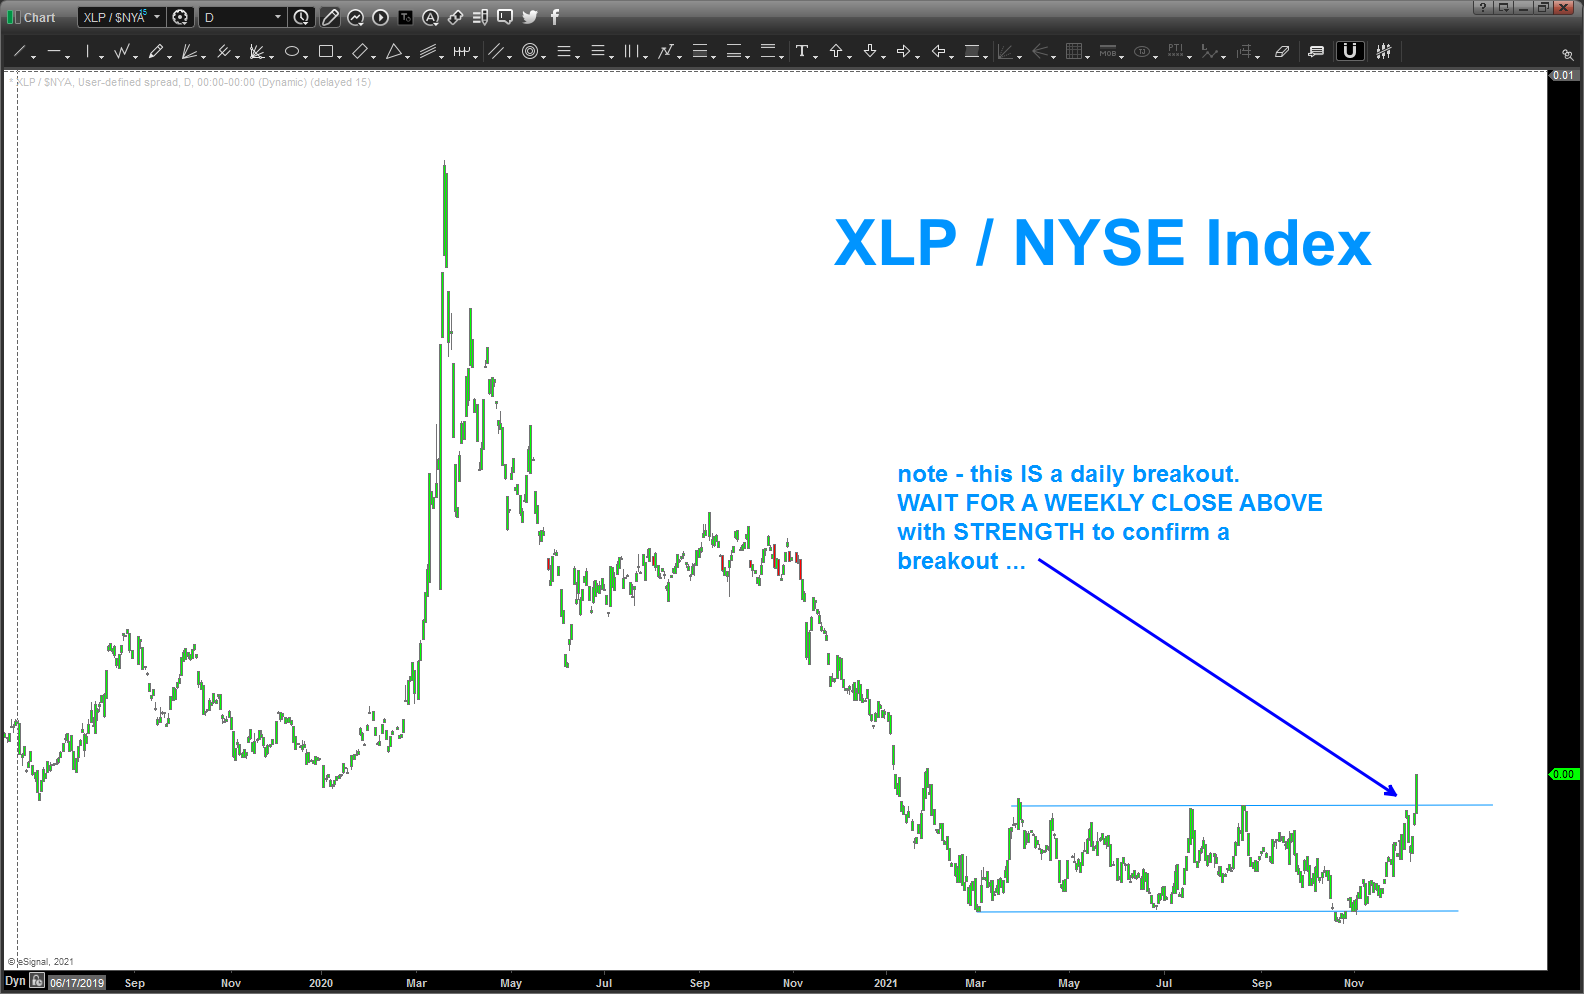
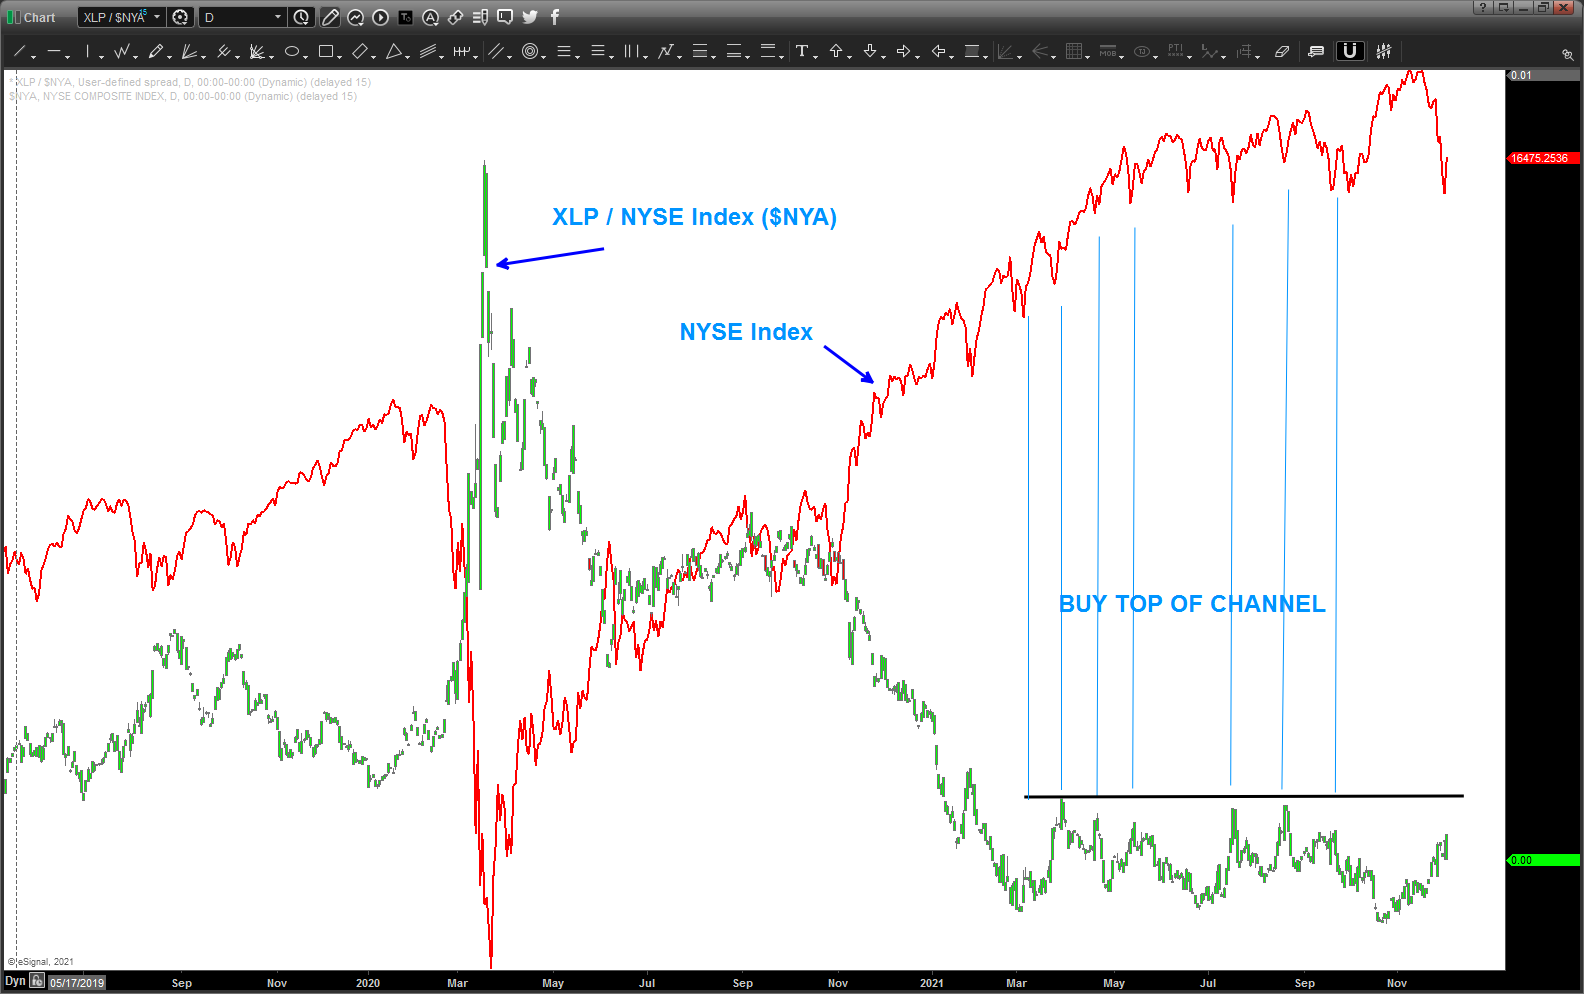
well, we have a DAILY breakout above the channel that has been defining the ratio for pretty much all of 2021. is this a valid breakout or a gotcha? I’ll make an educated guess once we close this week out … looking for a WEEKLY close above the top of the channel w/ strength.
will be interesting to see what happens w/ the Palladium level ID’d on the post before this one … we are getting to a point where one of the PATTERNS will fail and that will give us a good idea of where we are …
fun times, hugh?
Palladium – approaching key level … important to NASDAQ
Posted on December 13, 2021 Leave a Comment
last post on Palladium: https://atomic-temporary-44460632.wpcomstaging.com/2021/09/28/keep-an-eye-out-for-palladium-in-the-lower-blue-blox/
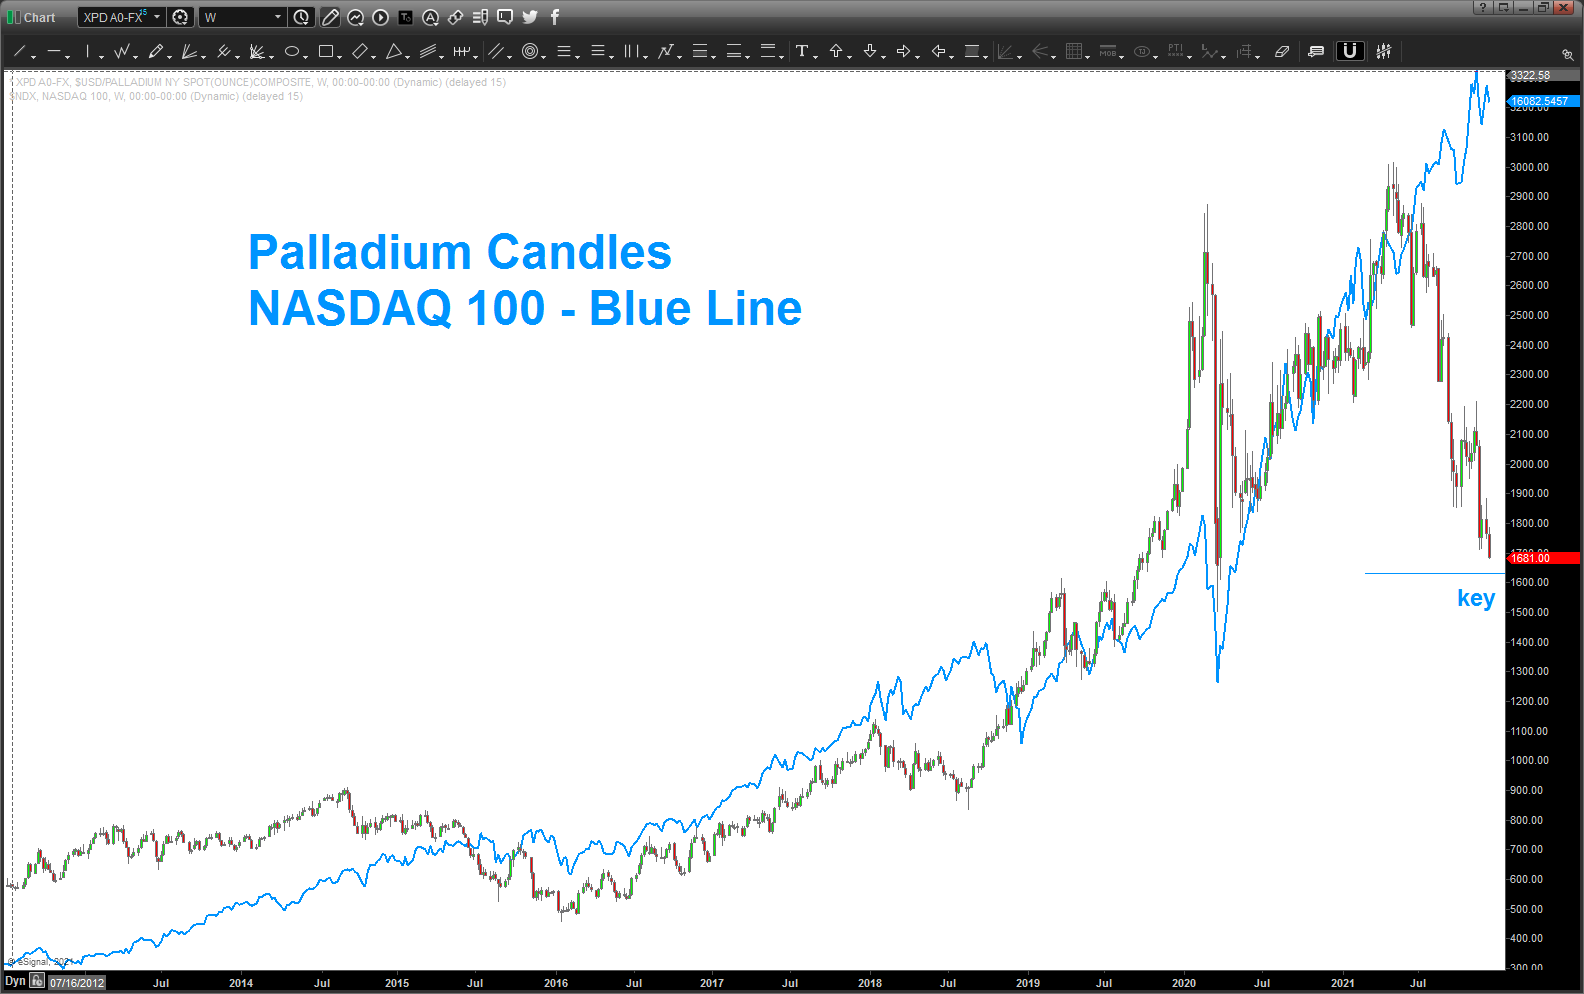
as you can see, Palladium is tracking down into our level ID’d above back in September. additionally, you can see that they track each other pretty nicely. it’s NOT exact but the general trend and flow is pretty much the same…
during this sell off in Palladium, the NASDAQ 100 has held up pretty nicely and we are approaching a level on the Palladium chart that represents the LARGEST corrective move in the past 15+ years. this measured move is key …
time to play IF and THEN …
IF we hit the level below on Palladium AND it holds THEN I would look to be a buyer of the NASDAQ 100. note, we have a LOT of thrust coming into this level so let it shuck and jive and look for a weekly signal reversal candle on palladium (in this case the HIGH of the candle that makes the low (the wick is included) on a weekly close above is a signal reversal candle or SRC)
BABA update …
Posted on December 5, 2021 Leave a Comment
last post on BABA: https://atomic-temporary-44460632.wpcomstaging.com/2020/08/23/baba-3/
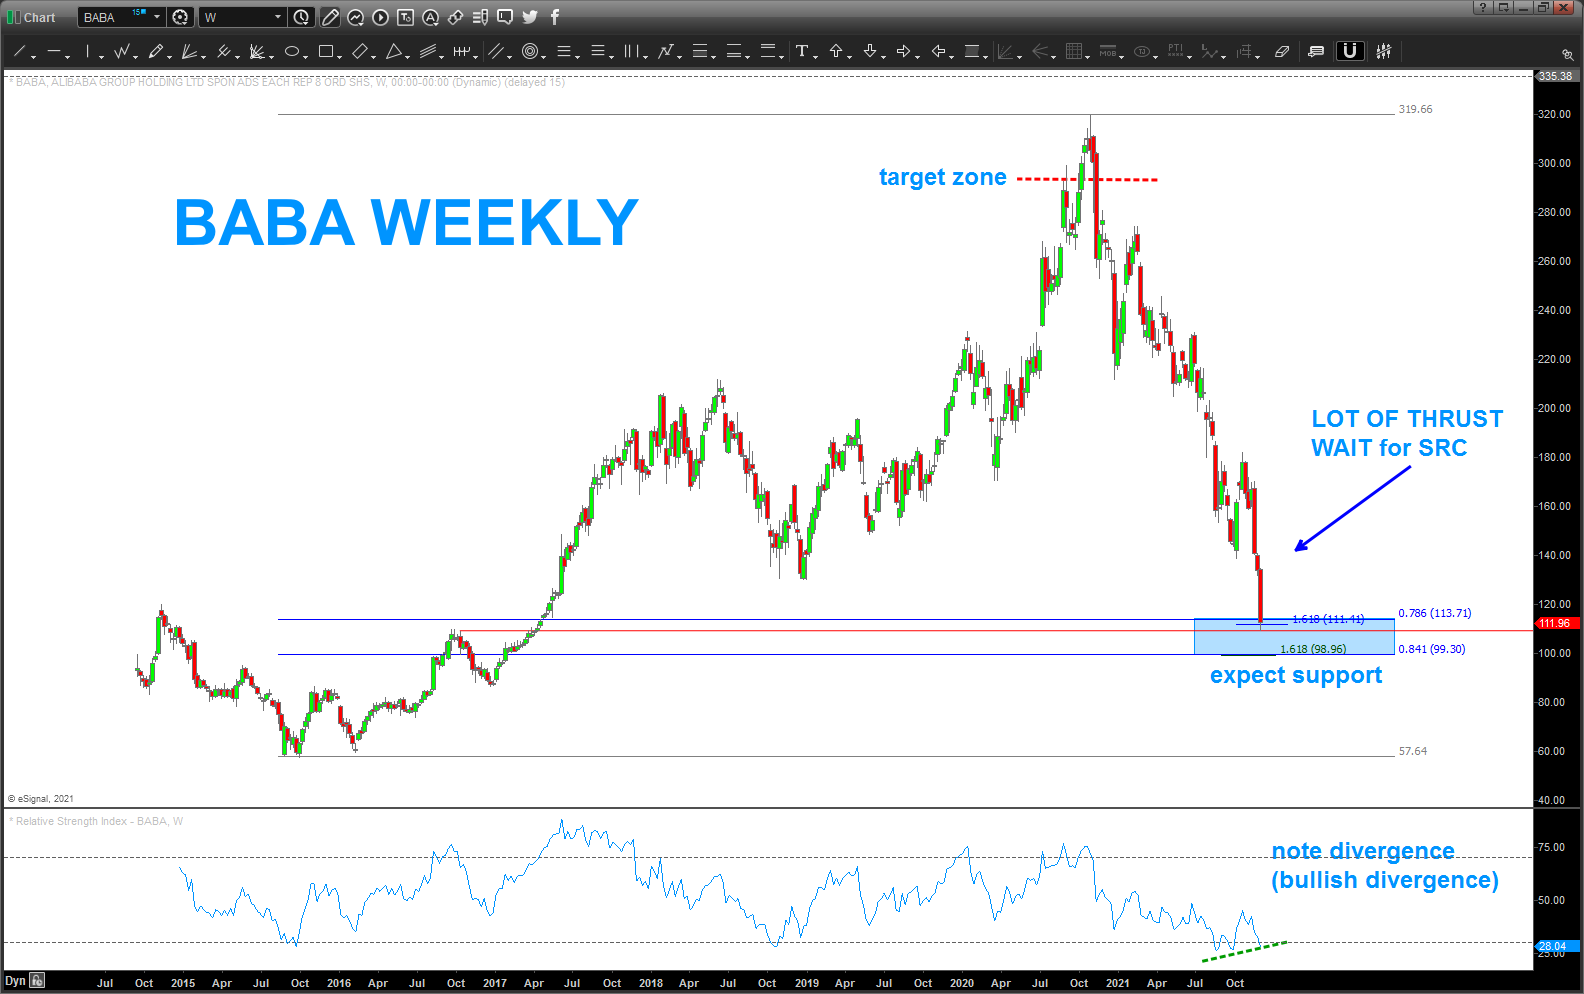
note the thrust coming into this very important .786 retracement node. additionally, we have a 1.618 projection a little lower sitting right on top of .841 retracement. (1/1.1892 = .841 equal octave scale of music ratio) and we can throw in some polarity and bullish divergence so would expect some support or a pause.
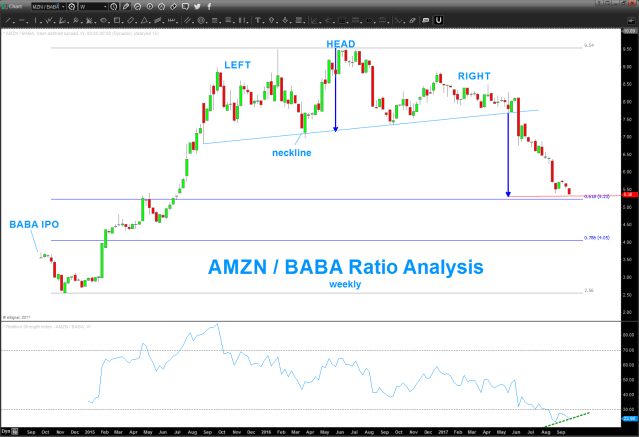
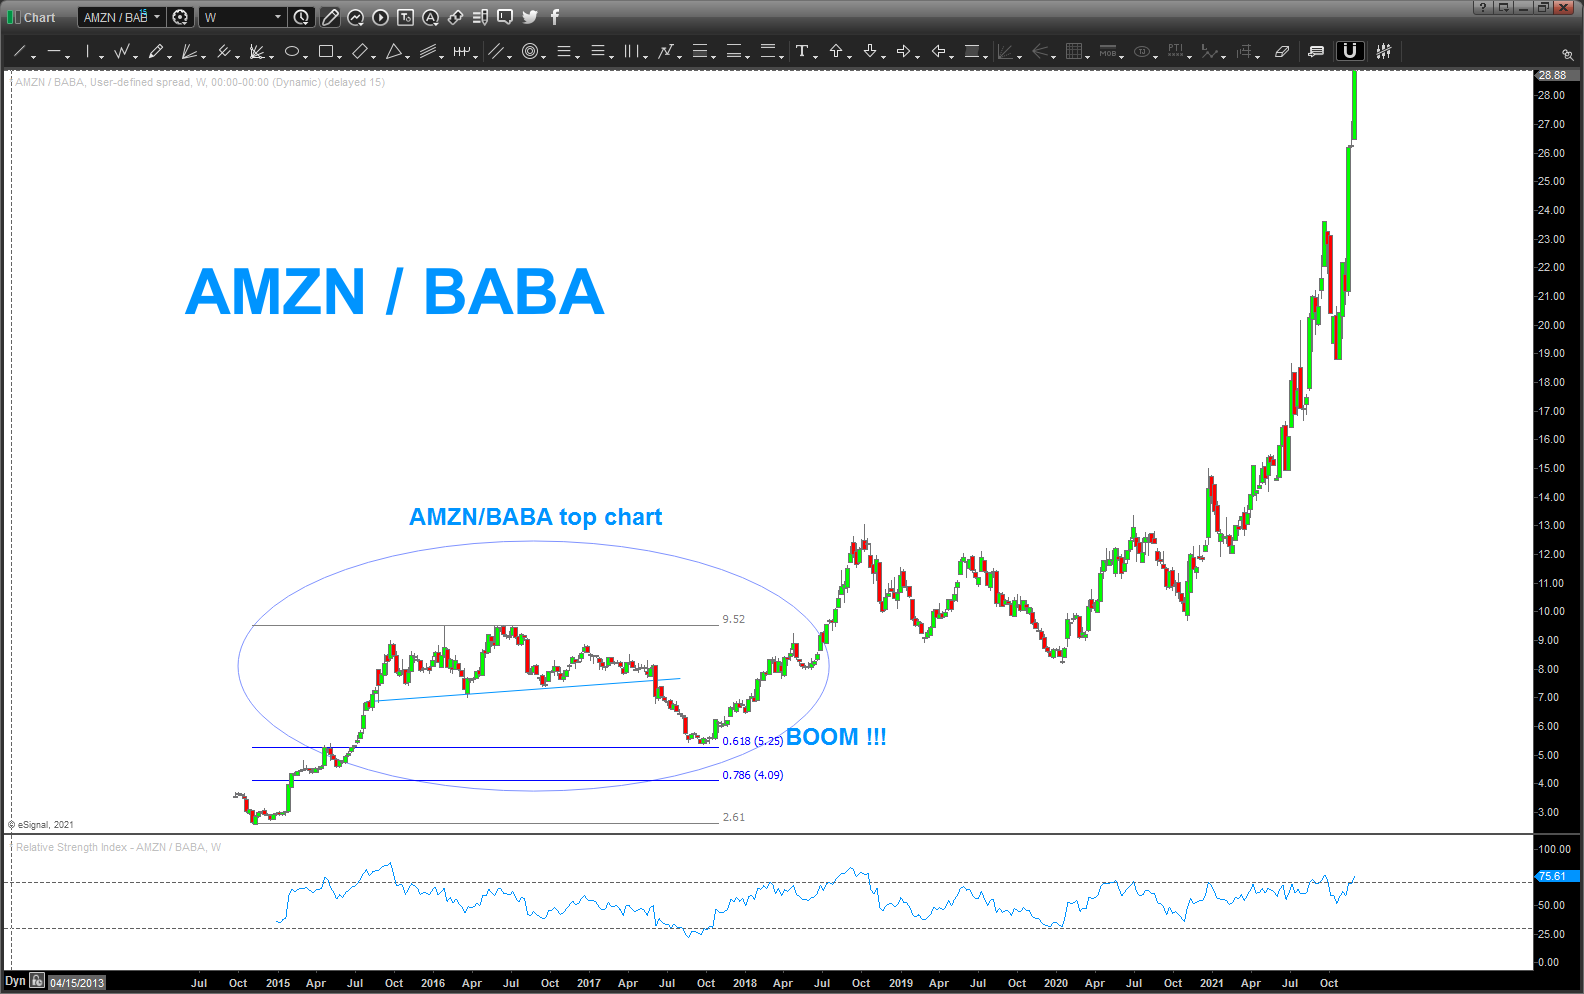
that being said, I enjoy doing ratio analysis so here’s AMZN / BABA. the first graph below is back almost 4 years ago when I did the same relative strength look because, at the time (believe it or not) BABA was stronger that AMZN. don’t believe me? look at the ratio … it had been going down for a couple years as BABA climbed but then guess what, measured moves and retracements and a bunch of pattern stuff gave AMZN the support in the ratio and off it went and the rest is history. (note, did I mention – once – anything to do w/ sales, or revenue, or anything like that? nope …just numbers and patterns for me)
if seriously trying get long BABA I would watch for a daily or weekly SRC before entering. when I look at those relative strength ratio charts it looks like BABA is about to get smacked even harder so caution warranted … wait for an SRC.
Ratio Ratio Where Art Though ….
Posted on December 2, 2021 3 Comments
below is our ratio .. if you remember my last post, we were talking about a monthly or weekly close BELOW the consolidation and the market would take off … it started but jumped back into the channel and has been climbing ever since.
what has happened in the market? some interesting selling … but is THE TOP IN?
honestly, have no idea nor do I care if it is or it isn’t. all we know is we now watch the top of the channel … if that gets attacked and we get a weekly/monthly close ABOVE then a health meltdown could occur.
for now -just in the middle of the channel folks. looks like it wants to go higher to hit the upper channel – that’s what its been doing – so why not? higher means some more volatility / selling but nothing to freak out about, yet.
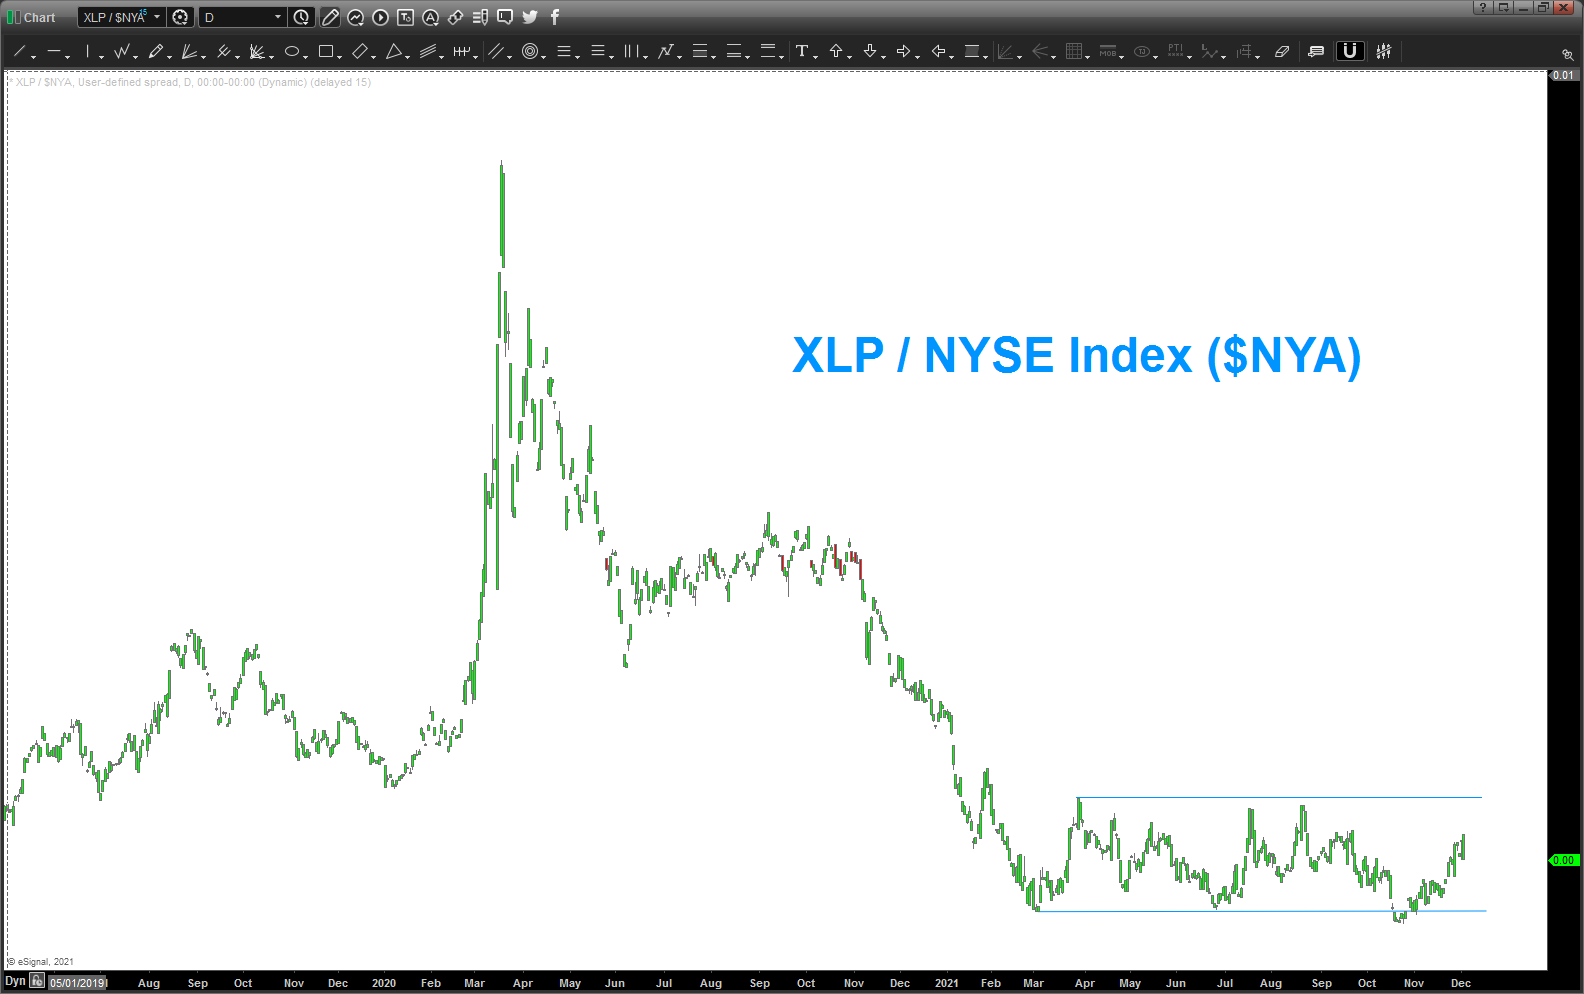
so what do you do? here’s something easy … if your a bul or like buying then BUY the TOP of the channel and if your a bear and like to sell then SELL at the bottom of the channel.
it’s going to be very interesting. hit me w/ any questions …
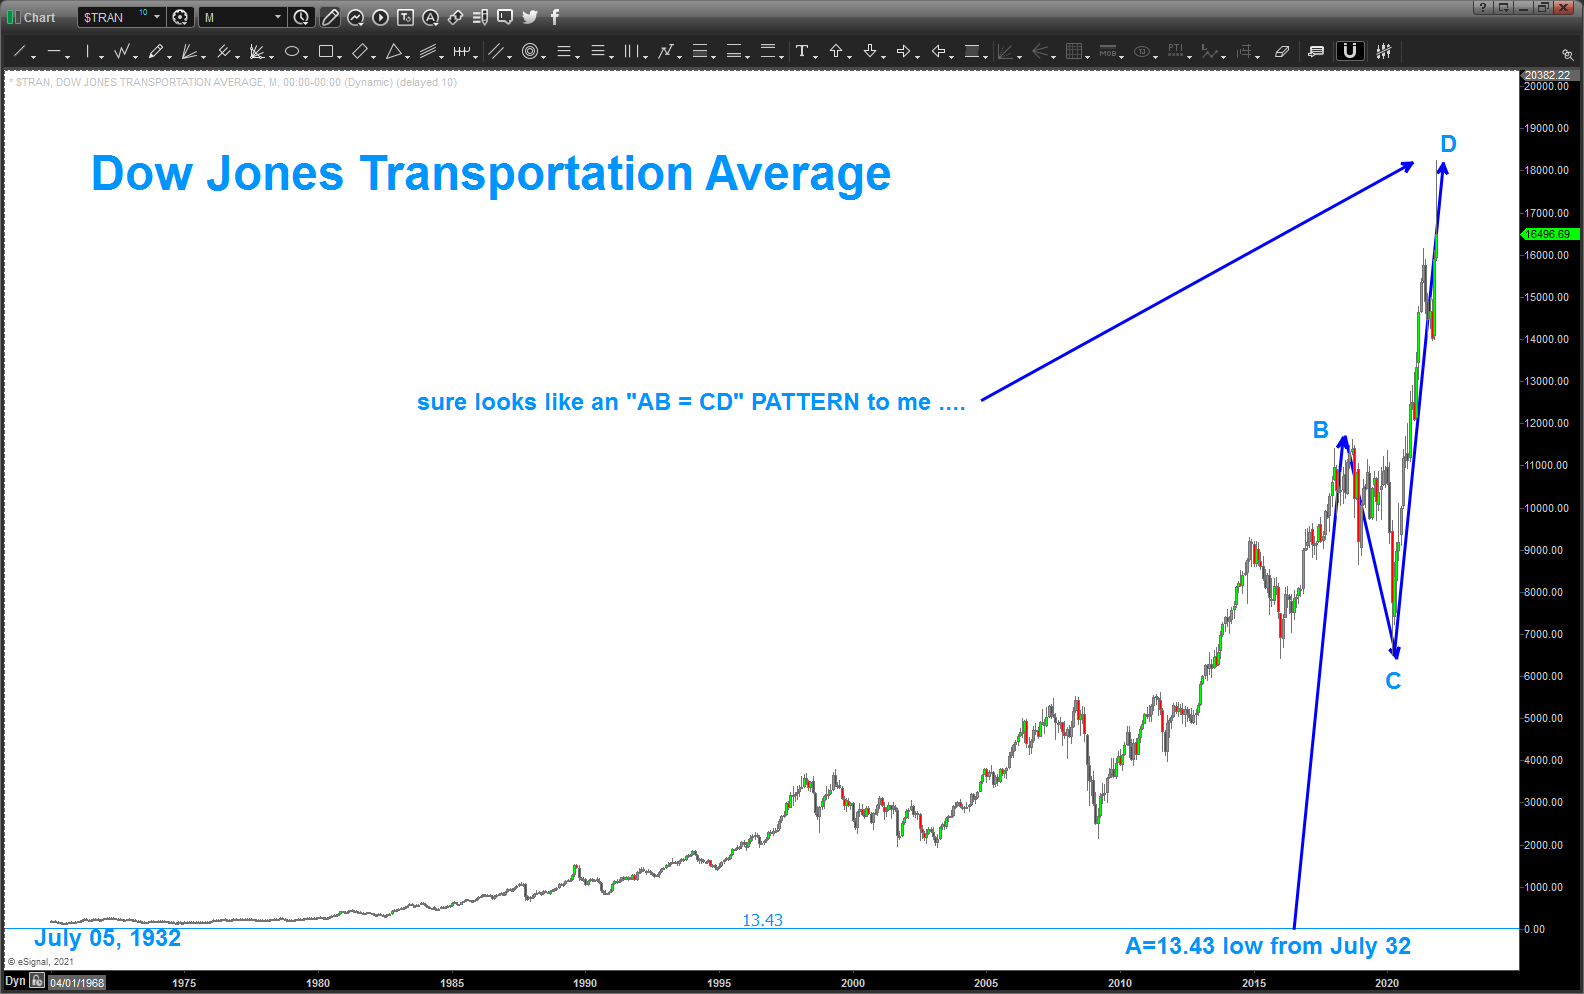
AB=CD on the Transports …
Posted on November 18, 2021 Leave a Comment
we last blogged about the “1.618 level” and the fact that we are in the continuation phase of completing a LOT of 5’s or we completed it at the AB=CD.
that is one heck of a bearish “wick” on that candle folks … but it’s also a LOT of thrust into the AB=CD so WAIT but if your long Transports might want to start paying attention to them …
and then I think ..
“now that I see a MAJOR pattern completing (yes folks they do fail – please remember that) I think of what could be the “news cause” of actually really thumping the transports that, after a little sell off, have weathered the pandemic actually pretty swell ….”
you can imagine the theories …