Training Time
Posted on April 19, 2022 2 Comments
Folks, miss everyone on this thread but having a BLAST over at Topgun Options providing opportunities to manage risk.
We find ourselves in some treacherous times … War, Financial Markets treachery, inflation, supply chain, blah blah blah …
Most everyone looks at charts so what better time to do an introductory course to teach “tactical” chart employment? There will be a little theory, but a preponderance of the course is around how to use charts and their tools (yes PATTERNS) to manage risk.
Folks, it’s $197 for the entire 6 courses.
Why? Want to make it affordable and support everyone trying to manage risk.
Would be honored if you join me …
https://go.topgunoptions.com/bart-training
Cheers –
Bart
Topgun Options and Tomcat Charts
Posted on February 14, 2022 Leave a Comment
Very excited to announce that I will be working w/ Whiz and the team at http://www.topgunoptions.com posting charts and PATTERNS thru Tomcat Charts.
Doing a webinar on Friday – please join if your interested!
https://go.topgunoptions.com/tomcat
My posts here will be infrequent and not common but you can find me at TOPGUN Options!
Trade em’ up!
Bart
Still here …
Posted on January 19, 2022 2 Comments
have been working on one of the most important projects of my life – Veteran’s suicide. I’ve been lucky enough to be chosen to be part of a documentary about life after the cockpit .. from the speed of sound to the speed of life.
this is and has been all consuming … not sure when I’ll be back to post but I just renewed my subscription for the site so it will up and running …
I’ve also been working w/ a select group of investors and that has been the focus from a charting perspective.
thanks for understanding, keep your powder dry and watch the European Banks.
Bart
USDYEN – another key pattern
Posted on December 24, 2021 2 Comments
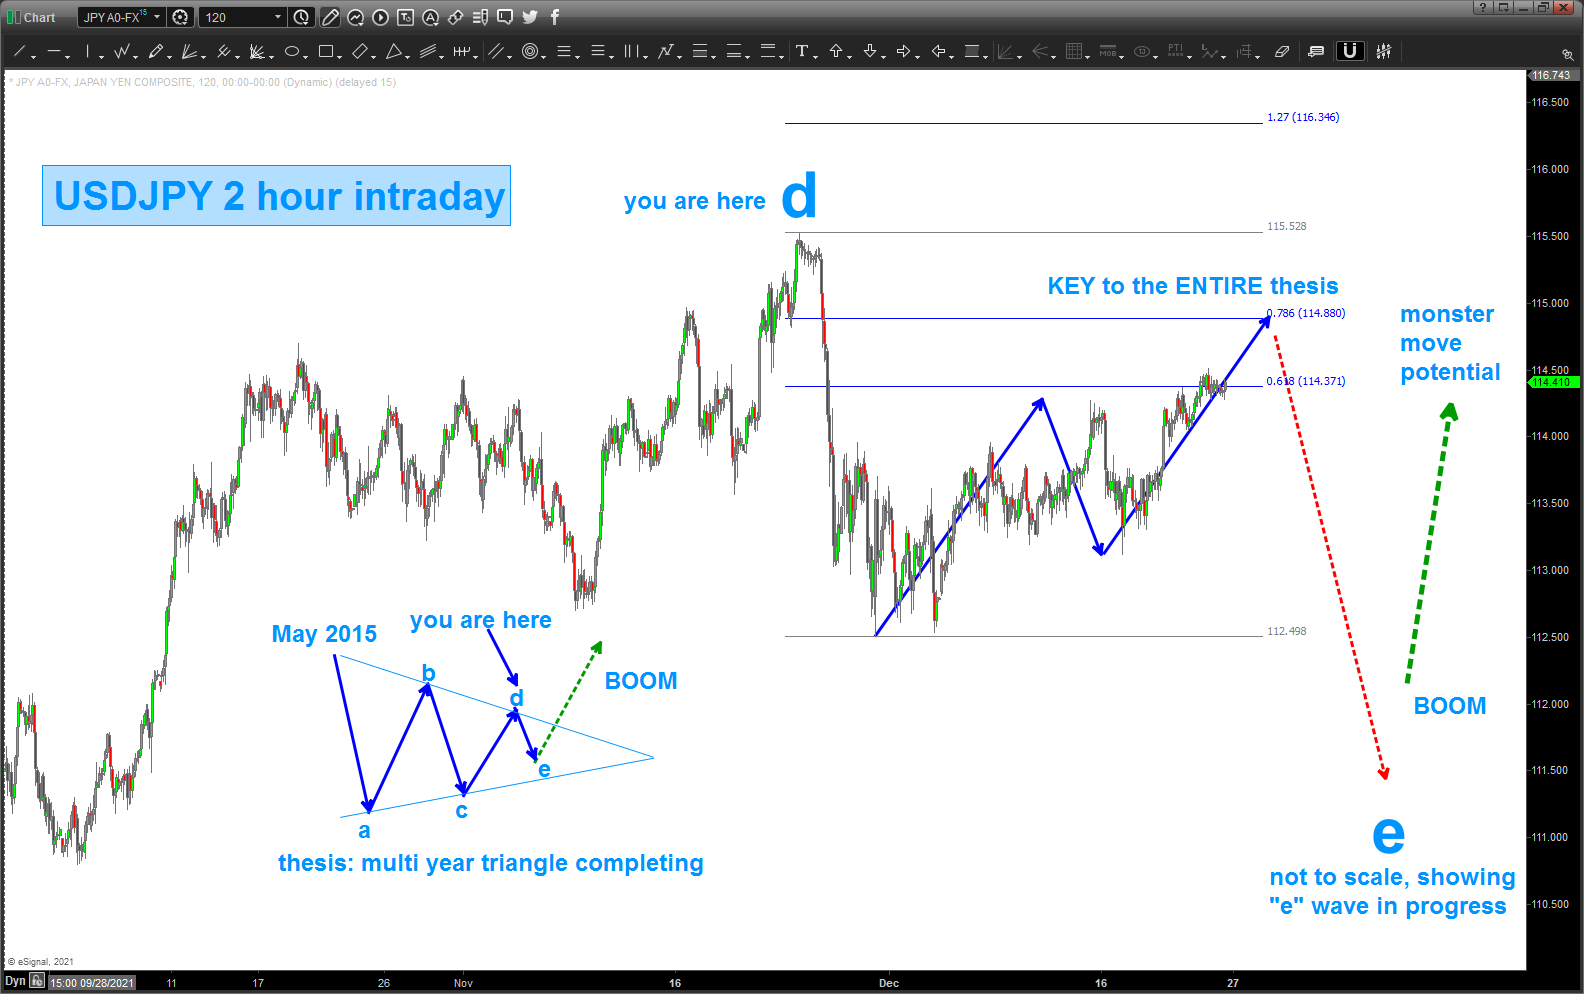
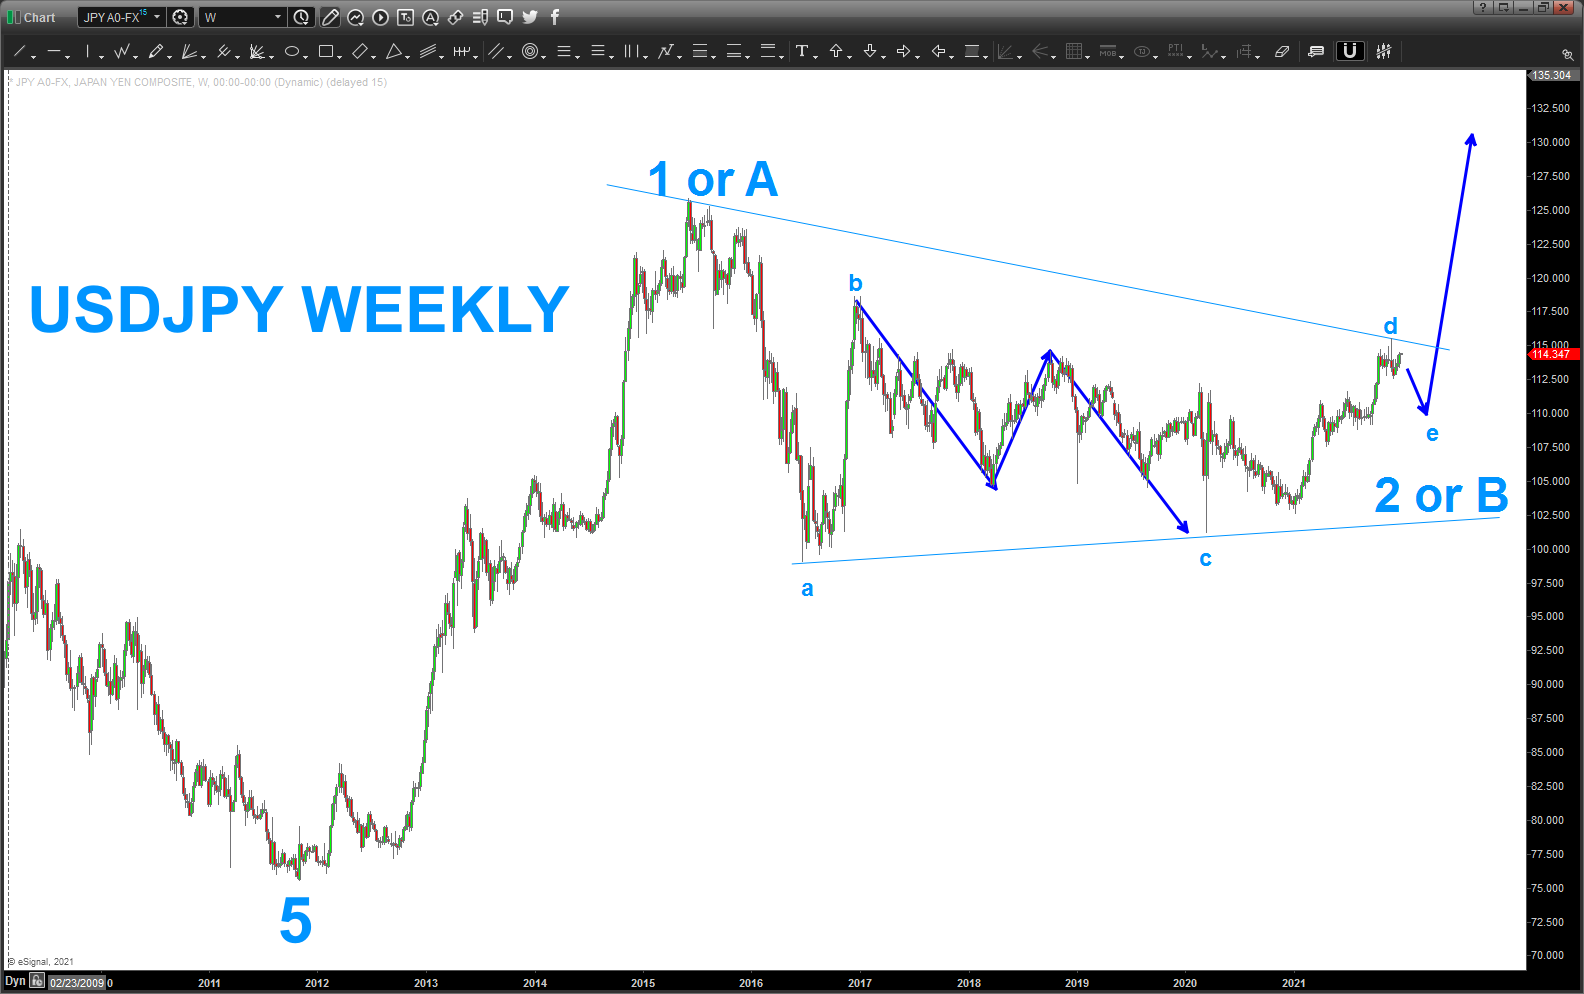
last post on USDJPY: https://atomic-temporary-44460632.wpcomstaging.com/2021/10/11/usd-vs-yen-very-key-level-now/
this is a ‘nice’ Gartley SELL pattern and, to be honest here, would sure like it to “work” as I want (hope (a strategy)) for a move lower down into 110’s to complete 6+ year triangle … as we have discussed, triangles have 5 legs a-b-c-d-e and, right now, my hope ( a strategy) is that we are carving out the “e” wave and then .. game on for an explosive move w/ the USD versus the YEN.
if we blow thru “d” will have to get out the eraser and take a peak …
either way, believe 2022 will see the USD EXPLODE HIGHER against the YEN.
close 2021 w/ light, energy and smiles …
NFLX update
Posted on December 21, 2021 1 Comment
last post on NFLX: https://atomic-temporary-44460632.wpcomstaging.com/2021/12/13/nflx-3/
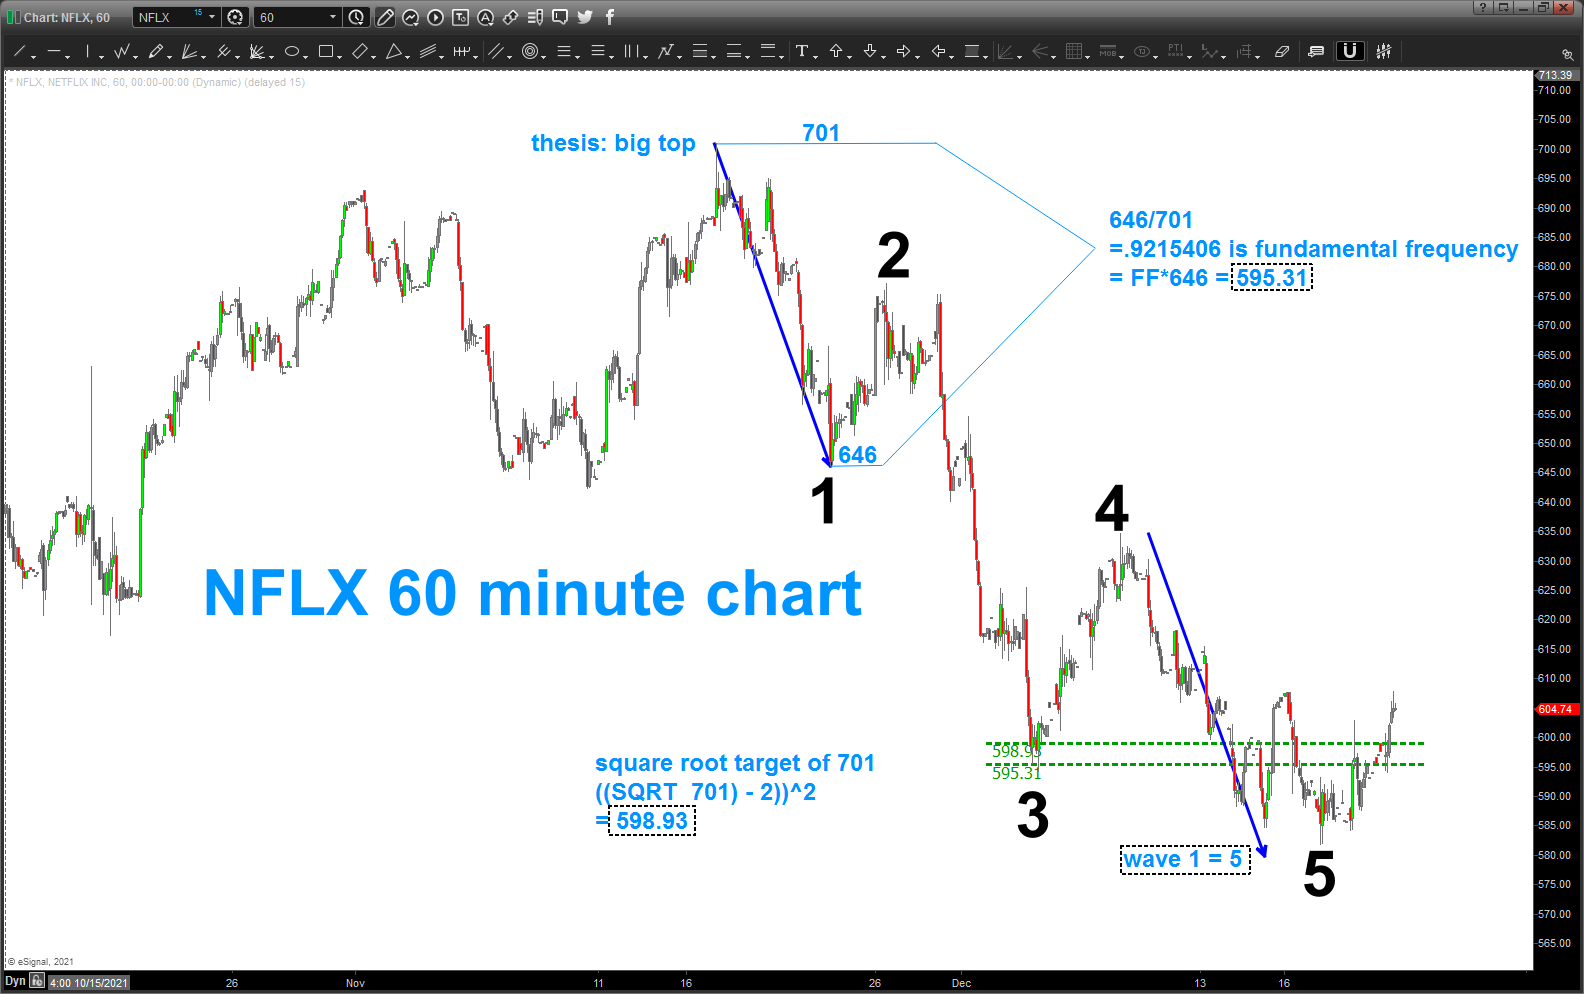
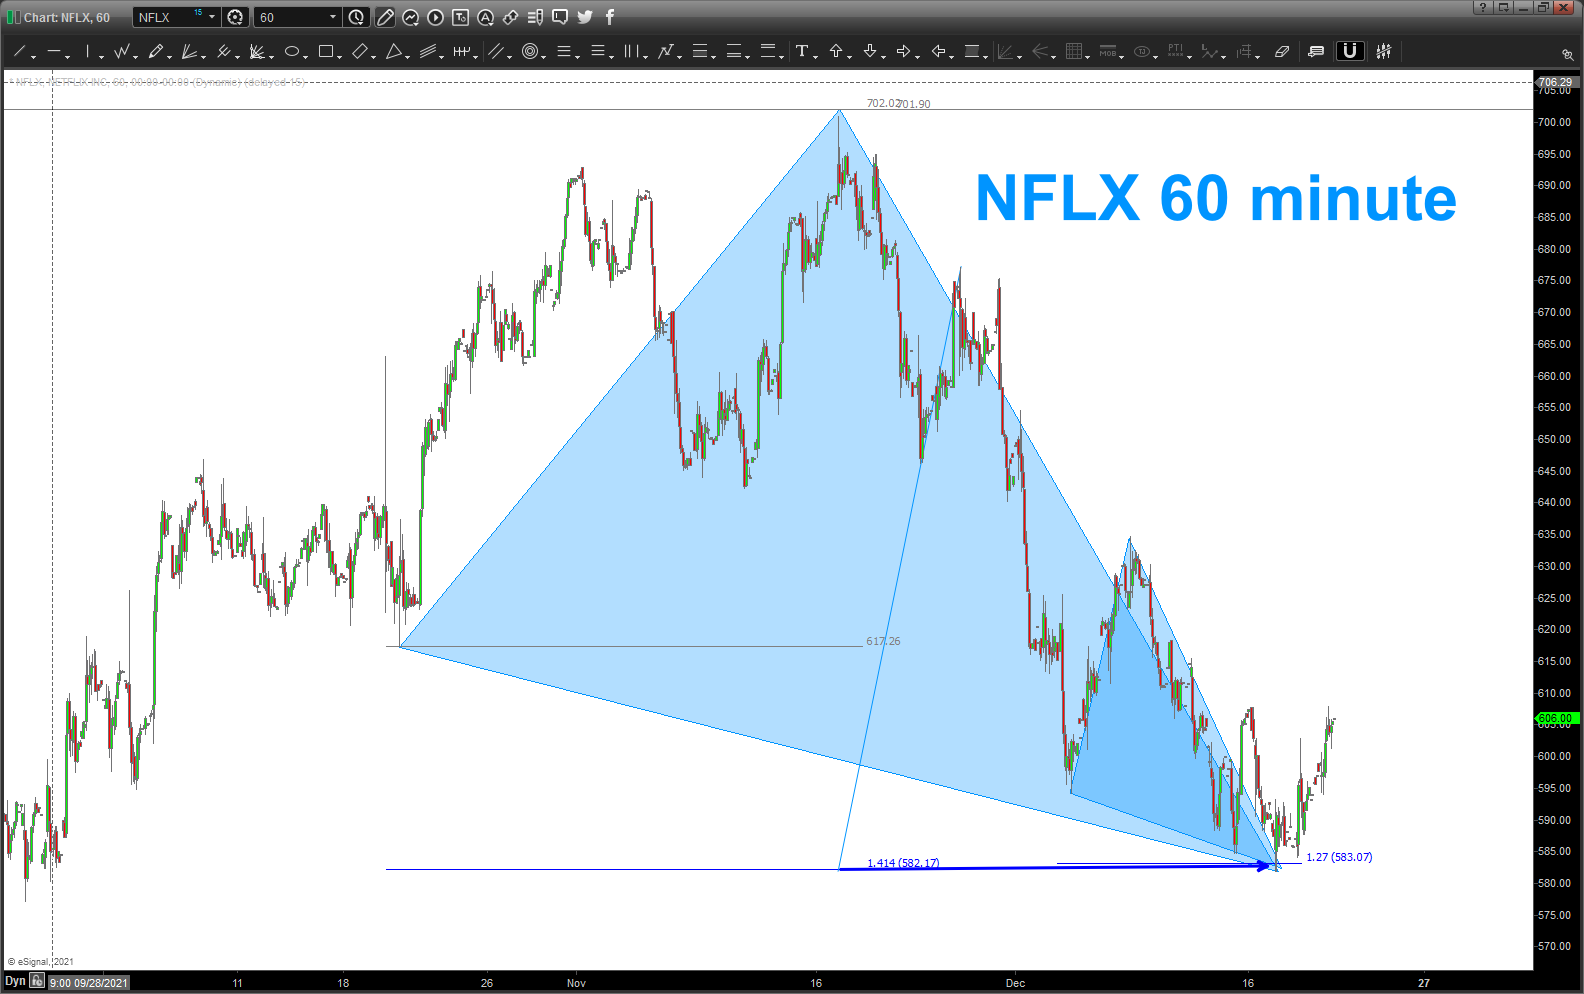
in that post we did some “basic” work using EWT going w/ Wave 1 = Wave 5 and some “basic” retracement work. as you can see below there was a LOT of math and geometry coming into this level … fundamental frequencies, square root targets, geometry, extensions, etc. all made this an “interesting” area for sure.
where are we NFLX?
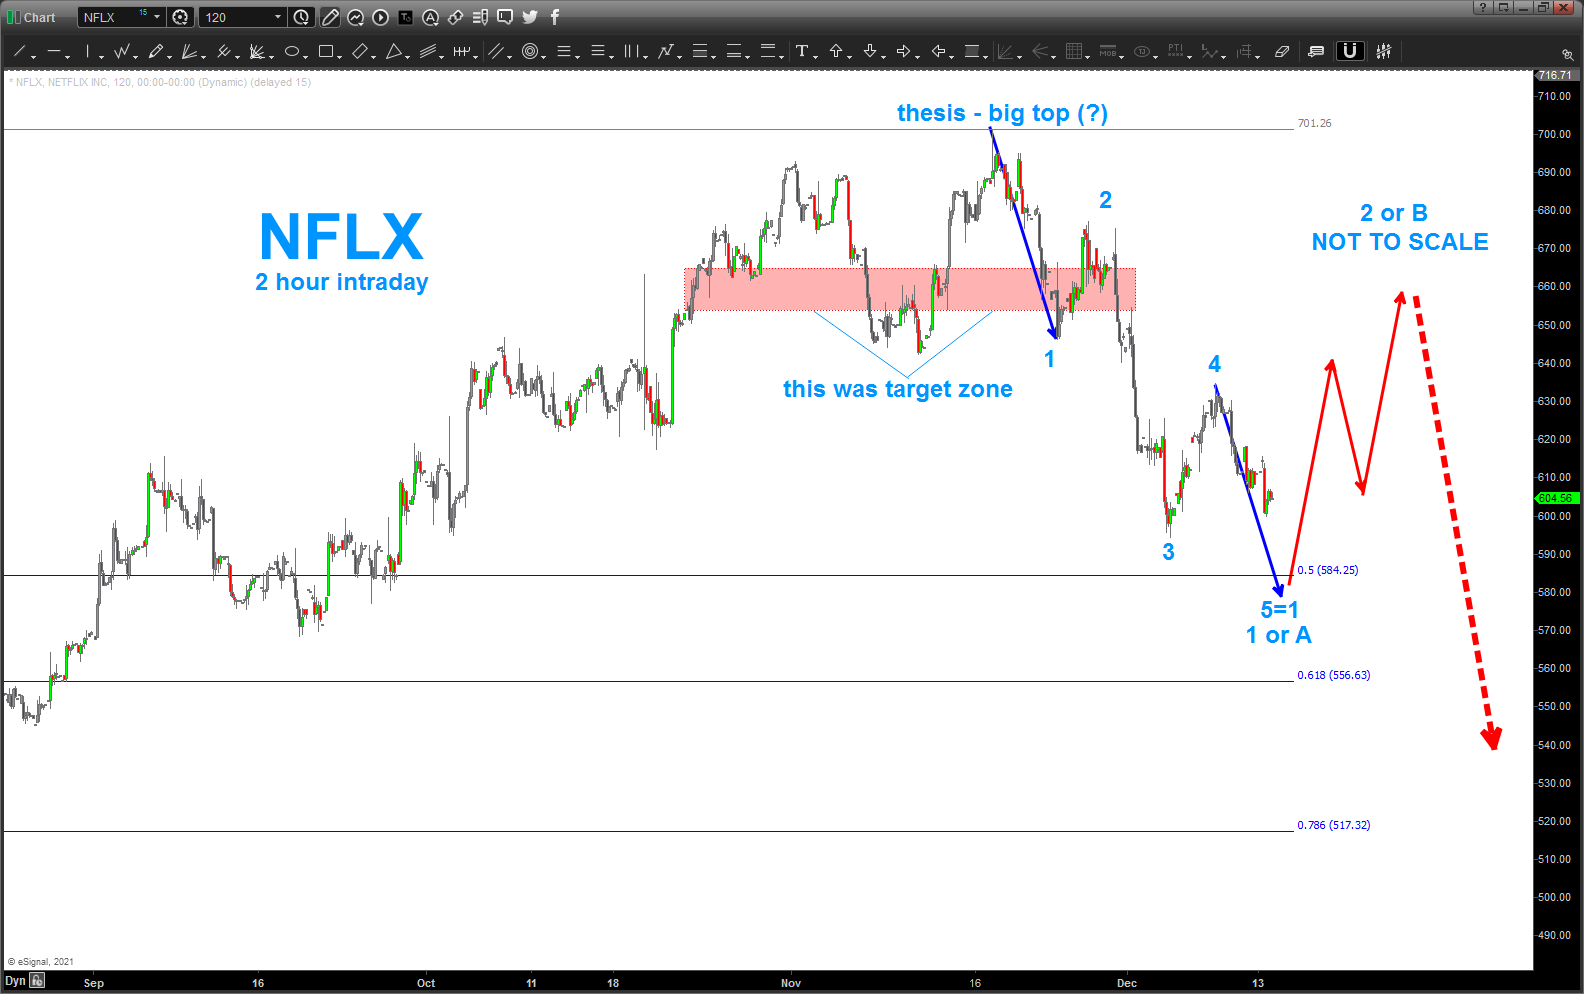
if you go back to a couple posts of NFLX you will see that I called it a “chart of the year” because of the very “ray charles” like count of 1,2,3,4,5. we blew thru the target zone by 3-4% probably because my ego got the better of me in coming up w/ that title (digression complete) but either way, we completed 5 waves up into 700 … and we just completed 5 waves down.
what is so important about that?
5 waves either complete a corrective C wave (they are ALWAYS 5 waves) and now we bounce OR they could show a change in trend. certainly believe it’s way too early to be calling for a change in trend for NFLX but our thesis, for now, is the 700 level was a potential big top. so, w/ 5 waves down we need to pay attention.
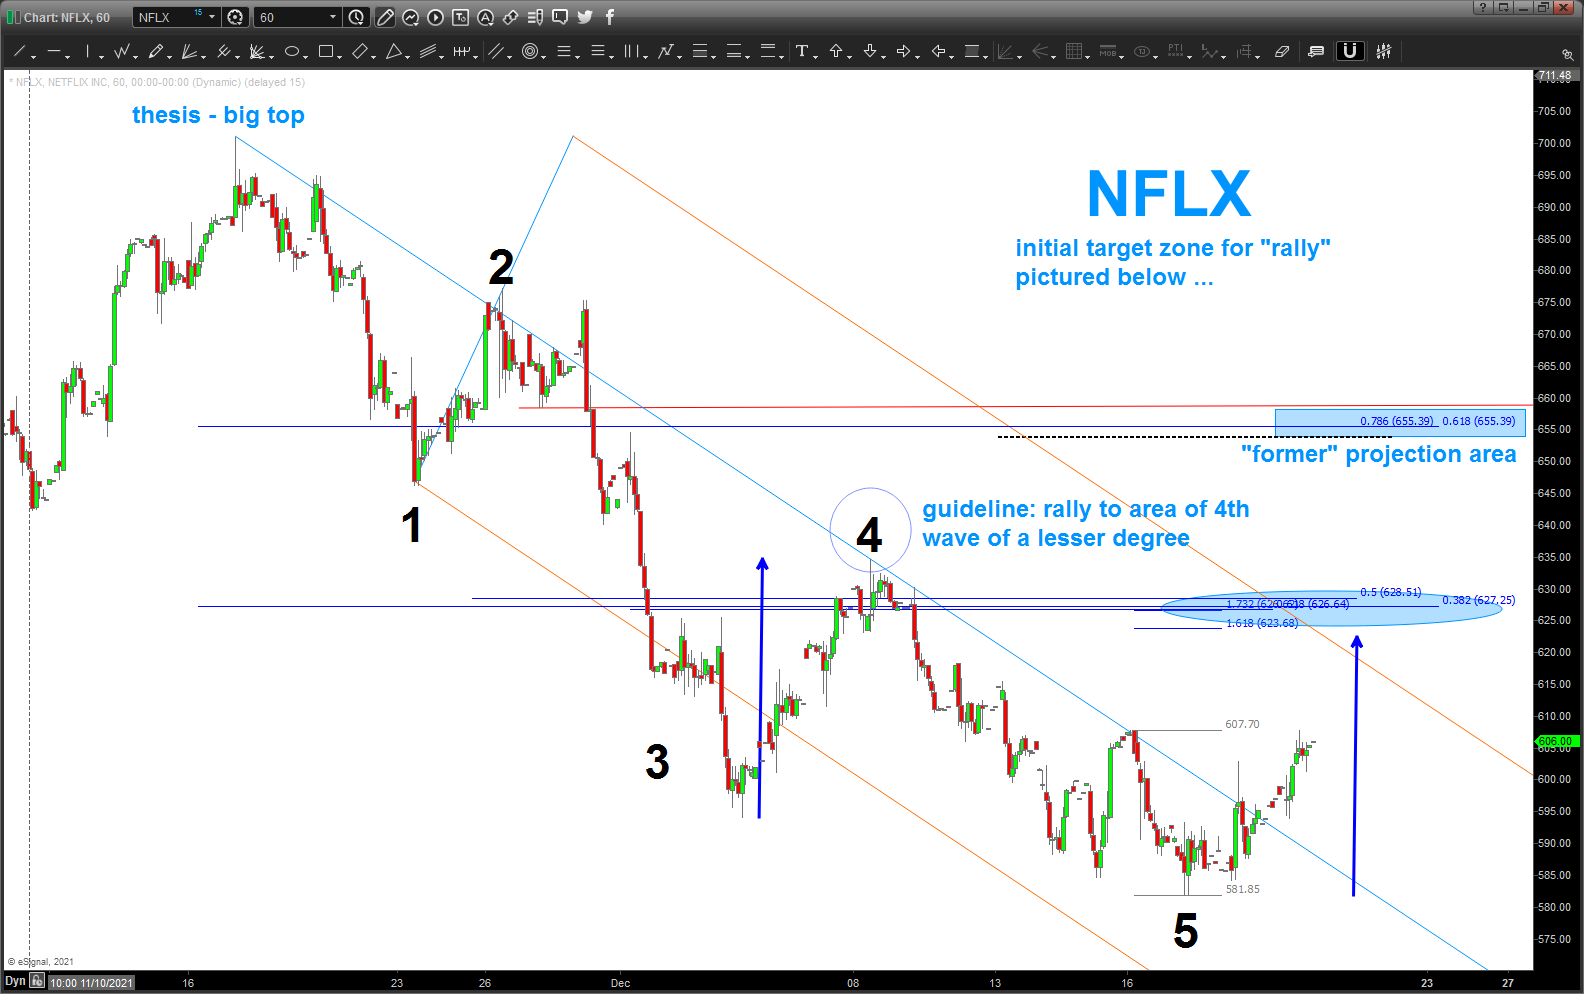
anyway, our targeted zone held as support (note there are at least 9 different methods showing this to be a good zone of support) and it appears our rally is on … from an Elliott perspective, a guideline (NOT a rule) is that a counter rally will go to the vicinity of the previous 4th wave of a lesser degree and we can see a LOT of math coming together in that zone/area. I do believe that area will work as resistance but I “expect” that the higher target will ultimately be the rally point as this entire NFLX bull run has had a lot of momentum …
so, for now, let’s see how this PATTERN plays out and watch the 625-630 area and also 650-660 for now …
also, note below, that Palladium also hit the target zone and found support …
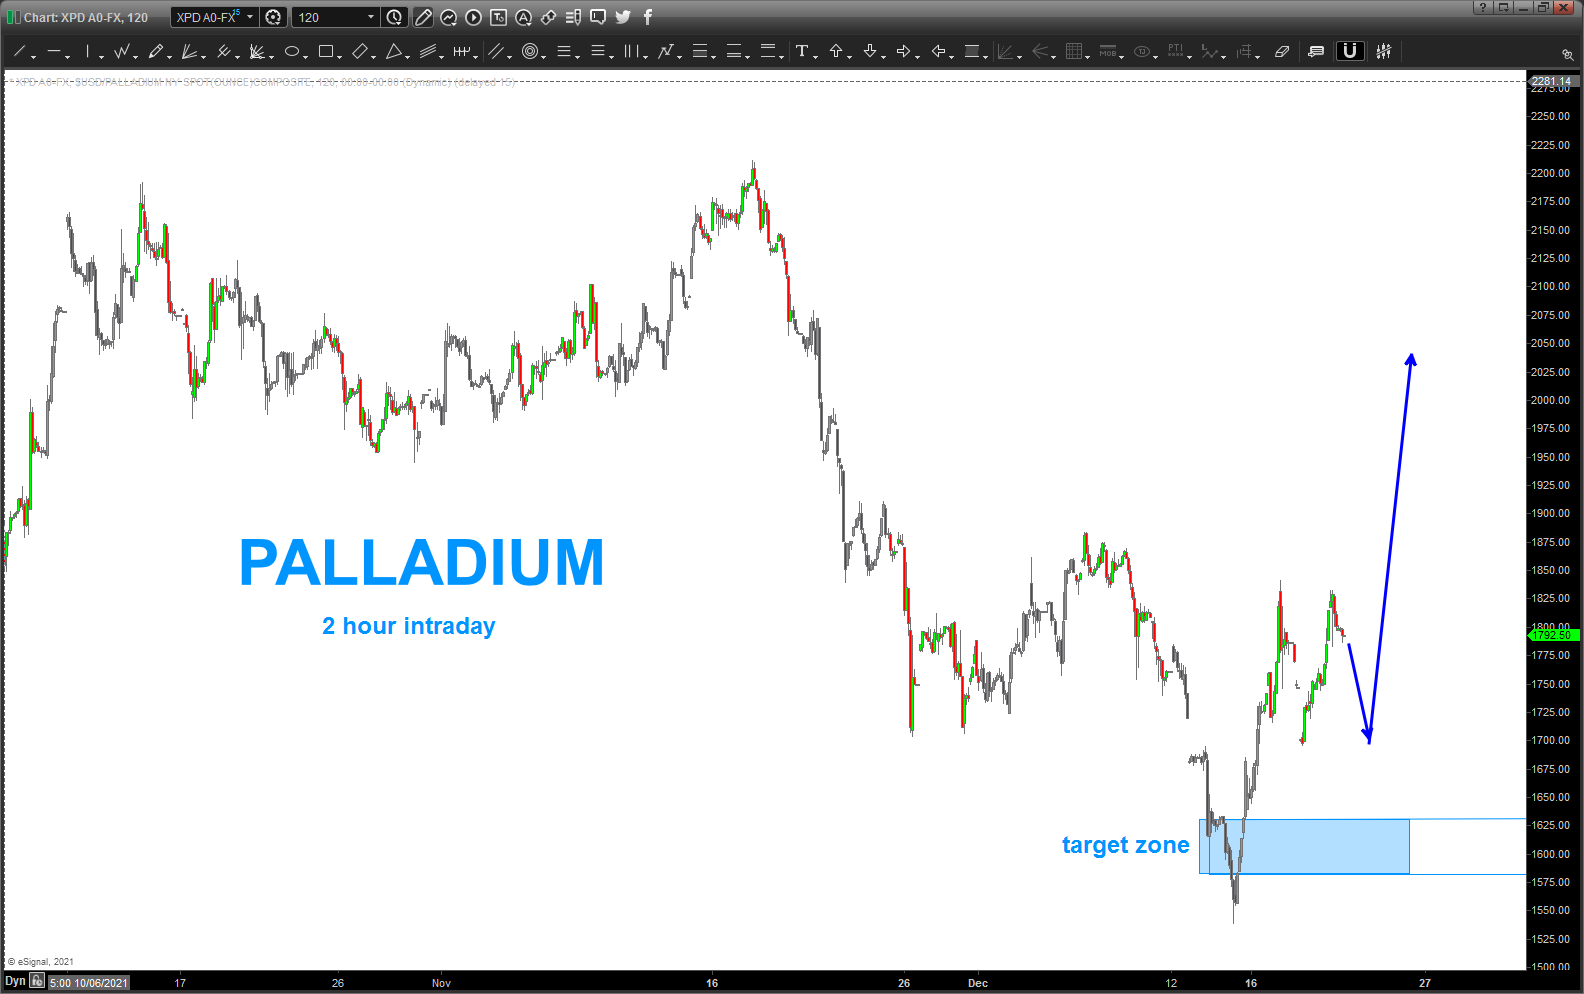
Palladium rallies .. so does tech … so watch a potential really in Palladium also …!
bottom line – this rally “makes sense” and the math worked … so now, we WAIT and look to put a short on NFLX in the coming days or weeks.
thanks for reading and rock on, ok?
also, got a 4/3 wetsuit today … it’s just got plain cold in the Pacific and with a long period swell and a favorable tide, I could stay out there ALL DAY but cold got the better of me …
get some!

WMT – sitting on a cliff of support
Posted on December 16, 2021 Leave a Comment
last post on WMT: https://atomic-temporary-44460632.wpcomstaging.com/2019/06/16/walmart-wmt/
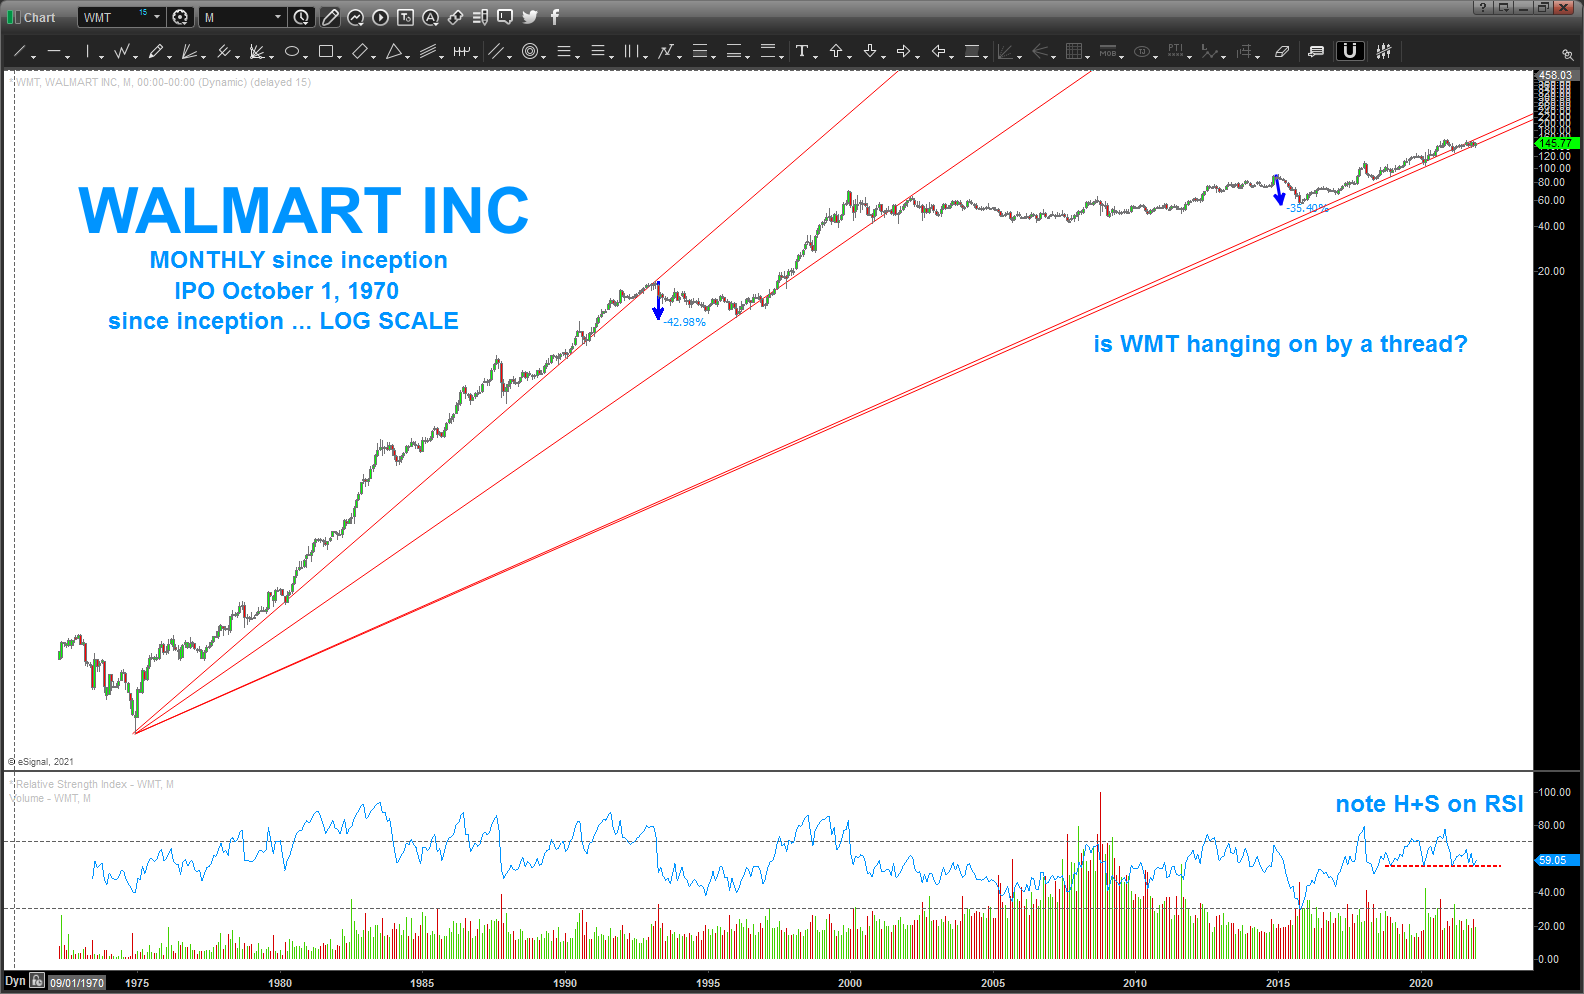
the butterfly sell that we ID’d above worked for a bit but ultimately failed …so, I’ve taken a long term picture of WMT using the LOG scale and the LOG Trend lines …
as long as we stay above the red trend lines the beat goes on … that being said, this is a pretty big trendline support so watch carefully.
UNG update
Posted on December 15, 2021 Leave a Comment
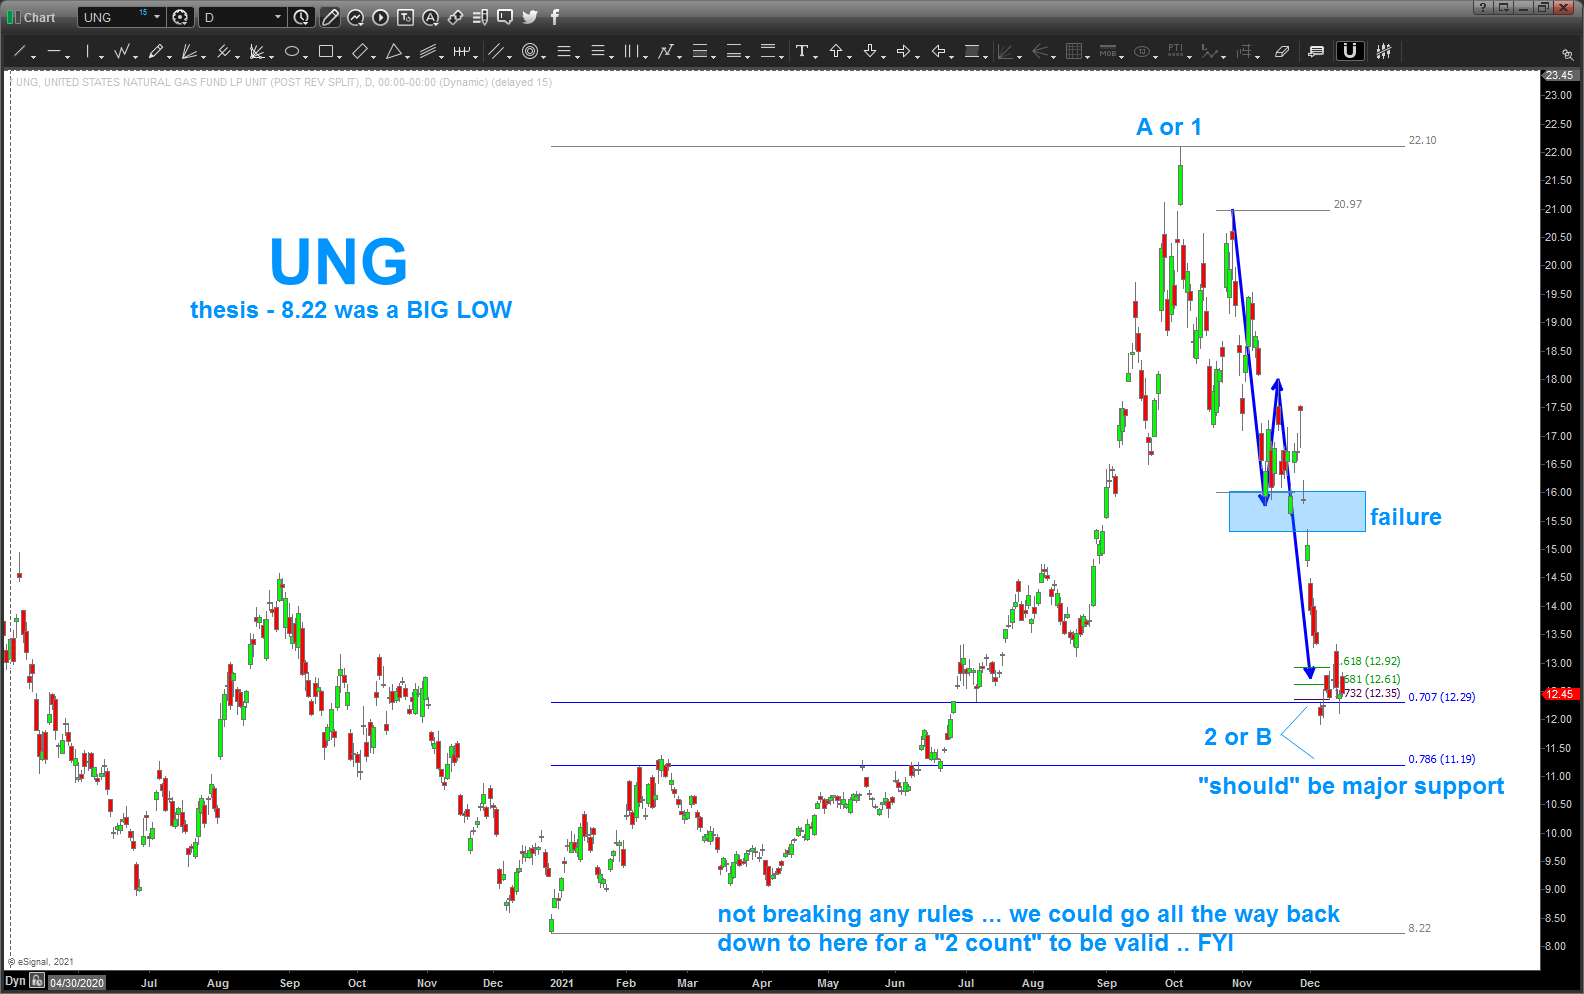
well, if your along for this ride you might start questioning the long thesis – I’m not there, yet, due to my entry down in/around the low 9’s … but, certainly looks heavy.
for now, we stand w/ our thesis that the low 89’s was a major low and this is a retracement in a wave 2 or B-wave w/ a rally to come.
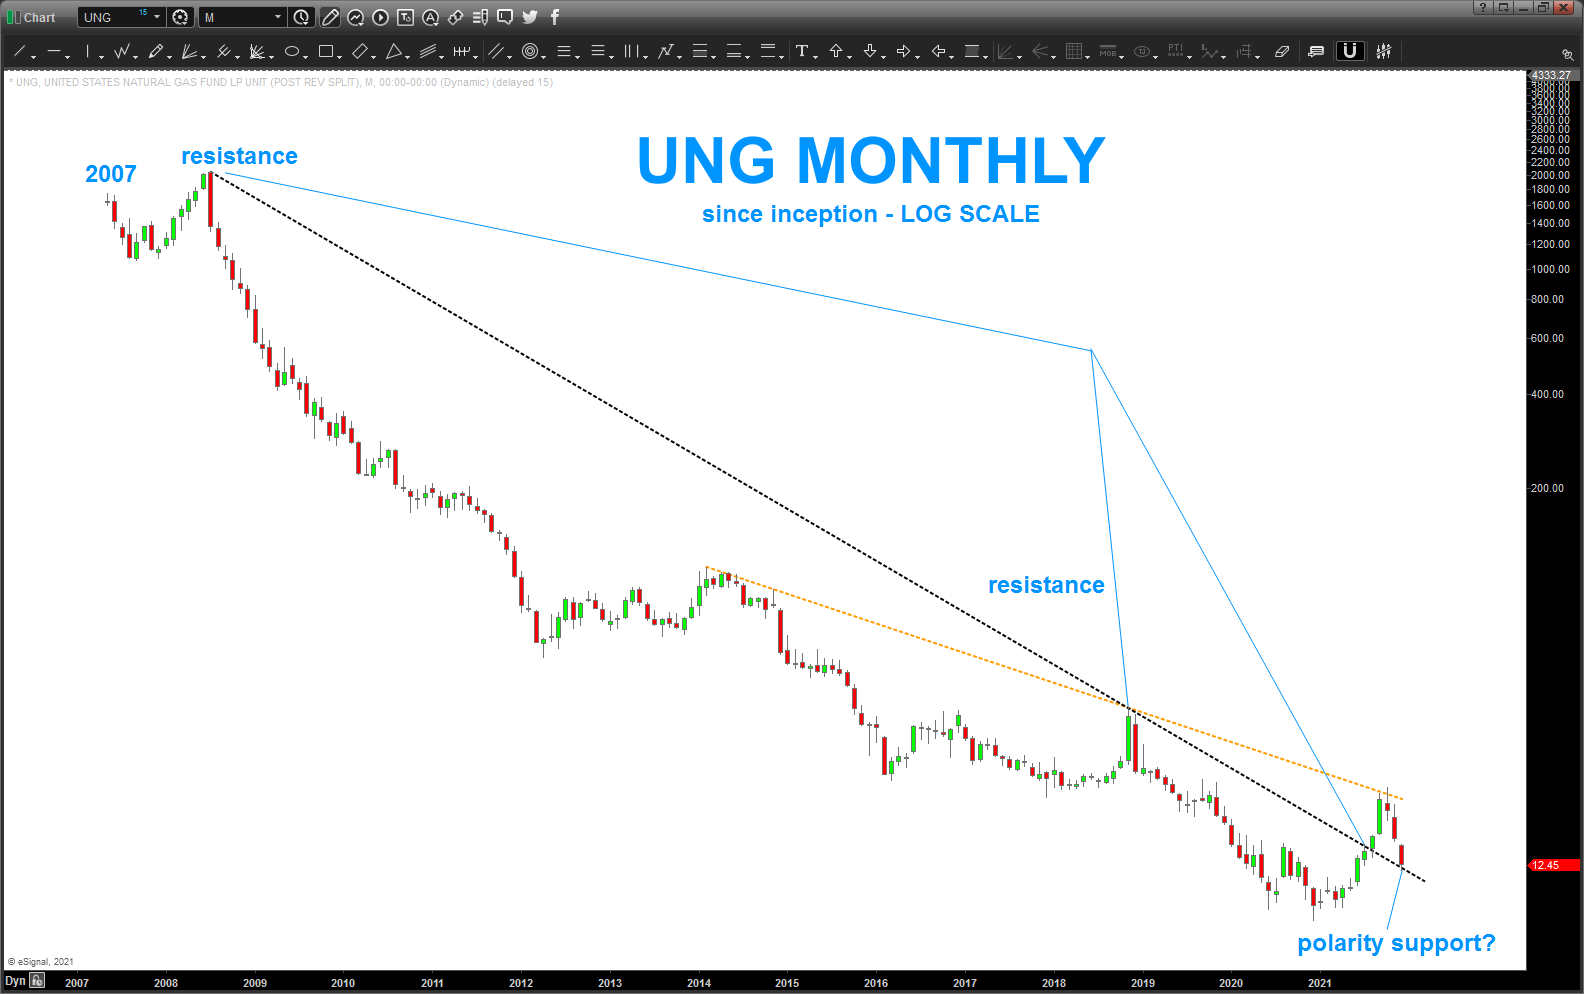
I do like the support found from the polarity log trend line …
staying long …
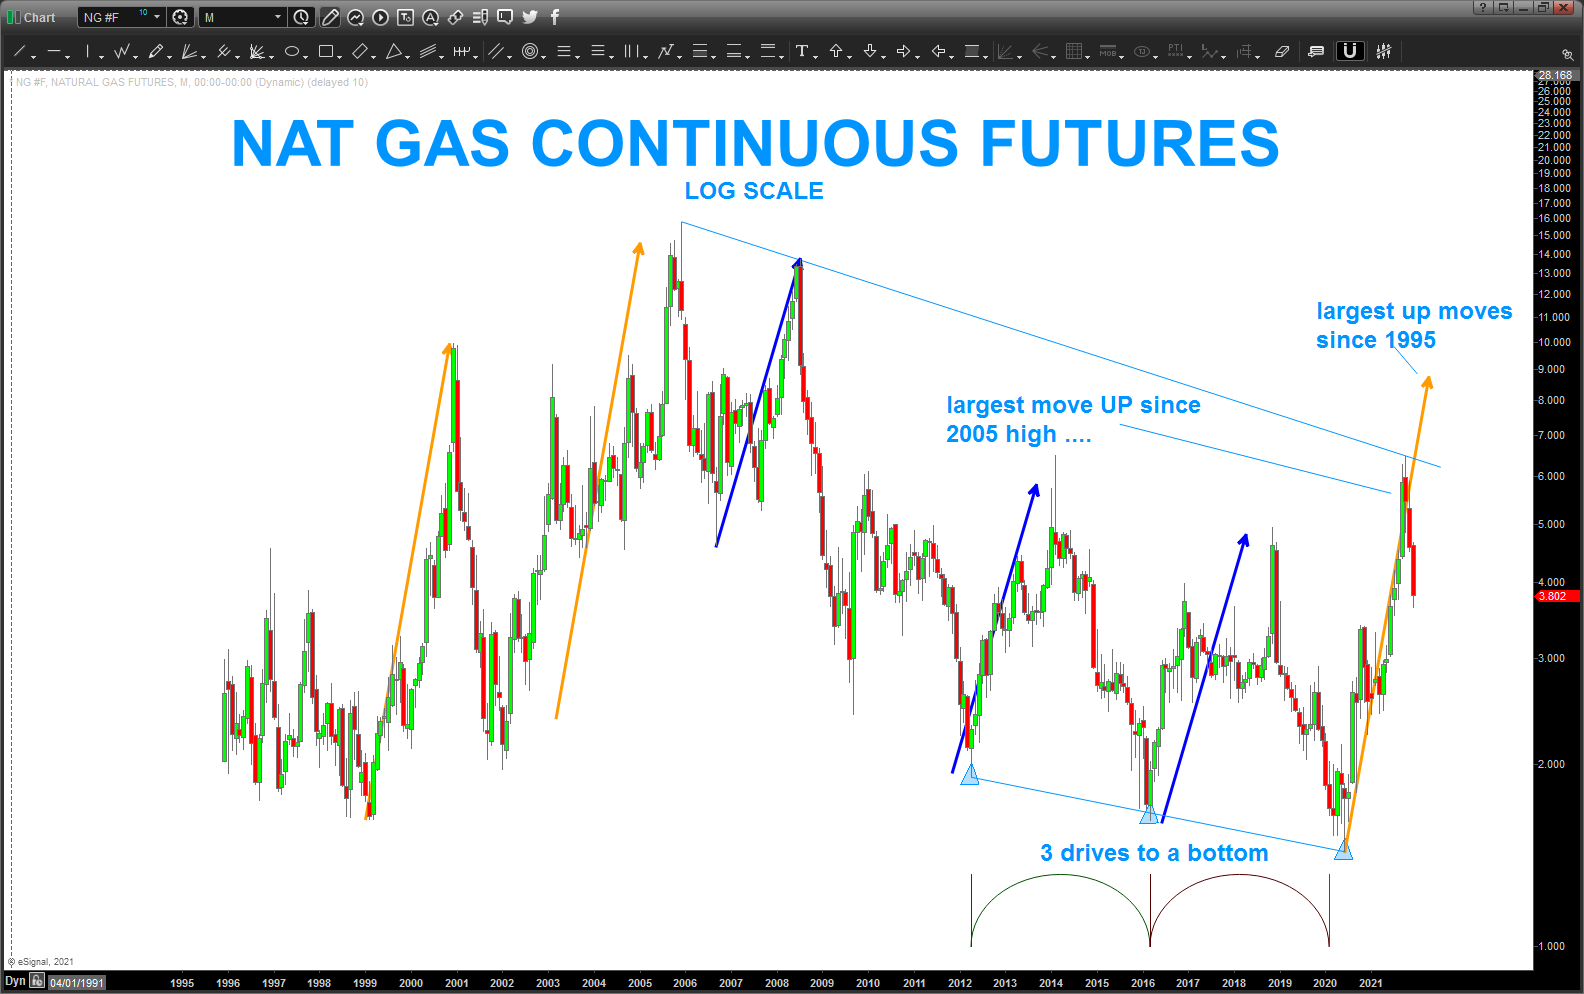
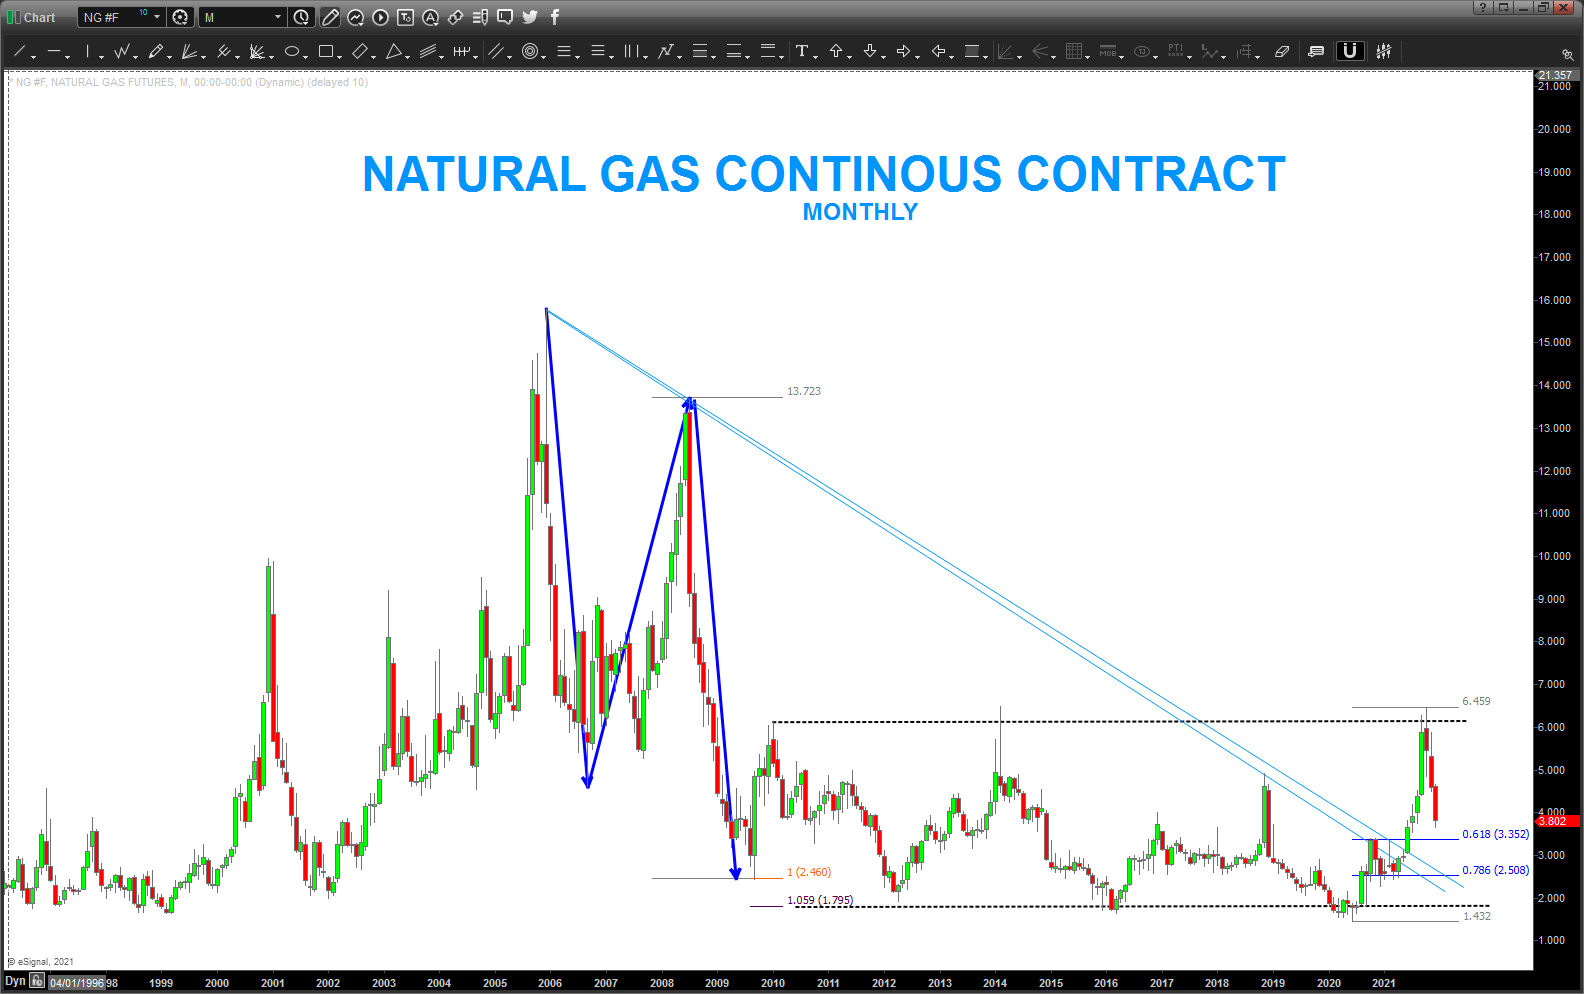
here’s a look at the NAT GAS continuous futures contract … note, we’ve completed the “largest” move up since 2005 (blue lines) … reasonable to expect a move up like the orange ones from the past?
TSLA – pattern complete so off to new highs?
Posted on December 15, 2021 Leave a Comment
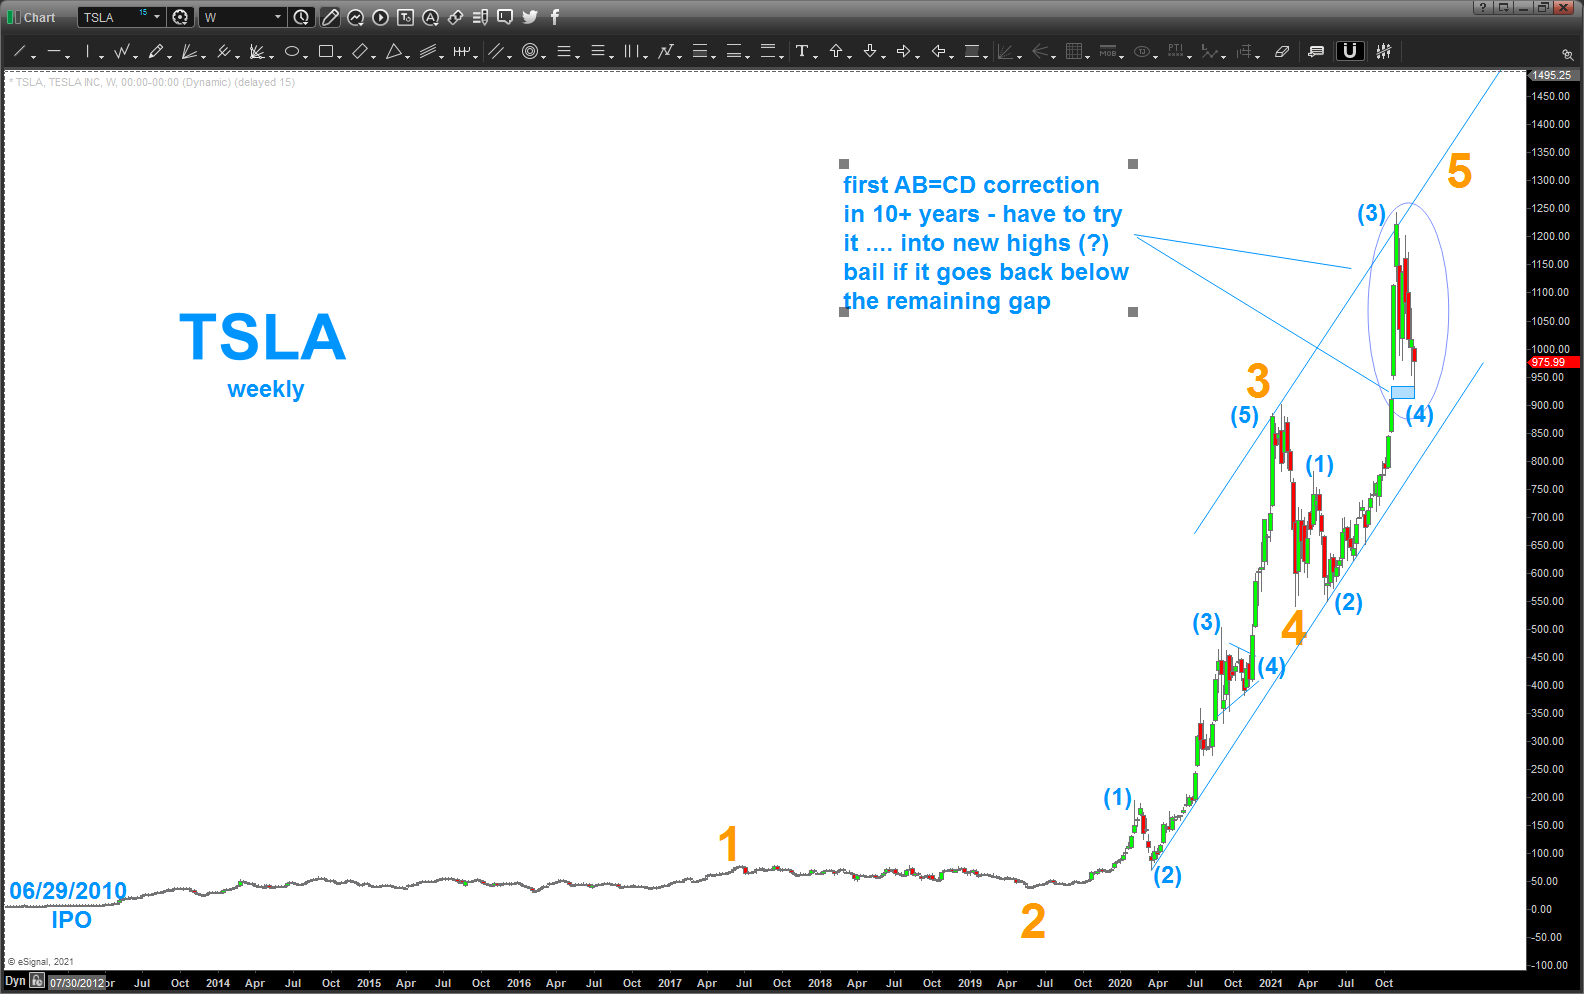
last post on TSLA: https://atomic-temporary-44460632.wpcomstaging.com/2021/03/26/tsla-charging-station-please/
in the last post, looks like the “percentage” or “log AB=CD” worked well and led to a 40% ish decline … that was wave 3 (orange)
today, we completed the first AB=CD in the entire run … we have a little gap left open but net-net this was a very nice BUY pattern and looking at the count, certainly can make the case that we are going to start a run to new all time highs for TSLA .. then, well, 5 waves complete. will try to update targets in the coming days/ weeks but lets watch price action for now in/around this pattern level.
Bart
NFLX
Posted on December 13, 2021 1 Comment
post on NFLX: https://atomic-temporary-44460632.wpcomstaging.com/2021/10/19/chart-of-the-year/
the target zone ID’d in the post above missed the target by 5% but has been selling off the past few weeks …
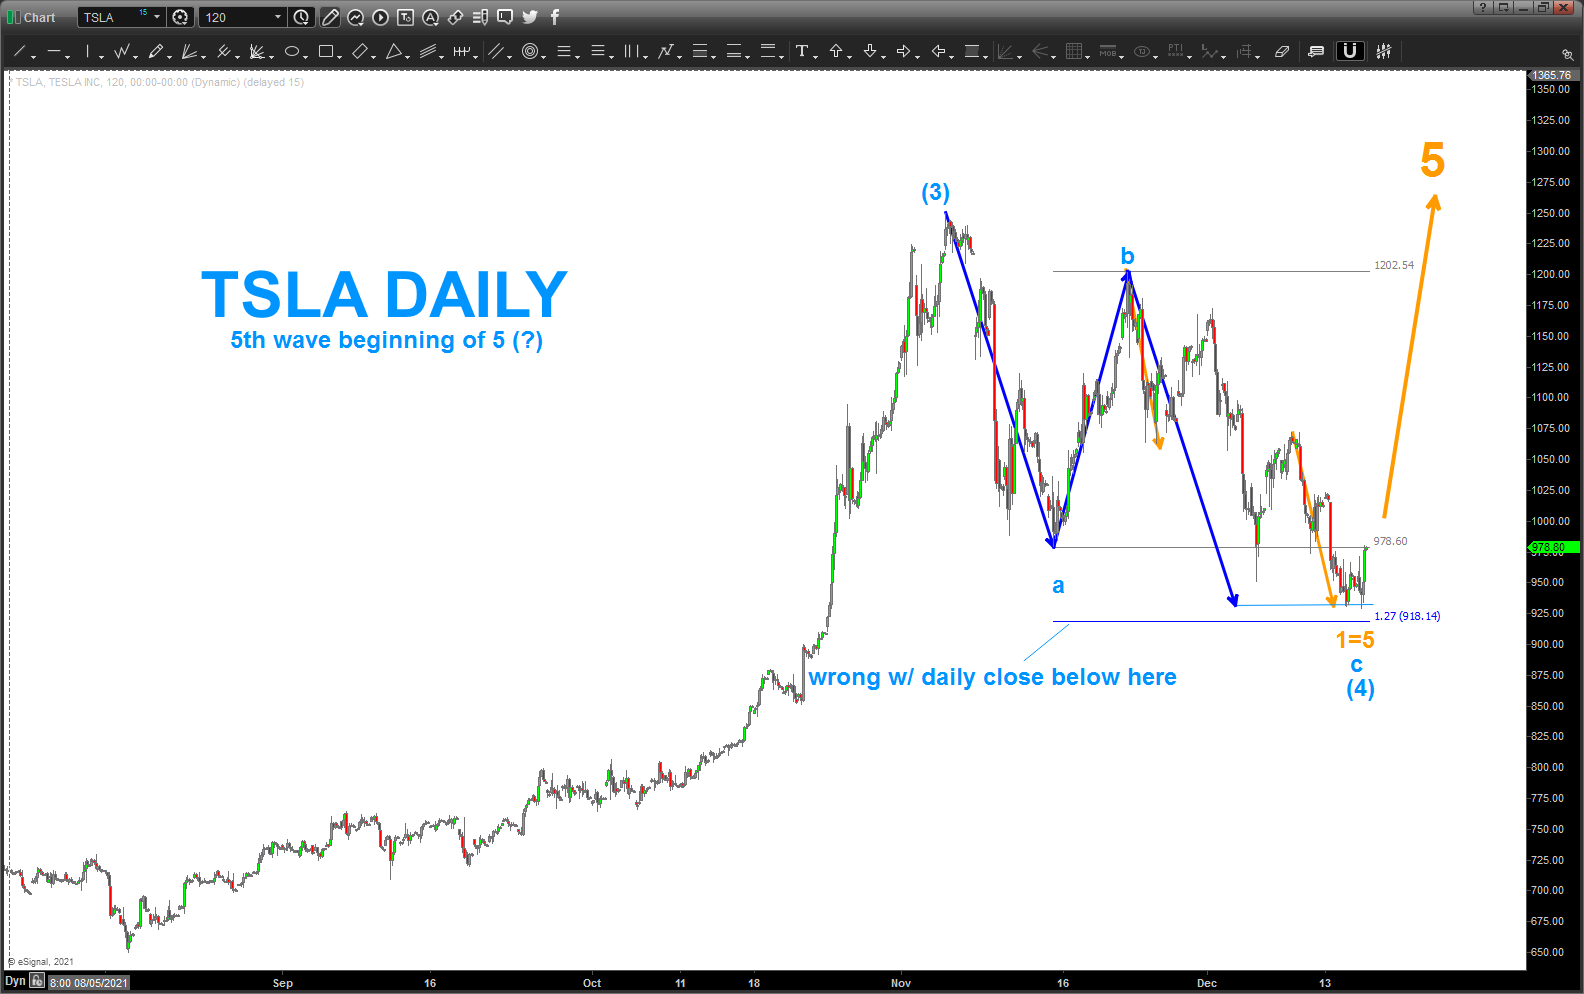
a VERY clear 5 wave count is present so I’ve done my best as providing some “guidelines” to formulate a gameplan.
the “thesis” is that we have completed 5 waves up on NFLX and are correcting based on that move …
a lot of times, not always, 5=1 and that comes in around 580 .. .we would like to see that hold and bounce up in 3 waves to prepare for a short … so, hold your powder dry and I expect, in a few weeks, it might be time to put your toe in …
Ratio showing us something …or not?
Posted on December 13, 2021 Leave a Comment
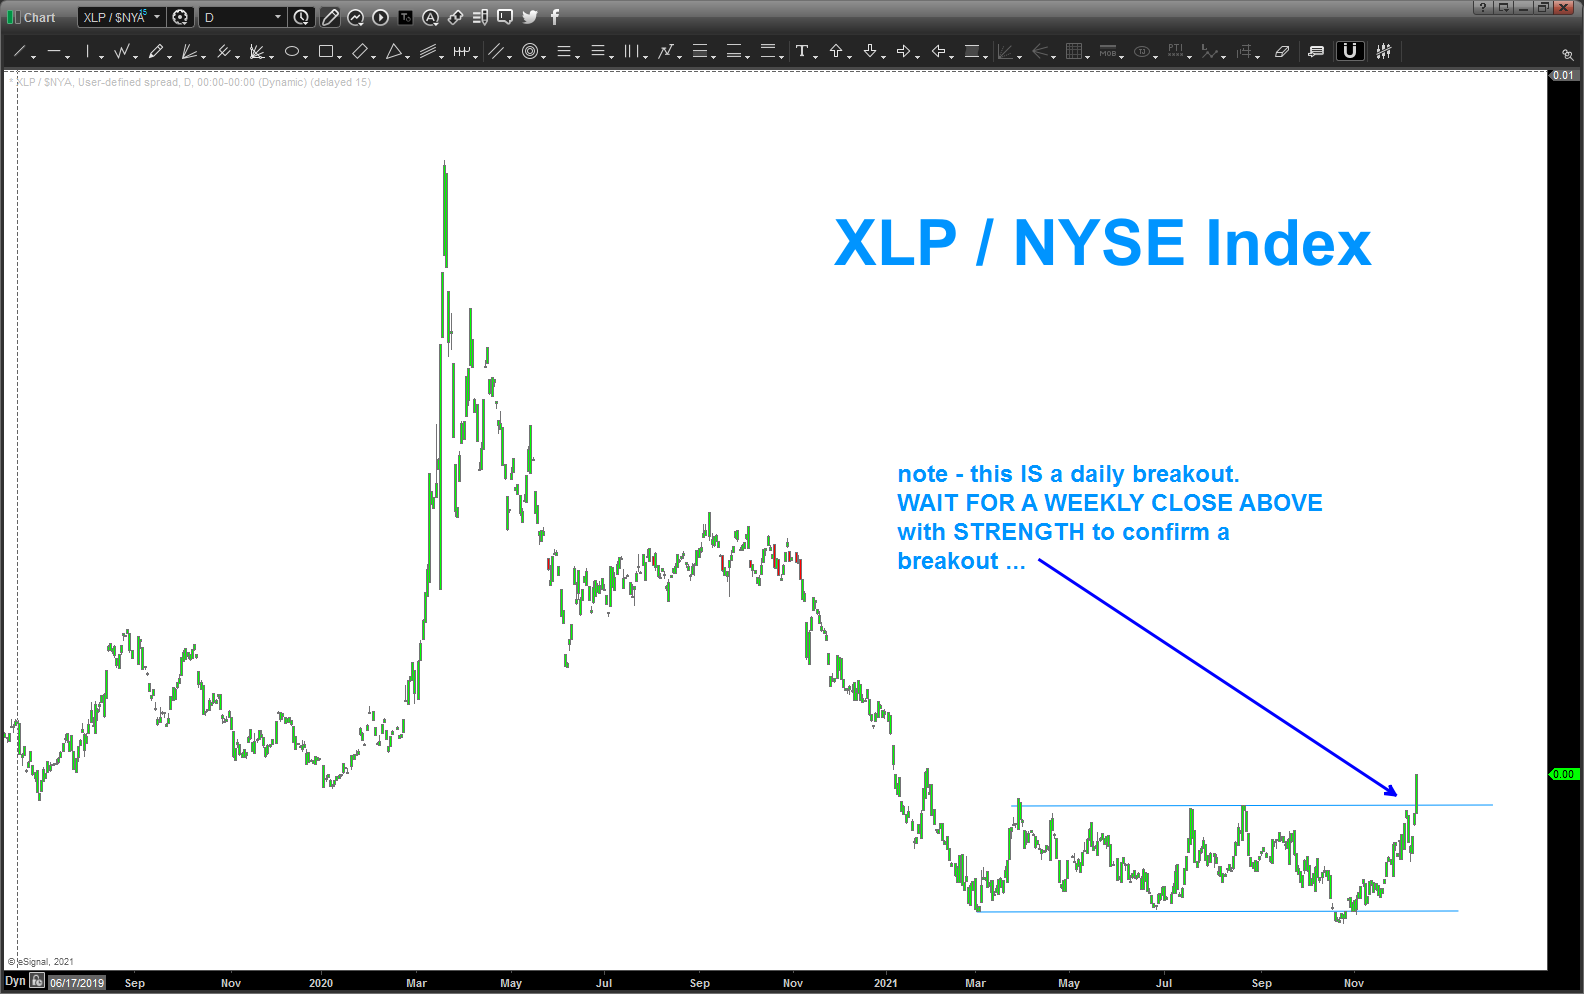
well, we have a DAILY breakout above the channel that has been defining the ratio for pretty much all of 2021. is this a valid breakout or a gotcha? I’ll make an educated guess once we close this week out … looking for a WEEKLY close above the top of the channel w/ strength.
will be interesting to see what happens w/ the Palladium level ID’d on the post before this one … we are getting to a point where one of the PATTERNS will fail and that will give us a good idea of where we are …
fun times, hugh?