Banking Index – January 31, 2023
Posted on January 31, 2023 2 Comments
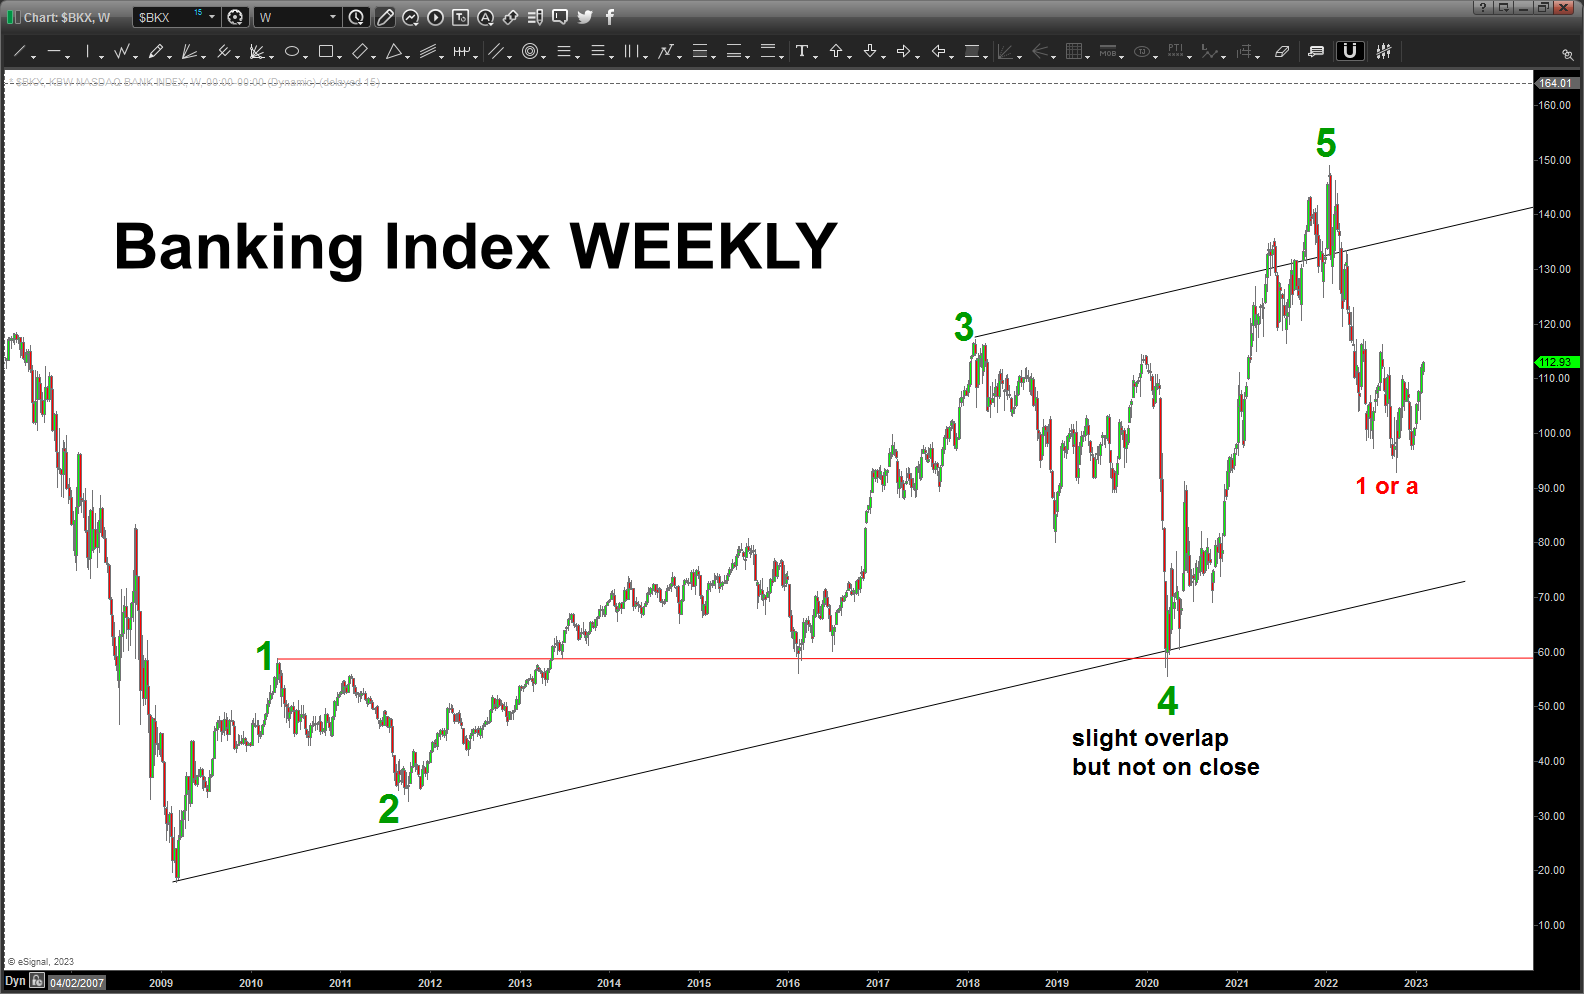
I’ve blogged this before and I’ll blog this again – banks lead us UP and they lead us DOWN.
Below you can see a “pretty clear” 5 wave count UP in the Banking Index from the 2009 lows. We do have a slight overlap of Wave 4 and Wave 1 but I’m going to go for it as it’s not on “close” and the count fits/works.
What we have here is an “almost” perfect GARTLEY SELL PATTERN on the banks.
I saw @RyanDetrik tweet about the January effect today and I do trust and admirer his work … probability is saying that we have a STRONG year this year. I’m not there, yet.
I’m 100% prepared to throw in the count for a “next move is bearish” and just hit ctrl-alt-del and erase and take a look at it with fresh eyes.
That being said .. .the DSI on Gold is SPIKED HIGH for the bulls, we have an amazing BUY pattern on the VIX, sell PATTERNS on the Banks and JNK bonds inbound and the Euro/Dollar are both finishing /finished up 5 moves. Pullback or a resumption of the move down. I don’t know but I think this move u since October is on borrowed time …
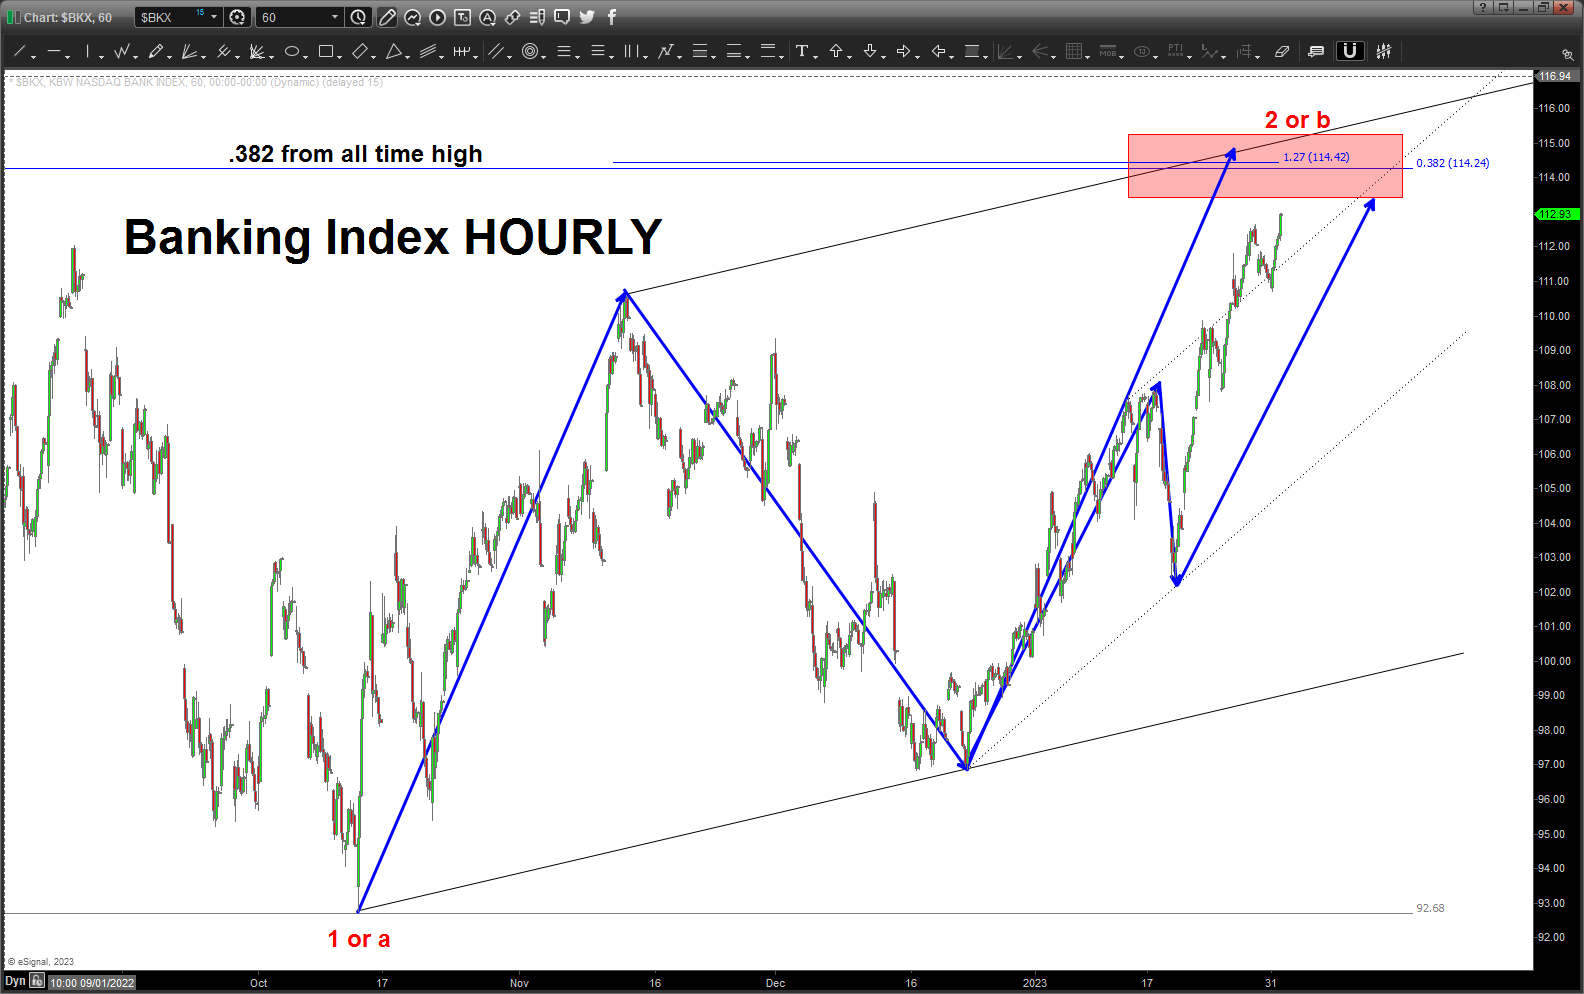
Note – where have the banks been. W/ all this bullish talk they haven’t even made a .382 retracement, yet. Hmmmmm …
WATCH THIS LEVEL ON THE BANKS TOMORROW. A daily close ABOVE 115 and this market could be off to the races. Only TIME will tell …
EURUSD – January 24, 2023
Posted on January 24, 2023 Leave a Comment
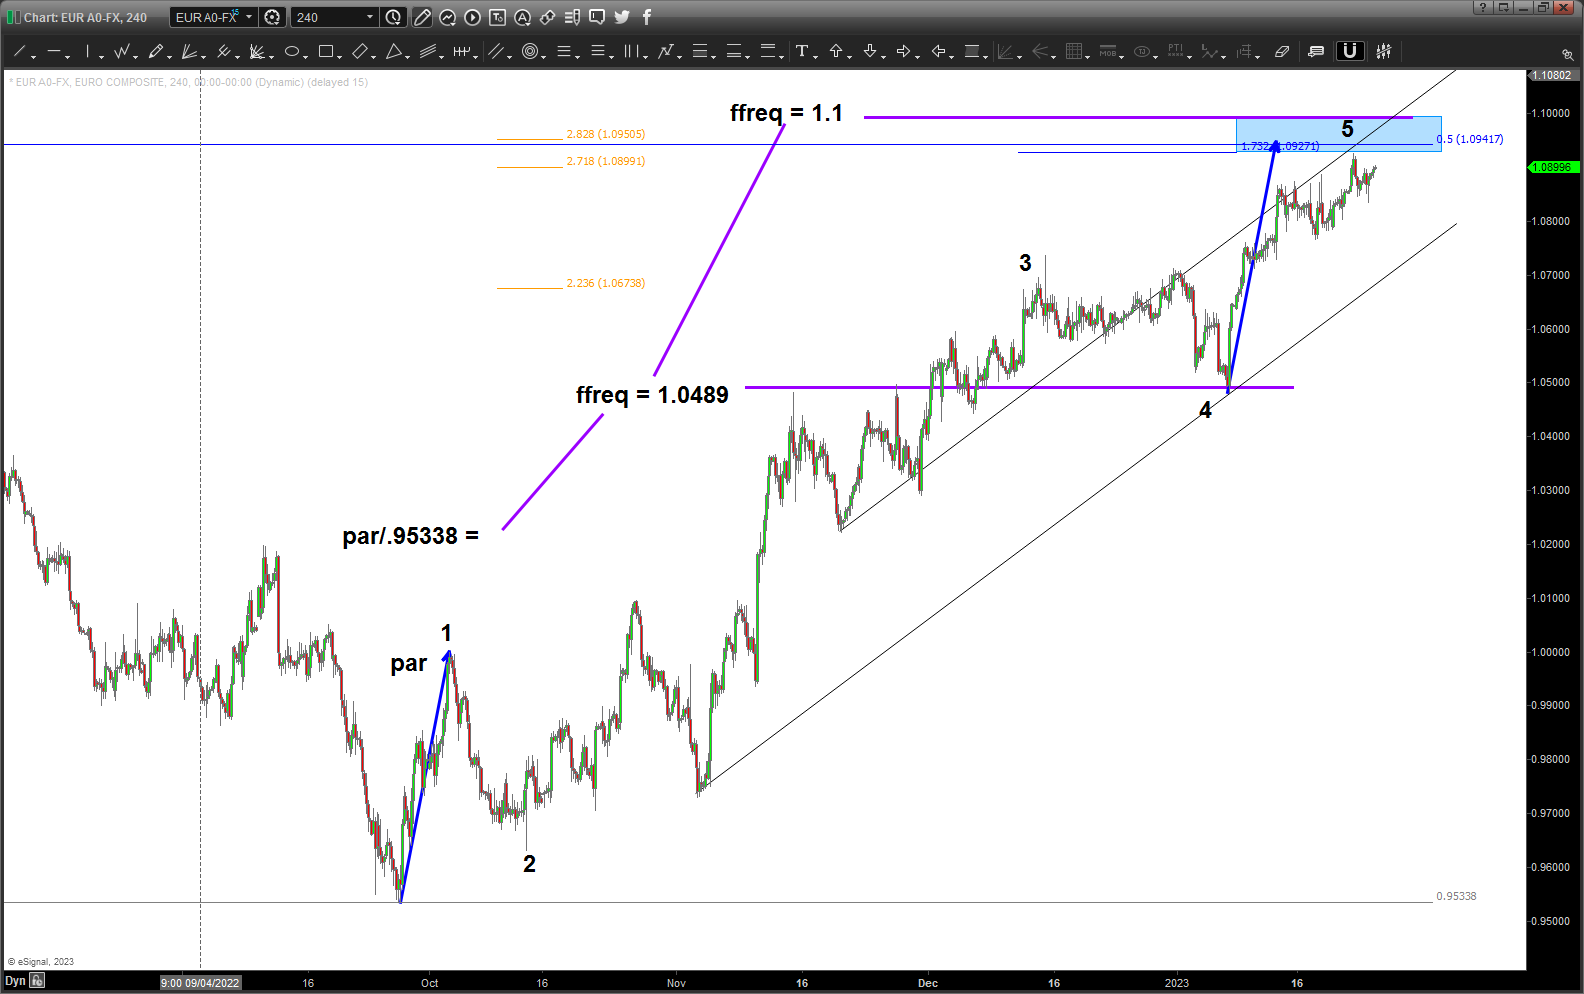
5 waves complete … wave 1 = wave 5 (blue arrows) .. initial impulse wave natural log and/or square root 8 projection … ffrequency target (good stop out if it blows thru) …1.732 extension from of wave 3- 4 (note, wave 3 = 2.236 (square root of 5) ….
all this being said, this is 5 waves UP folks so the coming pullback is one we want to BUY … for now, that’s around (previous wave 4 of a lesser degree) in/around 1.05. we’ll just have to wait and see …
Bart
Gold (spot) – January 23, 2023
Posted on January 23, 2023 1 Comment
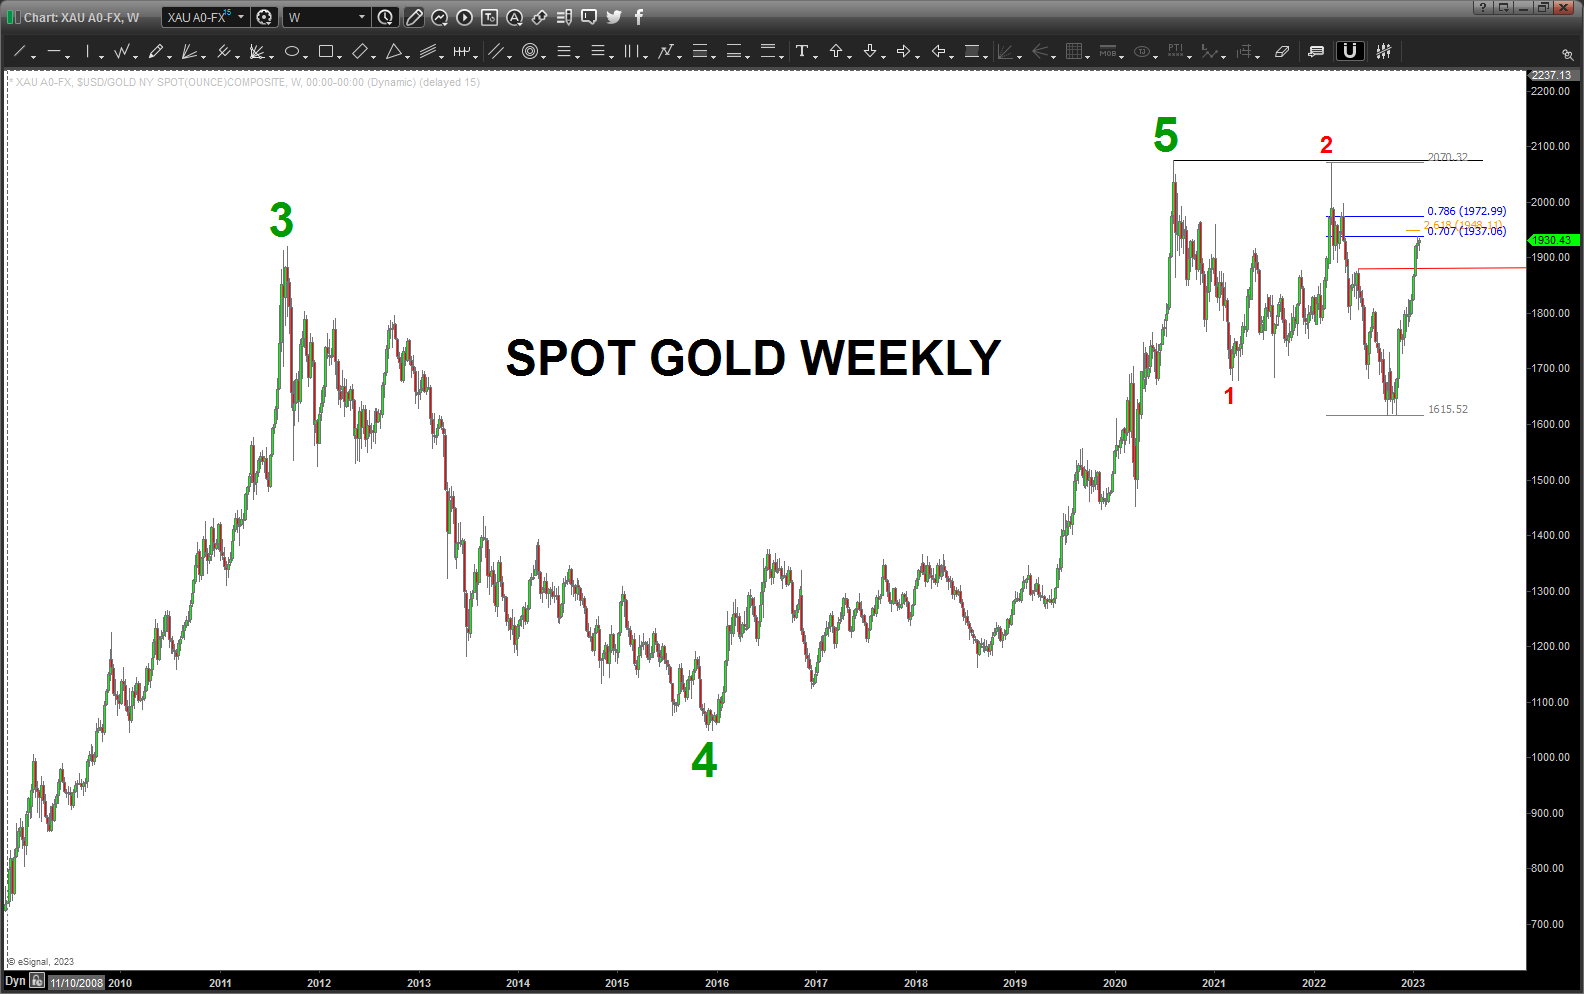
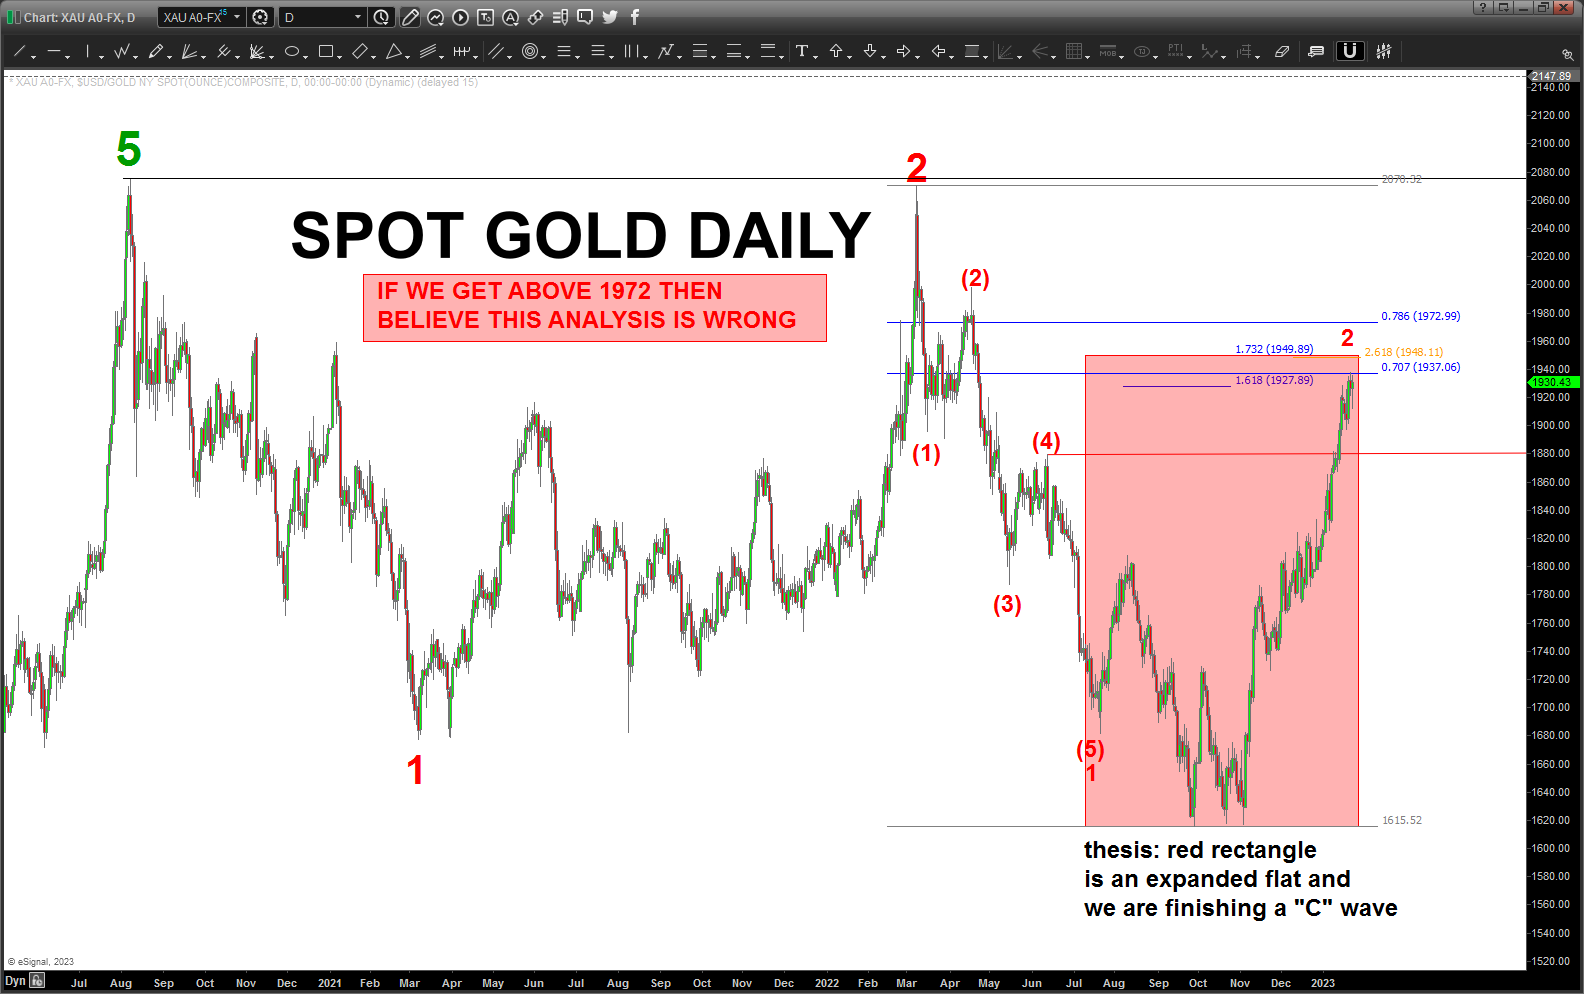
Line in the sand for me along the lines of the “bearish gold case” is that the red rectangle is an expanded flat. At times, the “c” wave can go 2.618*a and that’s just a little higher along w/ the 1.732 (square root of 3) extension target.
For those looking to short, recommend waiting for a daily close below 1879 (red horizontal line) Sitting my hands until then …
For now, believe gold has topped or is topping out …
Bart
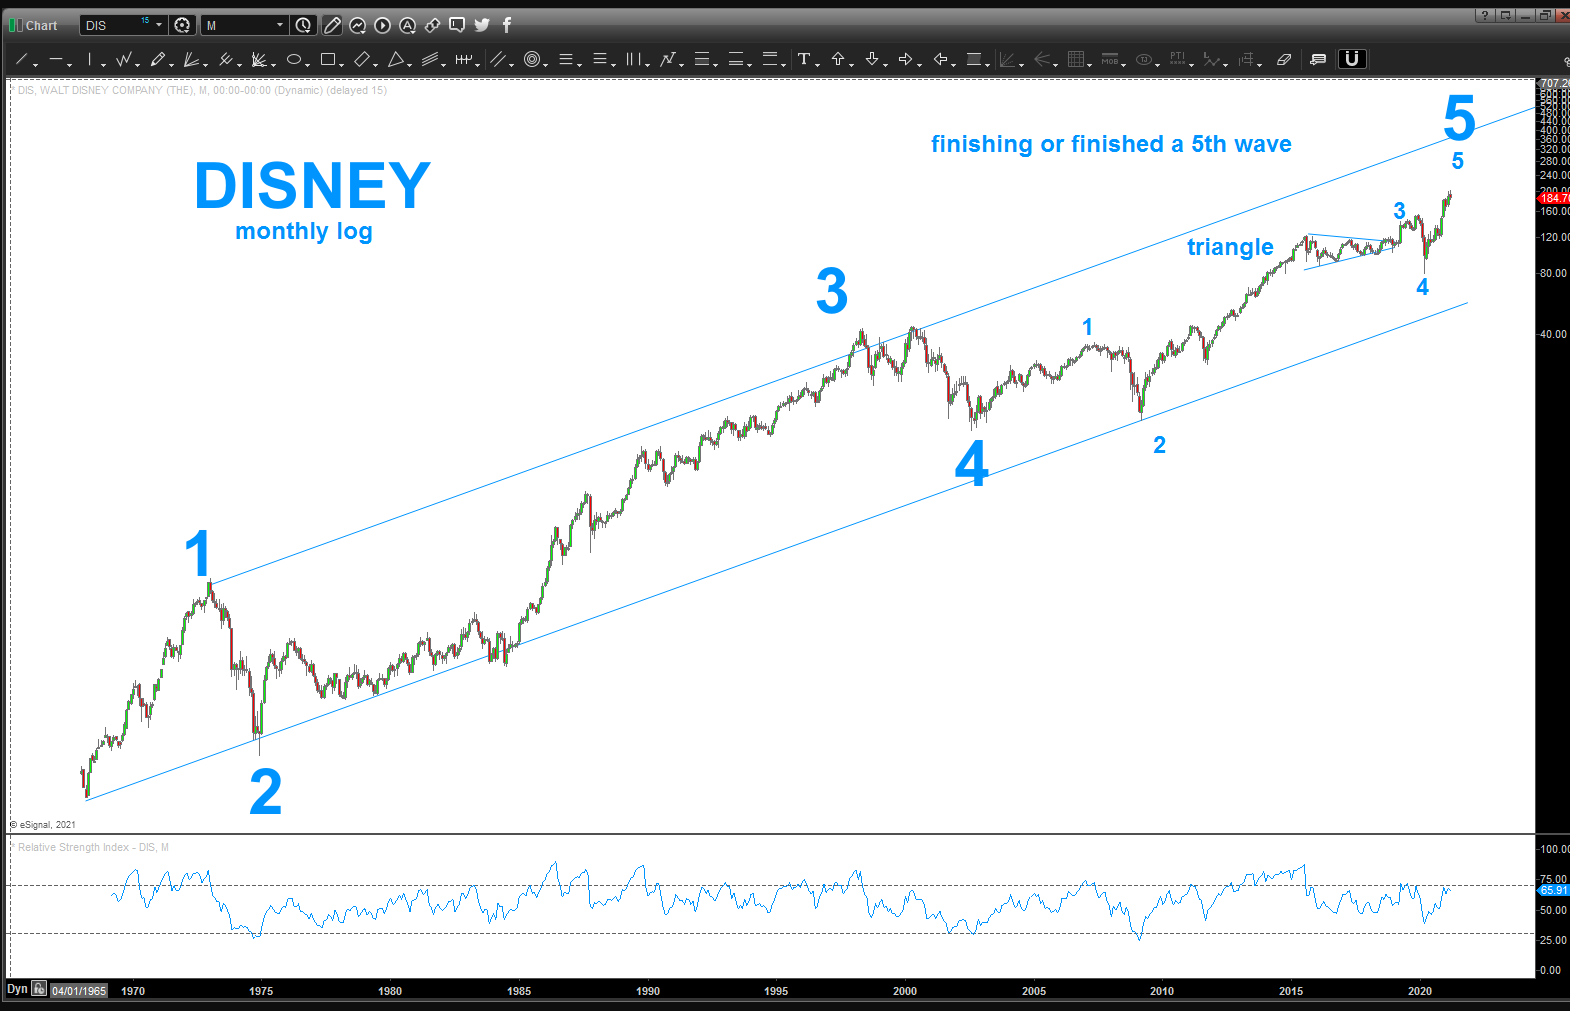
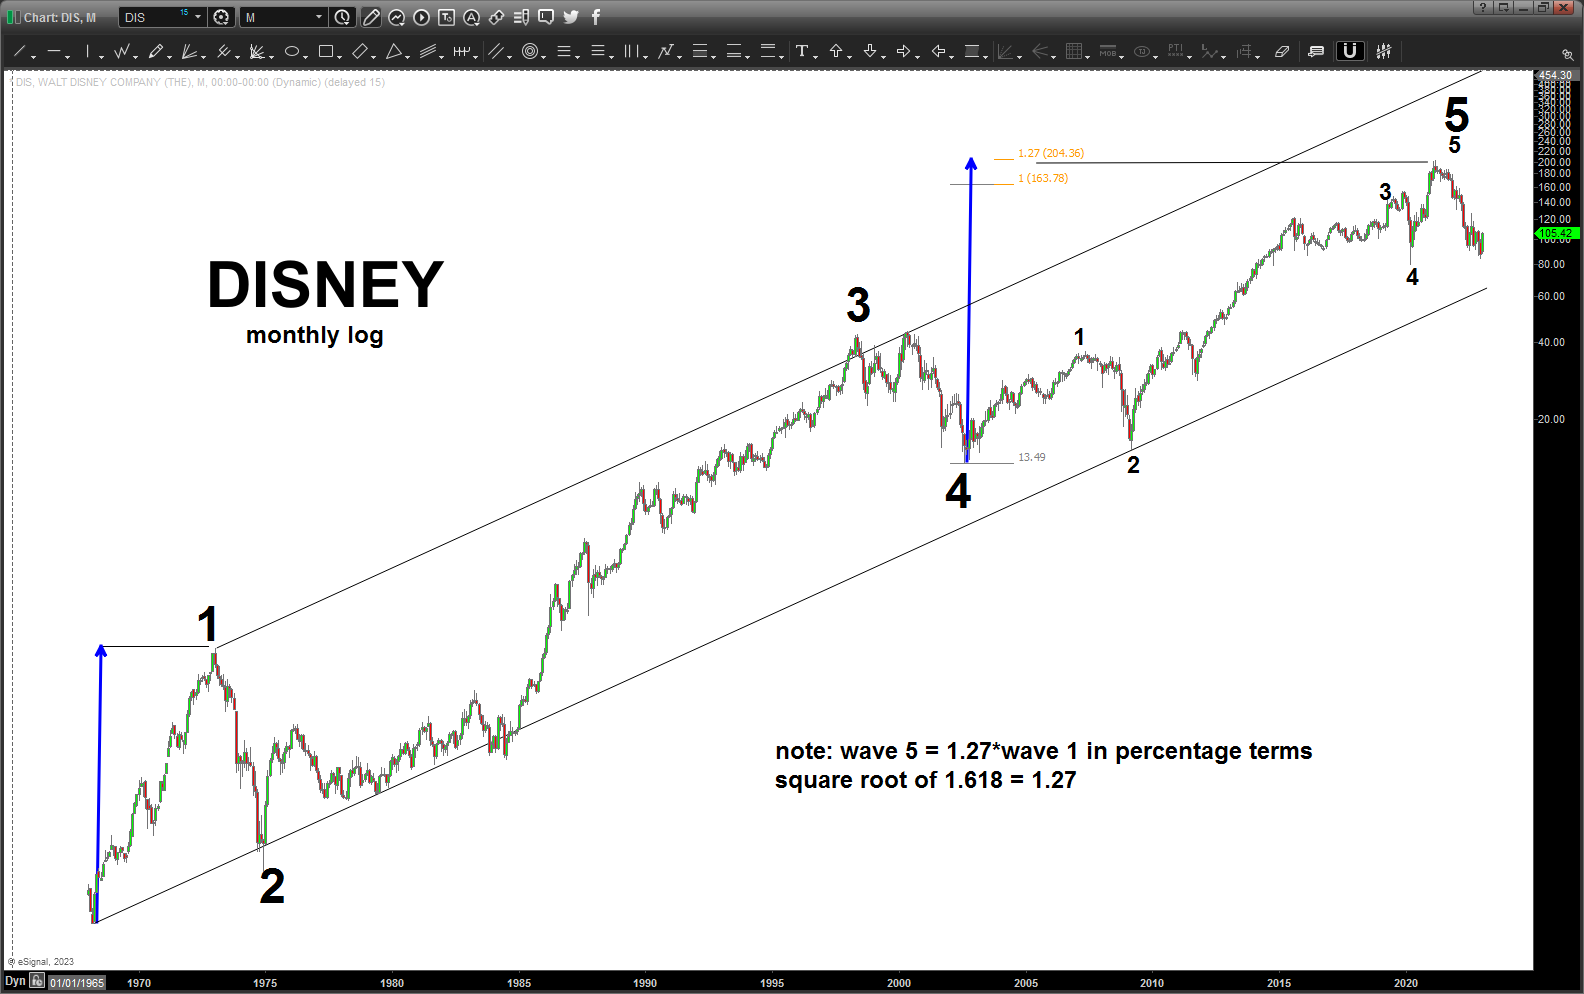
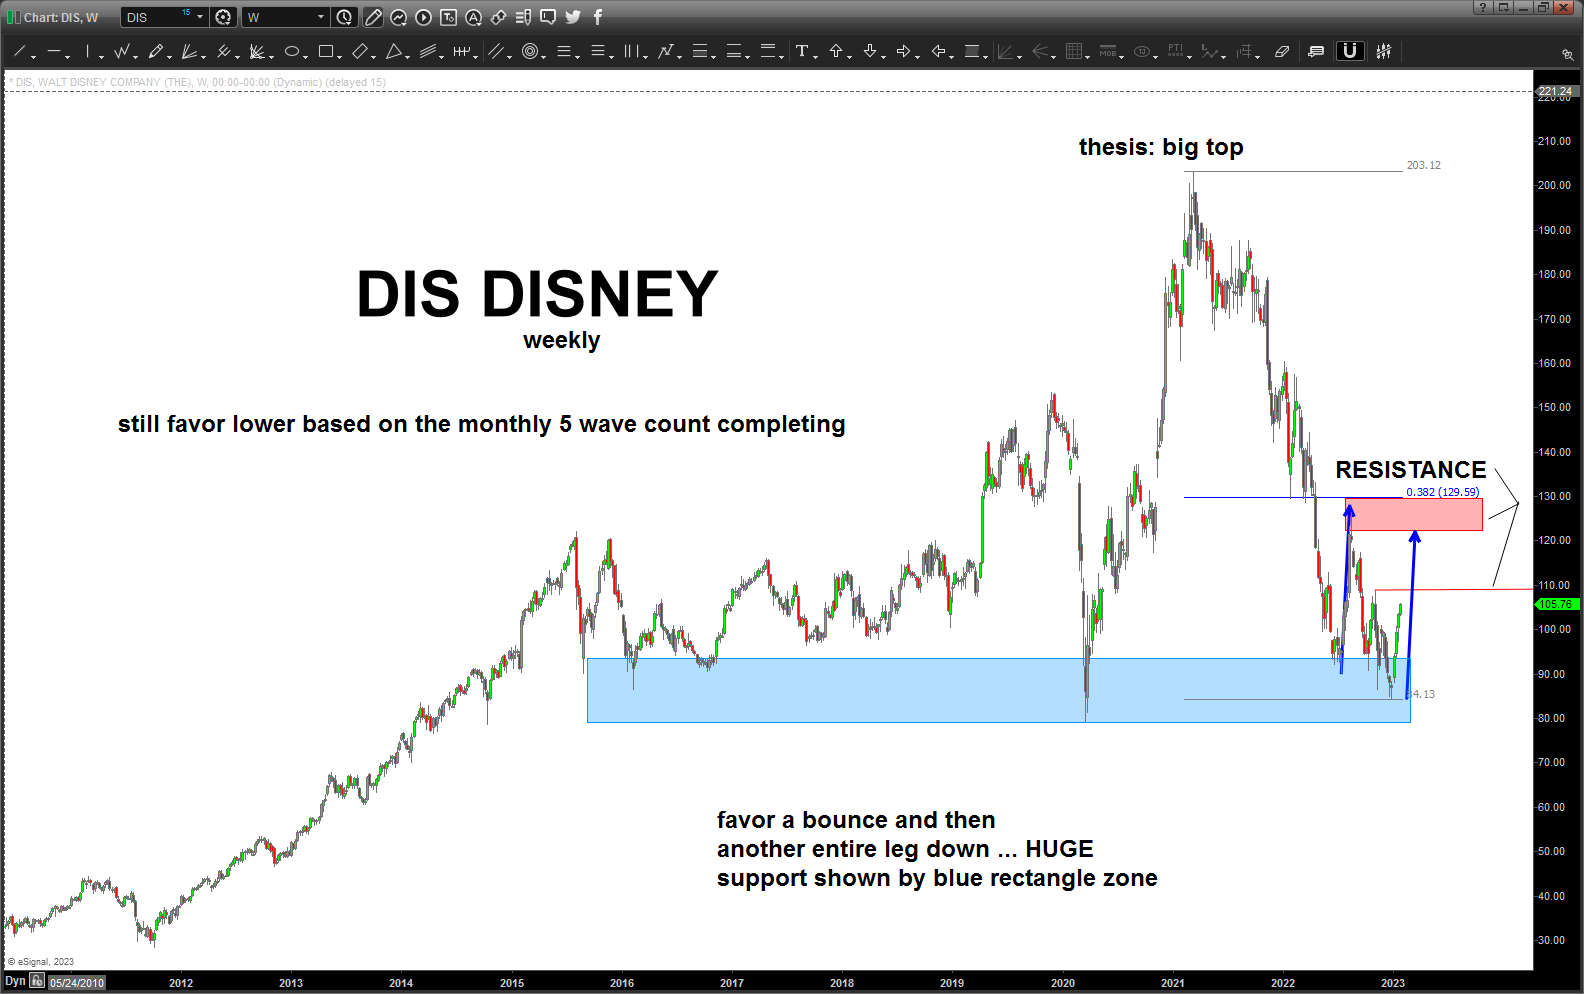
Disney (DIS) – January 23, 2023
Posted on January 23, 2023 Leave a Comment
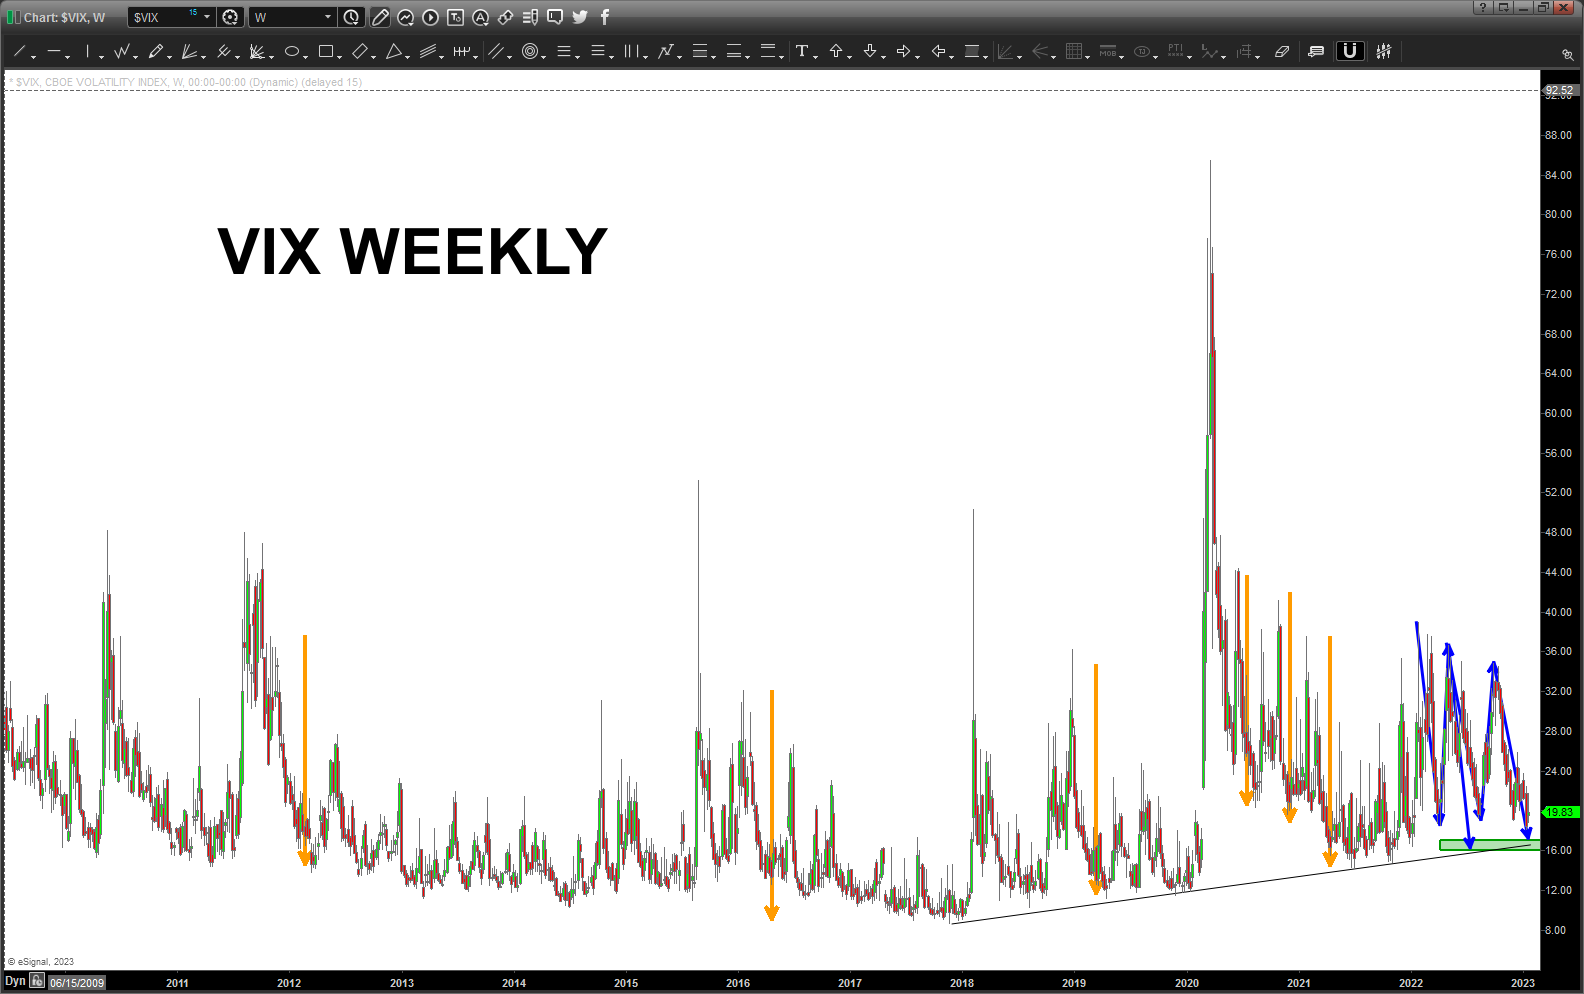
VIX – January 20, 2023
Posted on January 20, 2023 2 Comments
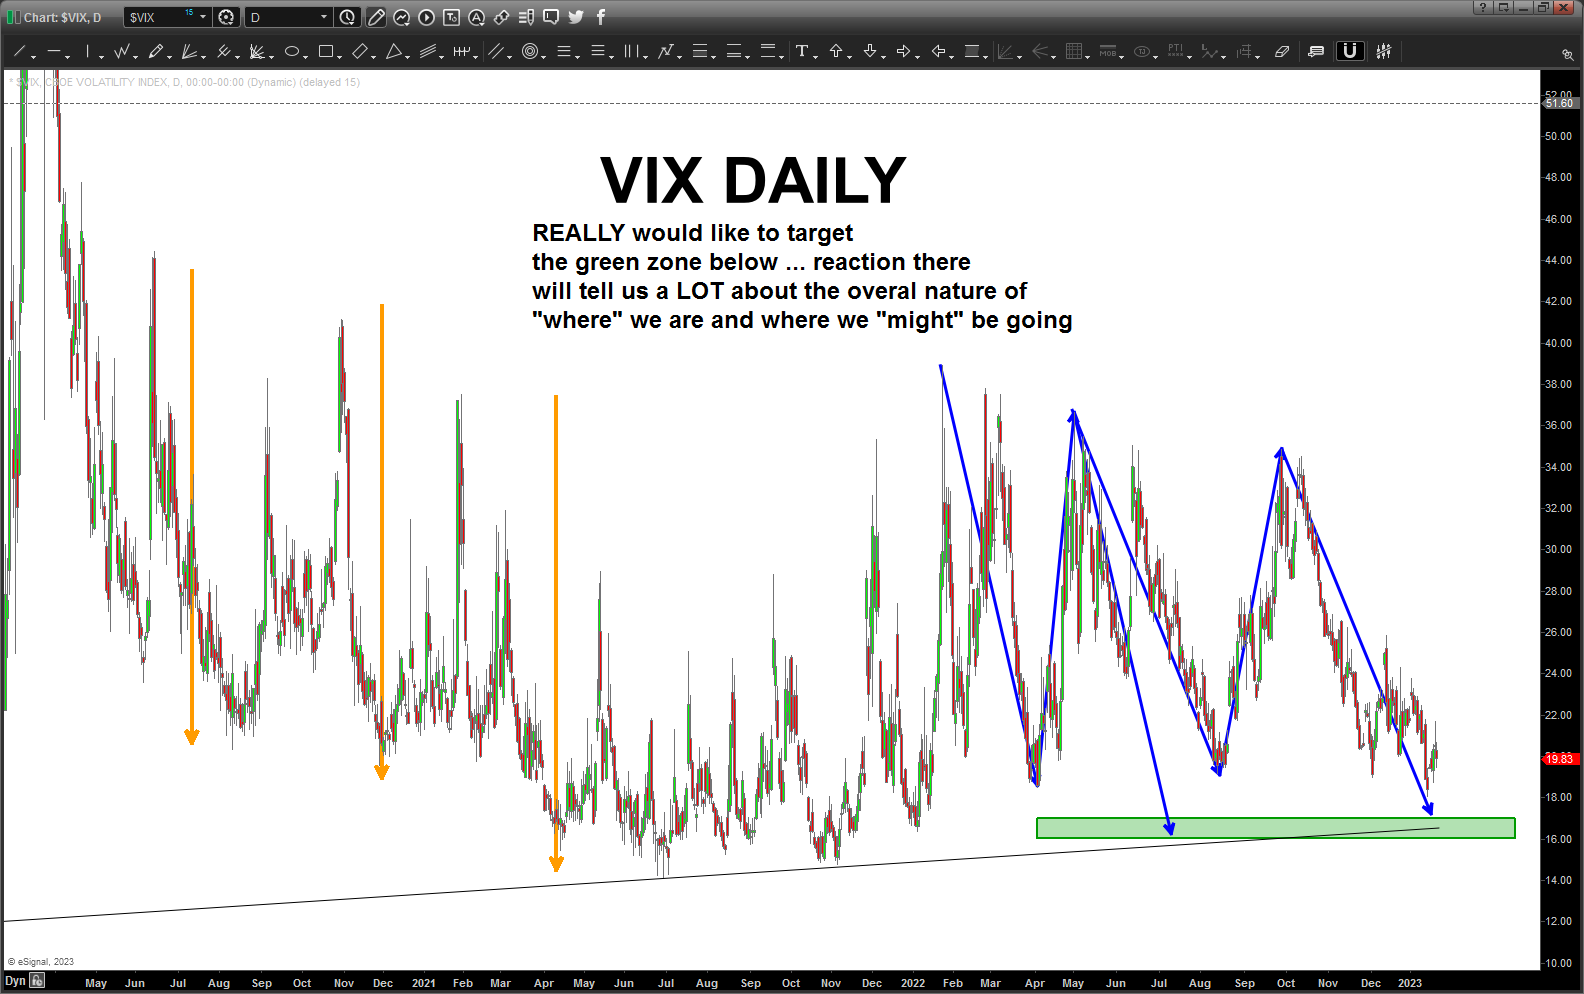
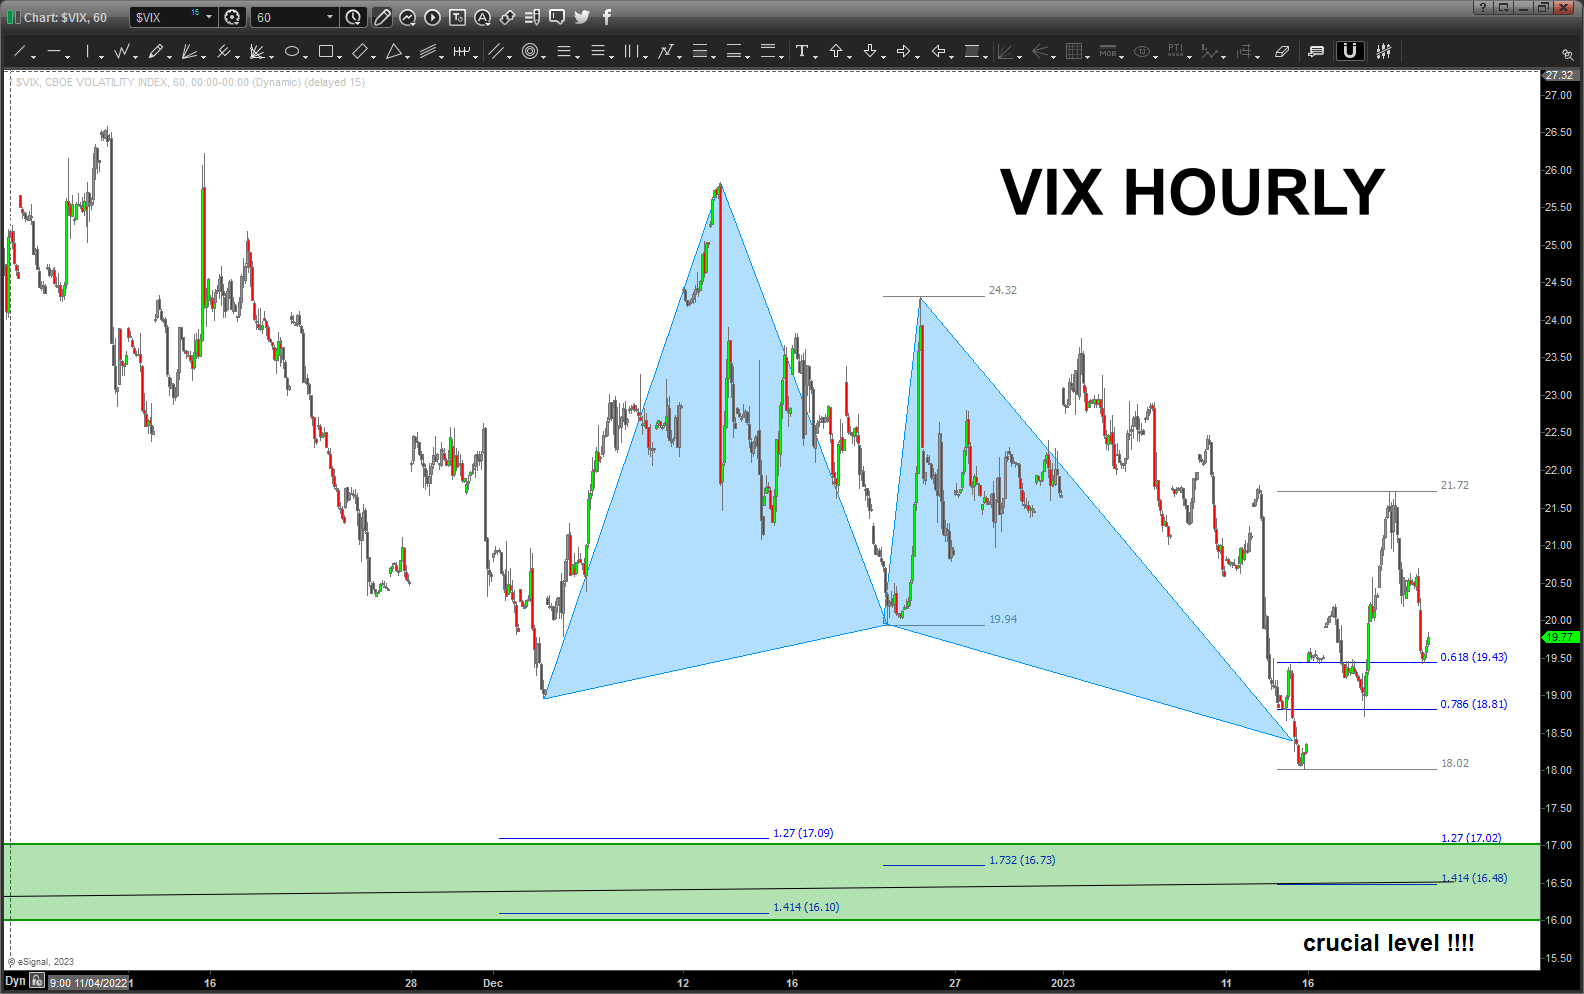
VIX – we wait and wait and wait … this “green rectangle zone” target has been on my radar since July. No kidding …
Simply, would really really like the VIX to go down and attack that level. PLEASE?
Note the Orange measured moves correspond to the two projection areas. Additionally, look at all the extension targets in the last chart.
THIS IS THE KEY ZONE FOR THE VIX.
TSLA – January 20, 2023
Posted on January 20, 2023 6 Comments

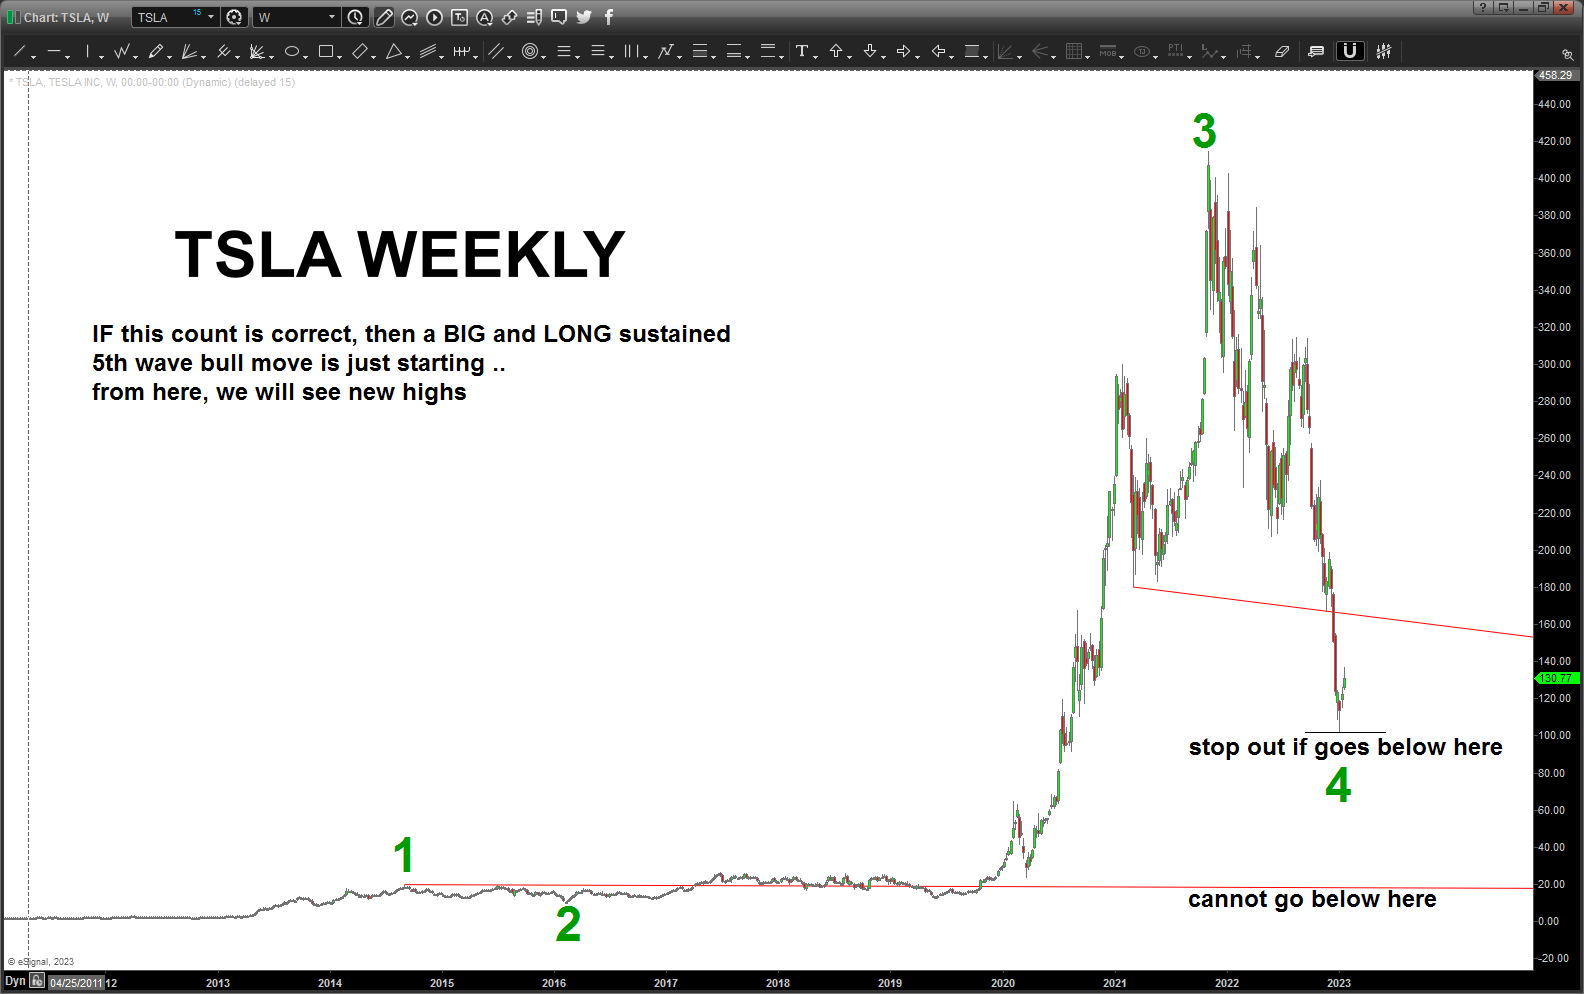
There is a high probability that we have bottomed in the 4th wave and the next wave higher for TSLA is just starting. We can go all the way down to, basically, 20/share and still have a valid count but two things came together nicely PRICE AND TIME to make me think this is a “first” opportunity to get long TSLA.
Folks, if we are long down here in the low 100’s our target will ultimately be above 420. So, be judicious w/ your position size and don’t get greedy. There will be a LOT of gyrations …
If we go below the low around 100 then stop out and we’ll look to try again but for now – believe a bottom is in place for TSLA and a nice risk:reward investment is presenting itself.
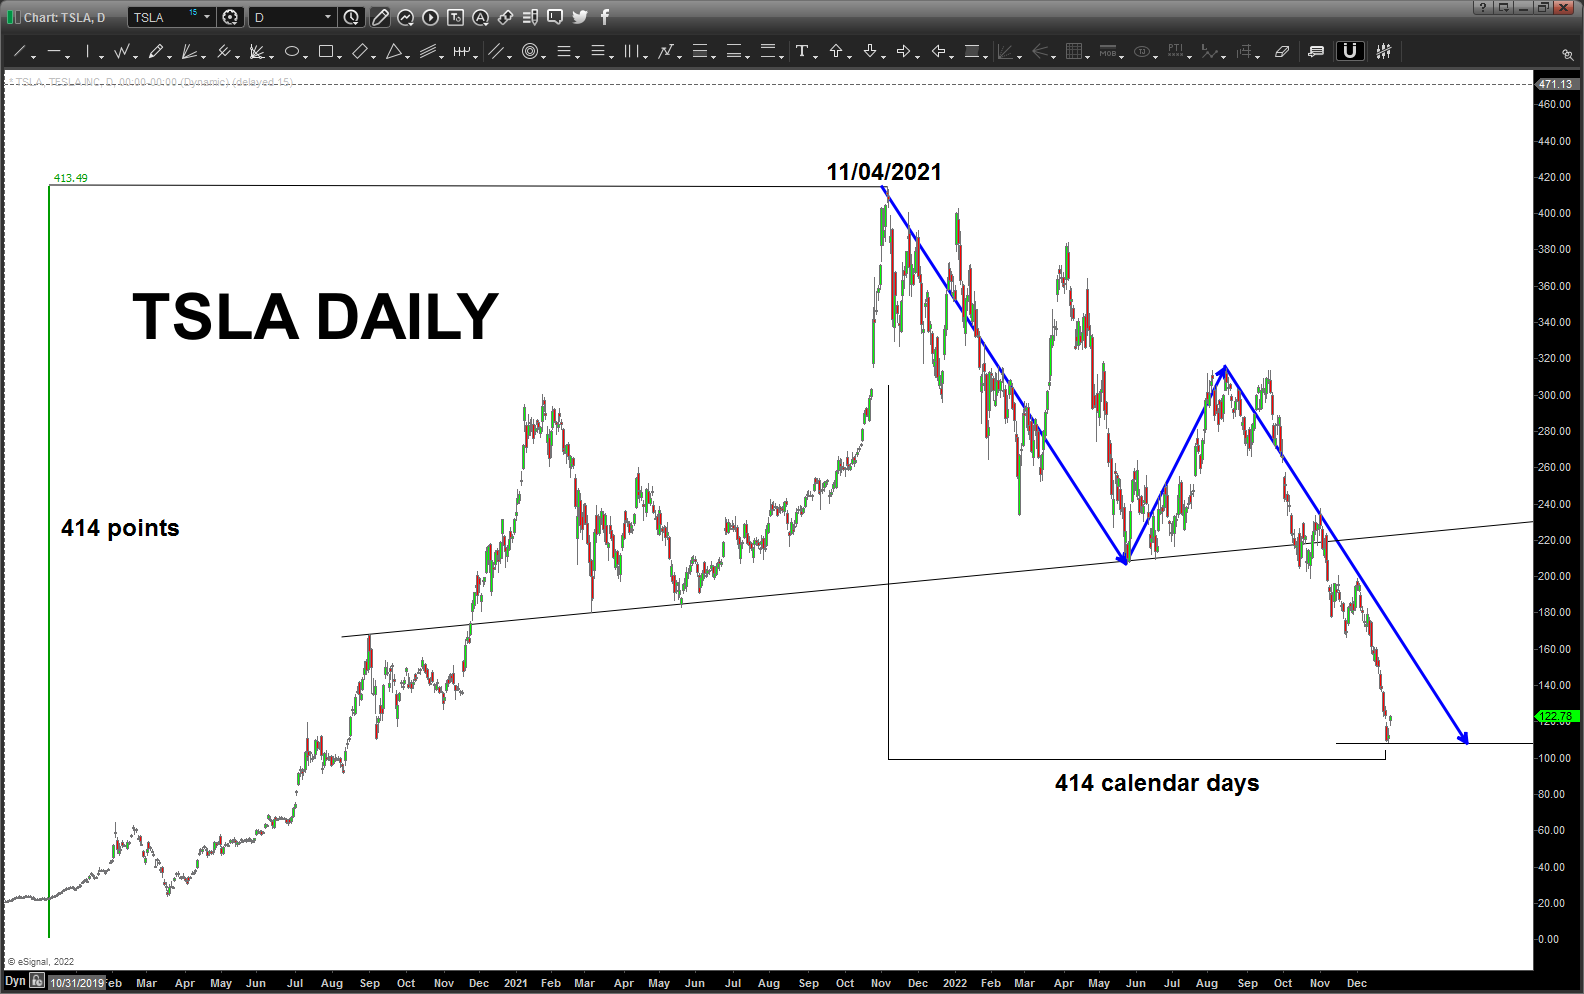
Above you will see the concept of a “square out” w/ TSLA. You can “square out” a high, a low or a range.
From our vantage point PRICE and TIME are just numbers and are equal and interchangeable. Inflections up or down occur when PRICE = TIME or PRICE and TIME are equal harmoniously.
From the IPO price we went a total of 414 points higher. PRICE.
From the ATH DATE of 11/04/2021 we simply add 414 calendar days and that date is 12/23/2022.
Additionally, this entire RANGE square out happened right around the date the BUY PATTERN completed.
Hence, believe we have an important low in place w/ TSLA.
Good weekend to everyone.
Bart
DJ Transports – January 18, 2023
Posted on January 18, 2023 3 Comments

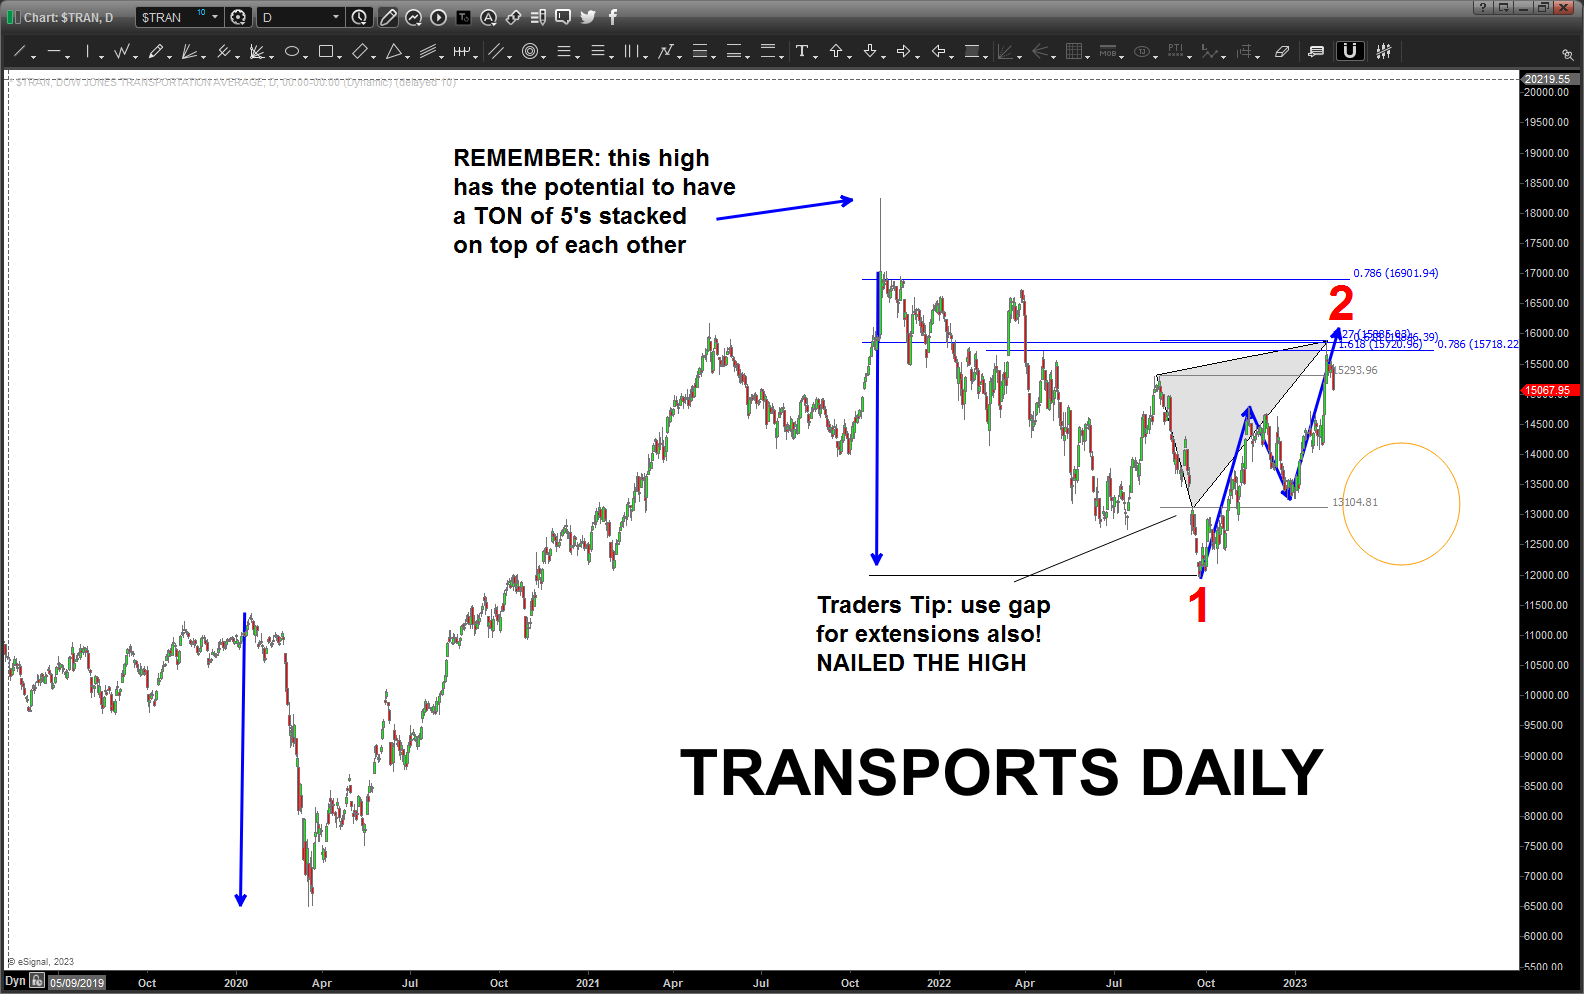
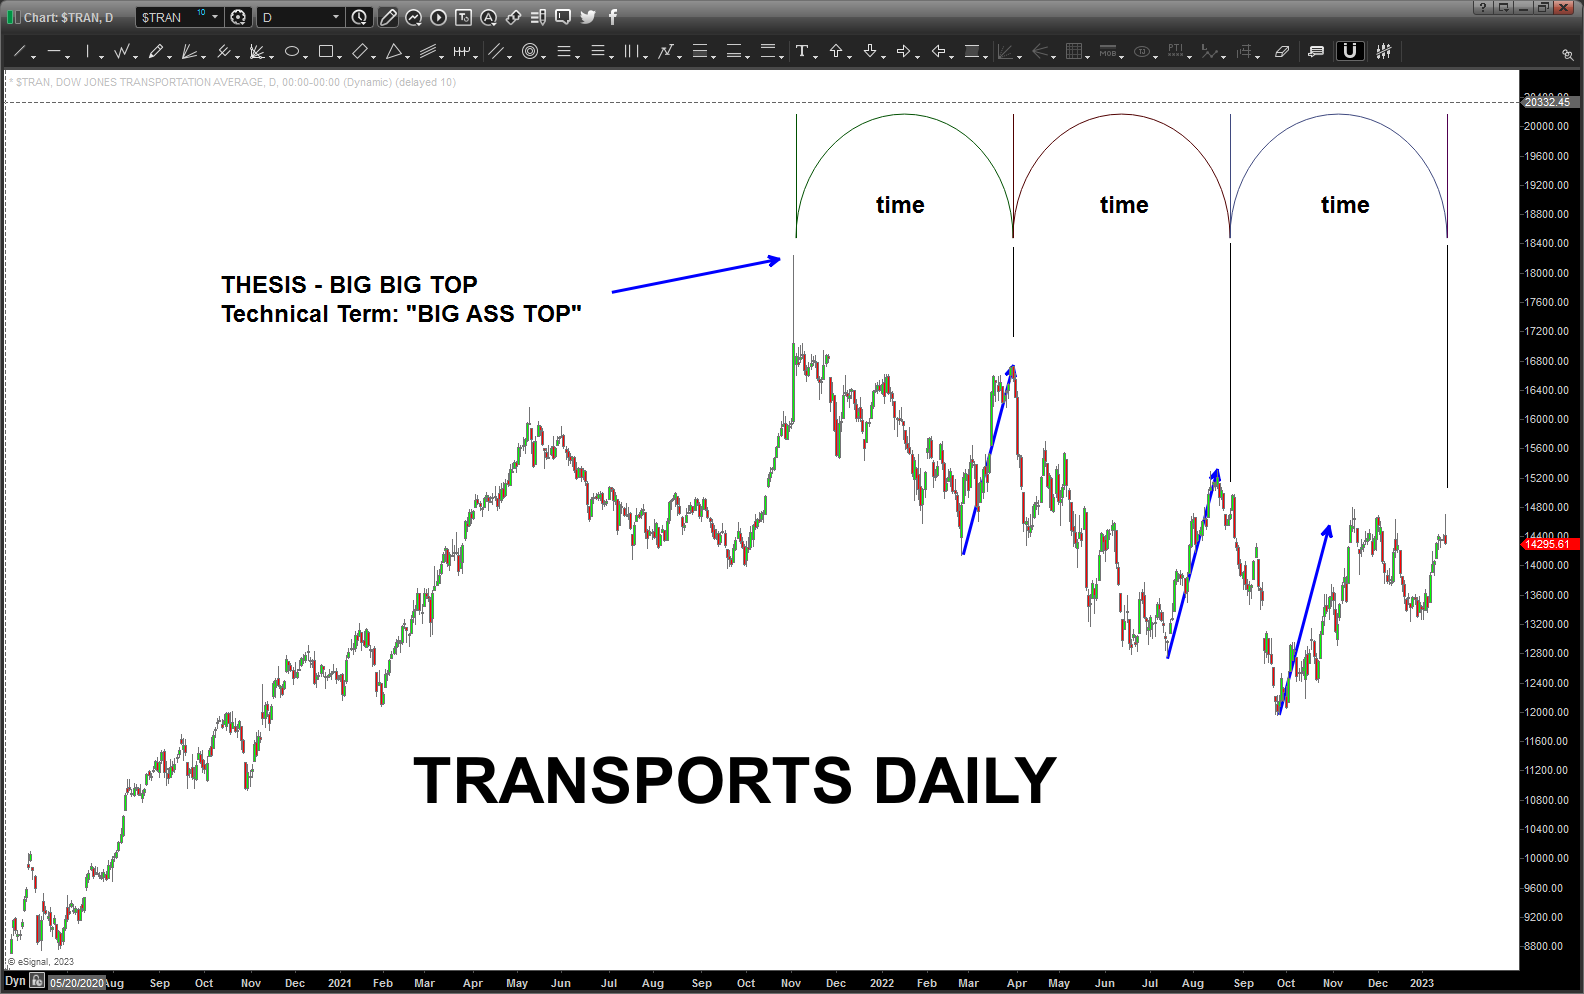
Appears the static time cycle was off by a week or so from the top and the count hadn’t complete so that was to early. However, what we can see now is the sell pattern has completed and the potential of us going – big – has become more probable.
I’d look to be short Transports and the thesis is wrong above the most recent spike high.
January 18, 2023
I blogged a while ago about the Transports … if you do get the chance, check out the EWT professionals from, say, a year or so ago and how they did an amazing long term (100’s of years) of an aggregate Global Down Jones Transportation average … folks, the EWT pros are just stacking 5’s on top of each other at my “thesis” = big top. What do I think … well, they are the EWT pro’s and while I’m a CMT and taught it to CMTi students I can say I know corrections … to put together 100’s of years of counts is impressive. Either way … 5th waves are either finished or in work to finish. In our lifetime … it’s going night night folks. Might have already started …
Here’s a chart from a year or so ago … why my thesis on a “big ass top” … simple AB=CD .. but this is a MONTHLY AB=CD and the A leg starts back in July of 1932. So, from a “big deal” perspective, I think this is one …
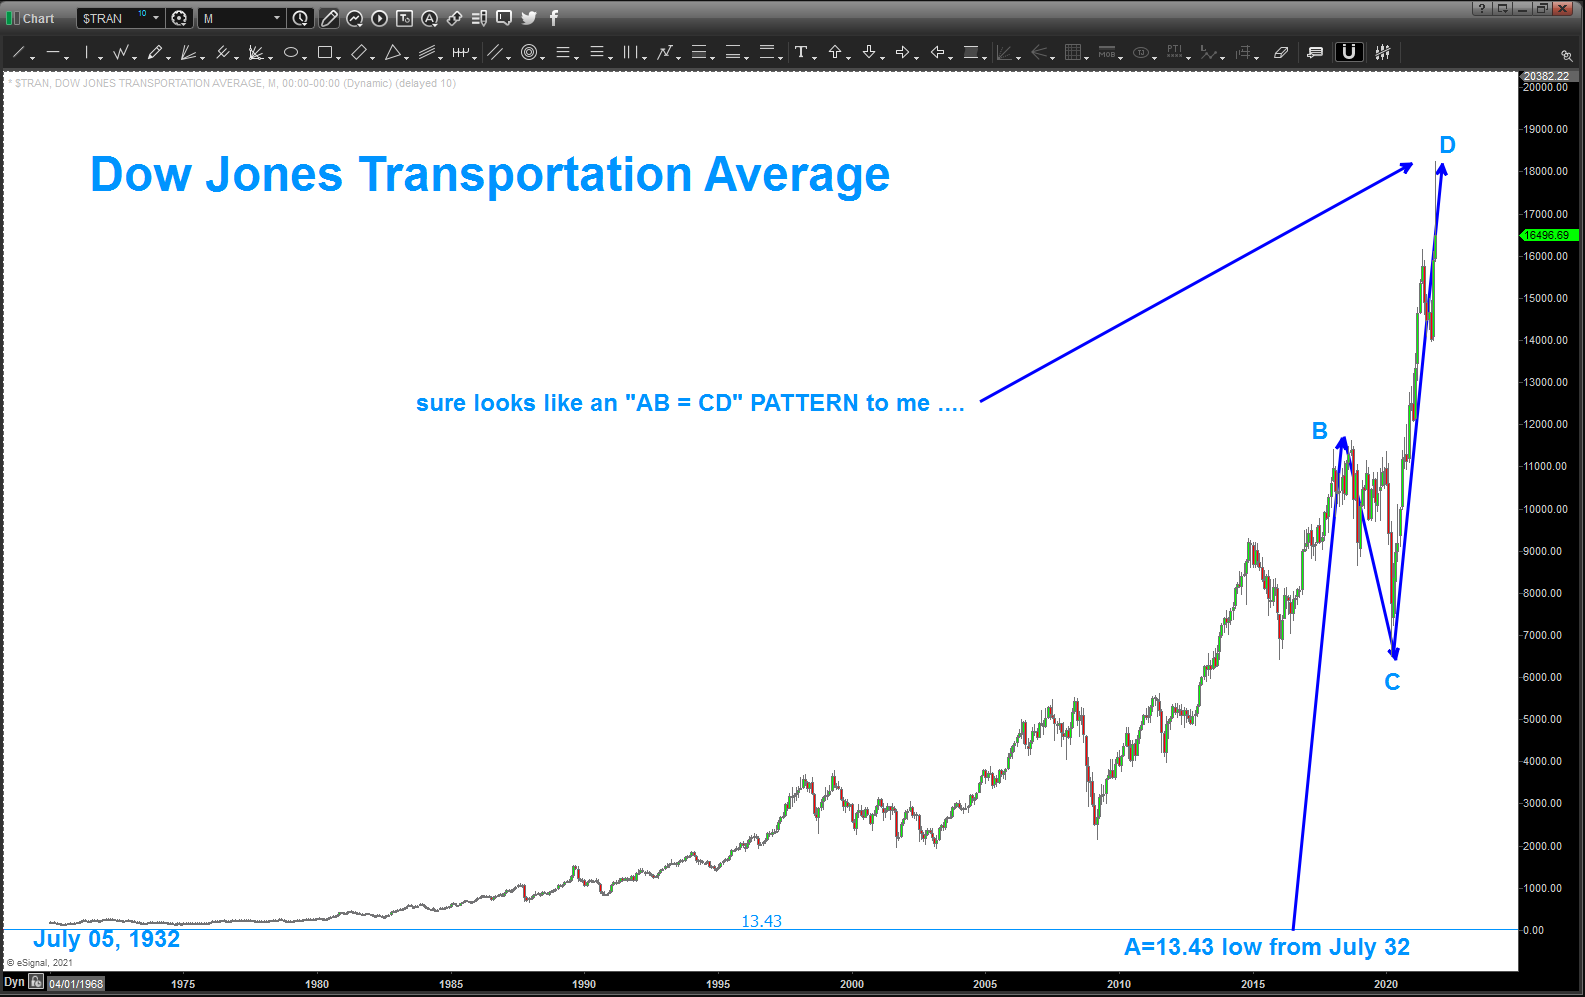
Where are we now …?
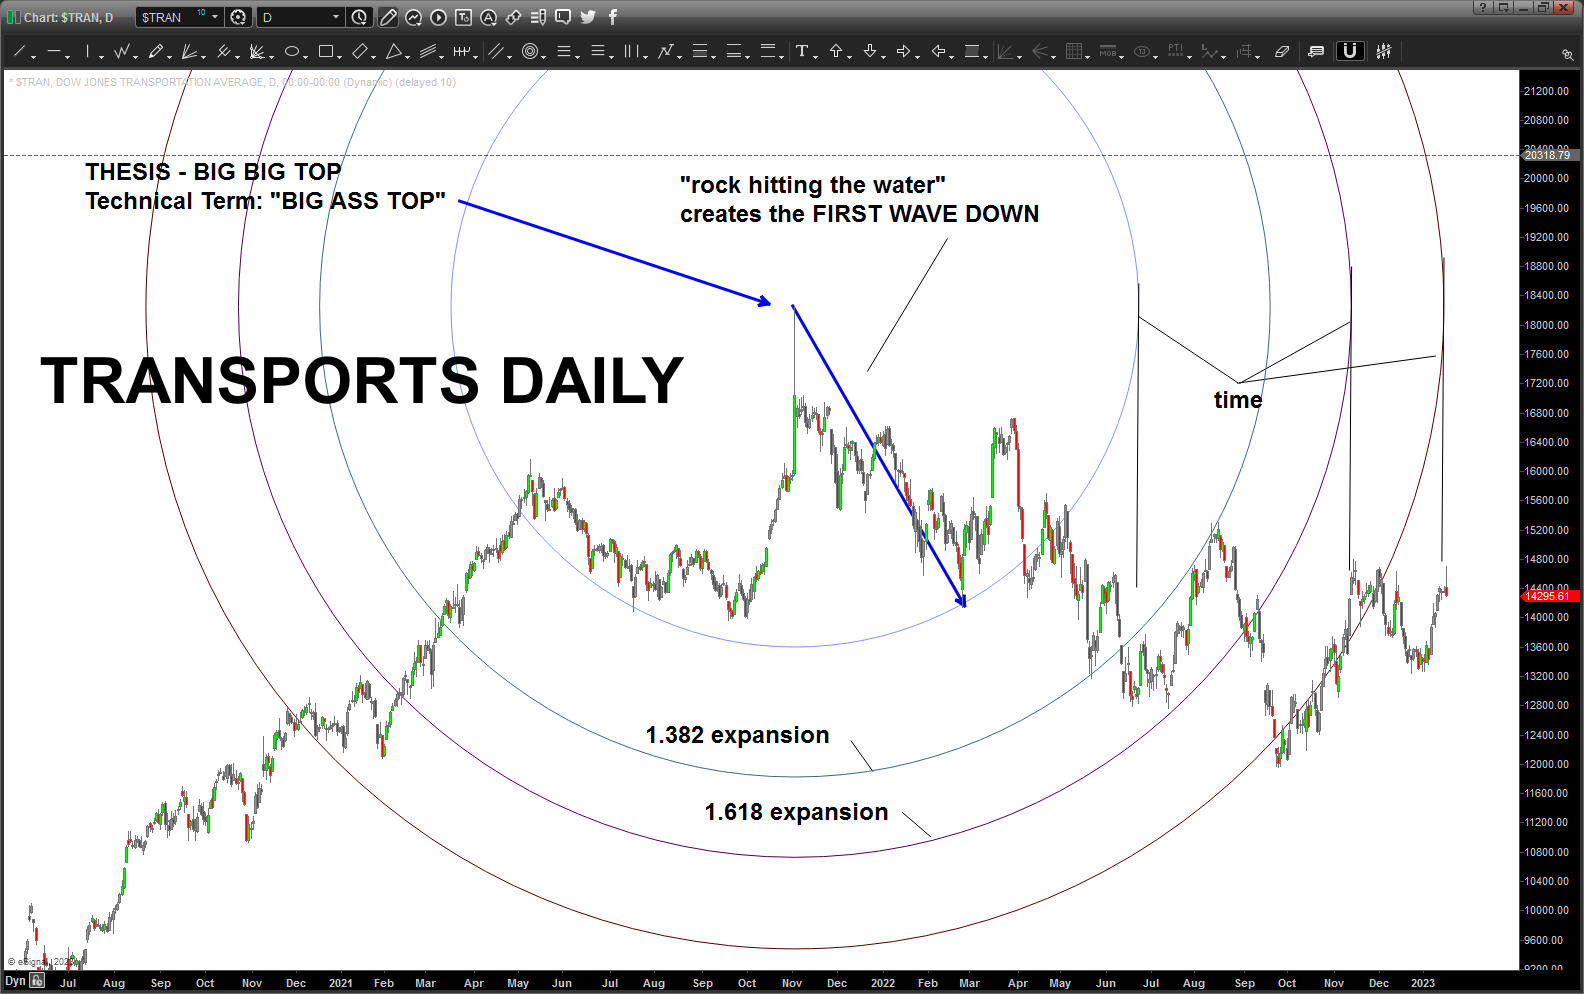
I got asked on the thread about TIME and while I’m trying how to figure that into some training, I did “see” (after you look at charts so much you start to see things … maybe that’s it, I’m not sure what I see anymore LOL) …anyway, you could see the harmony so using a rudimentary cycle tool you can see that today was a good day for a “move” to occur. Additionally, used the “rock hitting the water” analogy for wave creation (depending on how high and how heavy the rock is dropped depends how big of a resulting wave we get) and from this you can see the waves propagate outward. Expanding the initial wave by 1.382, 1.618 and 1.8877 (musical note ratio of equal octave scale of music) you can see what happened to price .. but from a TIME perspective just follow up the arc to the 3 o’clock position and that is a good timing technique.
Based on todays action I would look to be short Transports and stop about yesterday’s high … sure seems like it might be TIME for the “train to leave the station.”
I’m back …
Posted on January 13, 2023 7 Comments
Wow, it’s been – basically – a year since my last post.
I’ve been helping my friend Whiz over at http://www.topgunoptions.com providing market commentary and posting charts – kind of like here. It was fun … if your interested in learning options, consider doing some training or signing up for one of his services – he’s good and the training is also …
Bottom line, as I took an inventory of 2022 I realized I had WAY TOO MUCH going on and my focus was being consumed by so many irons in the fire. Bottom line is I just needed to cut some stuff out and TGO was one of them …
I’ll be doing my normal posting – on my timeline – from time to time. If you remember, sometimes there are a flurry of posts and other times nothing … is what it is. This blog is free folks! 🙂
Also, am thinking of putting together a training course so if that is something of interest, drop me a line about some thoughts and what you or peeps you know might want …
Here’s to 2023 and, folks, get out your tinfoil hats …let’s do this.
