UNG – March 13, 2023 (update)
Posted on March 13, 2023 Leave a Comment
Last post on Natural Gas: https://atomic-temporary-44460632.wpcomstaging.com/2023/02/24/natural-gas-part-ii-february-24-2023/
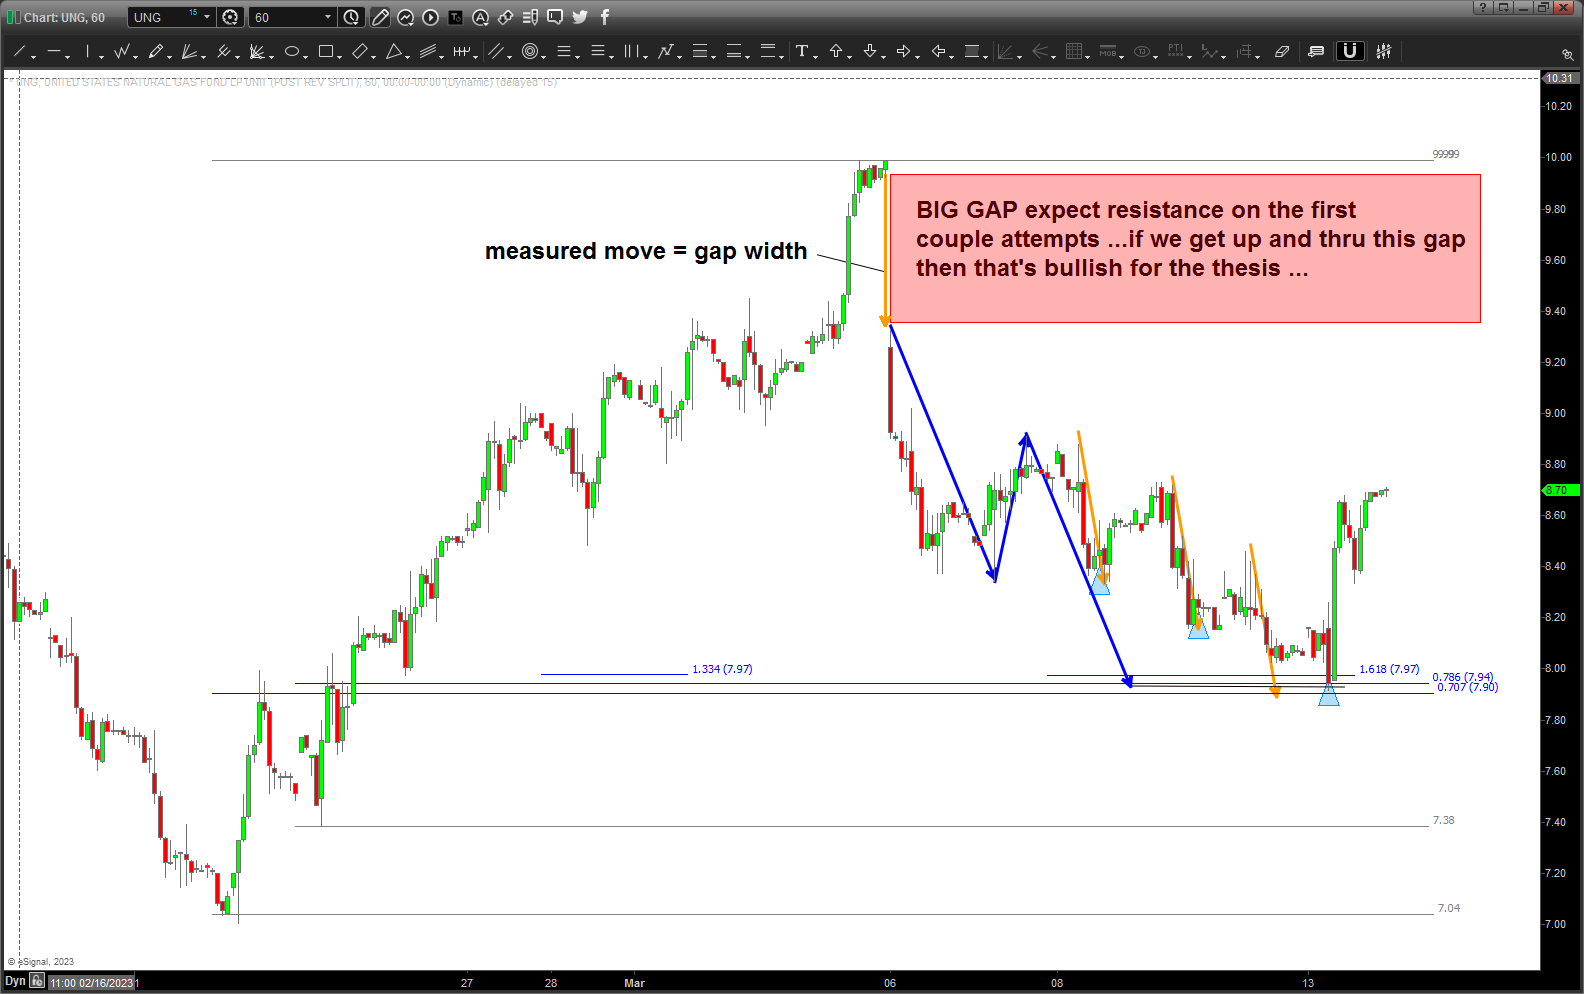
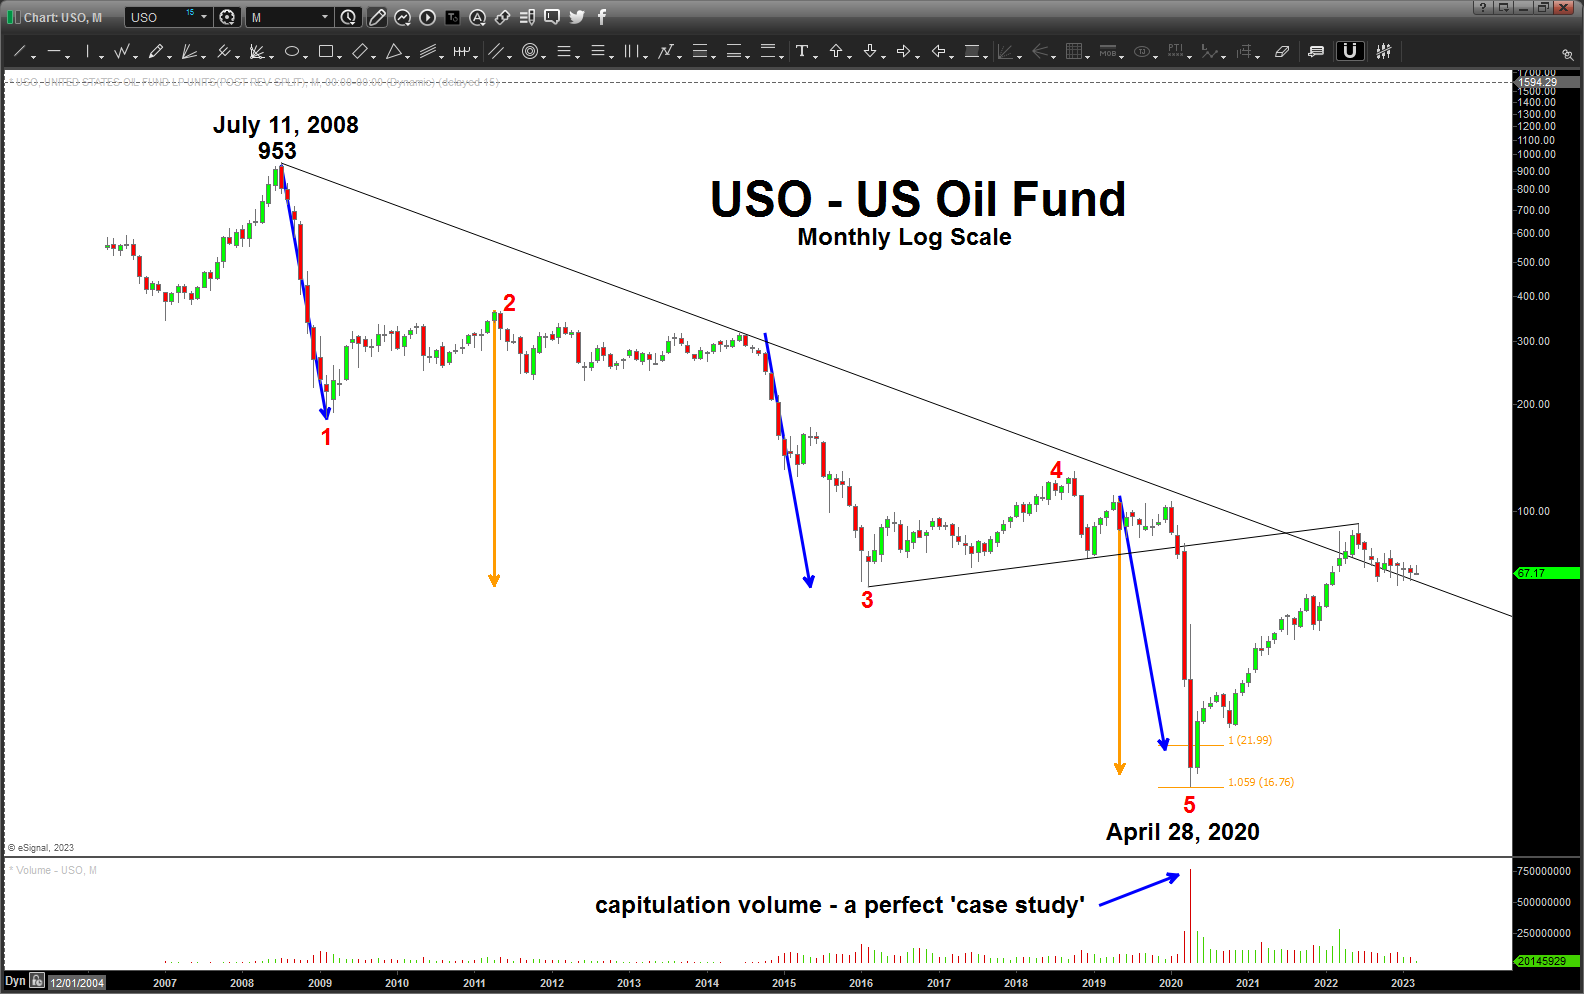
That gap down was a bummer … but, we have found support and bounced nicely. As you can see above, any move higher will run into the wall of China above (big gap) and probably fail the first or second time. But, obviously, we want it to close up and above that entire area so that is the immediate resistance.
The “ideal” PATTERN we would like is the a-b-c EWT corrective sequence that will set up a GART BUY.
You know I don’t like to do the “could have would have should have” but there is some nice little coloring techniques/tricks in the chart above so let’s take a peak.
First thing is to note the ABCD (blue arrows) into the low .. then, we have both a .707 and .786 retracement level with a 1.618 extension. I also (which I like to do, alot) extended off the last low before the march to the high and that was a nice ratio from the equal octave scale of music : 1.3348. Then, one last, take note of the “gap area” because that defined the measured moves into the low. No kidding … then, those orange measured moves set up what? A three drives to a bottom BUY pattern. (blue triangles).
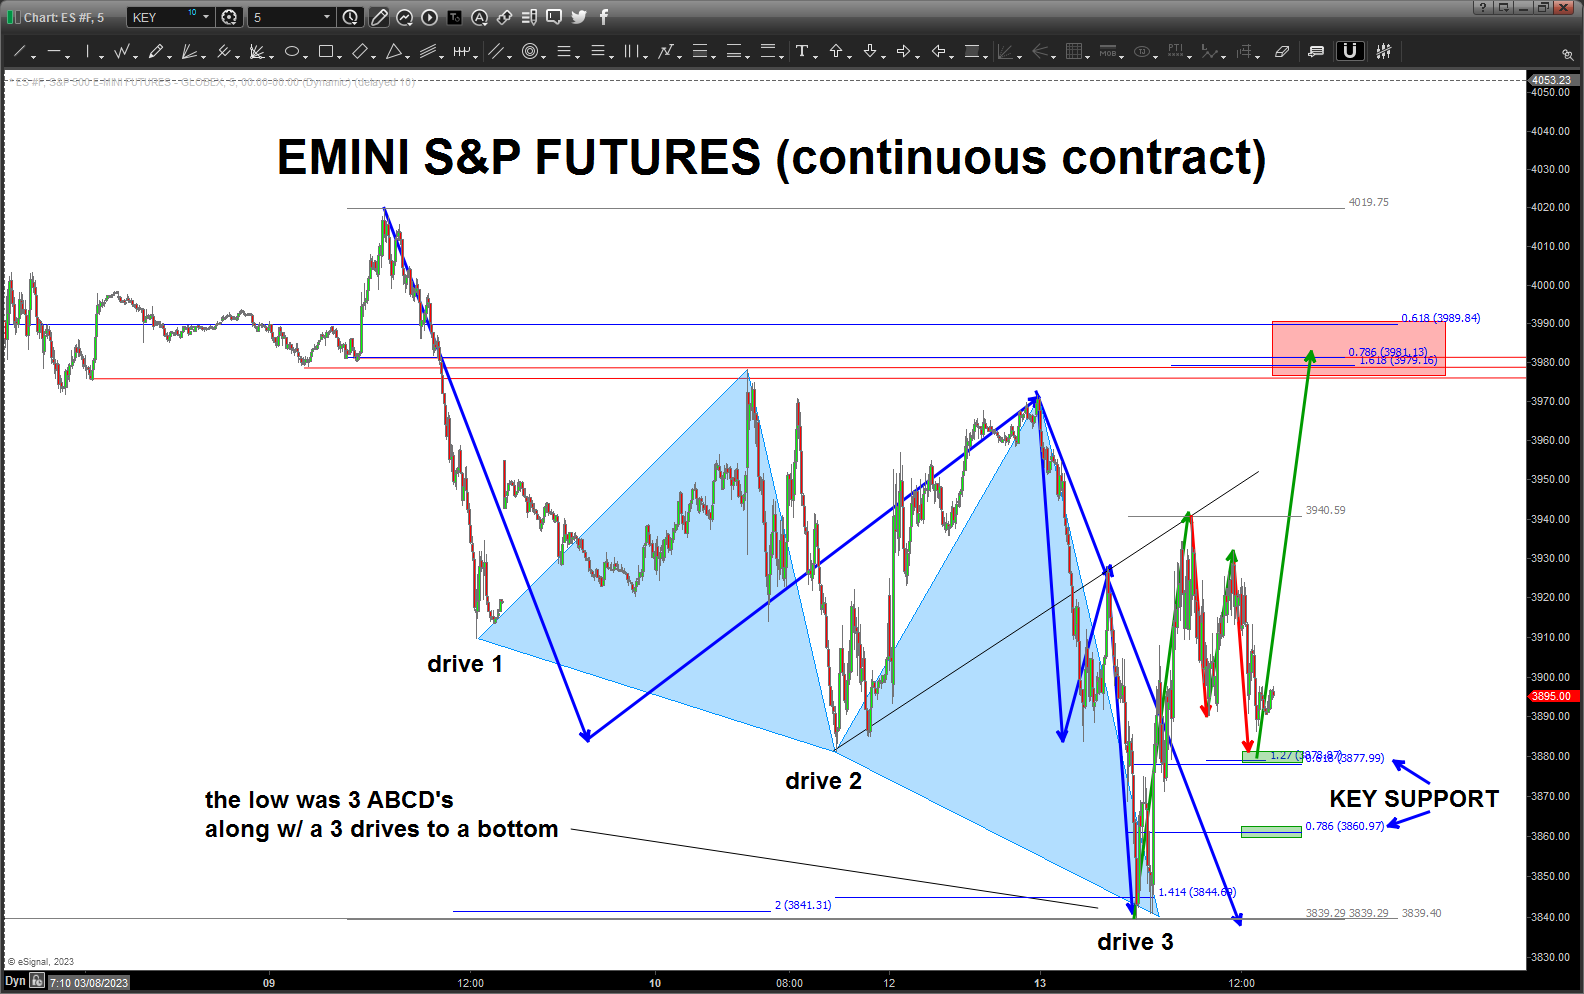
S&P 500 E-mini – March 13, 2023
Posted on March 13, 2023 Leave a Comment
The support/rally that was found today by the market was “expected” as we could see 5 waves down.
Now the BIG question is was the high today the end of the wave 2 or do we rally once more. I would like to see another rally so we can PROJECT the upcoming POTENTIAL inflection point.
Note, the 2 arrows show IMPORTANT support of the emini if the pattern fails.
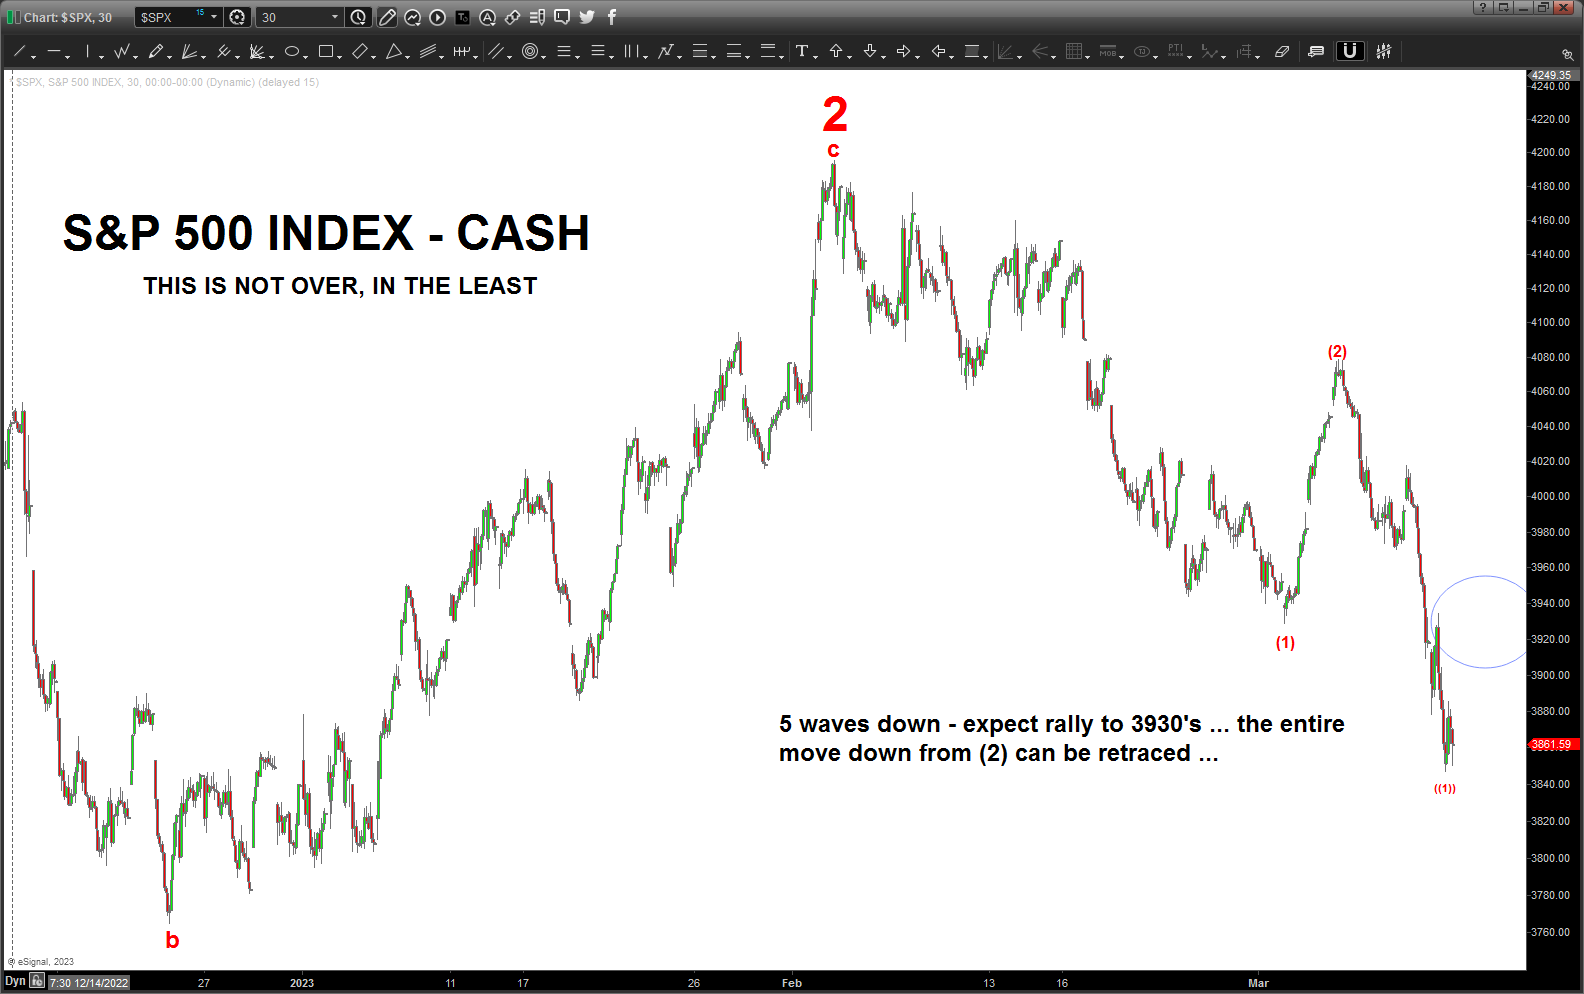
S&P 500 – March 12,2023
Posted on March 12, 2023 2 Comments
Expect a rally the next couple days …perhaps a slight gap down but eventually support and then a rally should occur. Futures tonight are already providing that “commentary” so I’d expect a larger than “normal” rally due to the world is coming unglued (it is) but you know what I’m saying … “everyone” expected a blood bath tonight when the futures opened.
5 waves down complete … expect a rally into the circled area “to start” .. why “to start” – well – I would expect a large rally tomorrow if everyone has been told everything is OK and that circled area is the area of the 4th wave of a lesser degree so that’s an initial target.
But, as I typed below on the chart – the entire rally from (2) or 4080’s can be retraced and this count remains valid.
So, I’m guilty as charged in thinking this is an “easy” trade I’m shorting the market because it’s all going to come unglued !!!! TAKE THAT and you wake up and the entire thing has slammed against you. Been there done that and ..don’t everyone want to be there again.
Taking the banks and all the real stuff that are important away … Folks looks like we just completed wave 1 down of the “c’ Wave or Wave III (not sure one it is yet) and therefore a rather large rally could happen. WE WANT TO BE SHORT AT THE END OF THIS RALLY!
Hope the rally comes and it’s real and my count is completely wrong … hope is a strategy, you know?
Goldman Sachs – March 11, 2023
Posted on March 11, 2023 Leave a Comment
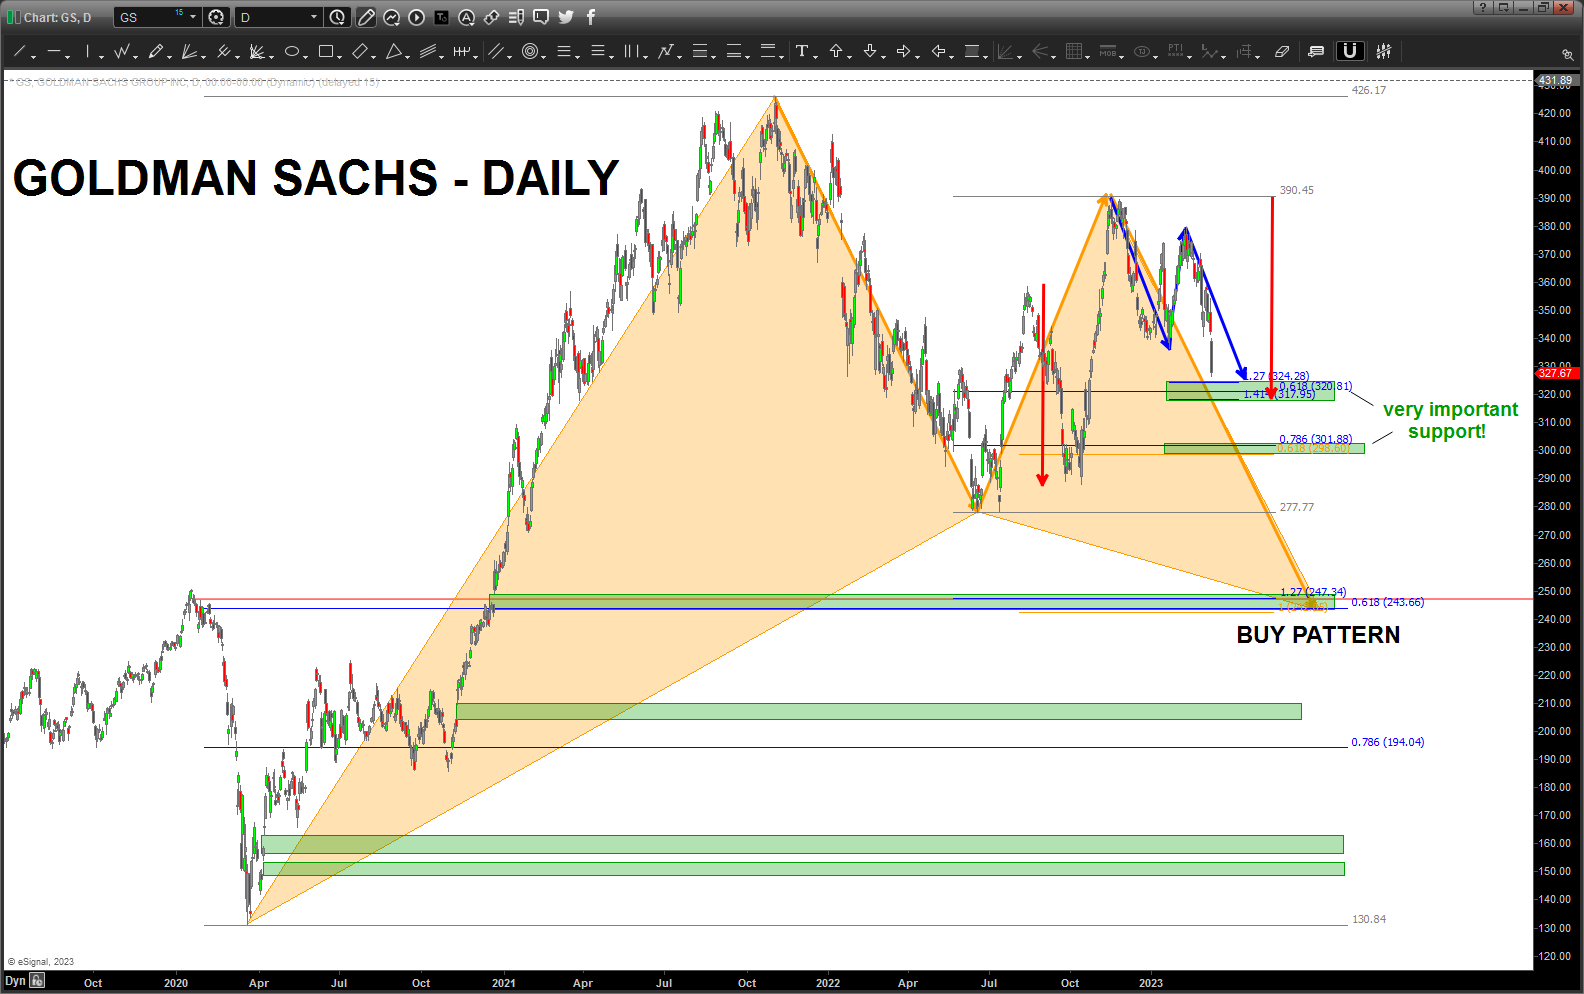
Very important support comes in for GS a little lower in/around the 320’s and then 300’s. We lose those levels then expect GS to breathe down to a VERY NICE BUY PATTERN from 243-247.
That buy PATTERN is a classic.
ABCD, .618 retrace, 1.27 extension and then the “crossover” structure .. dare I say, it’s a near perfect set up.
Which, like I always mention … can and does fail so that is the line in the sand for GS and, potentially, the entire banking system. (?)
S&P 500 – March 09, 2023
Posted on March 9, 2023 3 Comments
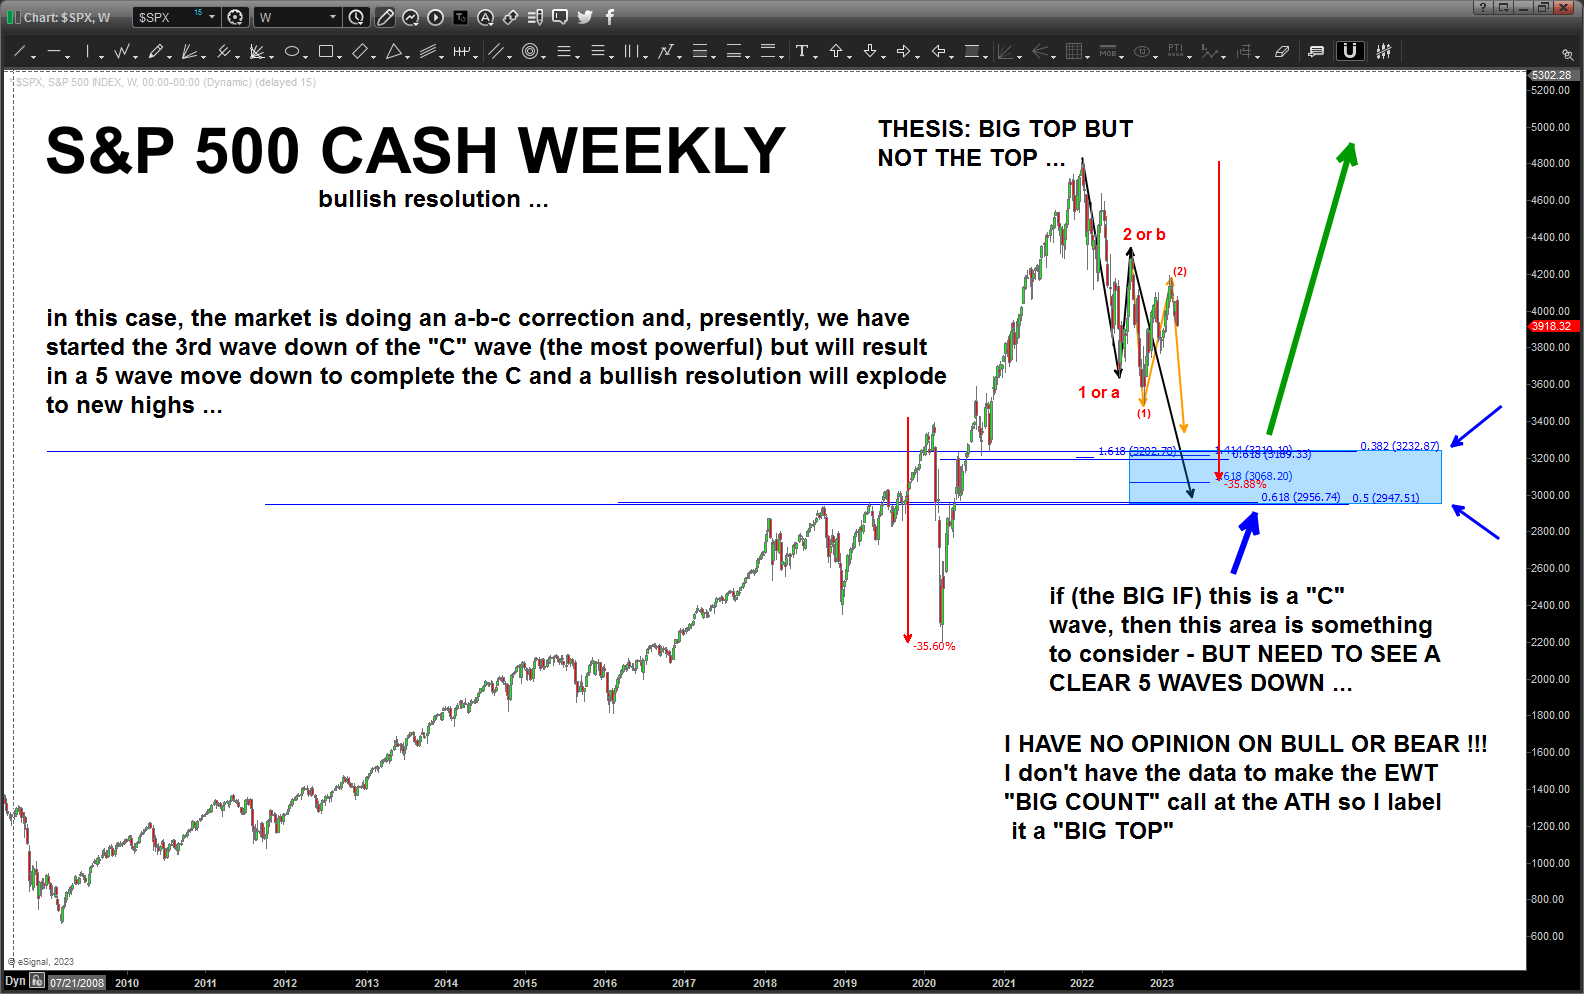
I try to make it clear on the chart below that I just “don’t have a clue” if the ATH on the S&P 500 is THE HIGH or A HIGH … I don’t have the data and, frankly, I’ve seen very amazing professionals say it is THE HIGH and also say A HIGH. Both, totally possible. NOBODY KNOWS except the Architect !!!
With that backdrop, you can see that this chart is a “bullish conclusion” of this correction and support shall be found and off we go.
I would hold my powder dry to go long … remember, in this case we have a 3rd wave of the C wave starting and that’s UGLY so we’ll have plenty of time to get long and, as you can see, using our measured moves you can see we have a nice thumping coming lower.
So, there we have 3232ish level w/ 4 ratio’s and a little higher a 3 drives to a bottom (orange arrows) and the percentage decline from 2020. the 2950 ish is our ABCD (black arrows) and a nice overlap of .618 and .5 from the 2009 low.
One of those two should hold … and then, guess we’ll just have to wait and see. I’m not really looking forward to that …
One of these amazing professionals will be proven correct and they both have the guts to make “the call” … my call will be 1/ trying to get short into the zone shown (I’ve been stopped out twice trying to short this market but my analysis has been spot on … yup.) and then 2/ stepping up to BUY to test the “trend is your friend till it ends” thesis.
If our levels work, then were long for a multi year run into new highs.
If they get blown thru and fail either like a hot knife thru butter or provide some support but then, after a week or so, are taken out THEN things are really in the “other” category of the good/other grade category.
Banking Index – March 09, 2023 (UPDATE)
Posted on March 9, 2023 1 Comment
Last post on the Banking Index: https://atomic-temporary-44460632.wpcomstaging.com/2023/01/31/banking-index-january-31-2023/
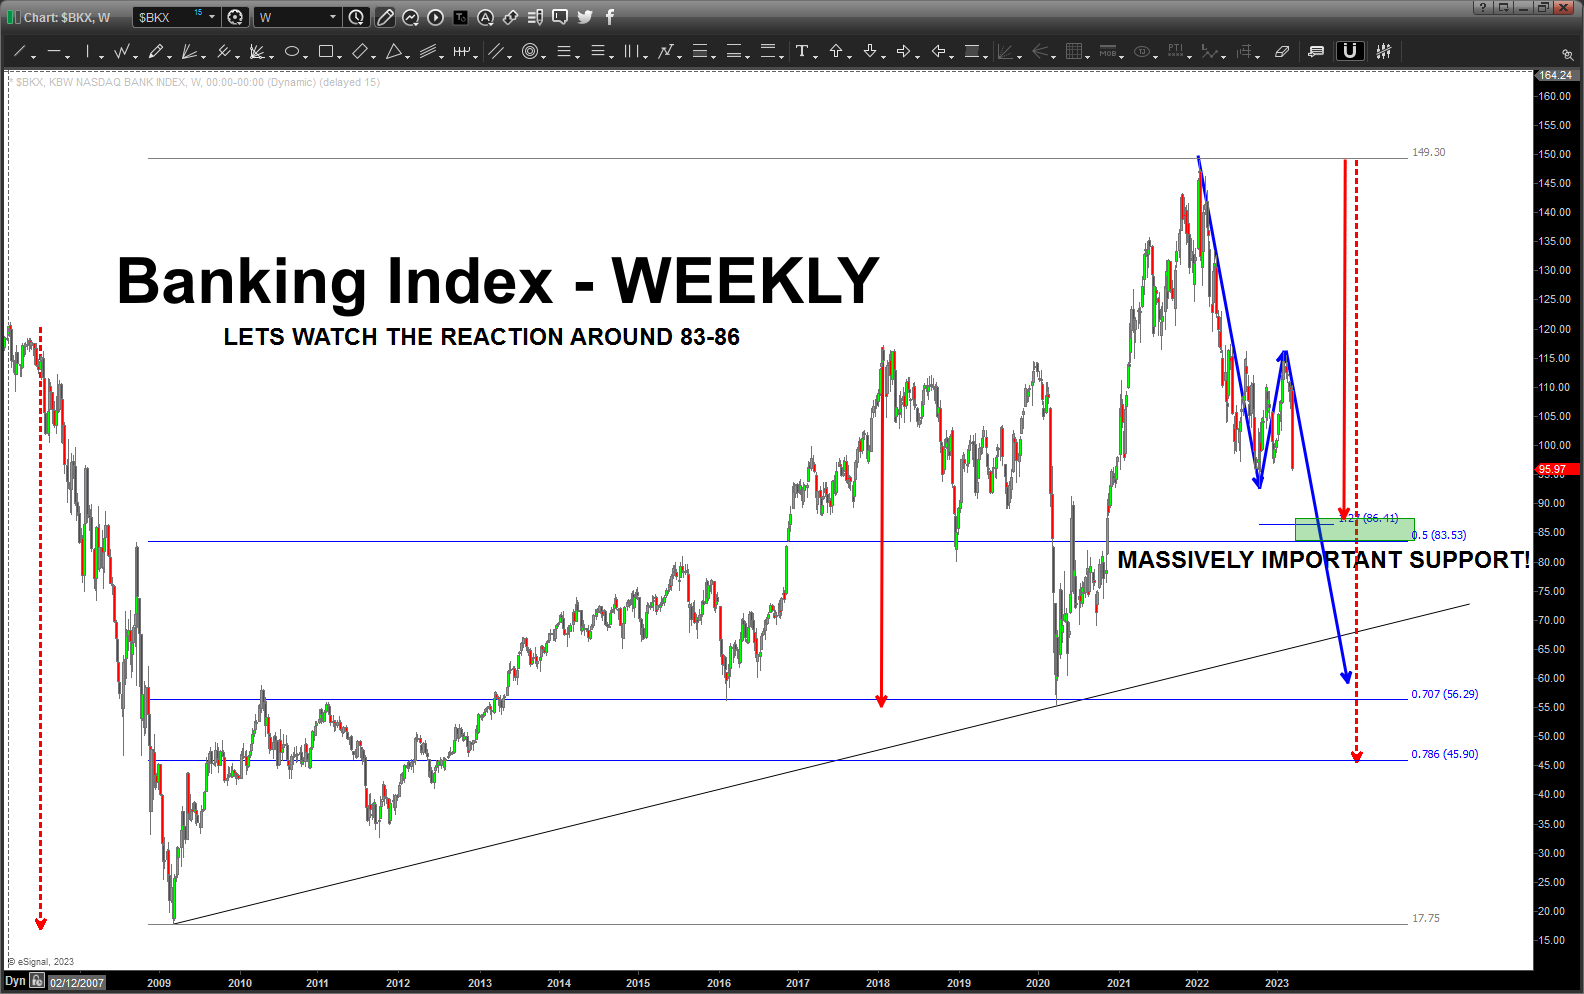
Here is the Banking Index PATTERN that we needed to watch and monitor. Folks, banks are everything. PERIOD. They lead us UP and they lead us DOWN. Something isn’t right at the circle K.
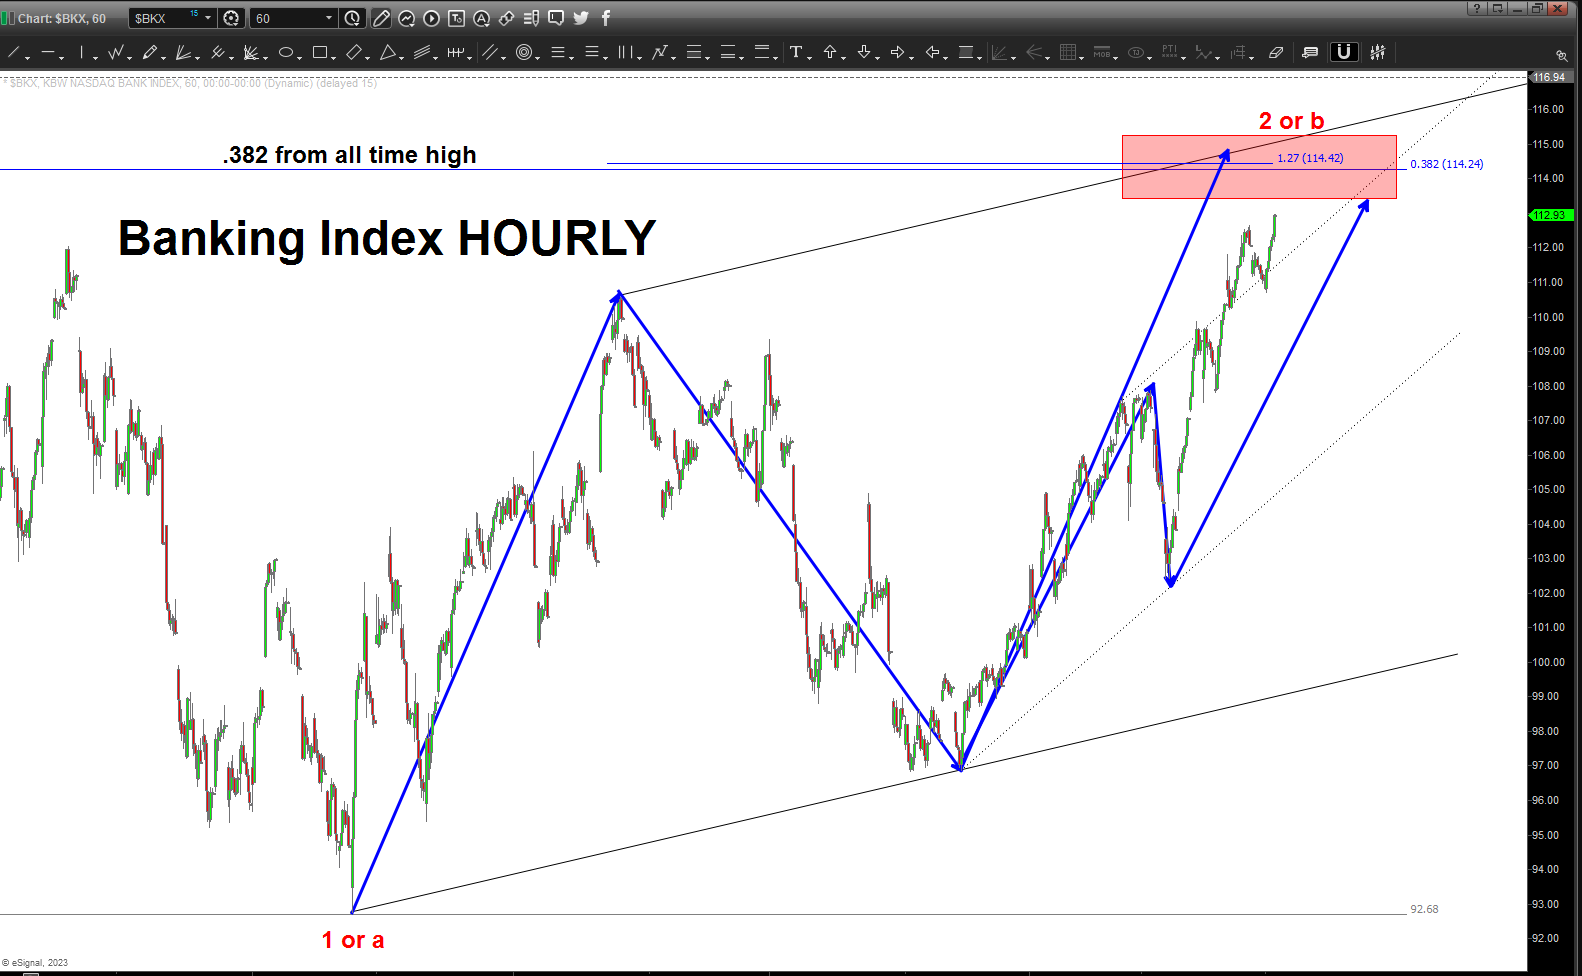
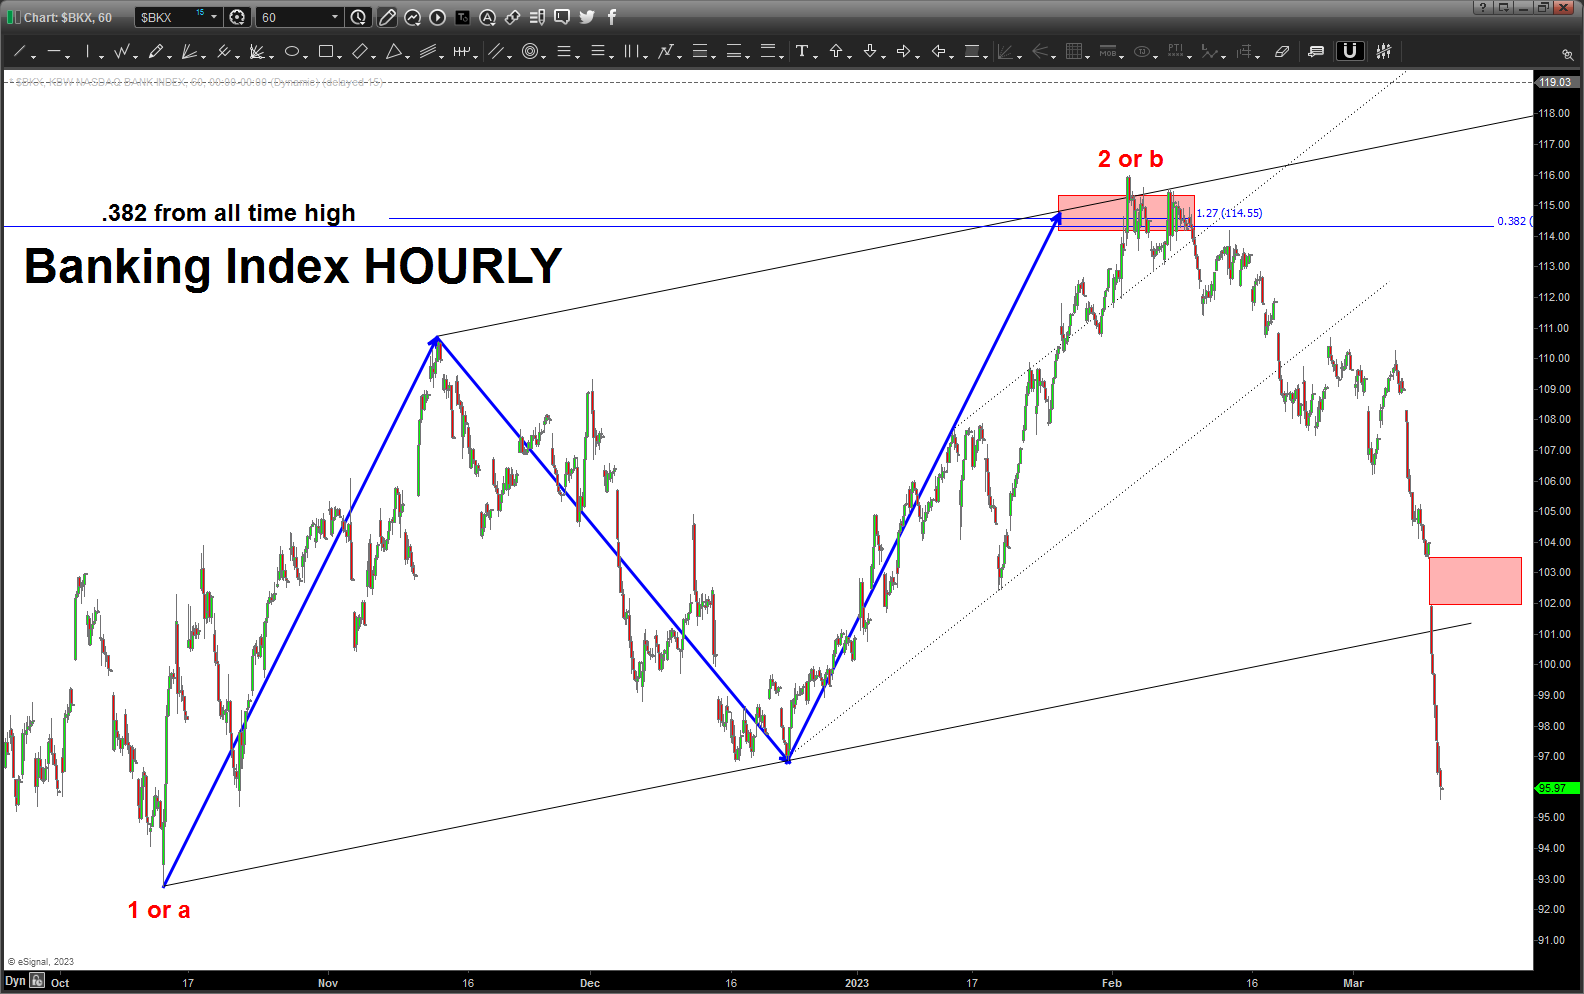
All things being equal, the wave that started today needs to finish 5 waves so I would step aside and let the banks pave the way … the BIG support is 83-86. Why? The red arrow is the largest price correction in the banking index since 2009. What happens at that level will be very key.
Next levels are the measured move down around 56-60 and the BIG ONE at 45-46.
Get your tinfoil hat peeps .. buckle up.
JNJ – March 08, 2023
Posted on March 8, 2023 2 Comments
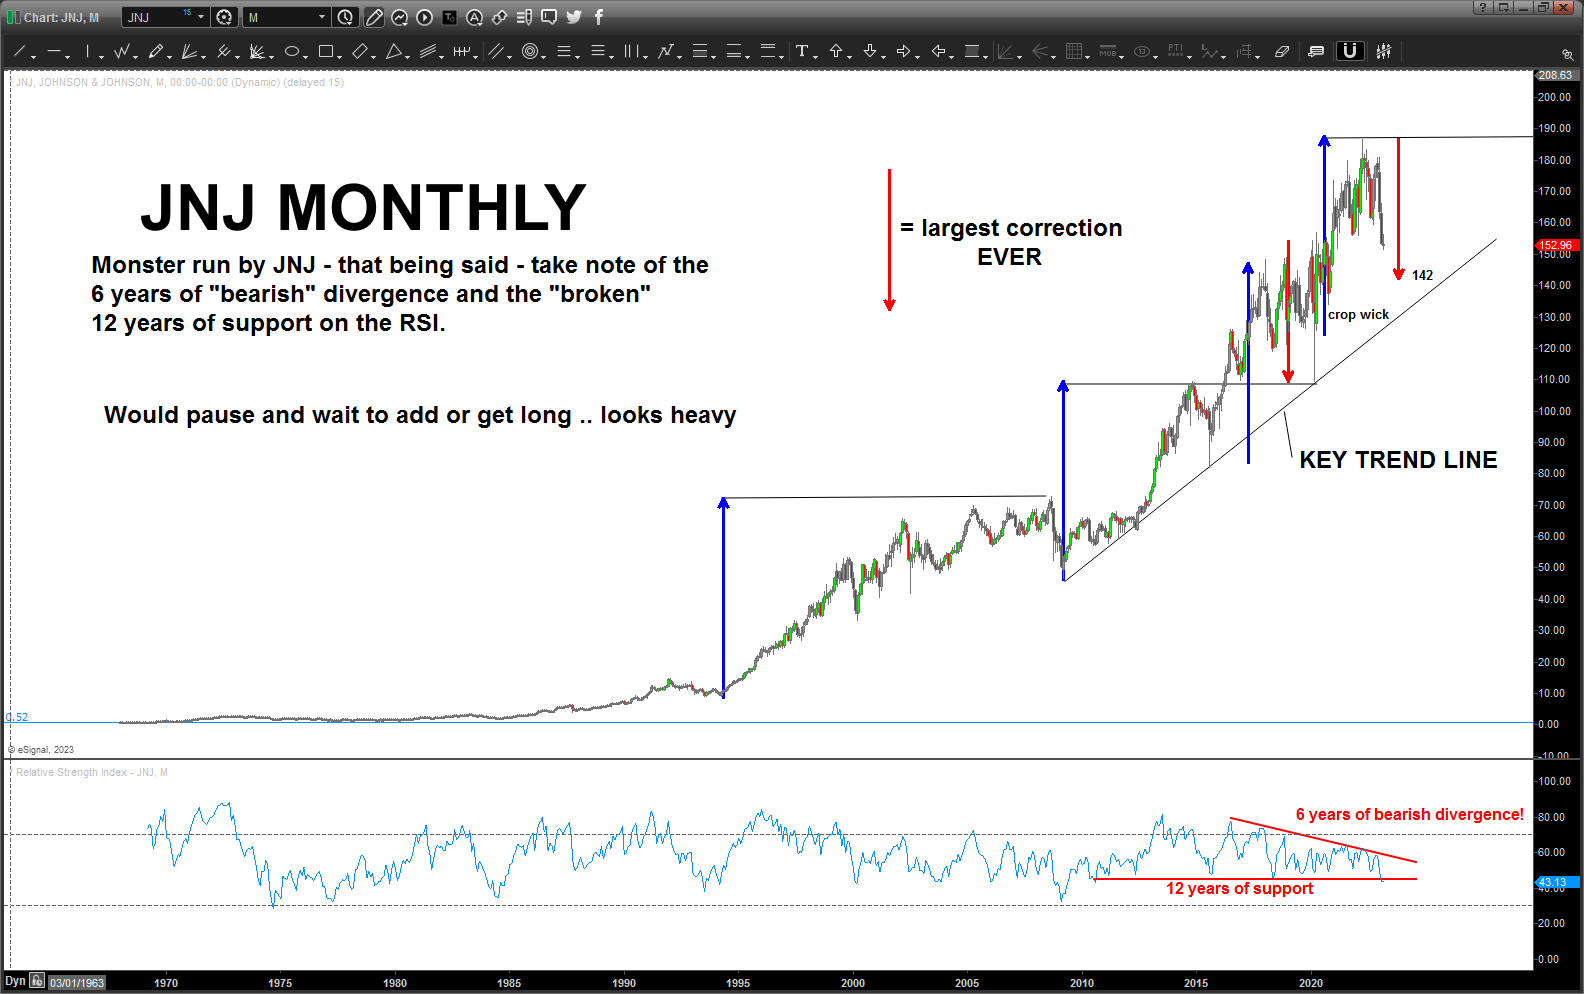
Note, measured move correction takes us down another 10 bucks .. that multi-year bearish divergence has me exercising CAUTION before adding or buying any JNJ at these levels.
Let’s see what happens at 142 and the key trend line …
TSLA (update) – March 08, 2023
Posted on March 8, 2023 1 Comment
Last update on TSLA: https://atomic-temporary-44460632.wpcomstaging.com/2023/02/25/tsla-update-february-25-2023/
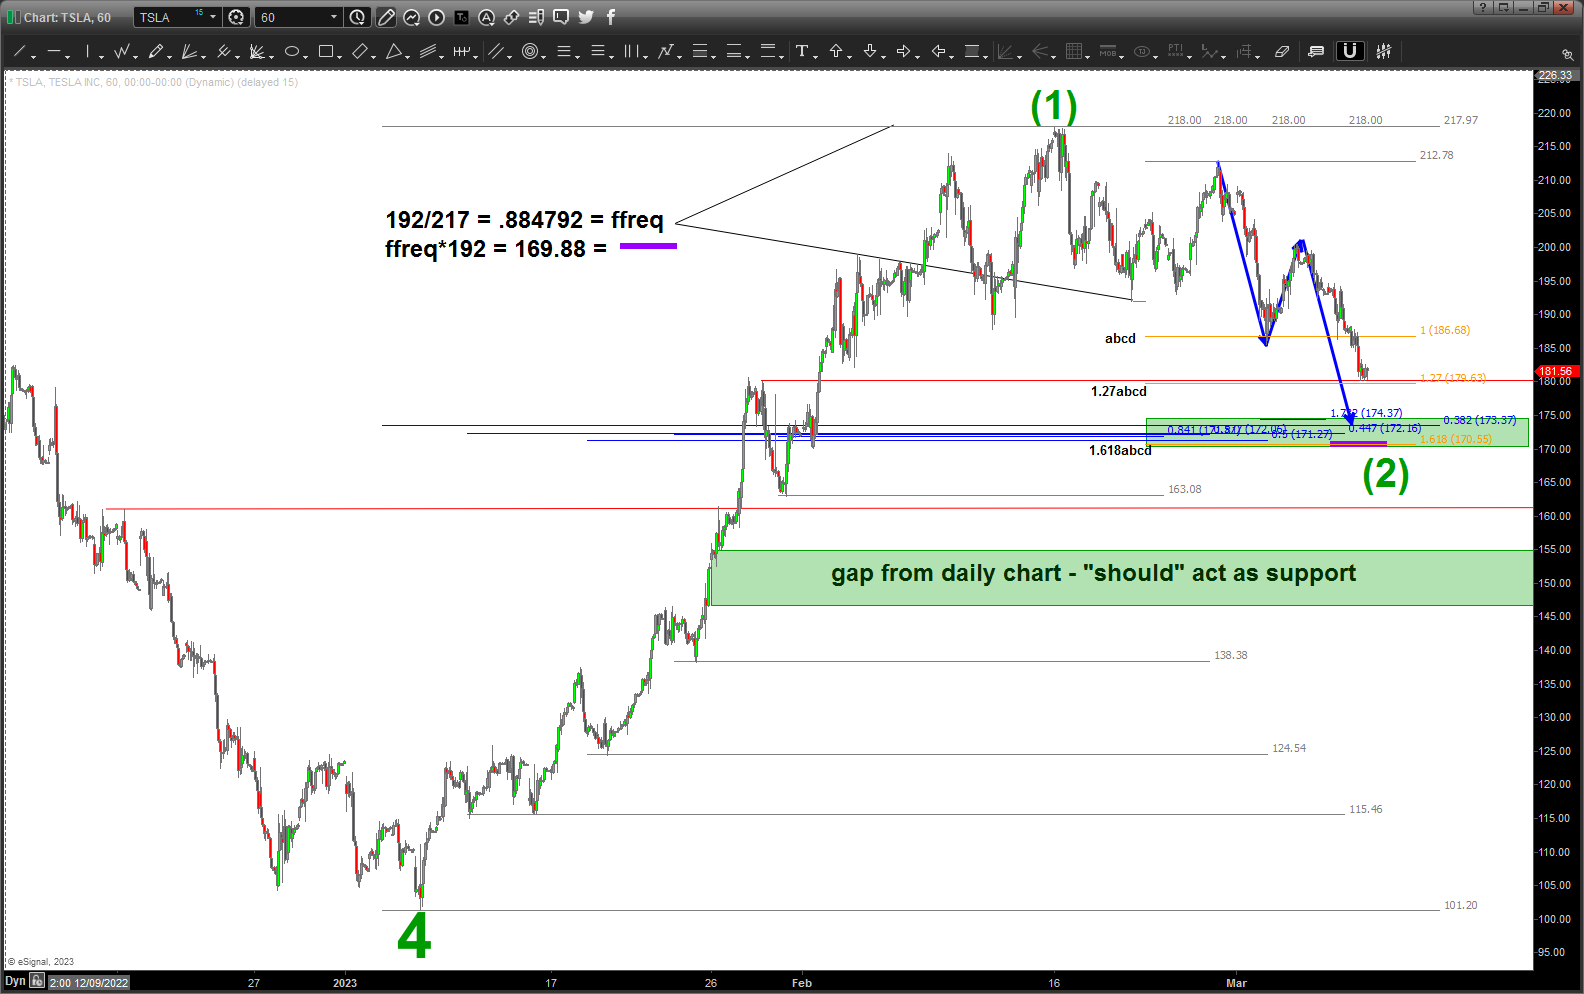
The move off the low down around 100 has been EXTREMELY powerful and that “USUALLY” (note quotes and all CAPS) lends to another LONG entry in/around the .382.
We have a LOT of math coming in from 170-175:
- 6 ratios
- 1.618 abcd
- fundamental frequency target
- abcd (blue arrows)
so, it appears we need to give the 170-175 BUY a shot. don’t get married to it … perhaps go in smaller than the 100 level but this is a “first chance” and from a “holding” mindset IF (always the BIG IF) my count is correct we are moving to new highs in TSLA … TBD and only TIME will tell.
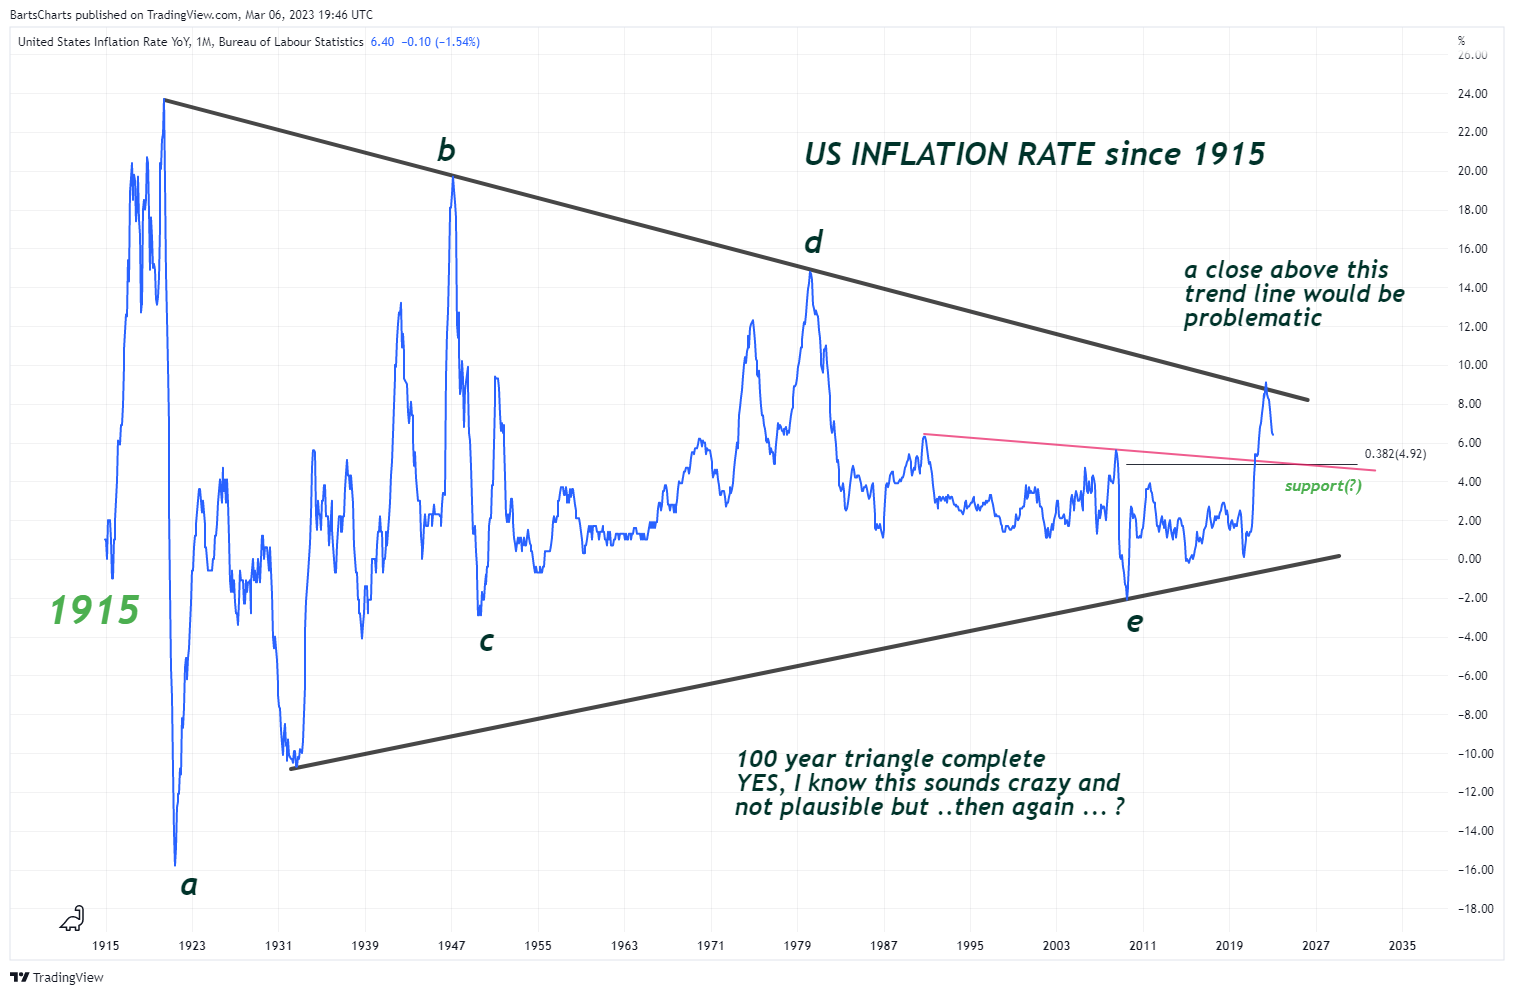
US Inflation Rate – March 06, 2023
Posted on March 6, 2023 4 Comments
A case can be made for a 100+ year triangle is complete and inflation, while pulling back now, has begun a bull market? Yes, I know that sounds crazy .. but, either way, would hate to see a close above the that upper down sloping trend line …