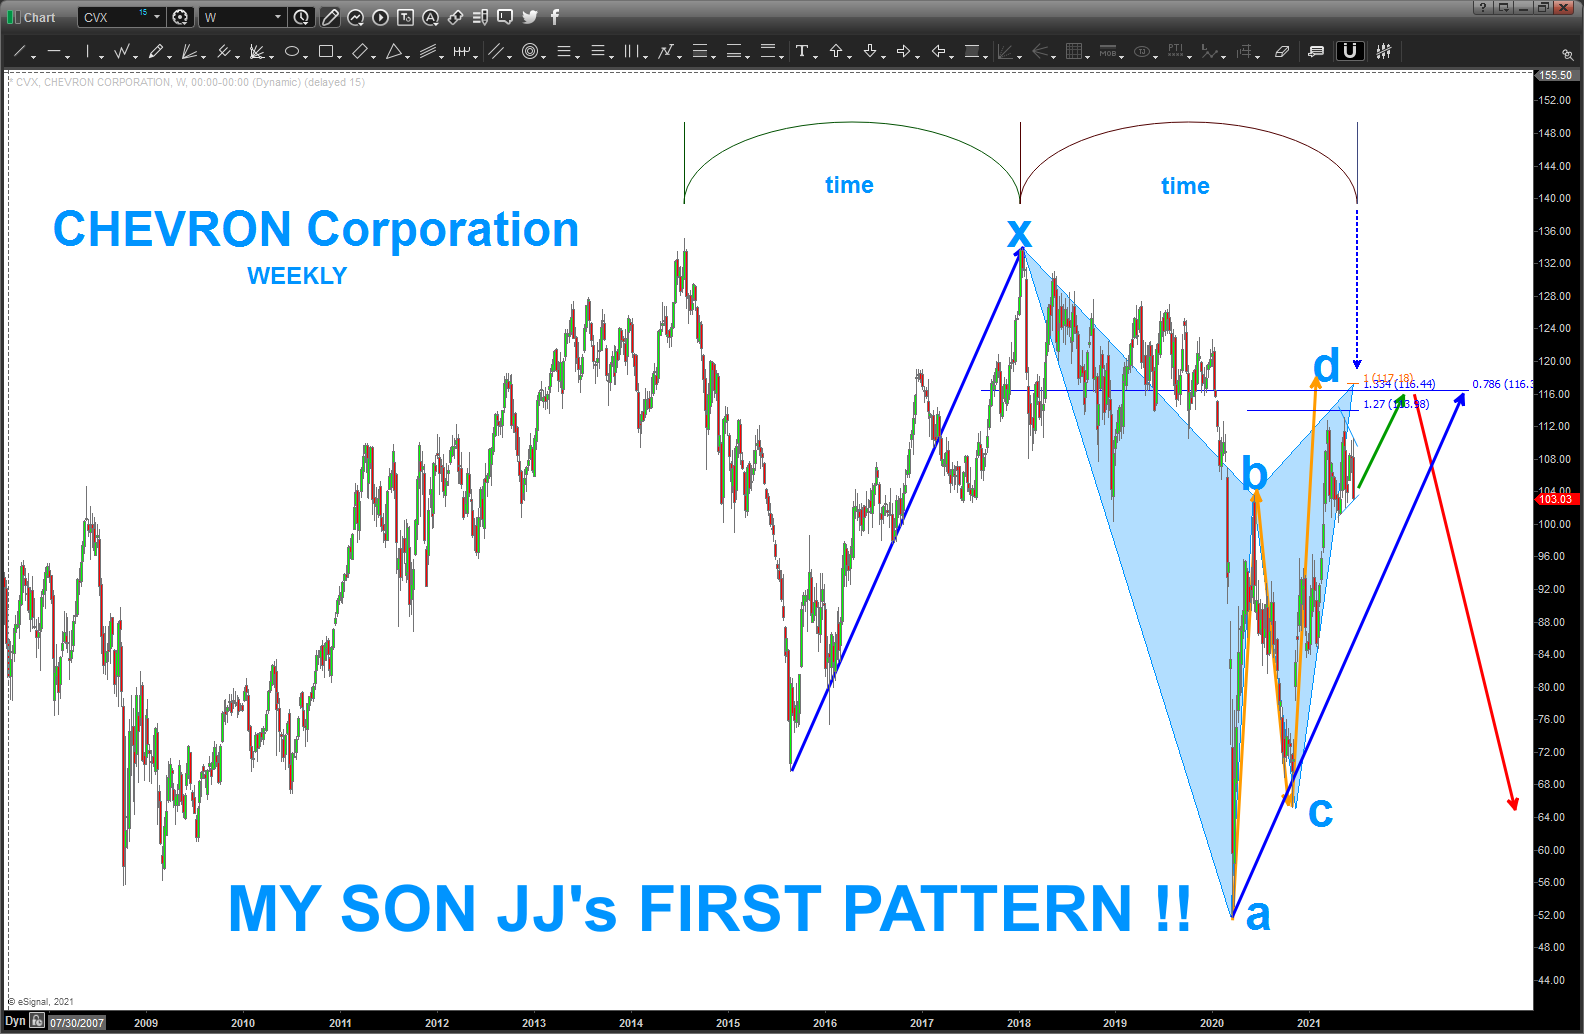
start em’ early …my son JJ’s first pattern!
Posted on June 20, 2021 1 Comment
and down the rabbit hole he goes … at least he has me “guiding” him although throughout his life he’s the one who I feel is parenting …
he’s questioning the “reason” that this works … but that will come, in time.
“…even the very hairs on your head are numbered.”
CVX – shows a triangle but some pretty thick thrust down to close last week. IF the triangle holds THEN we pop up into the sell zone and then … should be down.
note the timing component – believe next week will be key.
go get em’ JJ …
the Big Short (a pun)
Posted on June 14, 2021 Leave a Comment
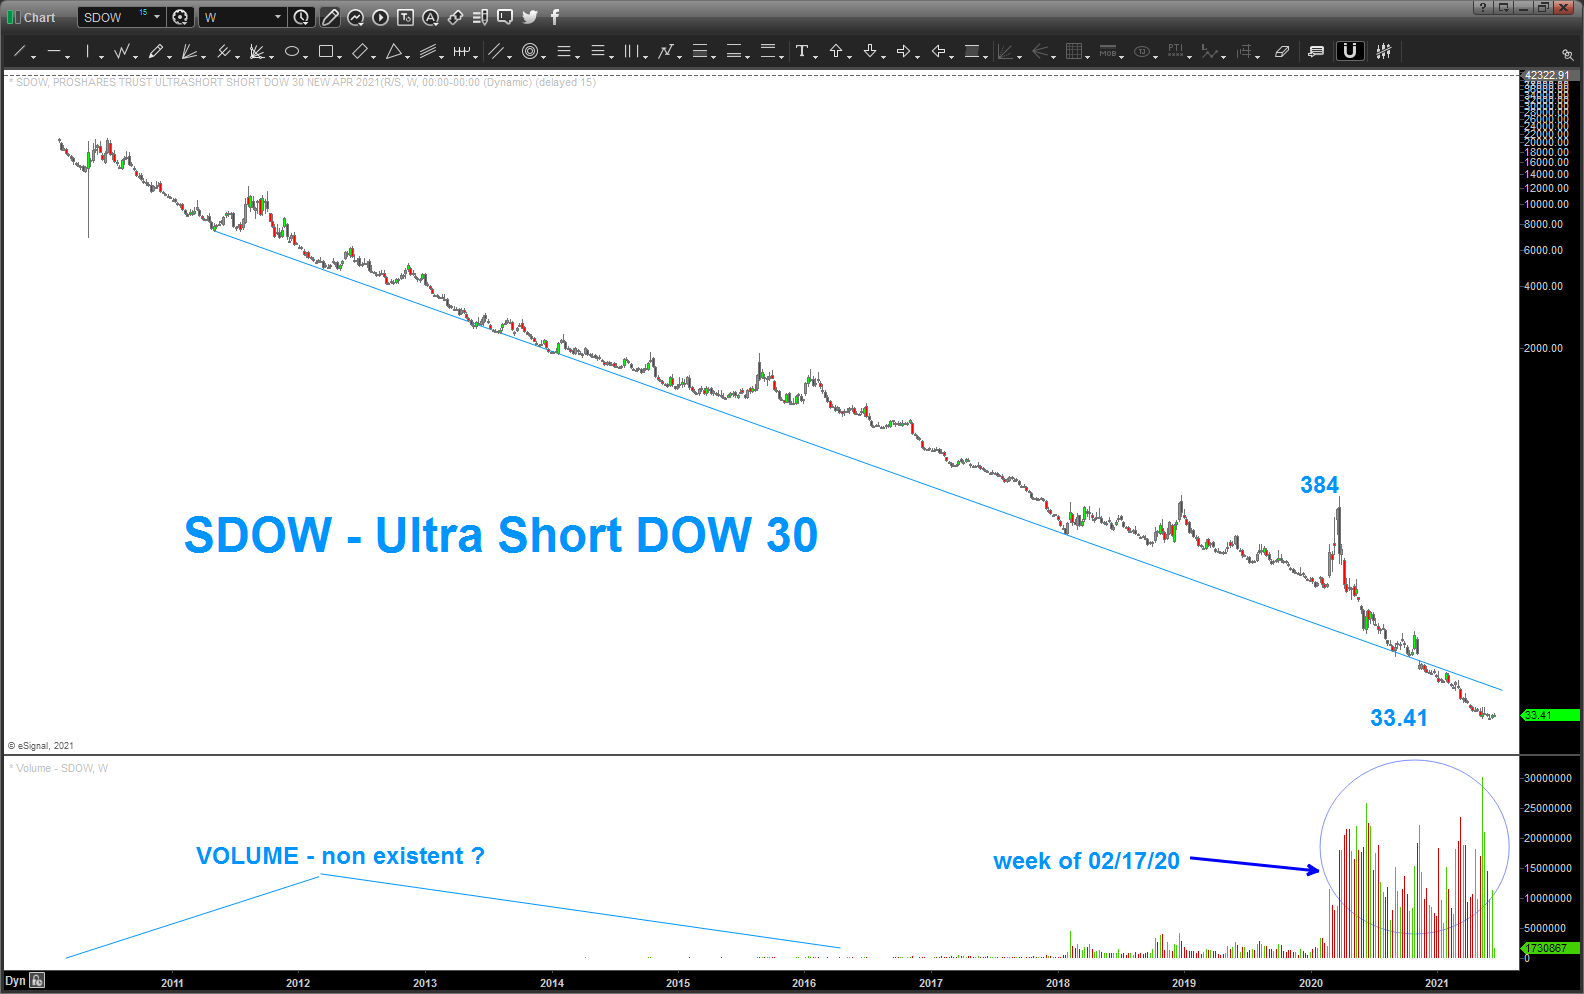
below you will find the SHORT DOW ETF called SDOW. it’s pretty fascinating if you think about it or look at it .. your preference.
basically right around the start of the pandemic around the week of 02/14/20 the volume was HUGE and the SDOW went on a nice run higher. well played … but since then it’s down basically 10X and there is still a lot of buying …
look to the far left and this ETF fell so far and nobody was interested and then last year hit and someone/somebody has been buying and selling this security …
now, of late, if you look closer to the last couple candles and corresponding volume you’ll see that the most BUYING volume ever has come in AND the price as pretty much stabilized at/around the low 30’s ….
you going to BUY SDOW down here …?
YEW ….
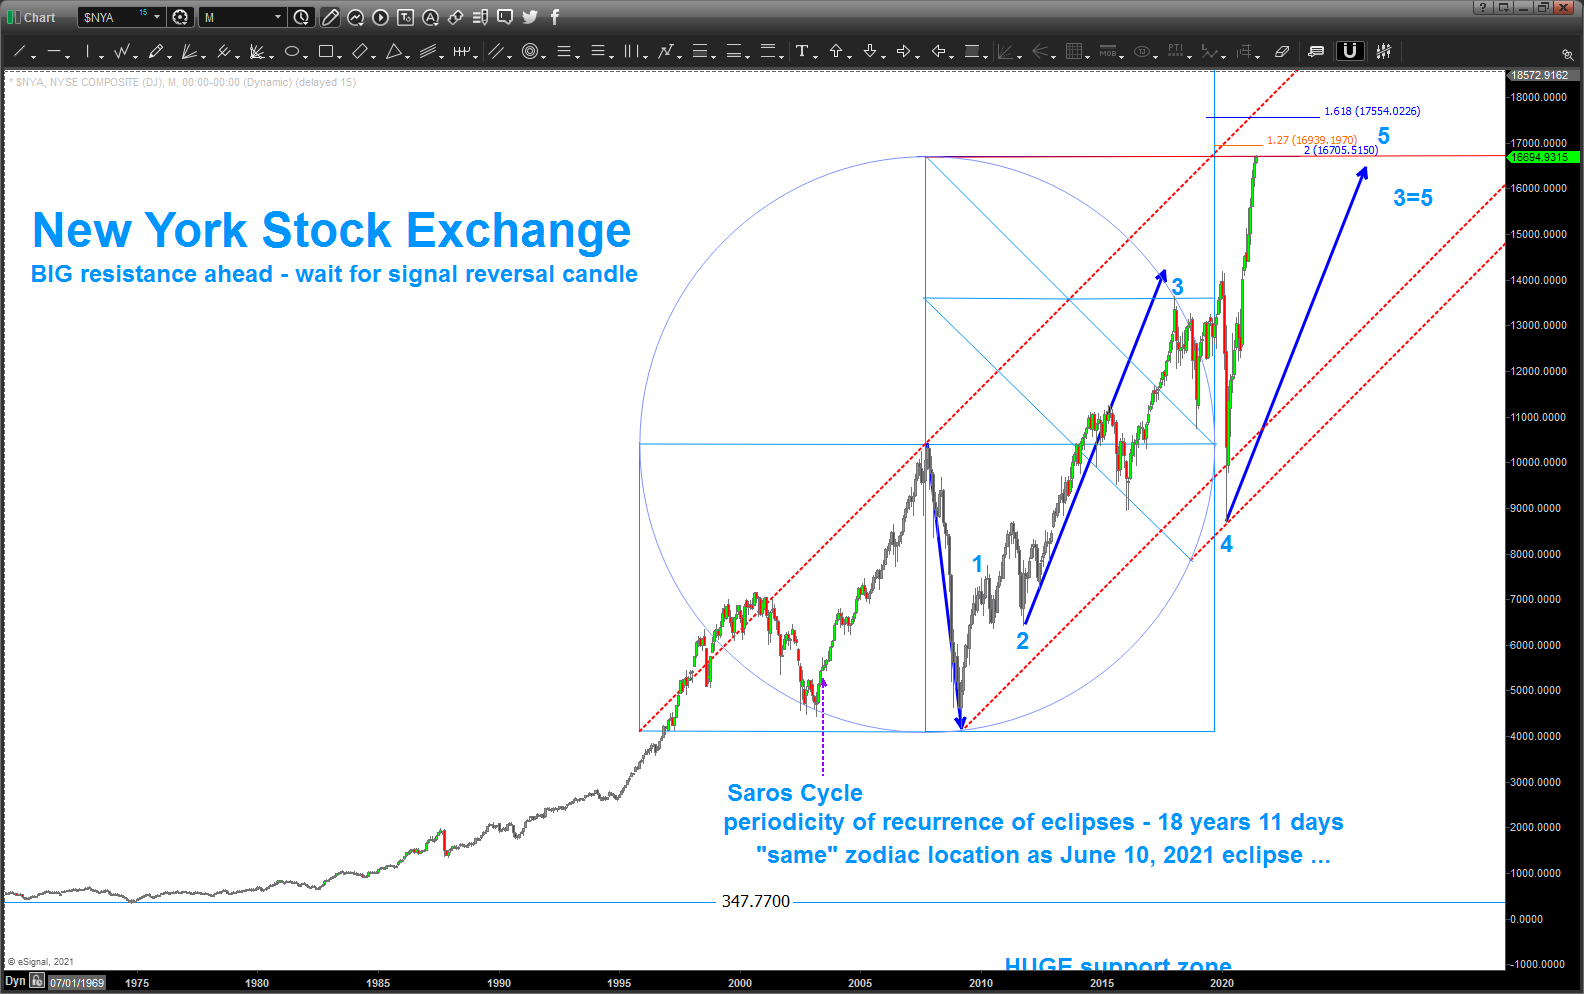
well look at that …
Posted on June 5, 2021 Leave a Comment
last post on the transports: https://atomic-temporary-44460632.wpcomstaging.com/2021/02/21/transports-a-lot-of-degrees-of-trend-coming-together-heads-up/
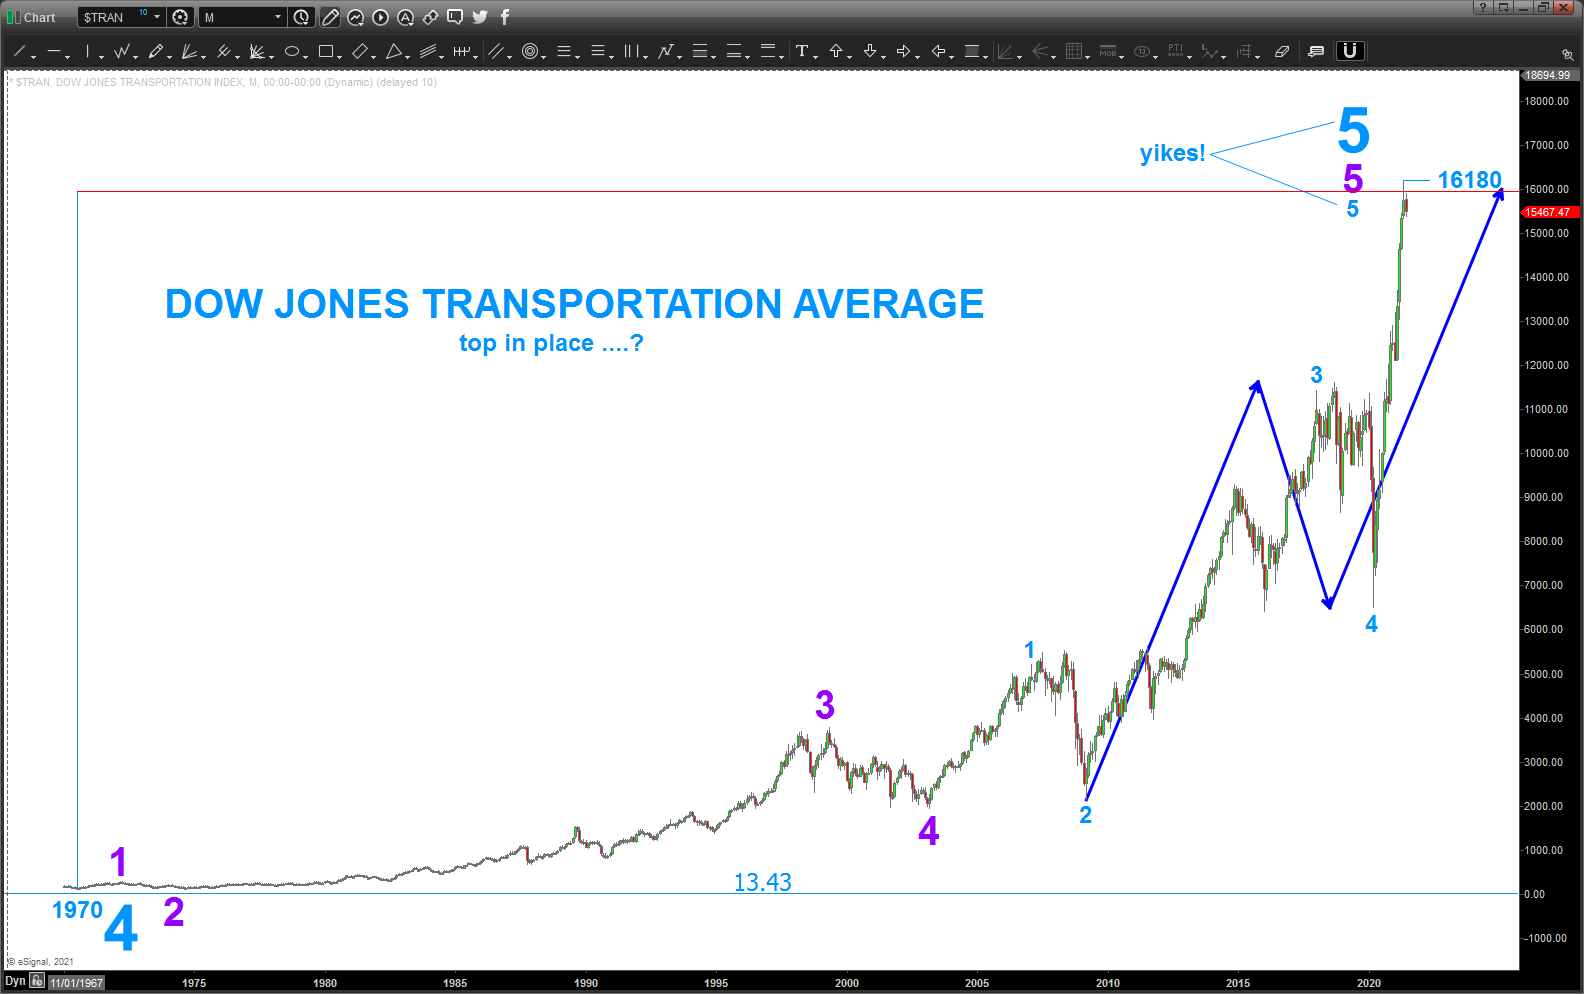
alert went off last week and the upper target zone on the DJ Transports has been hit ..on my monthly chart that level is 16180 and while I know a lot of you will just see a NUMBER and that’s cool but when you play w/ numbers EVERY day you see 1.618 … you study sooooo much that you understand “why” we don’t need decimal points and what they actually mean so you can move decimals point around.
if this is the high, I really have no idea if it is or it isn’t then the Architect has a really FUN sense of humor. think about it .. the “low” during the financial crisis on the cash SPX was 666. not kidding .. check it out. now, w/ one of the MAJOR indices topping out on the Golden Mean … well look at that.
here we go …
good weekend to everyone …
BITCOIN … need some energy/thrust to prove low in place
Posted on June 2, 2021 1 Comment
last post on Bitcoin: https://atomic-temporary-44460632.wpcomstaging.com/2021/05/23/bitcoin-so-far-making-sense/
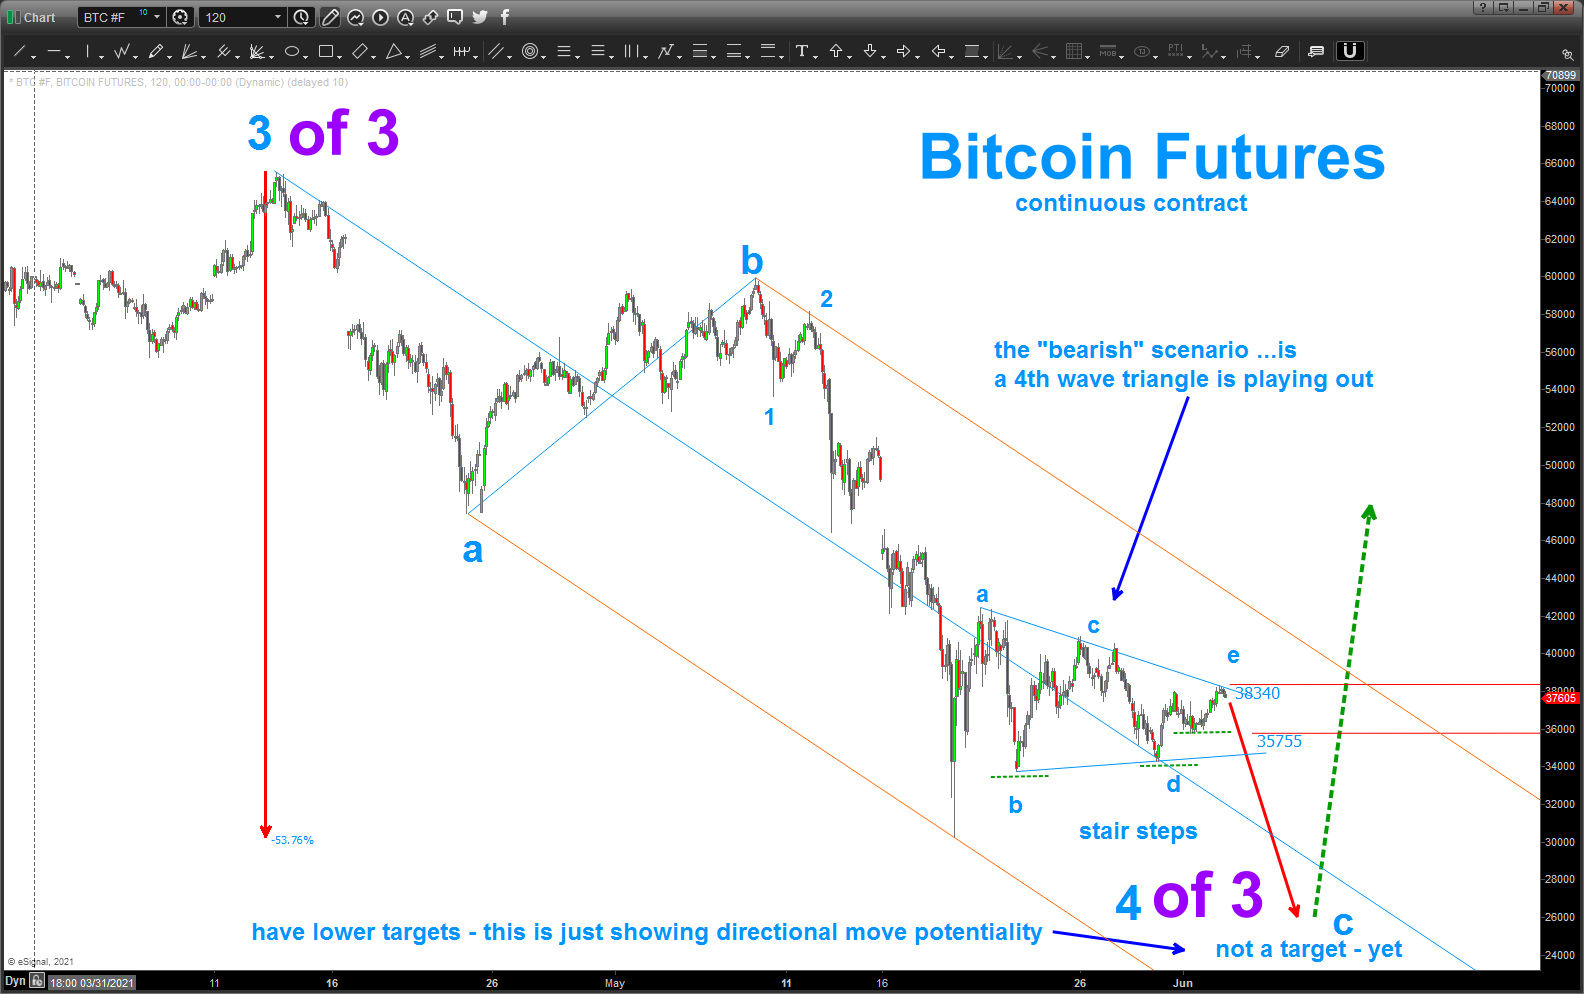
the chart below is the “bearish” short term case … as you can see from the title, right now, we have been making the stair steps of “higher lows” but it’s not a THRUSTING or MOMENTUM move like the one we saw off the low in/around 30K and the geometry/form is starting to “look and feel” like a 4th wave triangle …
so, need the 38,340 and 40,000 to get taken out to the upside by momentum and a daily close else we are going to be under some more pressure …
the good thing .. we have a clue where we are w/ both scenarios so we can plan accordingly.
in this case, the triangle, they “usually” occur in the 4th wave and then have sharp reversals … mid 20’s can be expected if the bearish triangle is in force.
if not, then the “stair steps” should hold and we are beginning a move into the 70’s …
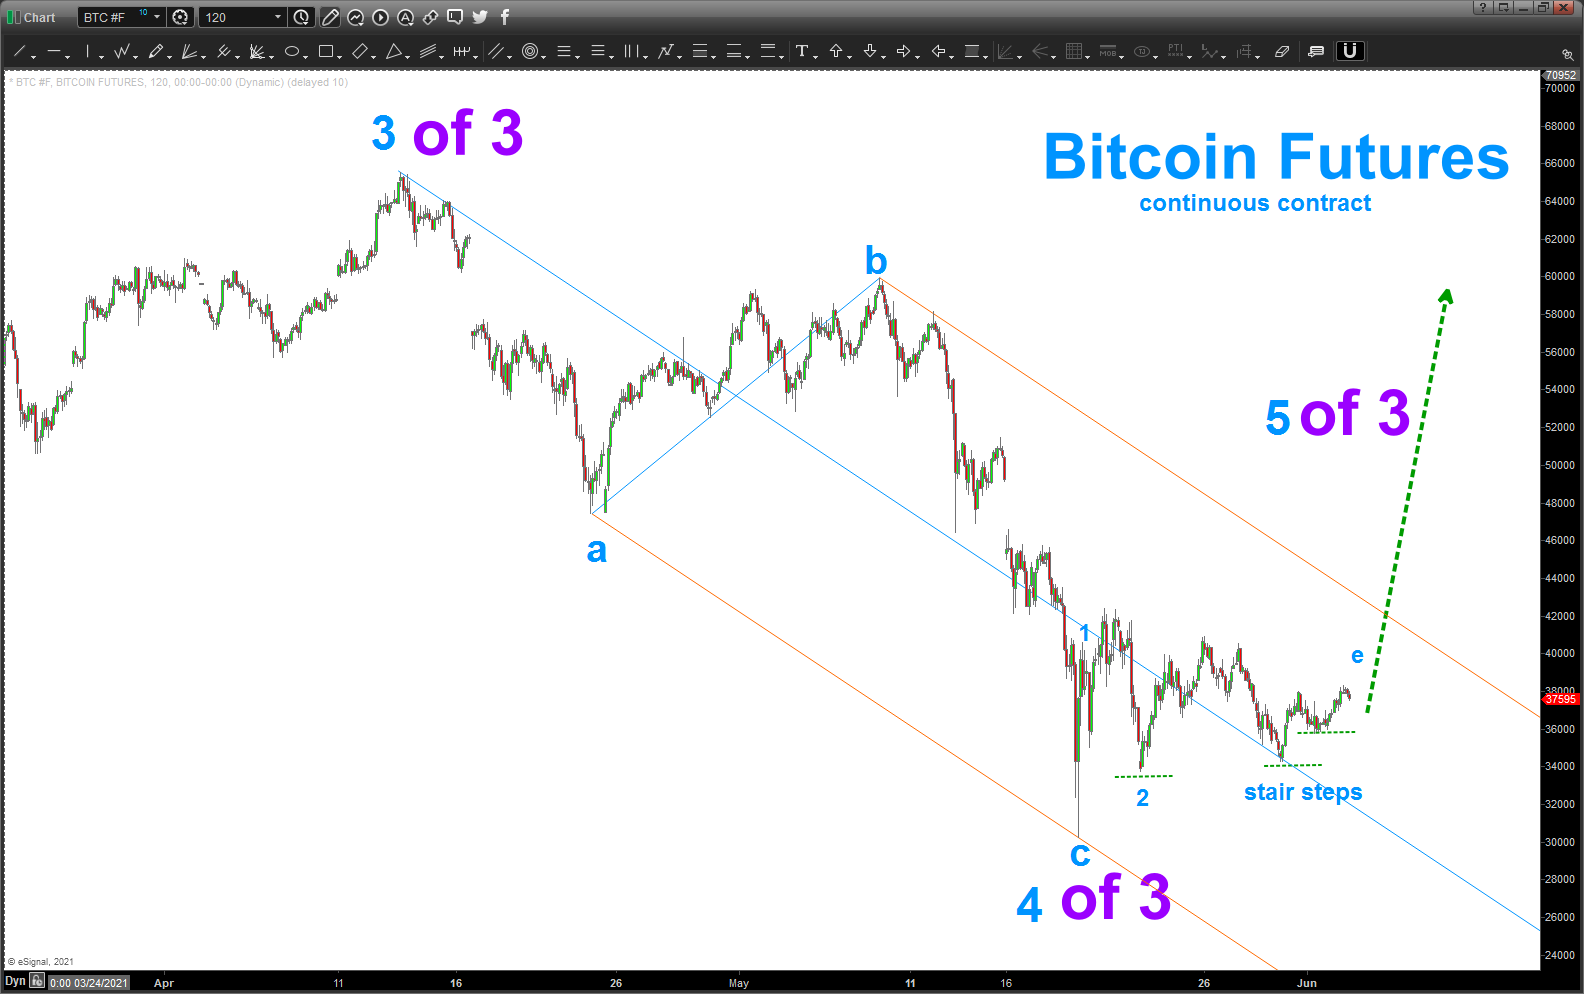
the chart below is the chart we are currently working off .. in this case we are following the bullish case that the spike low in/around 30K was the end of the C wave and we are going to advance …
need to see some thrust/momentum UP to validate the low is in place … so far, that is our running gameplan.
truth in advertising, always, on my blog … the bearish triangle gains traction the longer we just limp along like the dead cat bounce this might be …
XLP/NYA – wow what a level
Posted on May 27, 2021 Leave a Comment
wait for a close ABOVE the dashed green line to short stocks.
last post on XLP/NYA: https://atomic-temporary-44460632.wpcomstaging.com/2021/05/13/xlp-nya-at-it-again/
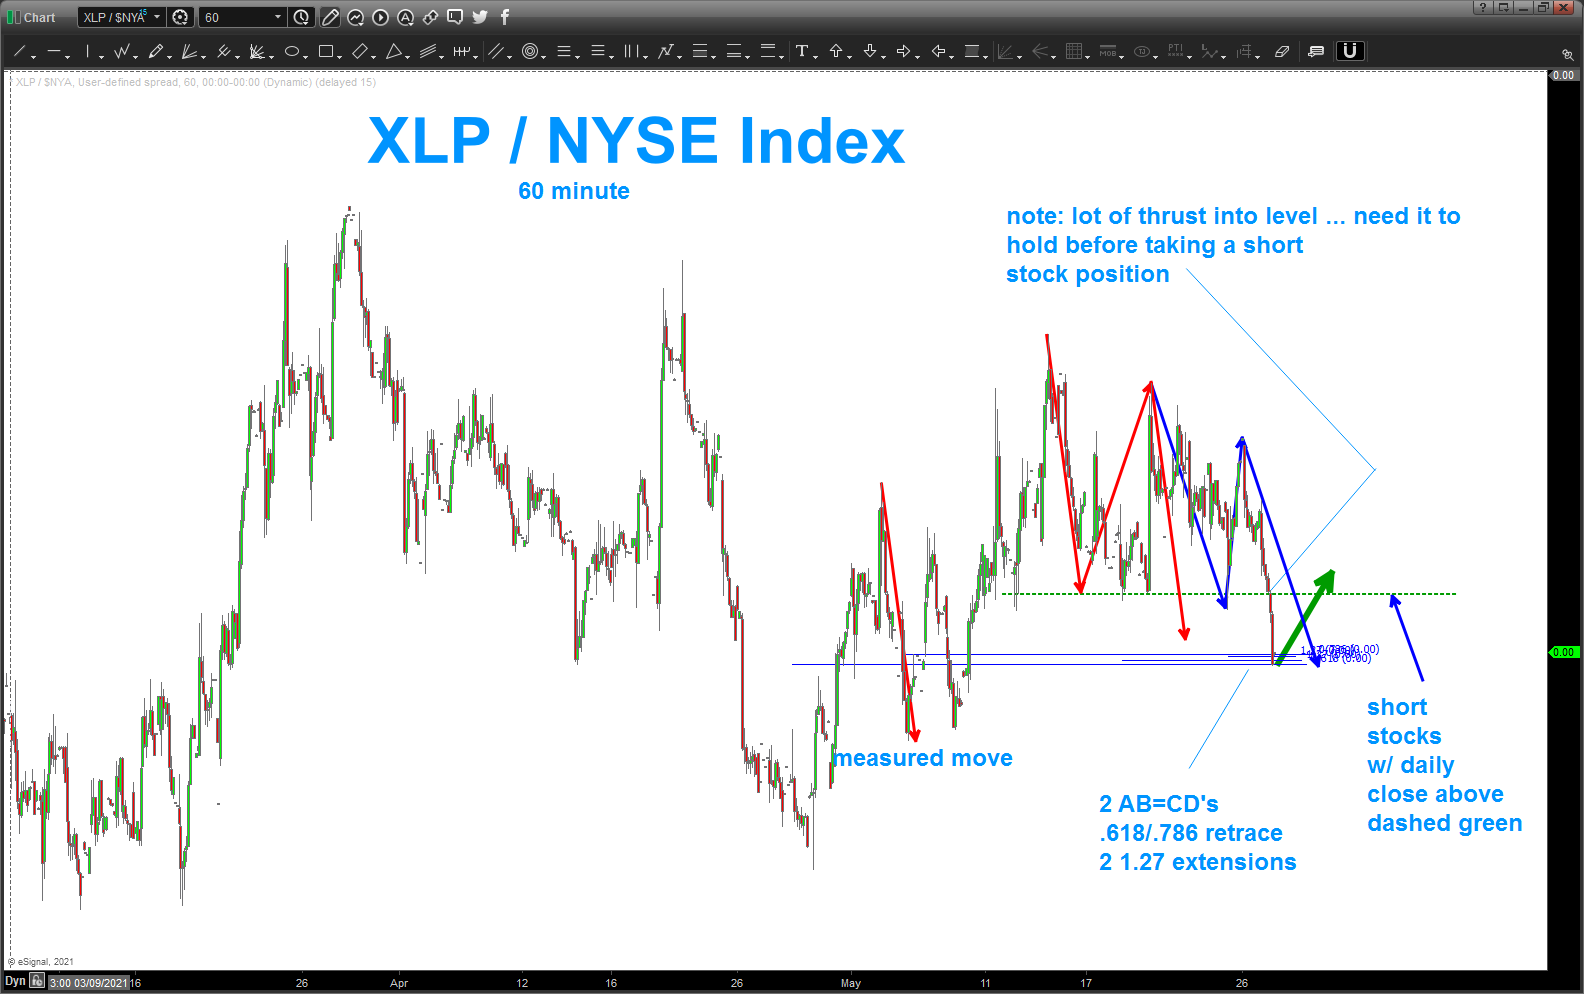
we have 6 ratios at the low on the ratio – that SHOULD provide monstrous support … but look at the thrust into the level. begs of caution …
so, check out the ratio on Monday and next week look for a daily close ABOVE The dashed green line to short stocks ..
Loonie at a critical level
Posted on May 26, 2021 Leave a Comment
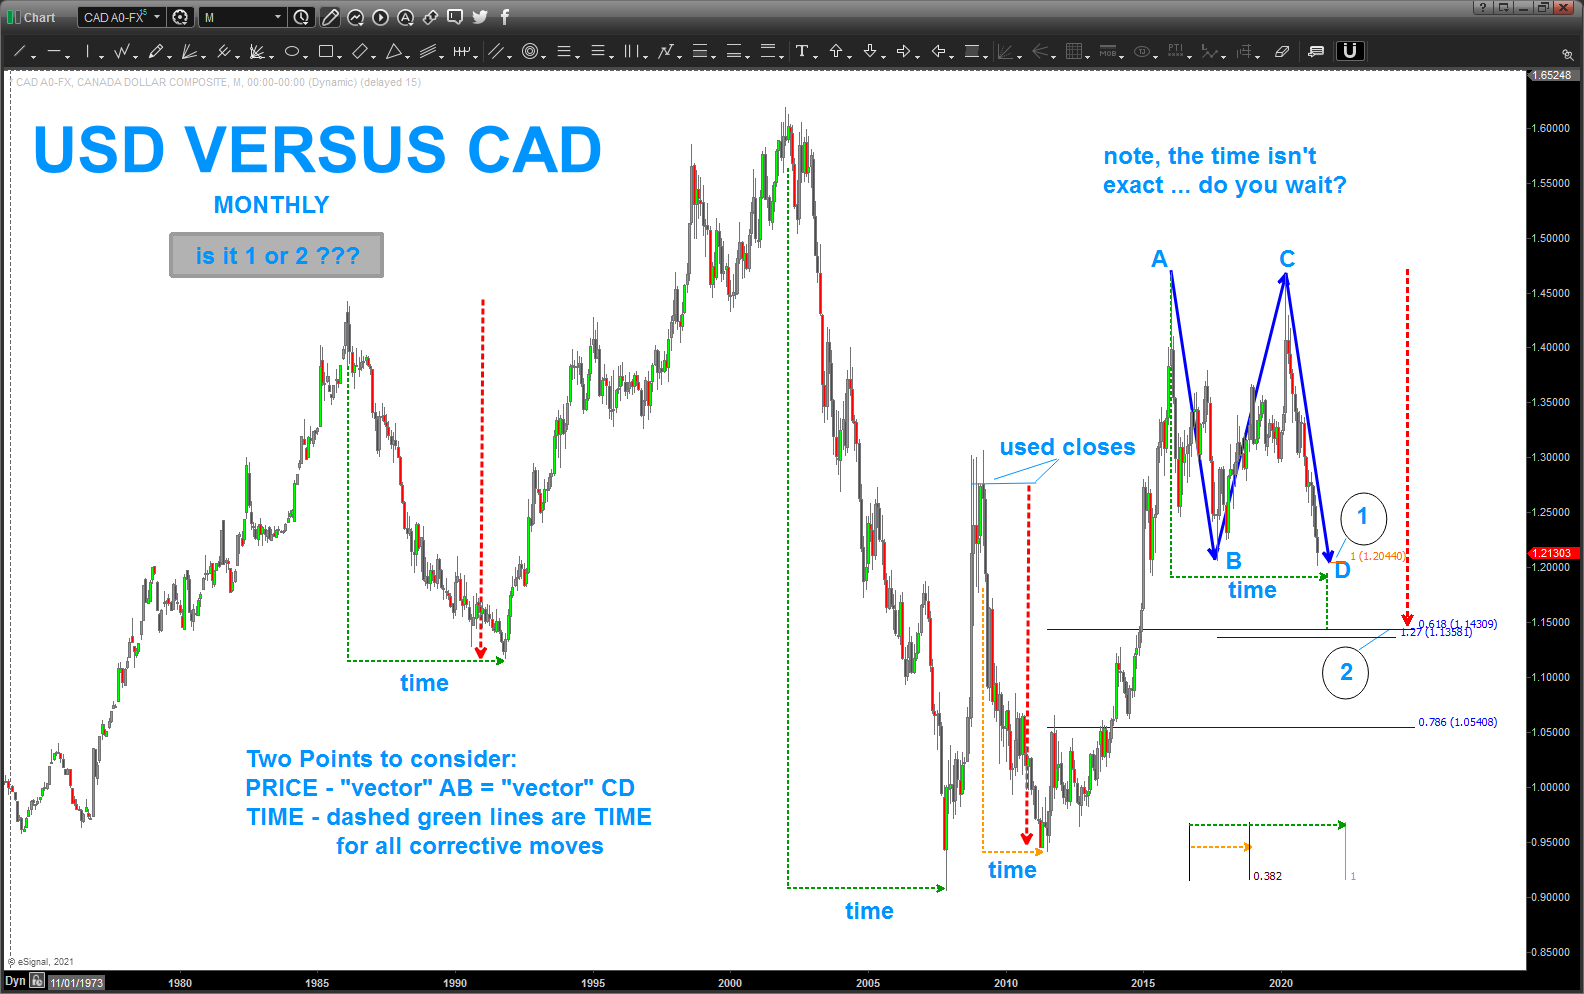
LOVE the Loonie … as you can see below, IF (the big IF) you can catch a wave this FX pair likes to run .. in either direction. well here comes a wave …
at 1 we have the classic AB=CD and, at least for now, it is holding …
at 2 we have a lot of MATH coming together along w/ a corrective (dashed red line) move that has present on most EVERY major corrective pullback.
w/in both above (1 and 2) we have the TIME dashed green line … that’s pretty key to me. Something (hint hint look up at the sky at night) has been responsible for the corrective TIME of EVERY MOVE DOWN since the beginning. a measured move in time, if you will. if your wondering, the dashed orange line is of course harmonically related by fibo .382.
guess what, I’ll WAIT for that … and that’s the end of the summer, and I’ll table the Loonie but I wanted to show the power of TIME and PRICE combined. Guess what, if it doesn’t work, there’s 50+ other currency pairs. I’m trying after so so many years fighting to make this easy and enjoyable …
US Dollar Index and Euro … come to papa!
Posted on May 23, 2021 1 Comment
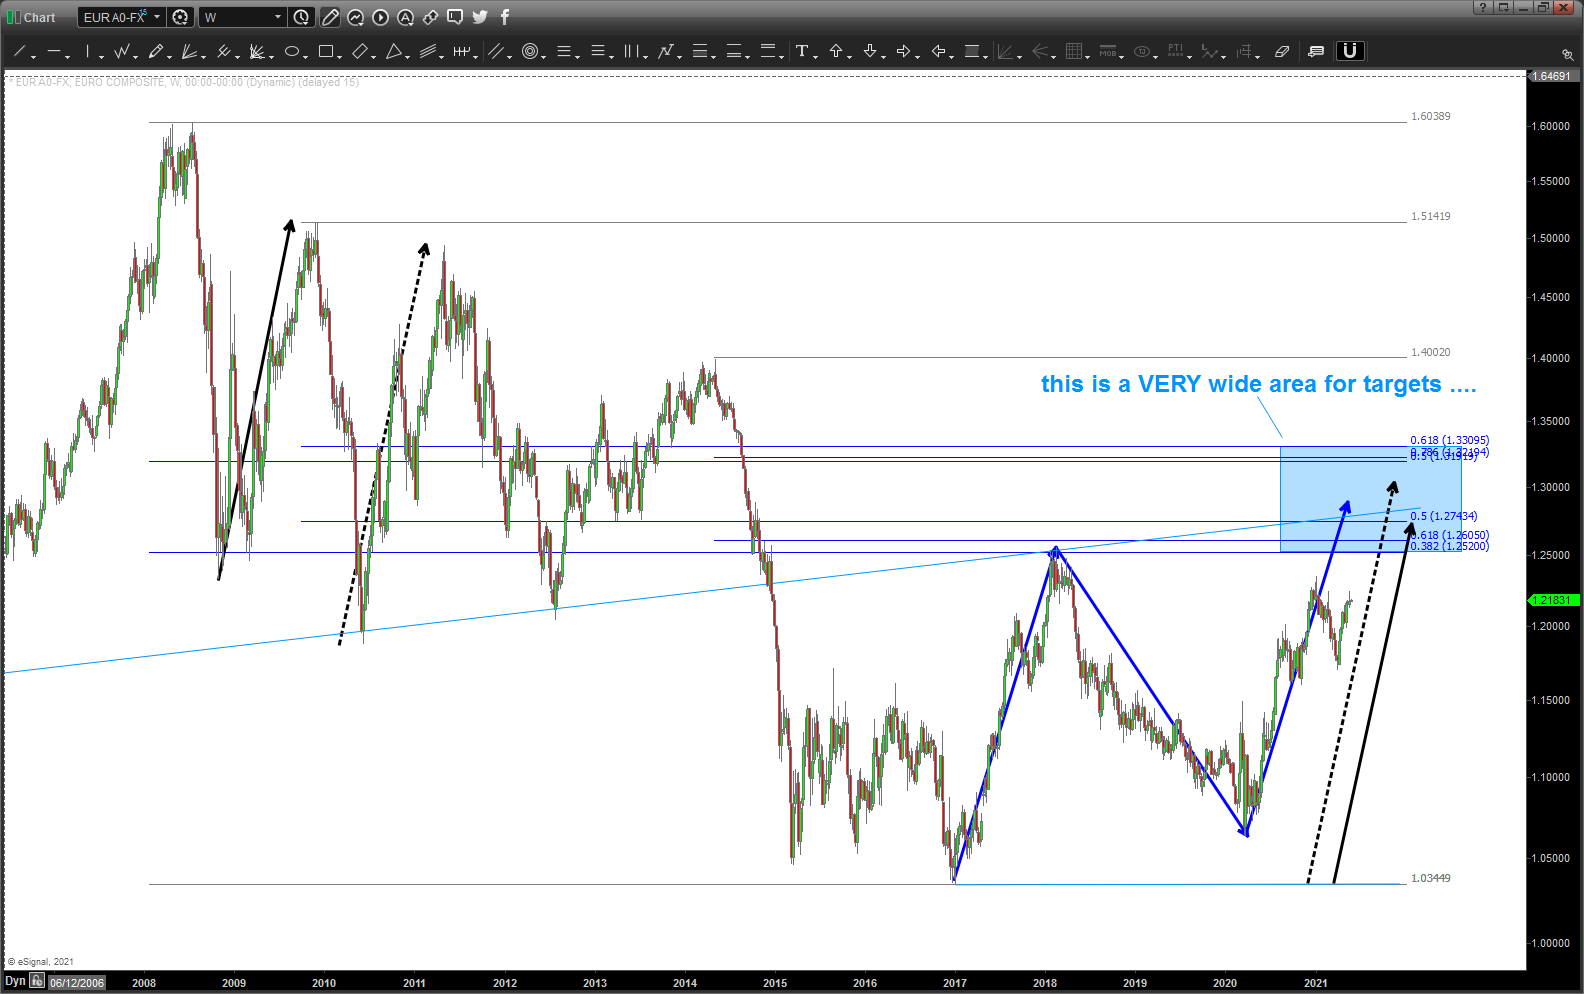
here is the EUR vs USD. note, a pretty wide band of target zones and when working w/ FX that’s just too much risk …
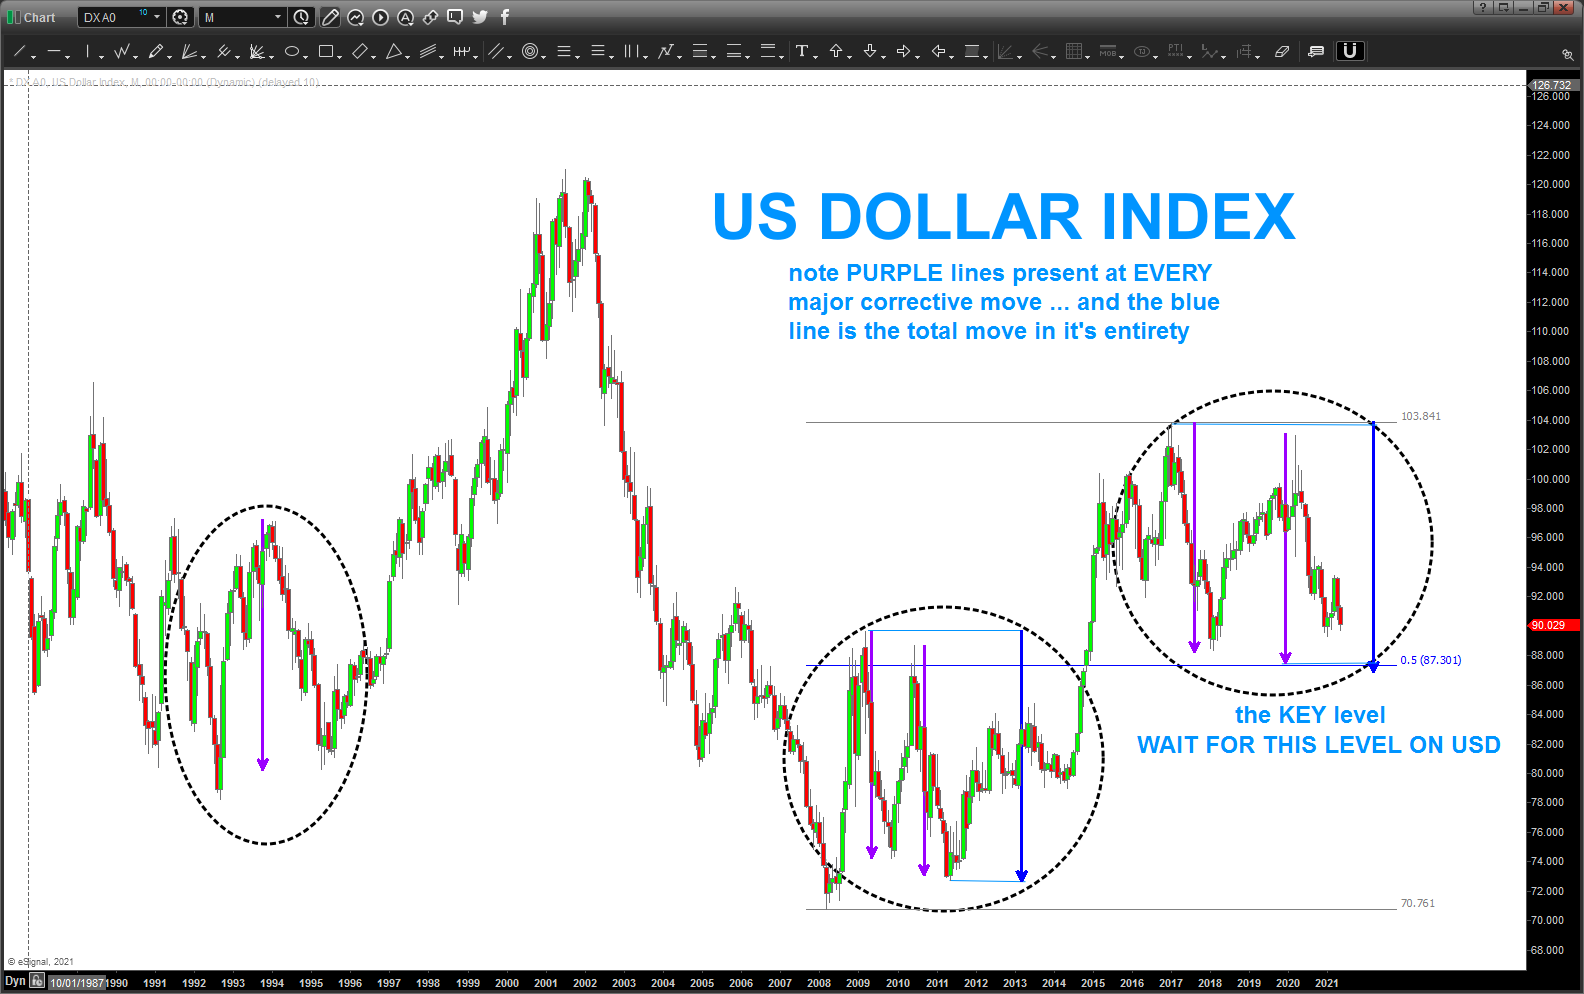
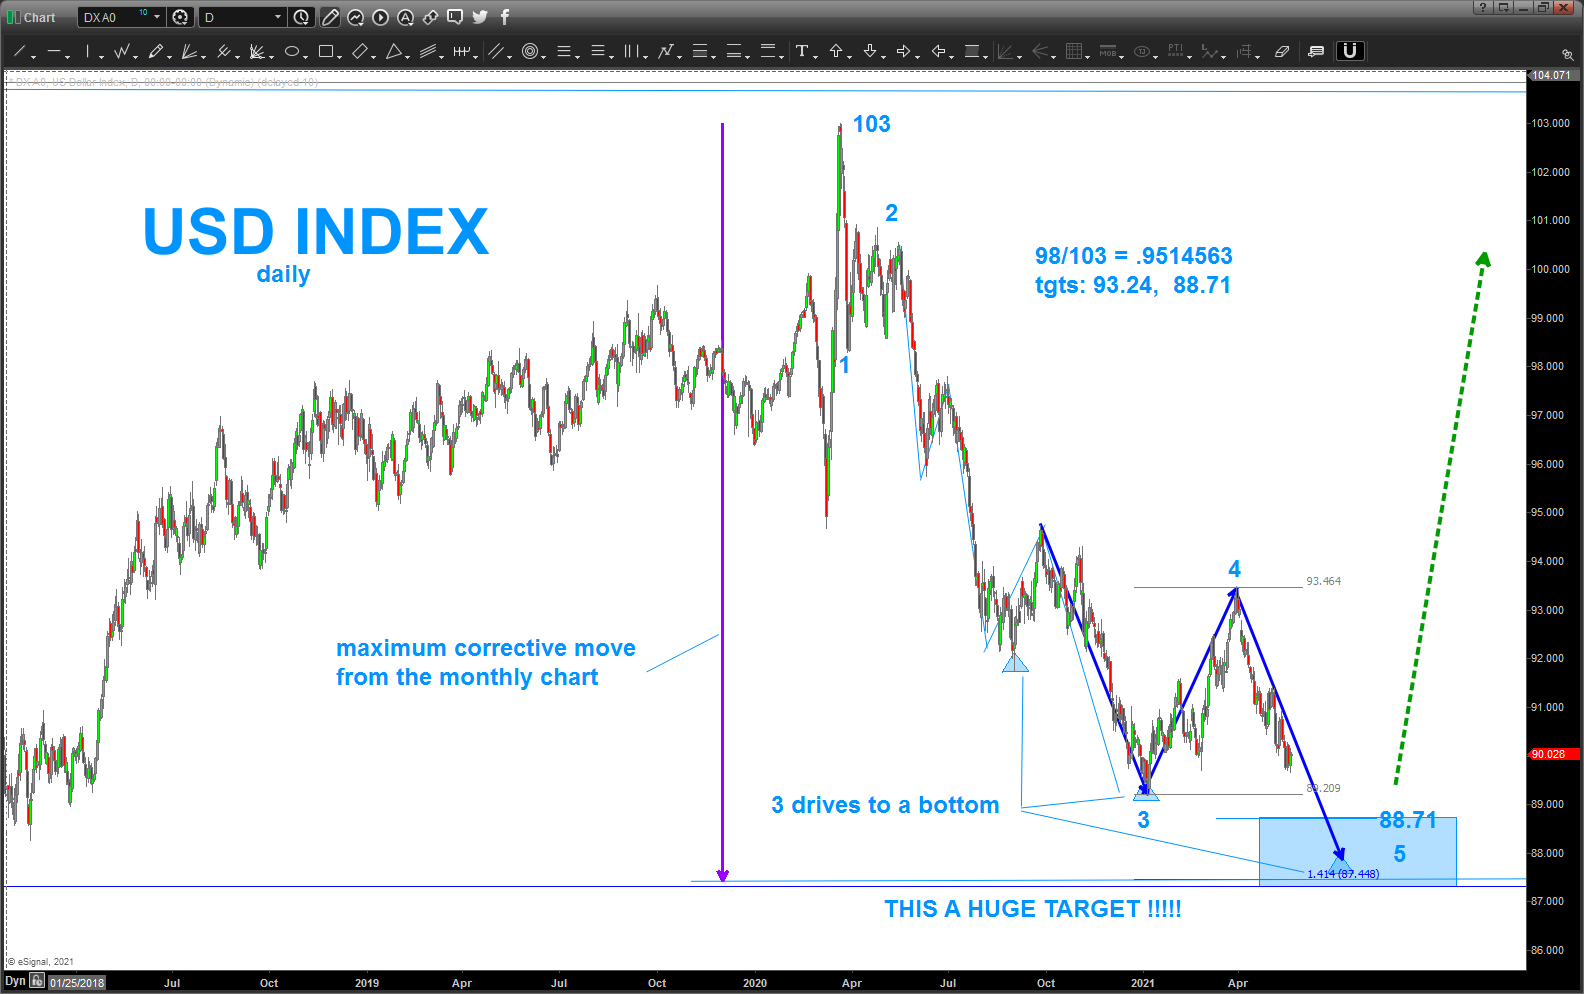
so, a majority of the USD Index is made of Euro so what is the USD doing and we can use that as a mirror image …man, what a target zone on the USD!
Bitcoin …so far, making sense
Posted on May 23, 2021 1 Comment
last post on Bitcoin: https://atomic-temporary-44460632.wpcomstaging.com/2021/05/12/bitcoin-update-2/
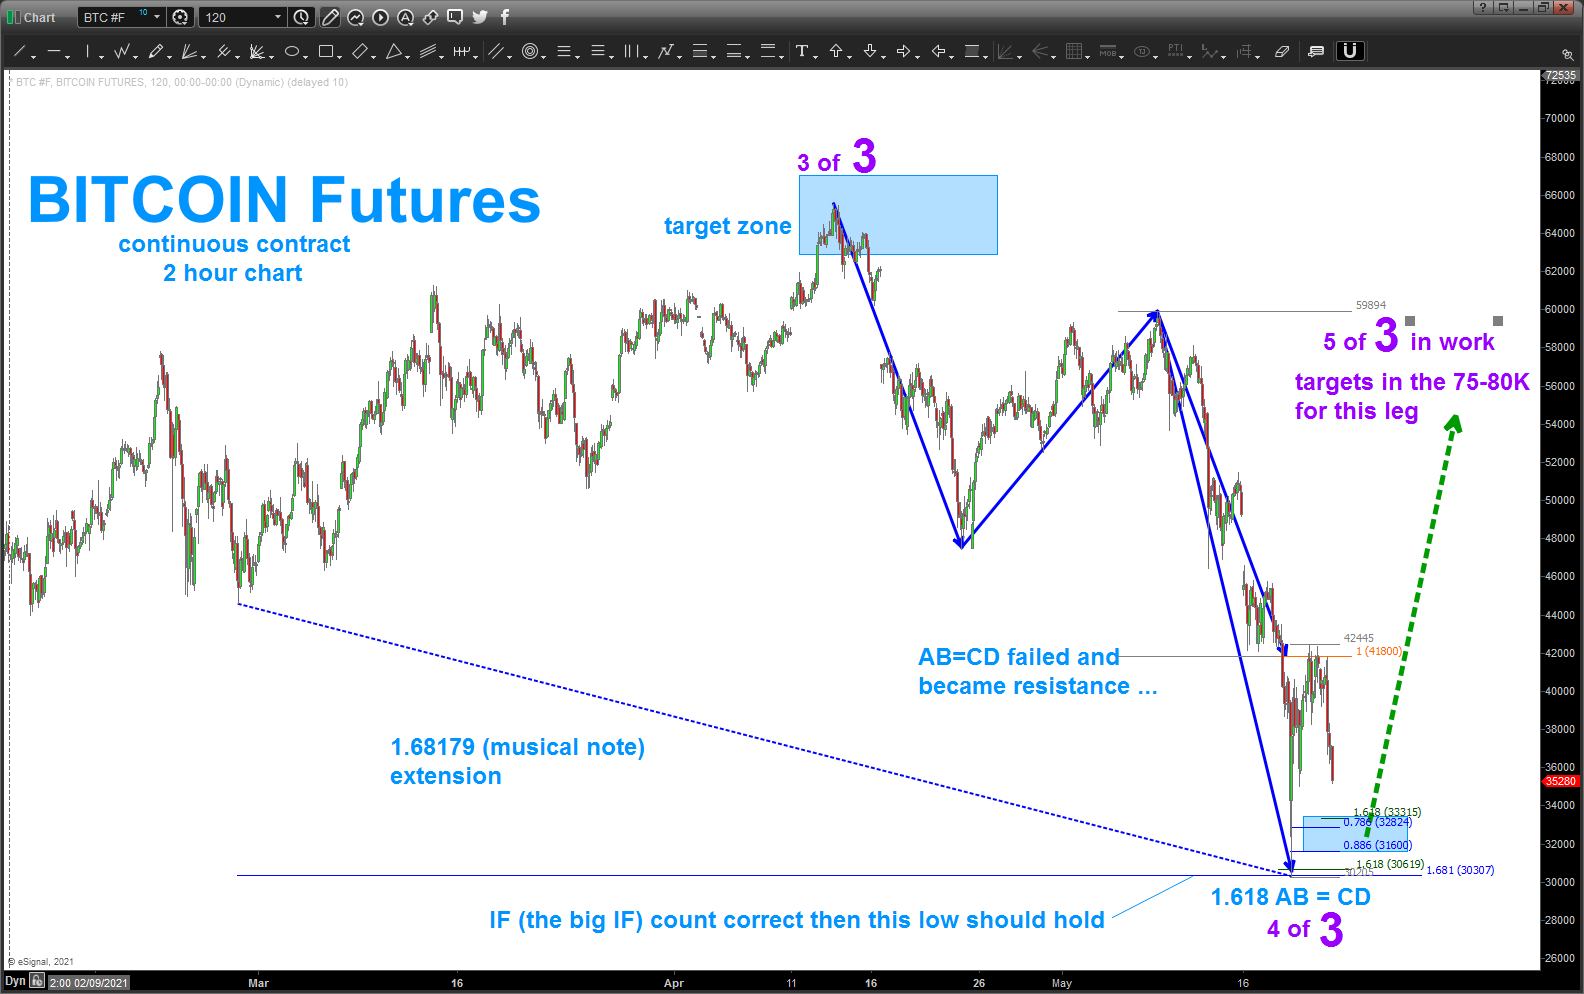
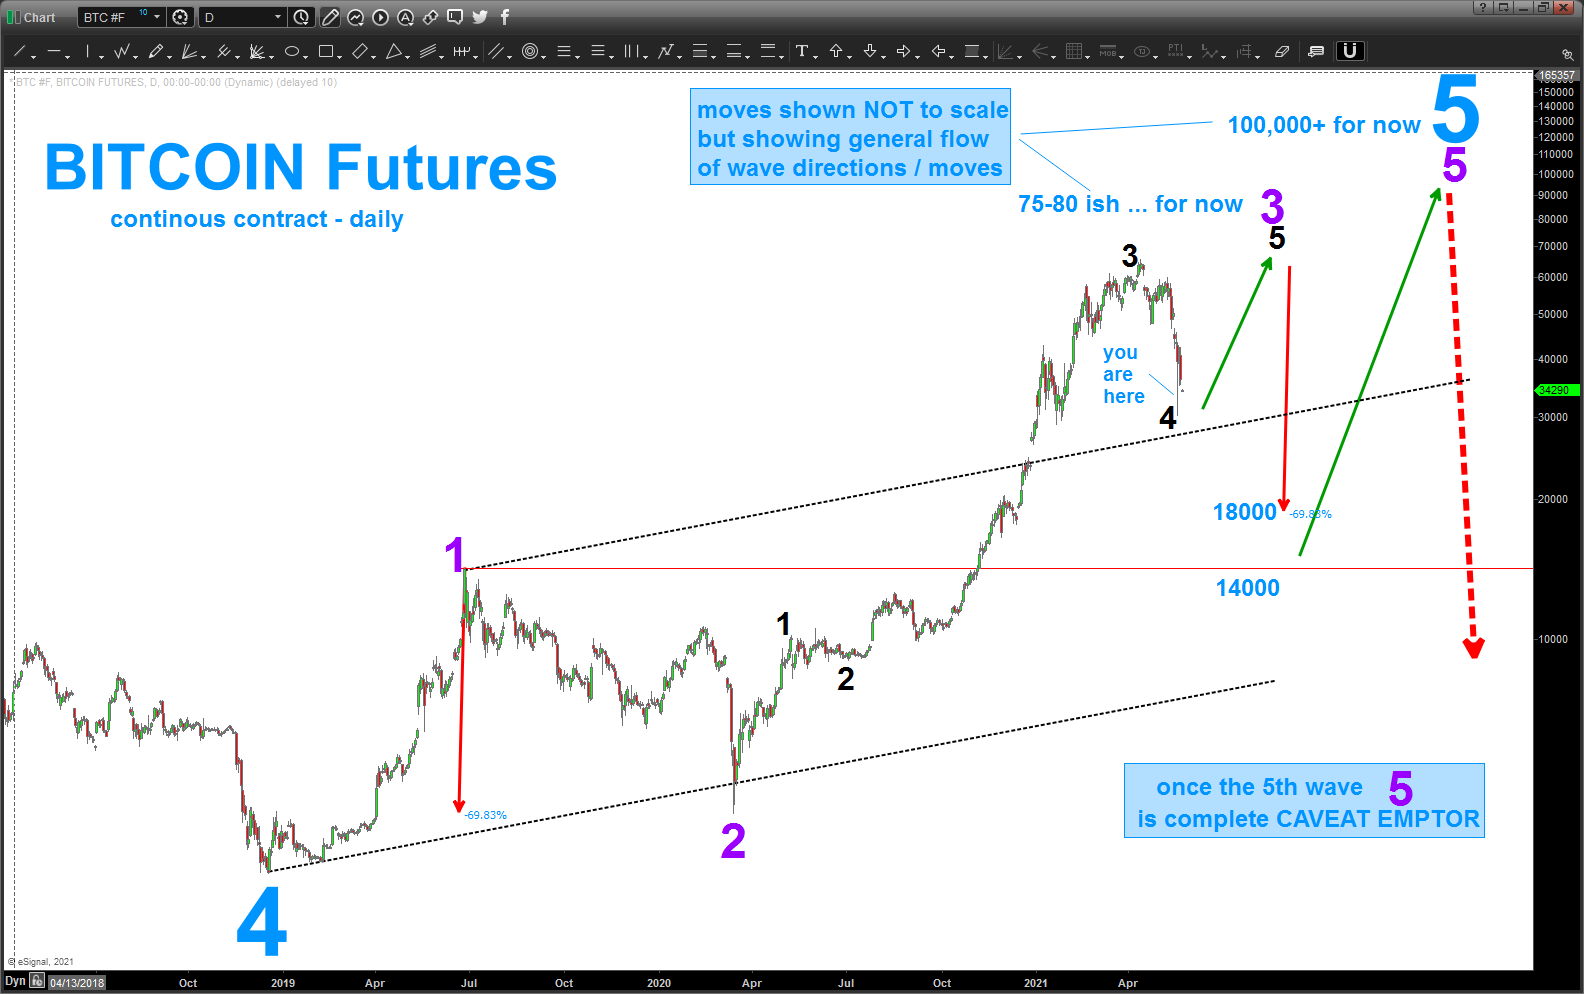
in the last post we created two target zones w/ the “basic” AB=CD and 1.618AB=CD projection technique. doing some rudimentary wave counts I’m going to call the low as a corrective move being complete but I’m updating my count to show that this is still wave 3 of 5 that we are in …
what does this mean?
we “should” (from current levels) move up into the mid 70’s or 80’s and, depending on the chaos of the masses maybe even higher but it is going to be the final wave higher w/in this BIG 3rd wave.
then, expect another nice shake down WHICH SHOULD BE BOUGHT for the final leg that should take us into the 100k’s …
 Bart's Charts