CSCO follow up and important level …
Posted on March 28, 2021 1 Comment
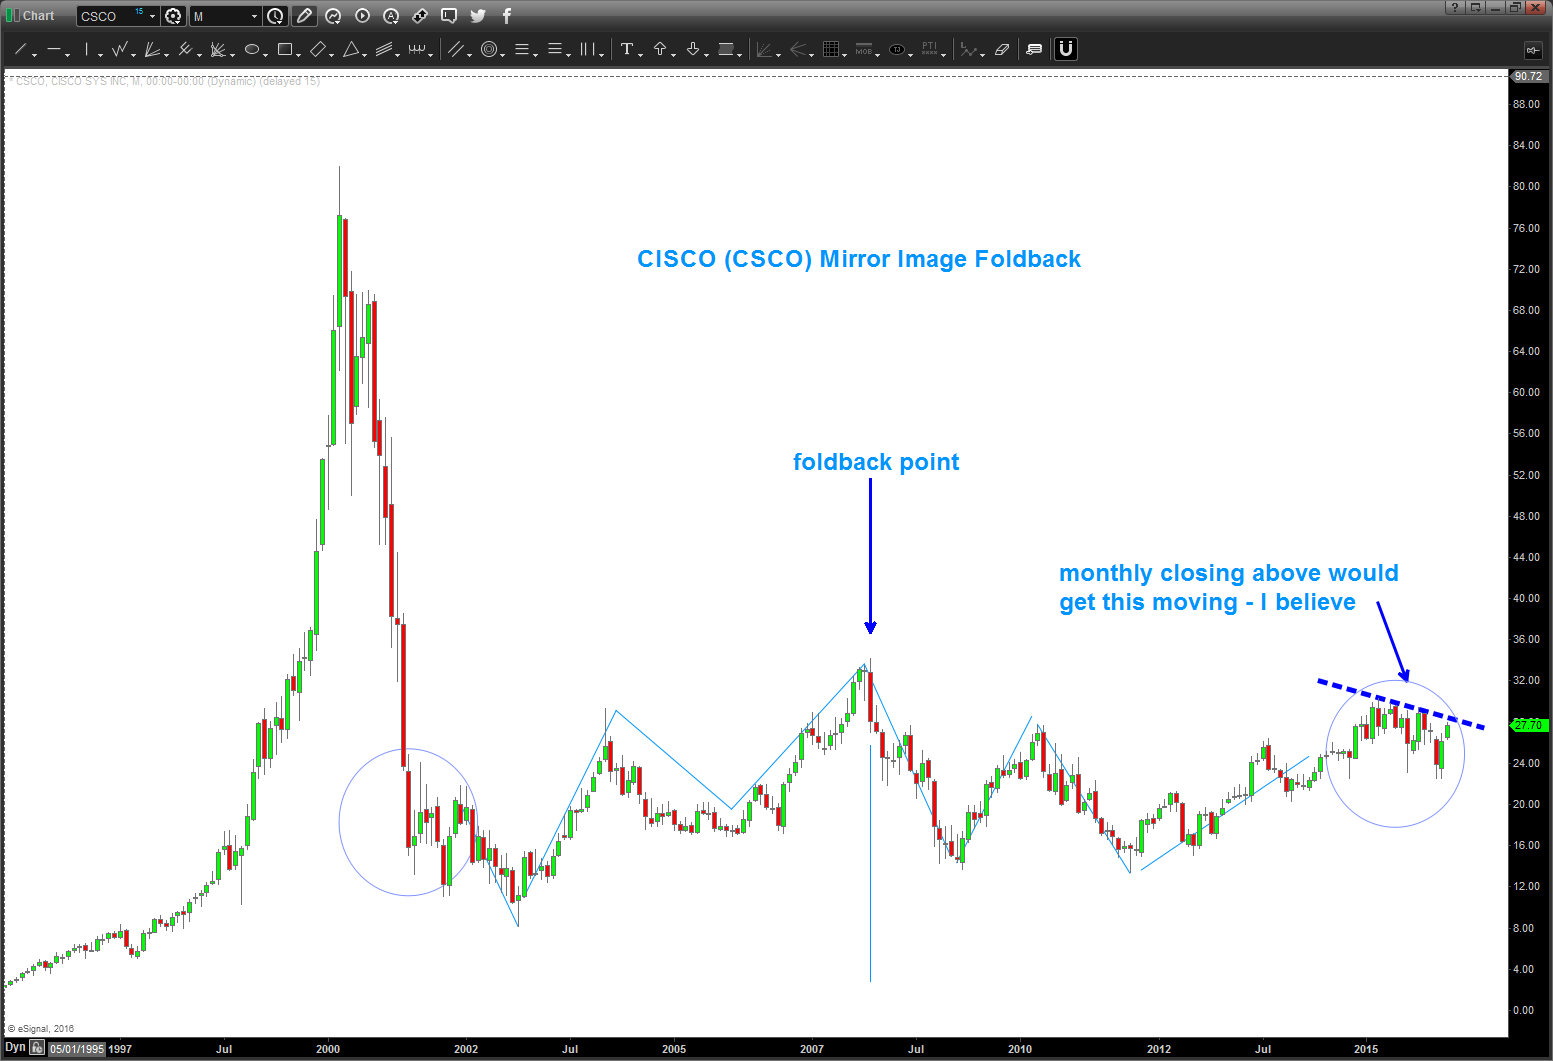
last post on CSCO: https://atomic-temporary-44460632.wpcomstaging.com/2016/03/14/go-ahead-and-hate-csco-appears-ready-to-breakout-and-outperform/ was 5 years ago. crazy how time flies.
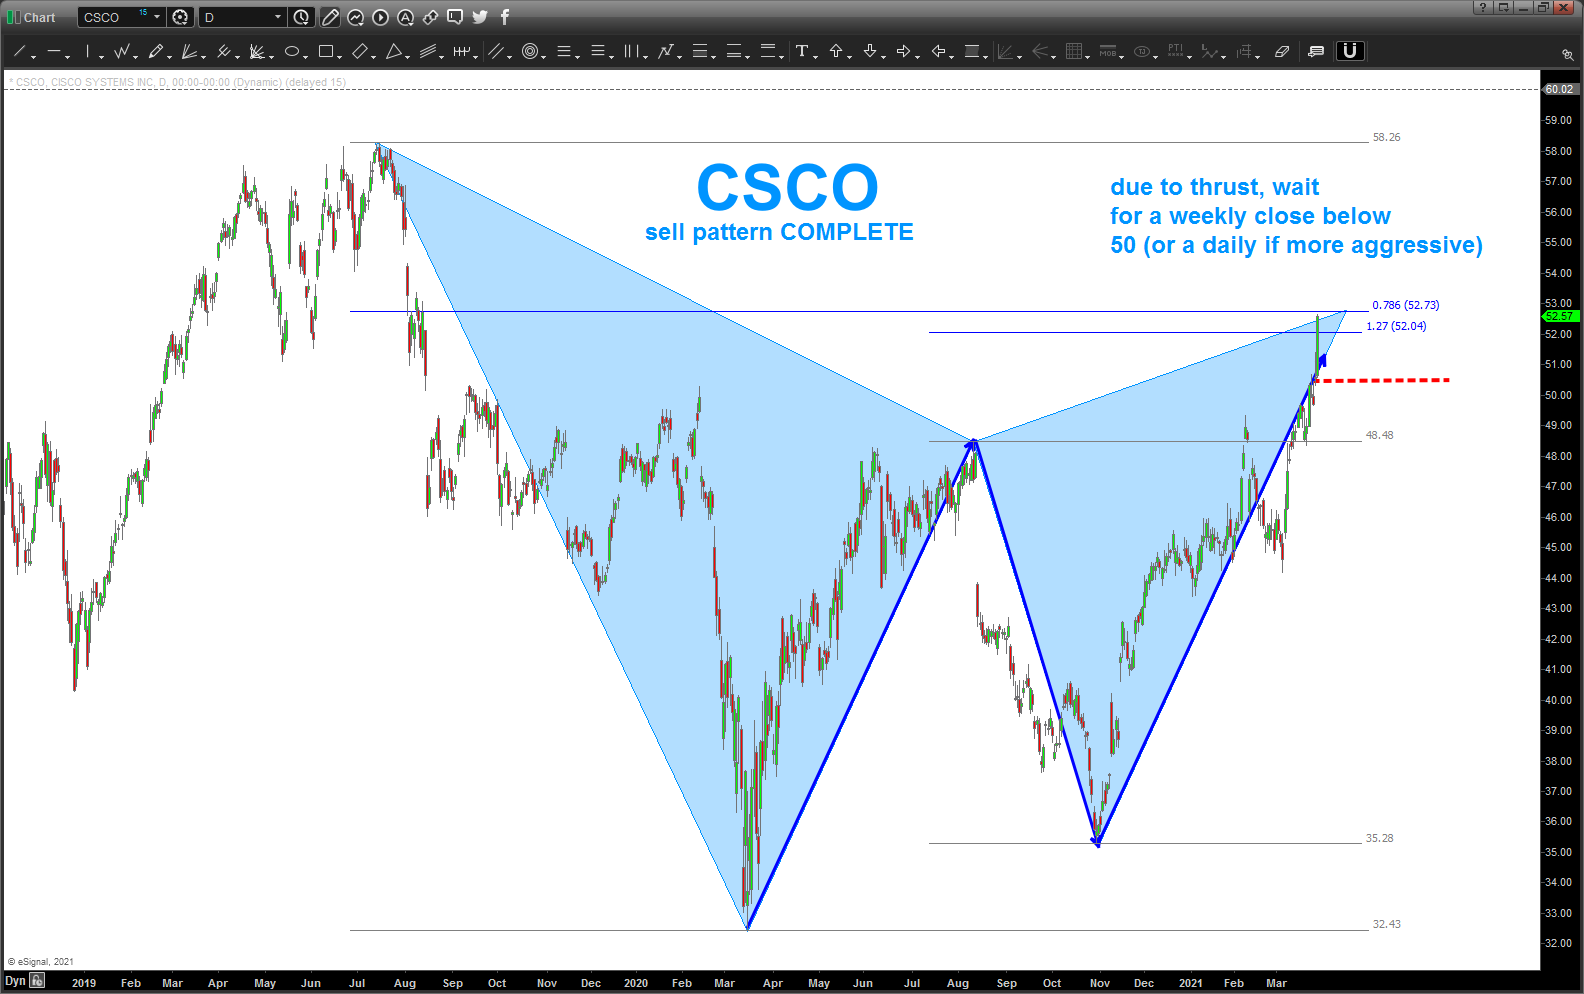
checking in on CSCO we are at a VERY important point as CSCO is showing the completion of a near perfect SELL SIGNAL but due to thrust, if the pattern works, would wait for a signal reversal candle below 50.
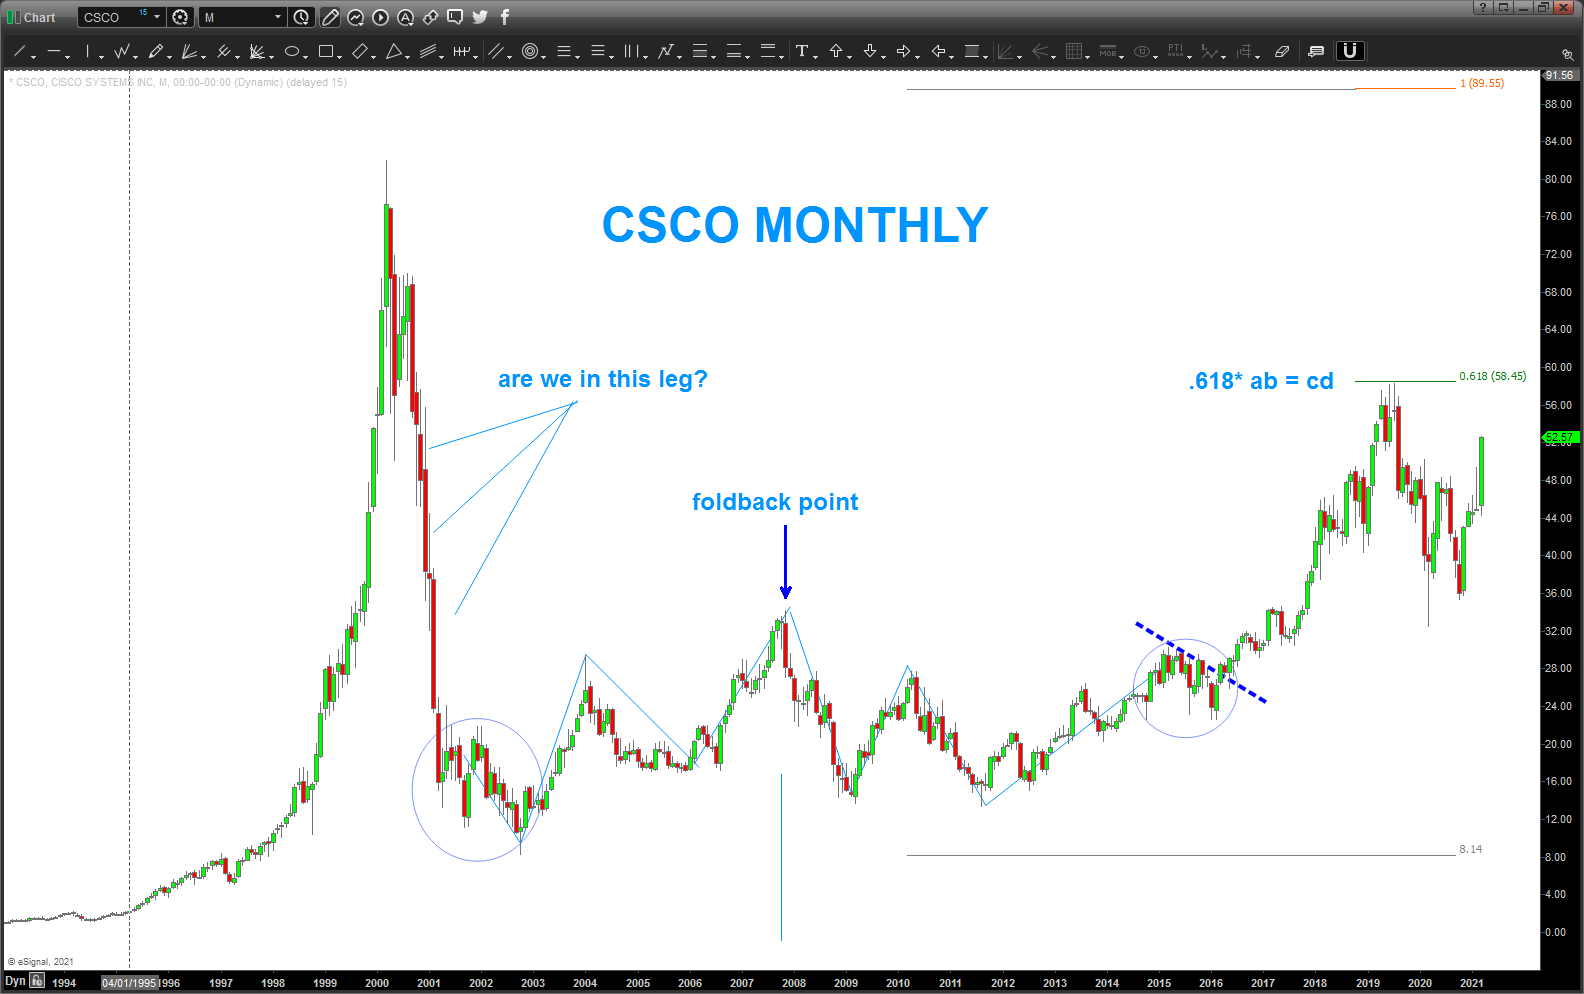
if the pattern fails then, it’s quite possible that we have begun the parabolic leg up the opposite side of the mirror image foldback. it sure has tome thrust fueling its rise so this pattern is REALLY important for the Bulls/Bears.
also, one last, if you take your AB as the all time low to the all time high and then project .618 that length from 8 dollars you smack right into the last high in/around 58.
the 50’s … appear really important for CSCO
tomorrow is either a “gap and gone” higher or a “big stiff wall of resistance” for any further advance ….
Bart
Disney … 5’s all around
Posted on March 26, 2021 Leave a Comment
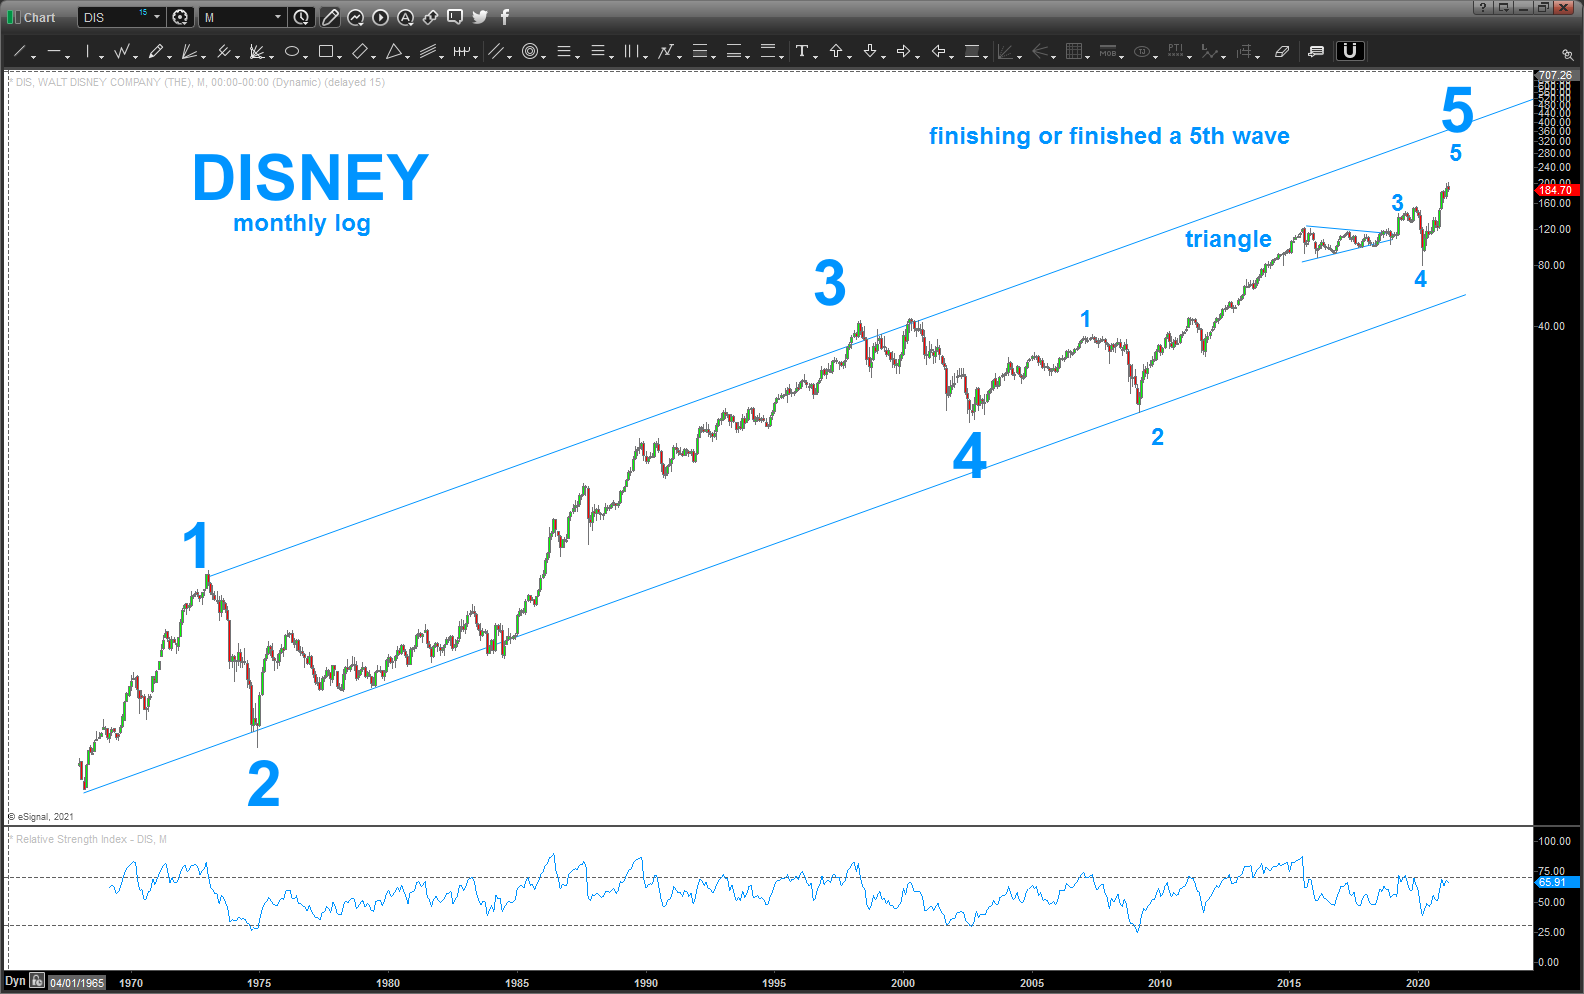
Well … here’s $DIS on a long term Monthly.
sure looks like 5 waves are complete or completing to me .. note the bearish divergence on the RSI.
pull the plug …
Bitcoin Futures
Posted on March 26, 2021 1 Comment
turned bullish on Bitcoin down around 6-7K and off it went….
the past couple weeks have been interesting as it’s been hovering around the 50-60K mark.
I’m still bullish.
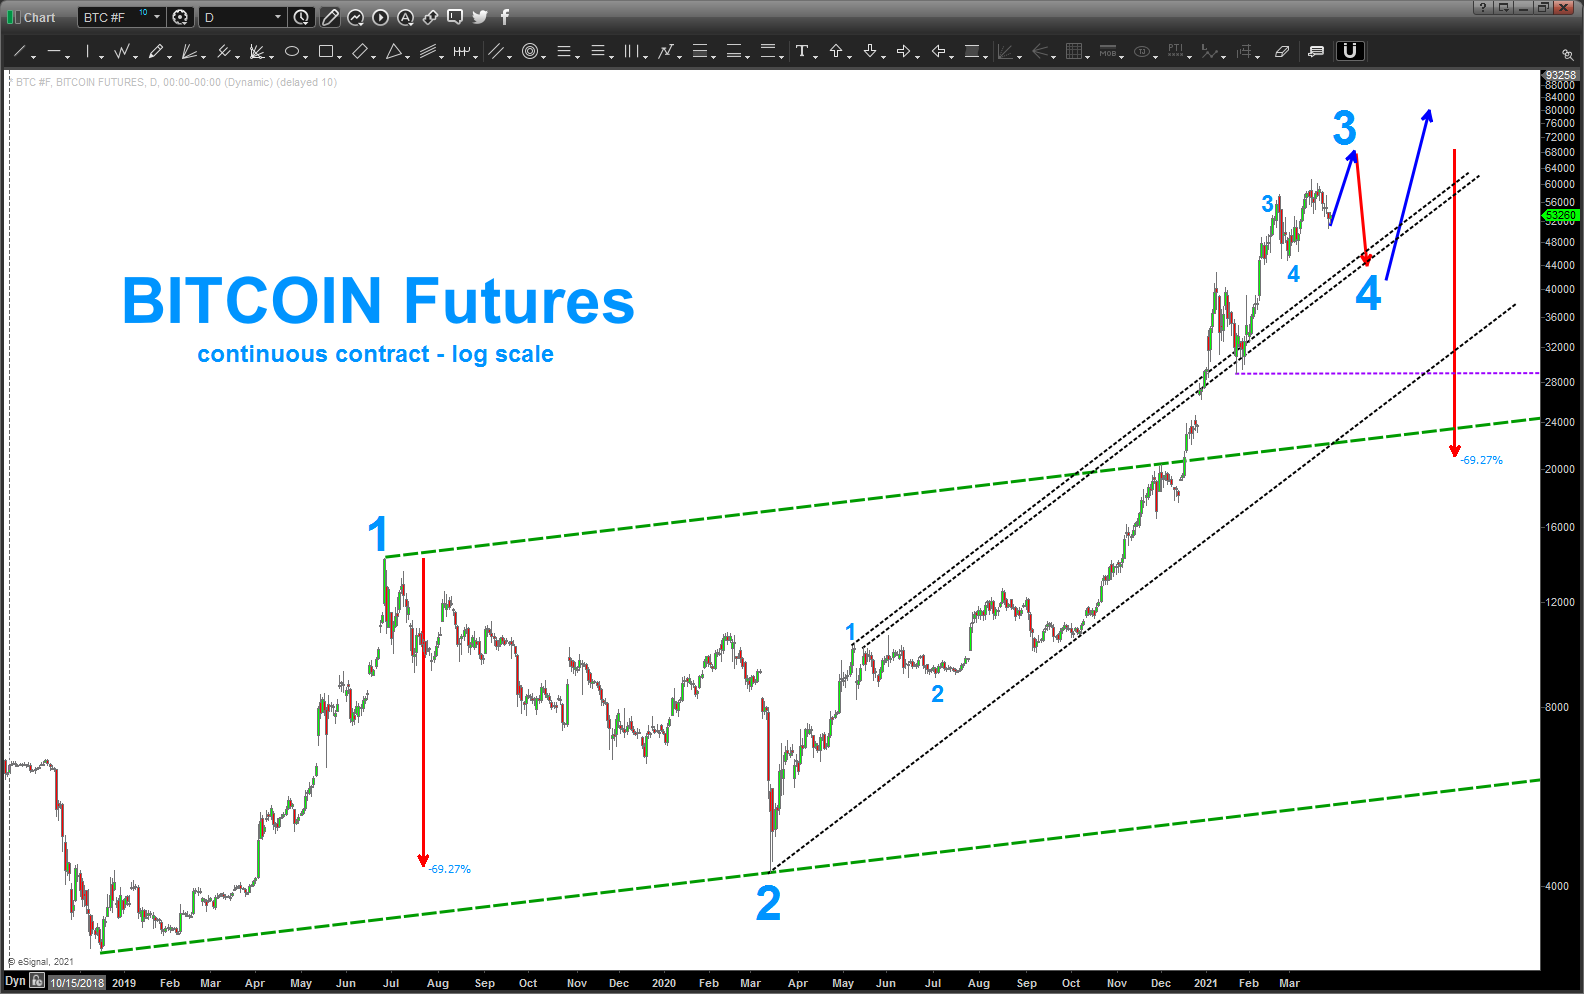
as for – right now – I see another leg up to make a newer high and then a BIG 4th wave correction and then another big run higher – 100K+ not out of the question.
closed my entire position at 57k ish and now am just going to WAIT and do nothing and watch my thesis shown in the chart below work out what’s going to happen next.
Elliott Wave, as I have OFTEN said, is AWESOME – when it works. it’s hard, no doubt, but learning the corrections is key.
using the guideline of alternation, looks like a zig-zag for wave two so I’ll be expecting (not a sure thing at all – it’s a guideline) for a flat or a triangle perhaps but either way, I’m going to hold …
also, note, we have some big time volatility here … so as long as the coming correction does not go below the big blue 1 then we might conceivably correct 70% and STILL BE BULLISH.
also the BIG 3 is projected to end around 68K. it doesn’t need to get up there – at all. but that target puts a very nice 3 drive to a top in play …
for now, WAIT, and let the patterns be our guide.
the ratio (XLP/NYA) is the ONLY thing I’m watching w/ regard to equities …
Posted on March 21, 2021 Leave a Comment
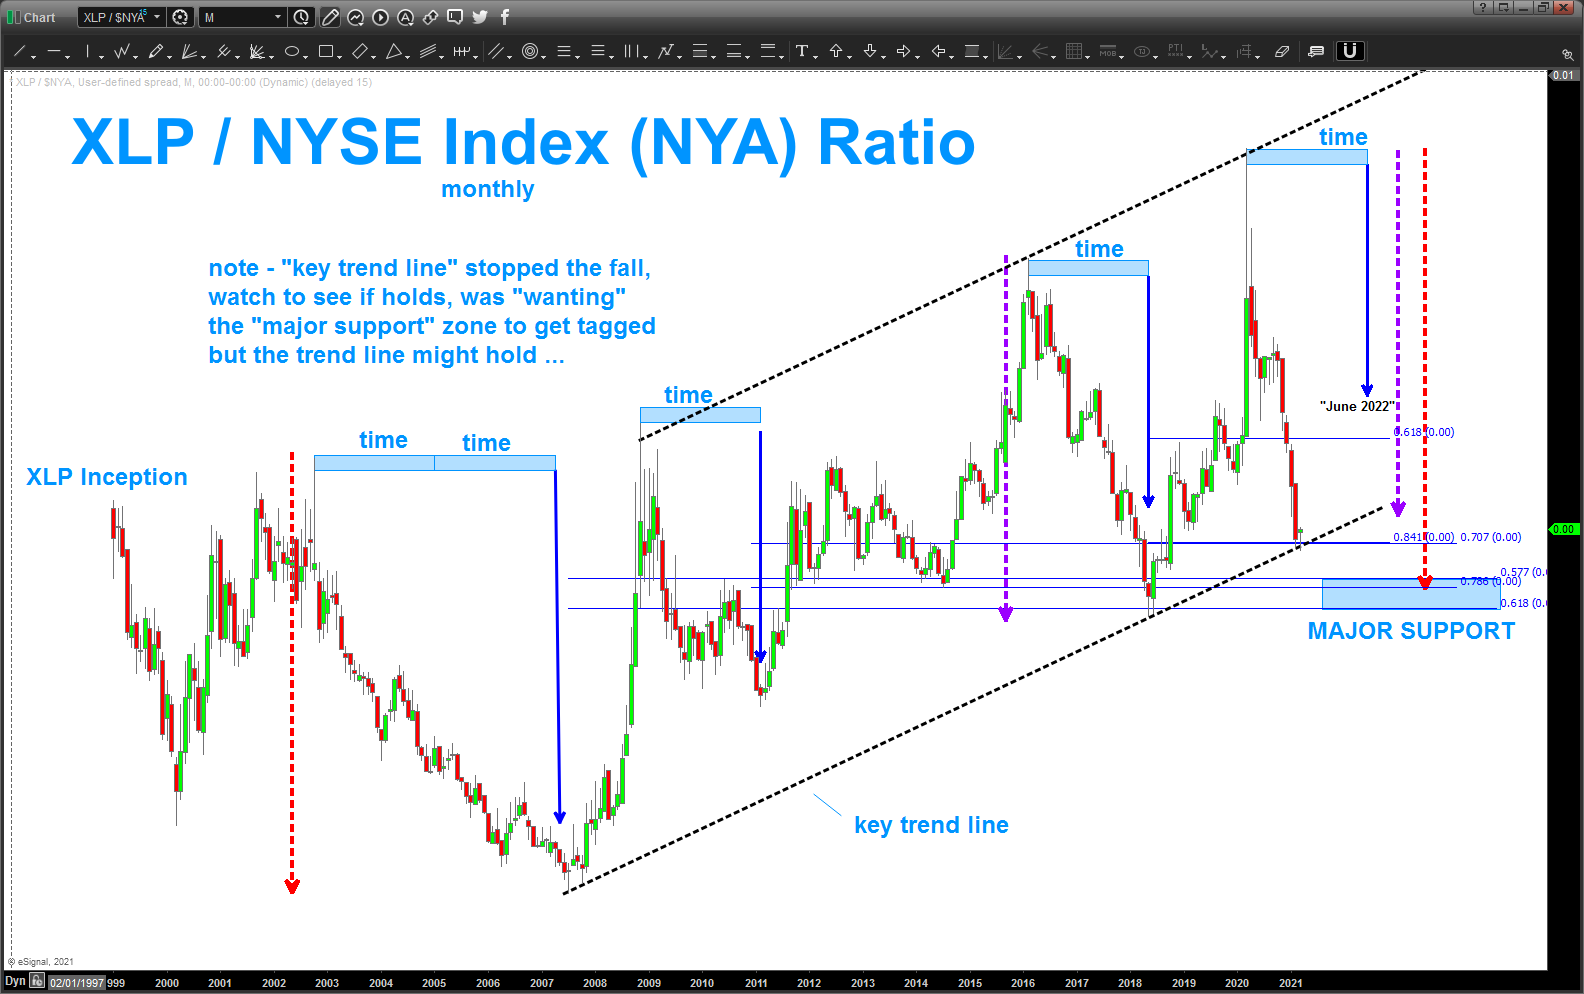
I’ve been monitoring the ratio, daily, for a while as I really wanted the ratio to go down into the “major support” area as I could then feel probability was on my side to take a crack at shorting the market. yes, shorting the market …
if you’ve been reading my blog for a while and for those newer blog readers you will find out/know that the patterns on the XLP/NYA ratio have been exact and helpful in understanding the flow of funds in the big institutions. KEY.
so, I noticed the “key trend line” last time I blogged and noted it but, honestly, haven’t been paying that much attention to it .. just had the lower “major support” level on my hand but, the “key trend line” looks like it has tagged the ratio and provided some much needed support for this falling knife.
now what – well – we are kind of in no mans land … but, I’ll be watching closely and, keep the “major support” level a little below in the back of your head …
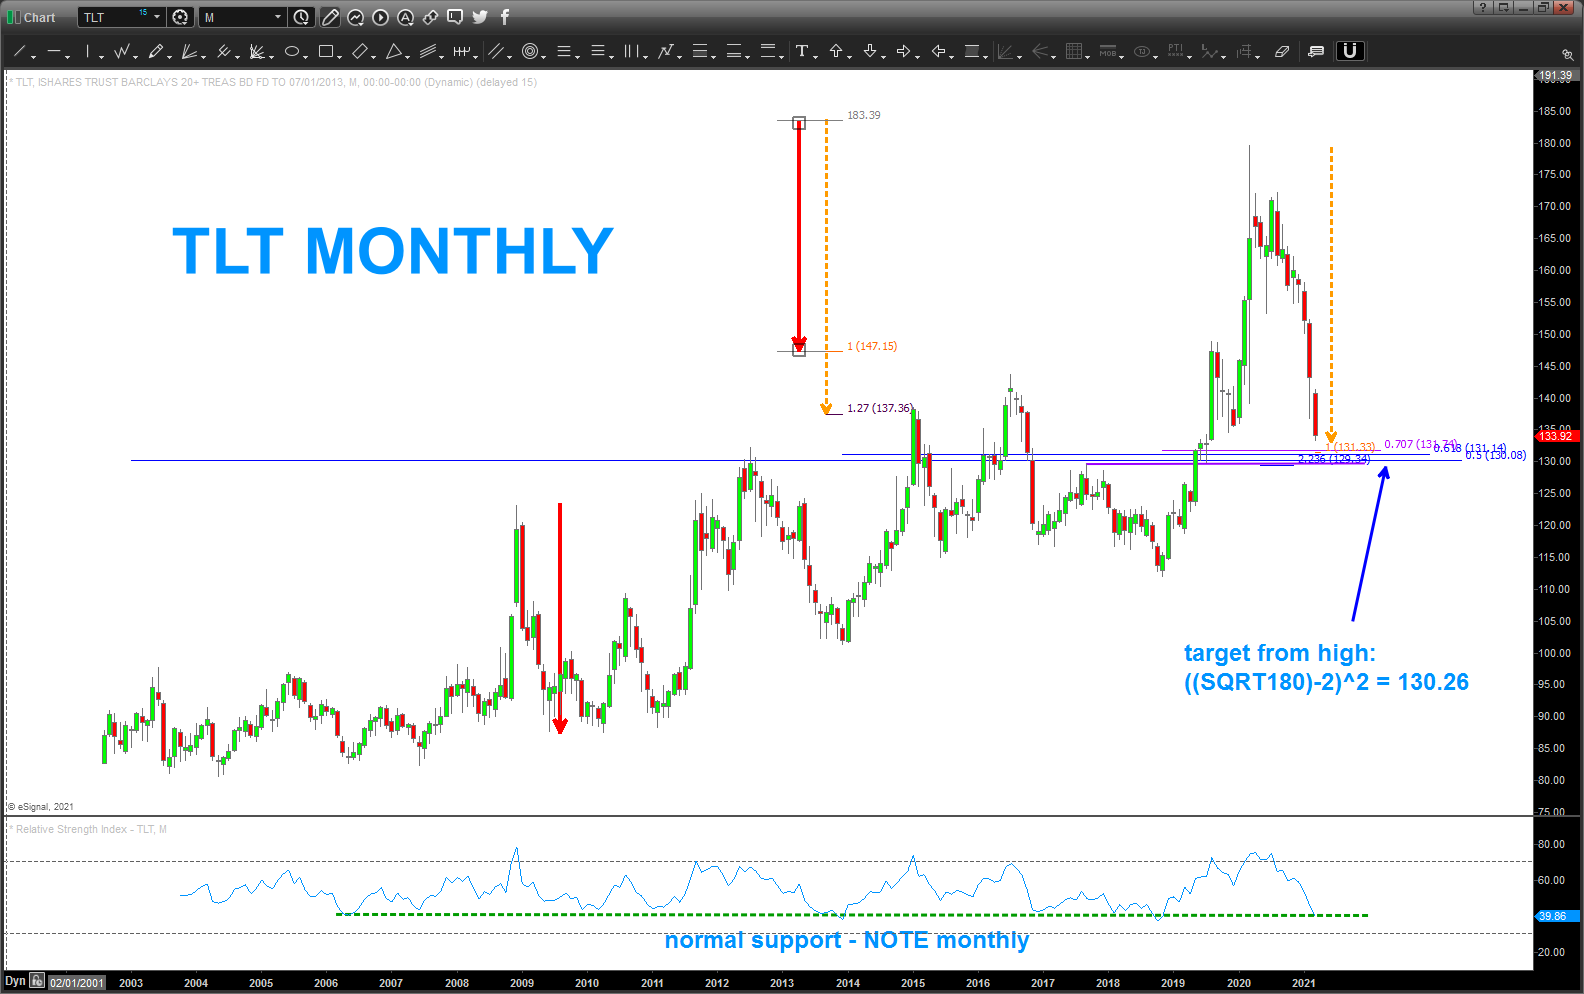
Yikes …. MAJOR SUPPORT for TLT
Posted on March 18, 2021 Leave a Comment
ton of math coming in 129-131 … for those bond proponents out there, this better hold or we could accelerate even more. figure a daily close below 128 is a failed pattern …
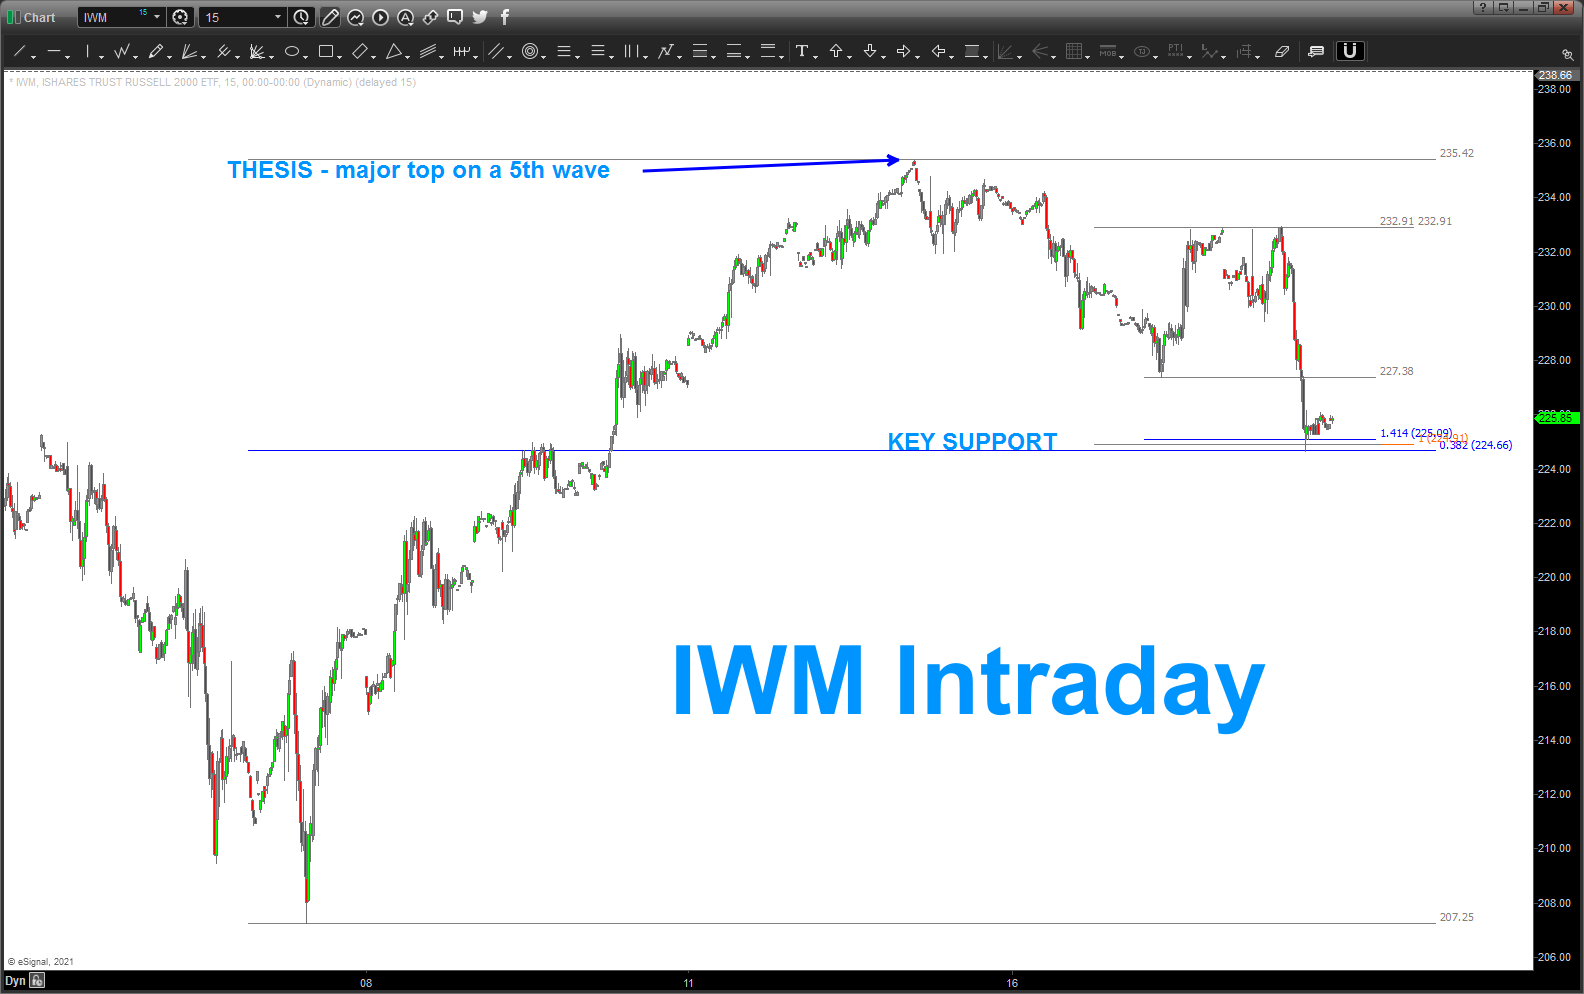
IWM – KEY SUPPORT
Posted on March 18, 2021 Leave a Comment
last post about IWM: https://atomic-temporary-44460632.wpcomstaging.com/2021/02/21/iwm-is-that-it/
that’s the great thing about patterns … they work or they don’t.
WHEN they do, they tell you something.
conversely, when they DO NOT work, they tell you something.
I’ve been showing a 5 wave count in IWM for a while and, just recently, it went up and tagged our target zone. it’s one of many target zones …
the question is “is this the one?”
I don’t know … but we have an intraday BUY PATTERN and if this is a bullish corrective move then this level SHOULD hold … yes, a correction can go into the 210’s but in this case we have the classic AB=CD, 1.4142 extension and the .382 retracement all right here, right now.
IF bullish, THEN this level holds and goes higher …. we’ll see
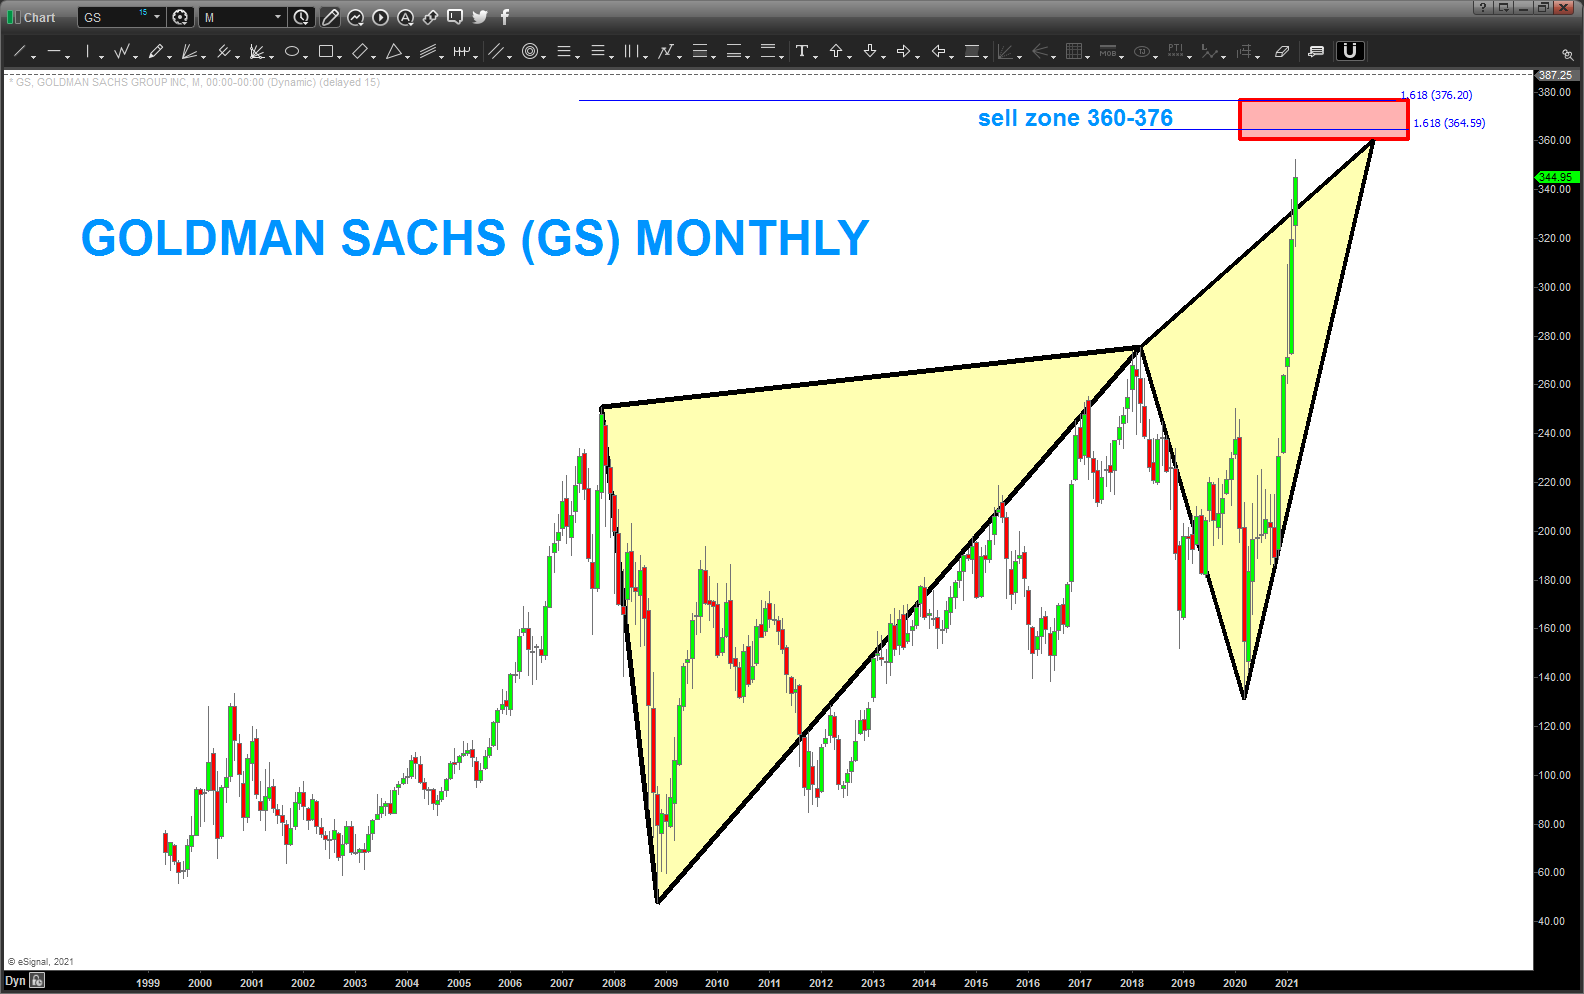
Goldman Sachs
Posted on March 17, 2021 1 Comment
well, look at this ….
this a MONTHLY BUTTERFLY SELL signal on GS. Target zone is 360-376. Since it’s so large would WAIT for a signal reversal candle before entering a short …the AB=CD is at 360 (bottom range of the zone)
UNG / Nat Gas update
Posted on March 14, 2021 1 Comment
last post: https://atomic-temporary-44460632.wpcomstaging.com/2020/12/03/natural-gas-and-ung/
update: rolling into a BUY zone for both futures and UNG. IF the thesis that a BIG low is in place THEN we should find support and then continue upward.
take time to look at the long term Nat Gas Continuous Contract chart … you can see the “major” trend line which is acting like resistance .. a weekly open and close above that trendline could signal game on for the bulls.
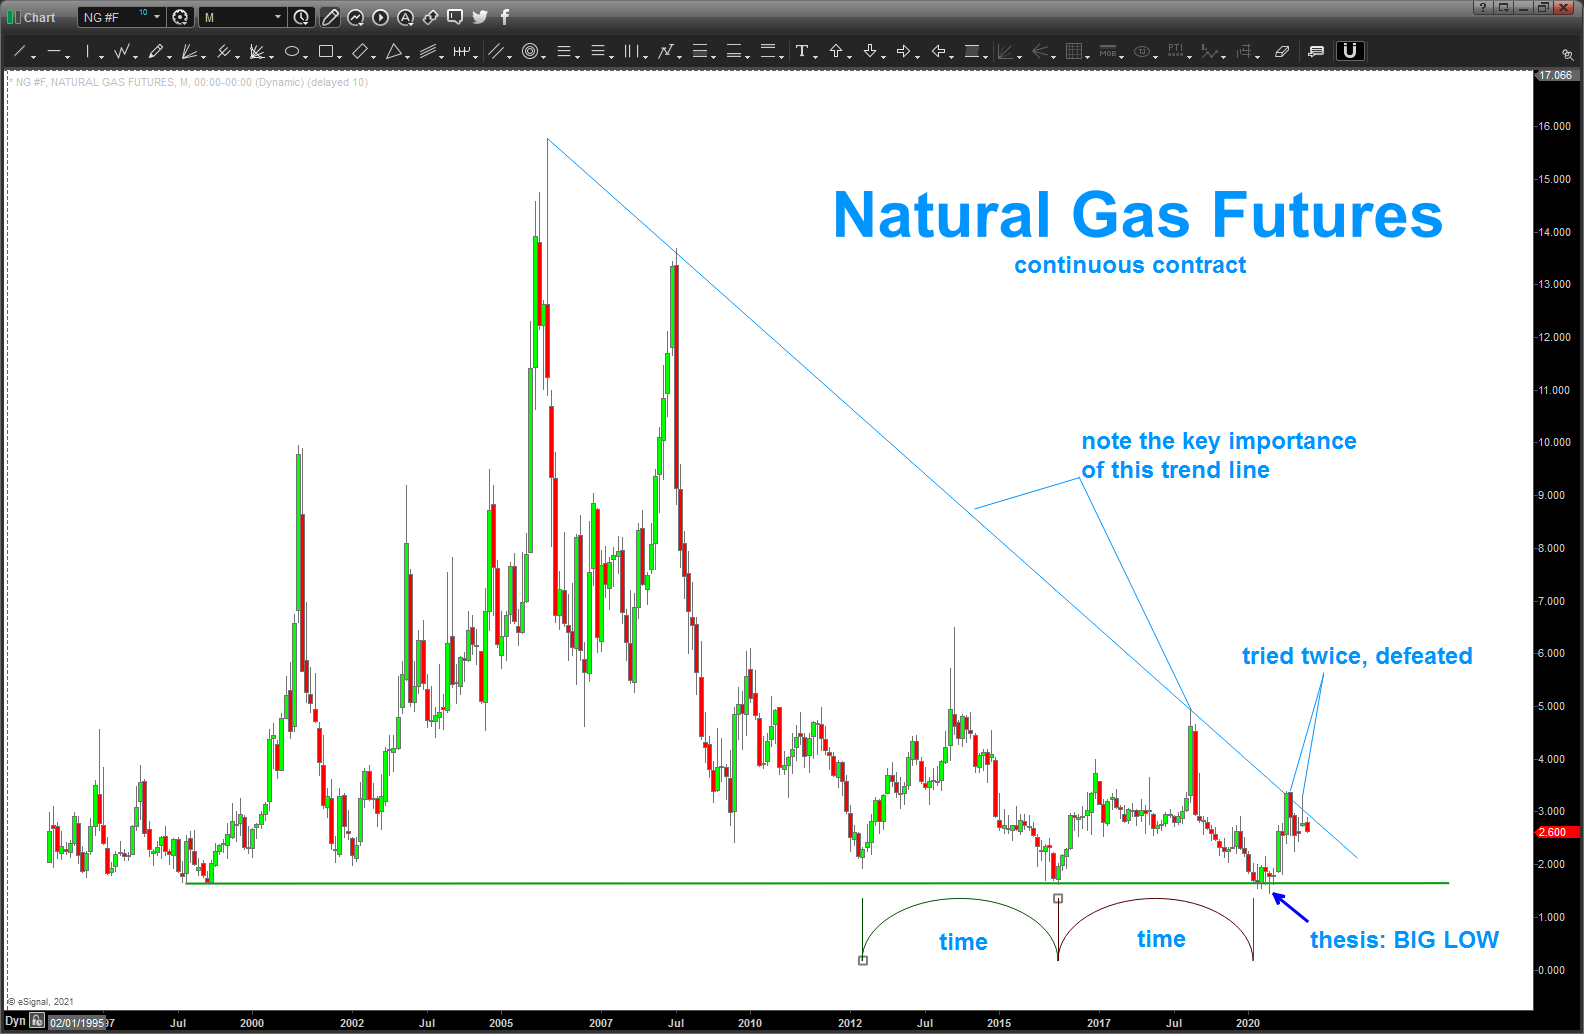
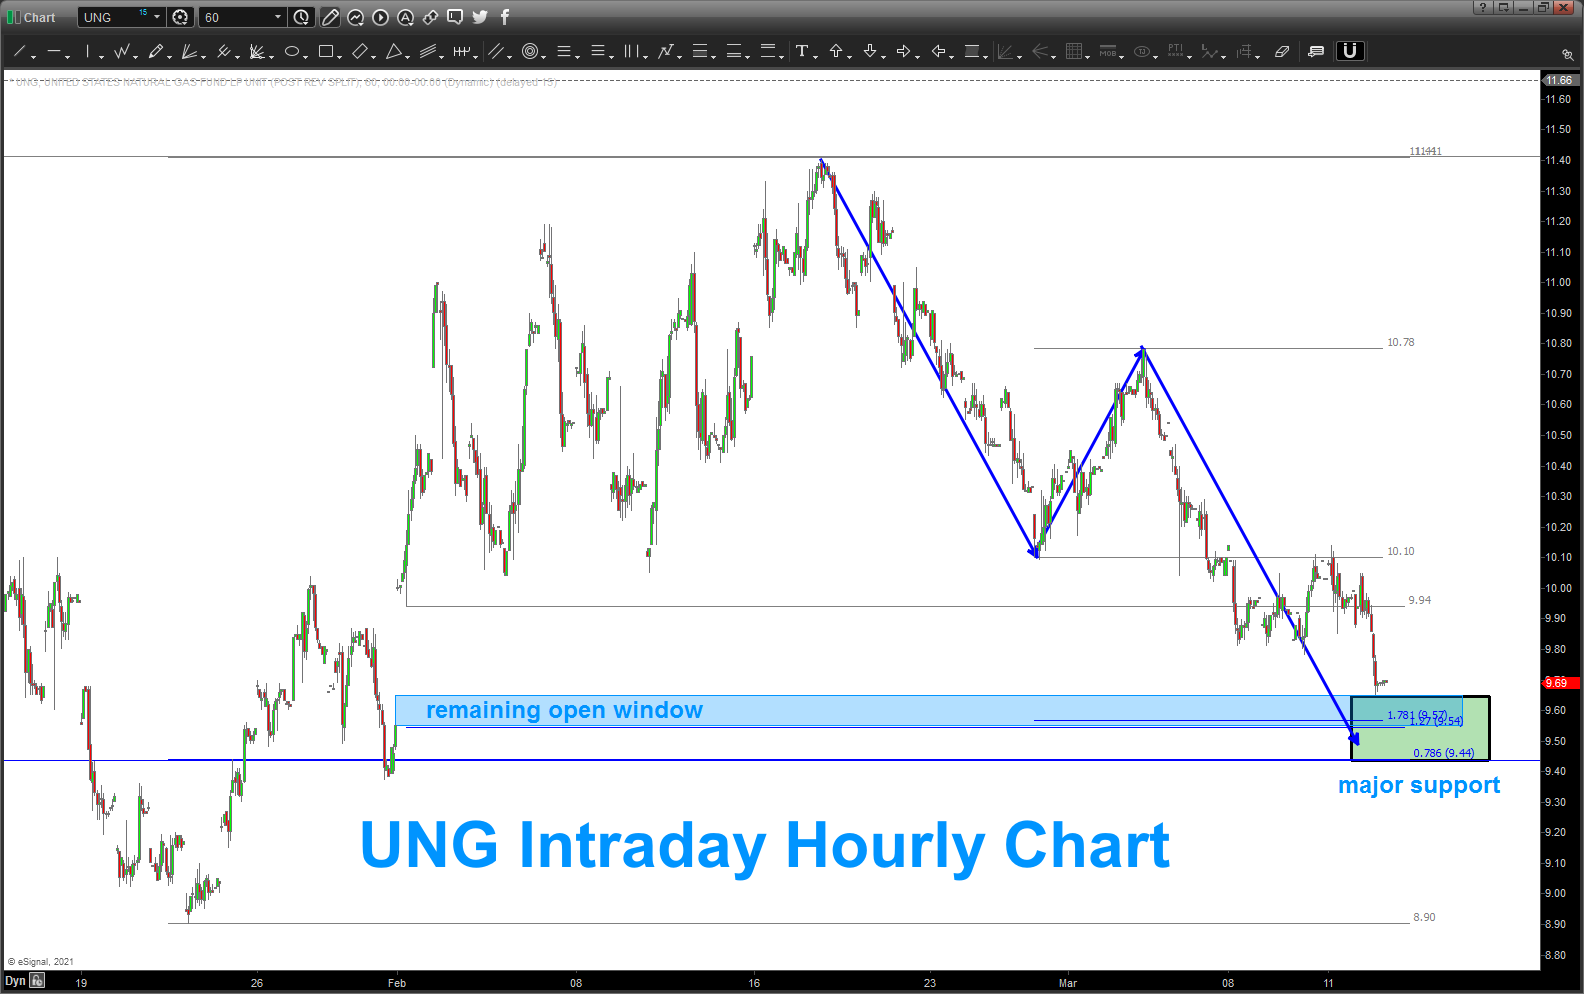
if major support breaks then we could be looking at the 7 dollar level on UNG. needs to find support in the area shown …
