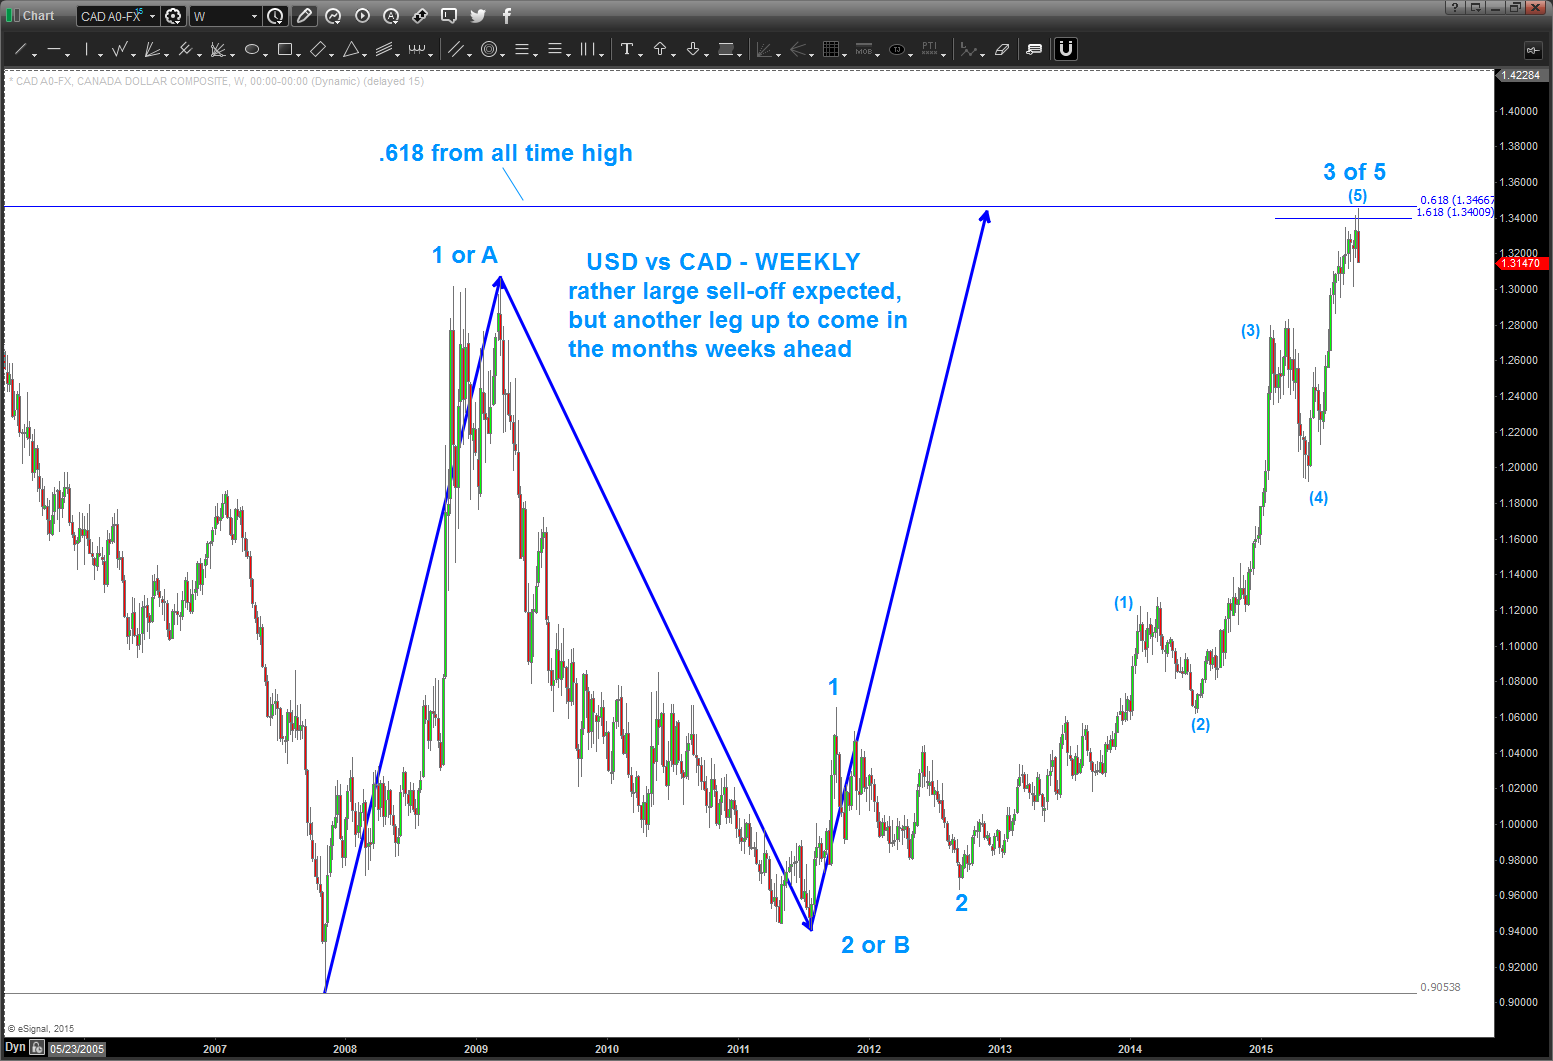
USD vs LOONIE first target hit
Posted on October 3, 2015 Leave a Comment
we have a weekly signal reversal present w/ a realistic count and “monthly” bearish divergence as the new high was being made. So, for now, expect LOONIE strength which “should” translate to higher oil prices and the Oil Services Index rising. However, take a look at the count. I see this as a subdivided 3rd wave so this is a wave 4 working out, which will ultimately bottom and cause another new high to be made by the USD. For now, if your a long dollar expect some pressure and if you can play the long LOONIE side this would be a good time to look for the first pullback to give it a shot.
just search “loonie” on my site and you’ll see we’ve been waiting – patiently- for this target to get hit.
$DNKN and it’s harmony/math
Posted on October 1, 2015 Leave a Comment
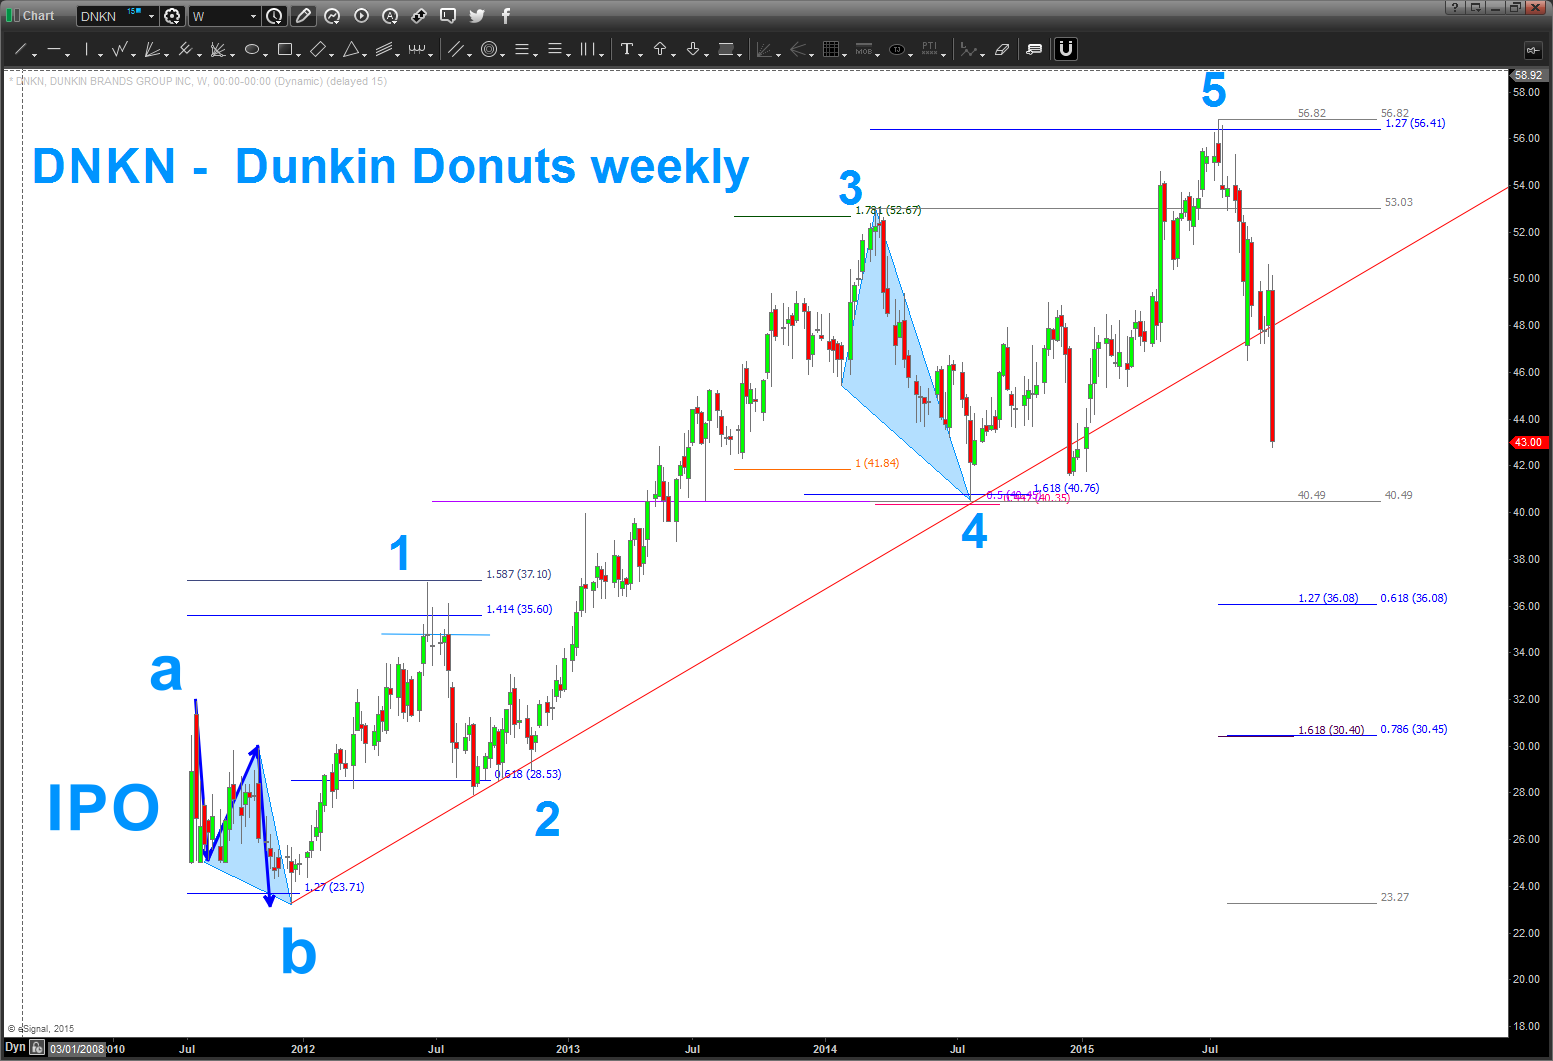
don’t know anything about $DNKN. I like their coffee and get their donuts every once in a while …so, it’s a rainy day here in VA and just saw on my $TWTR fee that they are shutting down 100 stores (bummer) and thought I would take a look at their stocks. With full disclosure – this is all after the fact, except one part (looks like 36 is the first stop) but I figured I would just go up the ladder and point “stuff” out …
at each one of the dashed boxes w/ yellow fill there is something to point out …
- the low at “b” from the IPO a “perfect” AB=CD into the 1.27 extension at 23
- square root of 1.618 = 1.27
- note: 1/1.27 = .786
- (square root of 32 – .786)^2 = 23.72
- square root of 1.618 = 1.27
- high at “1” and a price of 37 is a 1.4142 extension pattern
- note the high was 1.5874 – musical note ratio of equal octave scale
- square root of 2 = 1.4142
- (square root 23.71+1)^2 = 34.44 (the close/open for roughly 6 weeks)
- low at “2” a .618 retracement after 5 waves down.
- (square root 37.10-.786)^2 =28.14
- also the corrective move from 1-2 = move from a-b.
- high at 3 is 1.78179 (musical note of equal octave scale) of wave 1
- 24.37 weeks of open/closes square root target is: 51.84
- low at 4 is
- 1.618 extension of 3
- .447 retrace
- 5, square root = 2.236, 1/2.236 = .447
- .5 retrace
- also, see the corrective moves a-b and 1-2? the corrective move from 3-4 is 1.27 x those corrections.
- the high at 5
- has 5 waves going up into it and – also – is a 1.27 extension target of 3-4
Here’s the picture …
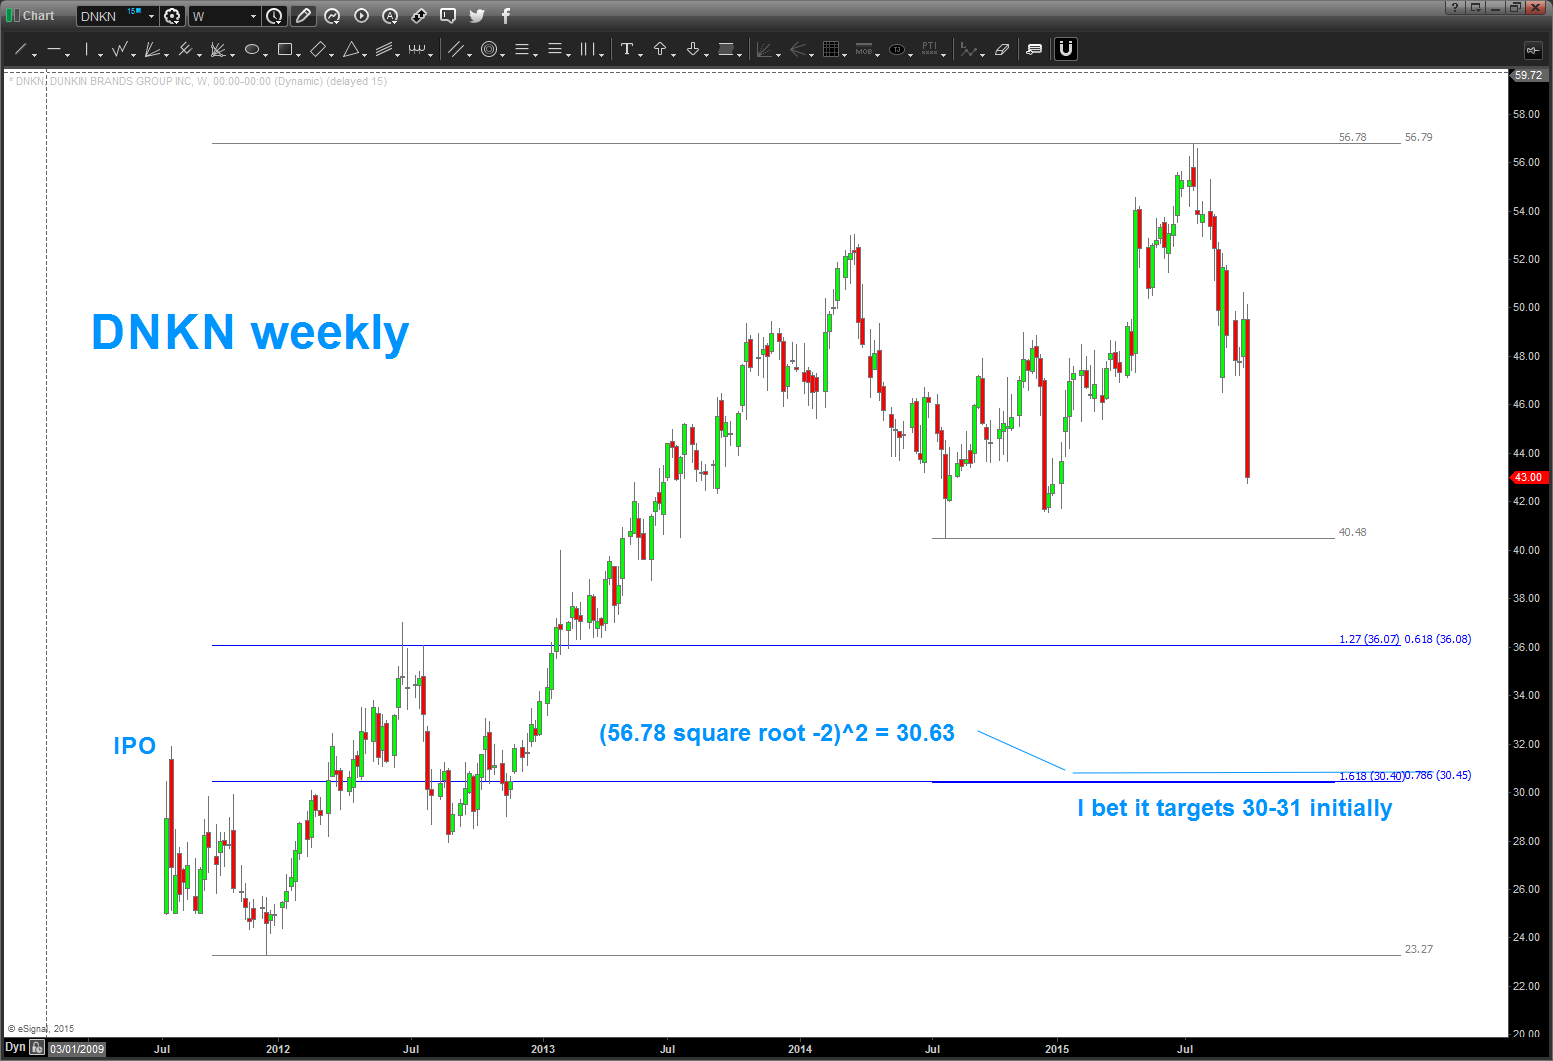
Now what about the real time stuff ? sure looks like the MATH says 3o bucks/share
why did it stop where it did today?
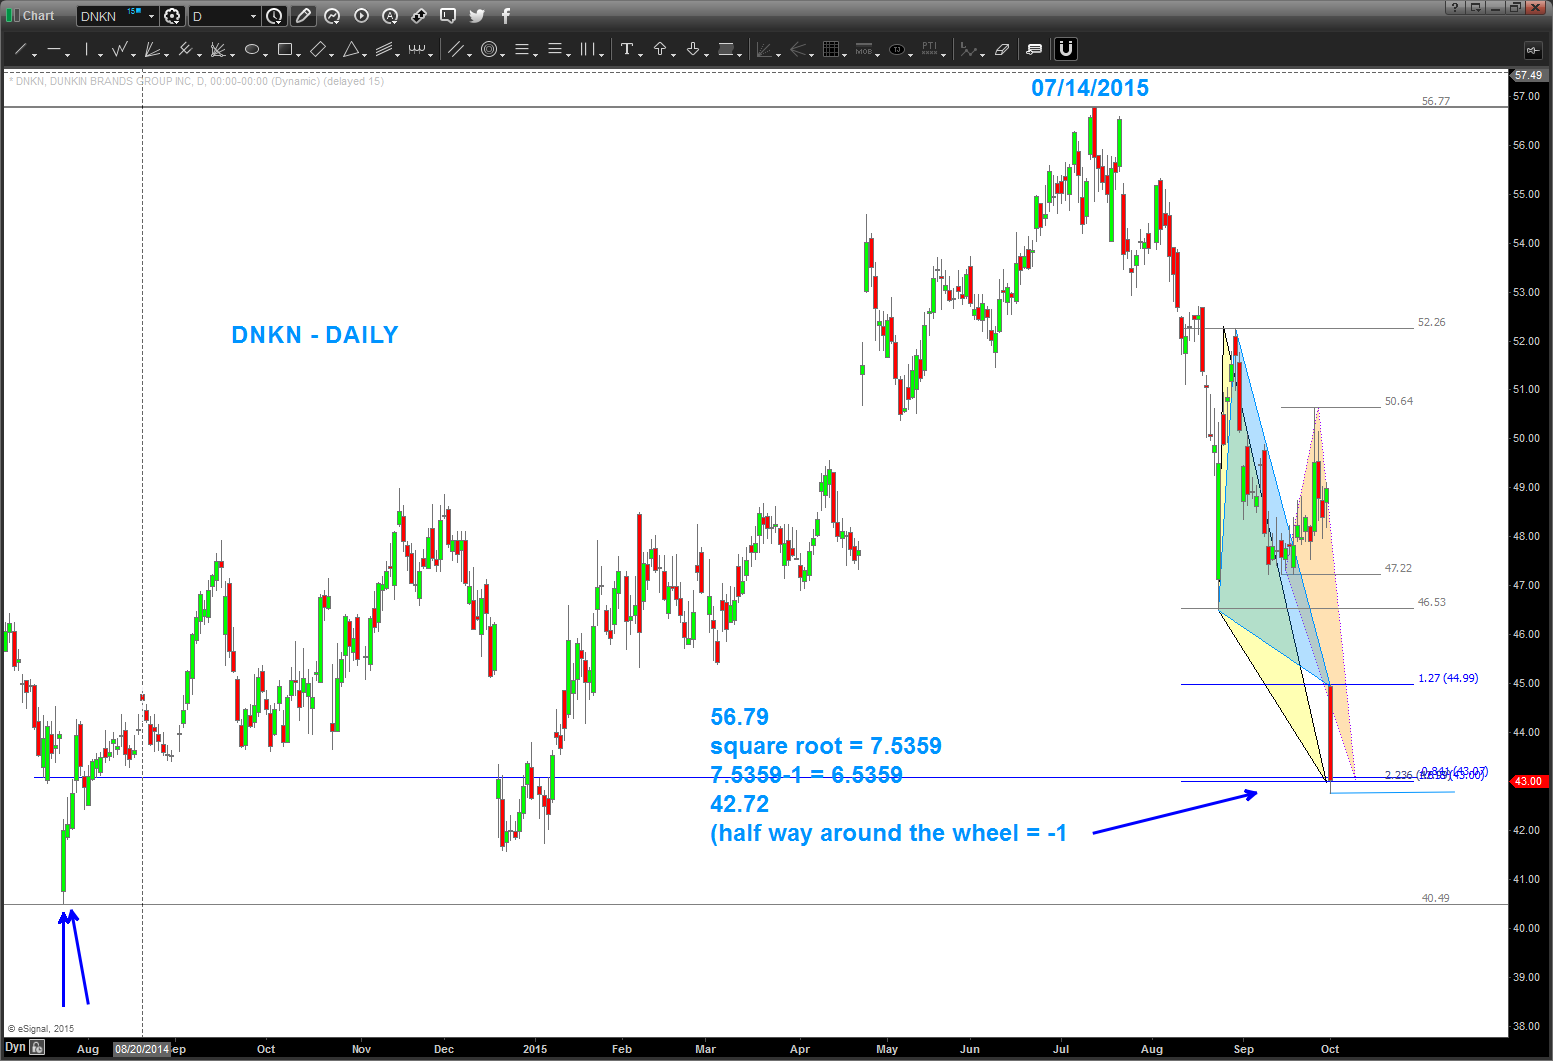
- we have extensions from the last swing (3 of them) = 1.618, 1.27, 2.236 (square root of 5)
- NOTE the gap OPENED at the 1.27 extension (questions?)
- then, of course we rolled half way around the wheel into our square root target as shown.
- .841 retracement (1/1.1892 – musical note from equal octave scale of music) – origin is from the 2 blue arrows point up around 40 bucks
So, anyway, if you have read this far, congrats. hope this helps – not sure why I did this … perhaps to reinforce that the market is vibratory and governed by patterns associated w/ musical notes and sacred geometry …
let me know if you have any questions …
Bart

Aussie vs USD updated – part 4
Posted on September 30, 2015 Leave a Comment
 09/30/2015 – isn’t this fun? it didn’t break to the upside, but went back down to test the lows. NO pattern, no entry. however, a move above .7940 will continue my interest. Thus far, it has not made a new low since September 06.
the “bummer” is we just made a FLAT correction and we’re going down …
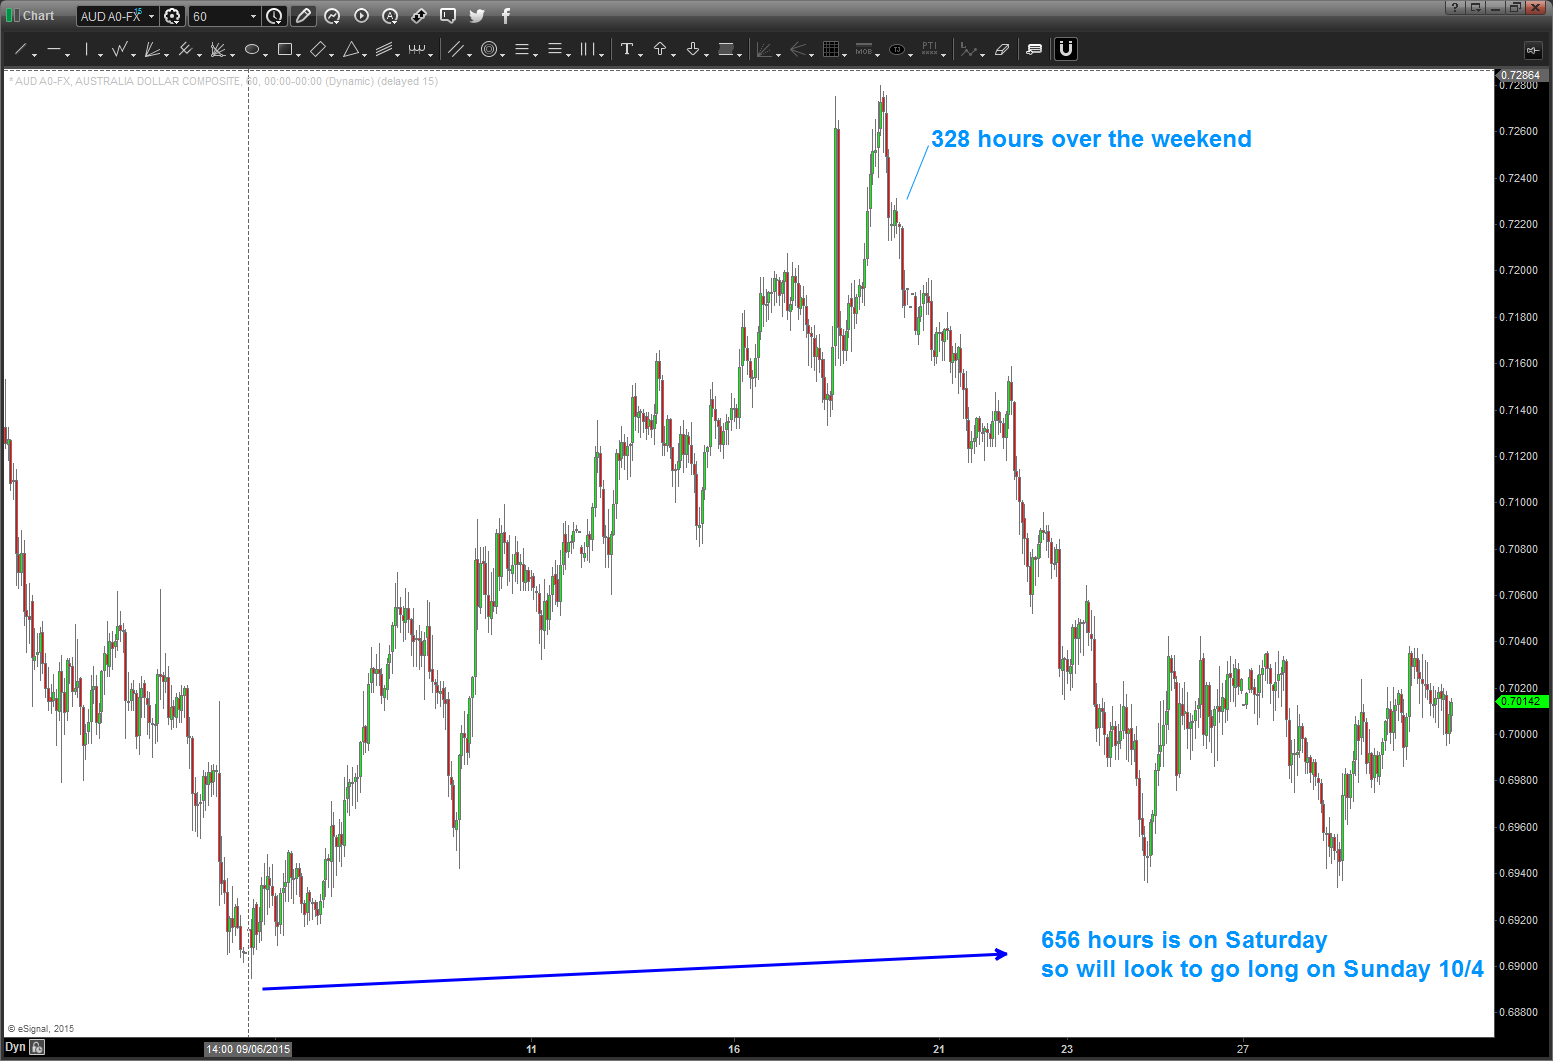
also, sometimes we can look for 656 hours to be a key cycle.
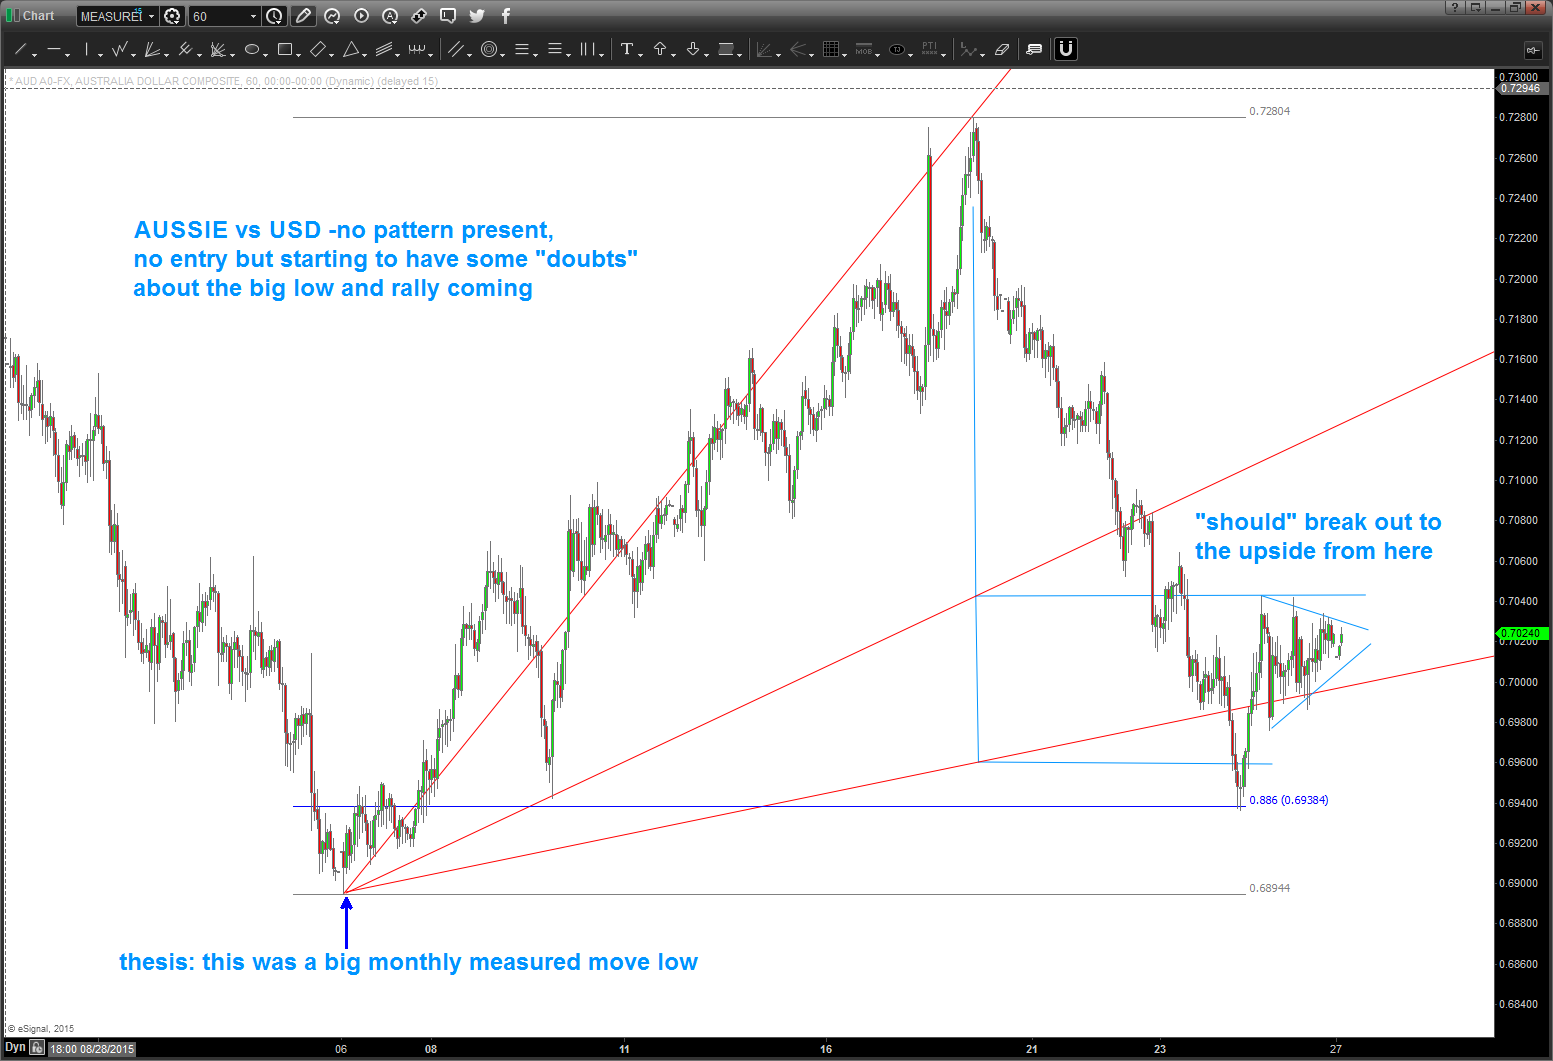
09/27/2015 – no pattern, no investment. big old move back down but am not in yet. have to wait for a pattern because ONLY then can I manage how much risk to take. sure looks heavy, but I see a BIG MONTHLY measured move at 6894 low. So, we’ll wait …also, gasoline futures haven’t made a new low either.
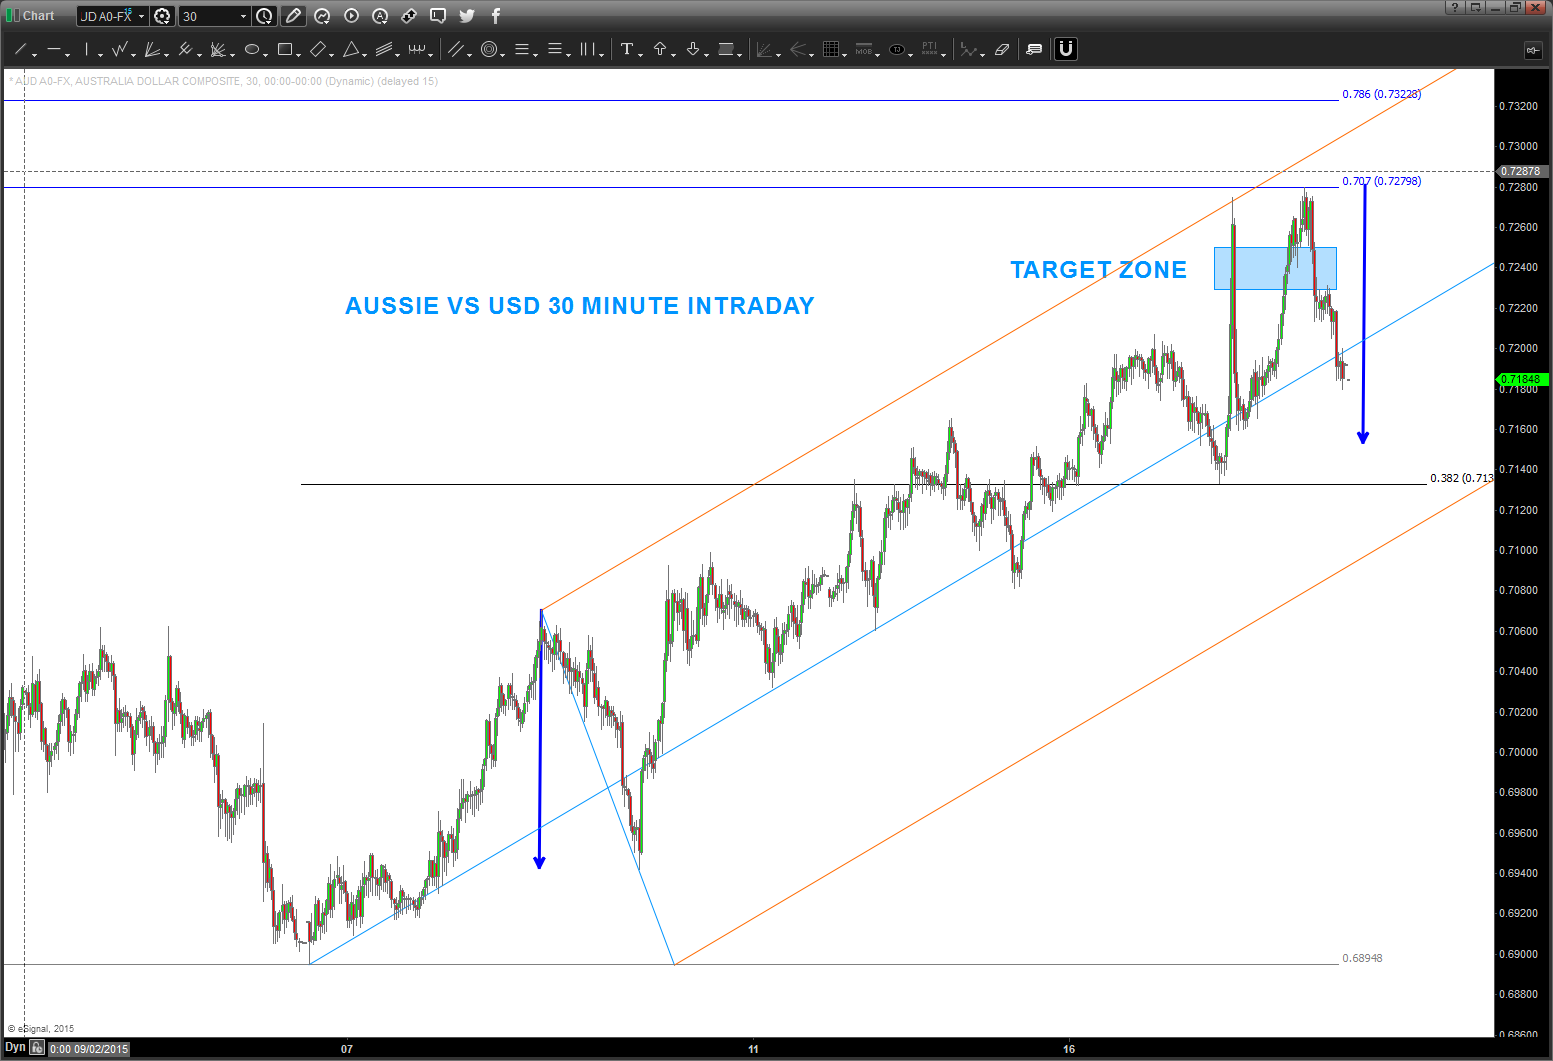
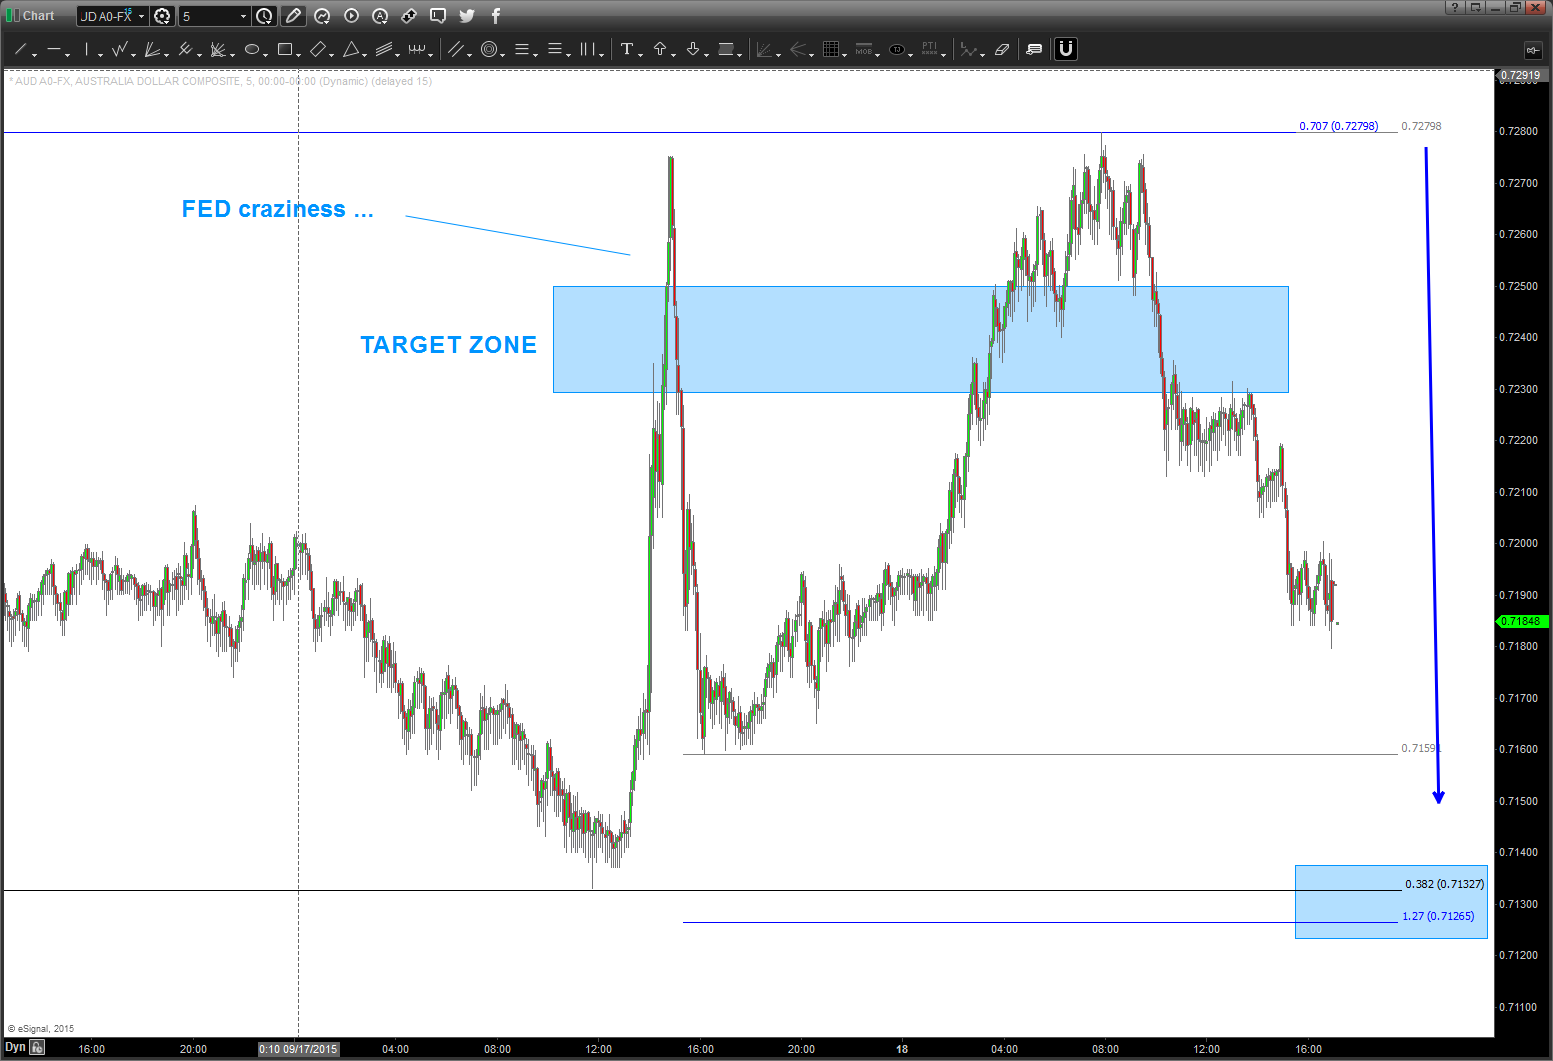
09/20/2015 – target zone was “OK” at holding back the AUD vs USD advance. (the FED craziness rolled thru it by 30 pips) but it did stop at the .707 retracement level – exactly. .707? (2, square root of 2=1.4142, 1/1.4142 = .707)
so, the current form, proportion and harmony tells me “lower” so I’m still WAITING for 7130 area.
gold/silver “should” be taking off for a “head fake” rally C wave that could be very powerful. hence my interest in Aussie, Kiwi, Loonie. I like the Aussie for reasons below – the long long term measured move hit exactly on September 06 2015. so, yes, I’ve have been sitting on my hands to go long for 14 days. and I’ll keep waiting till a BUY pattern emerges. 🙂
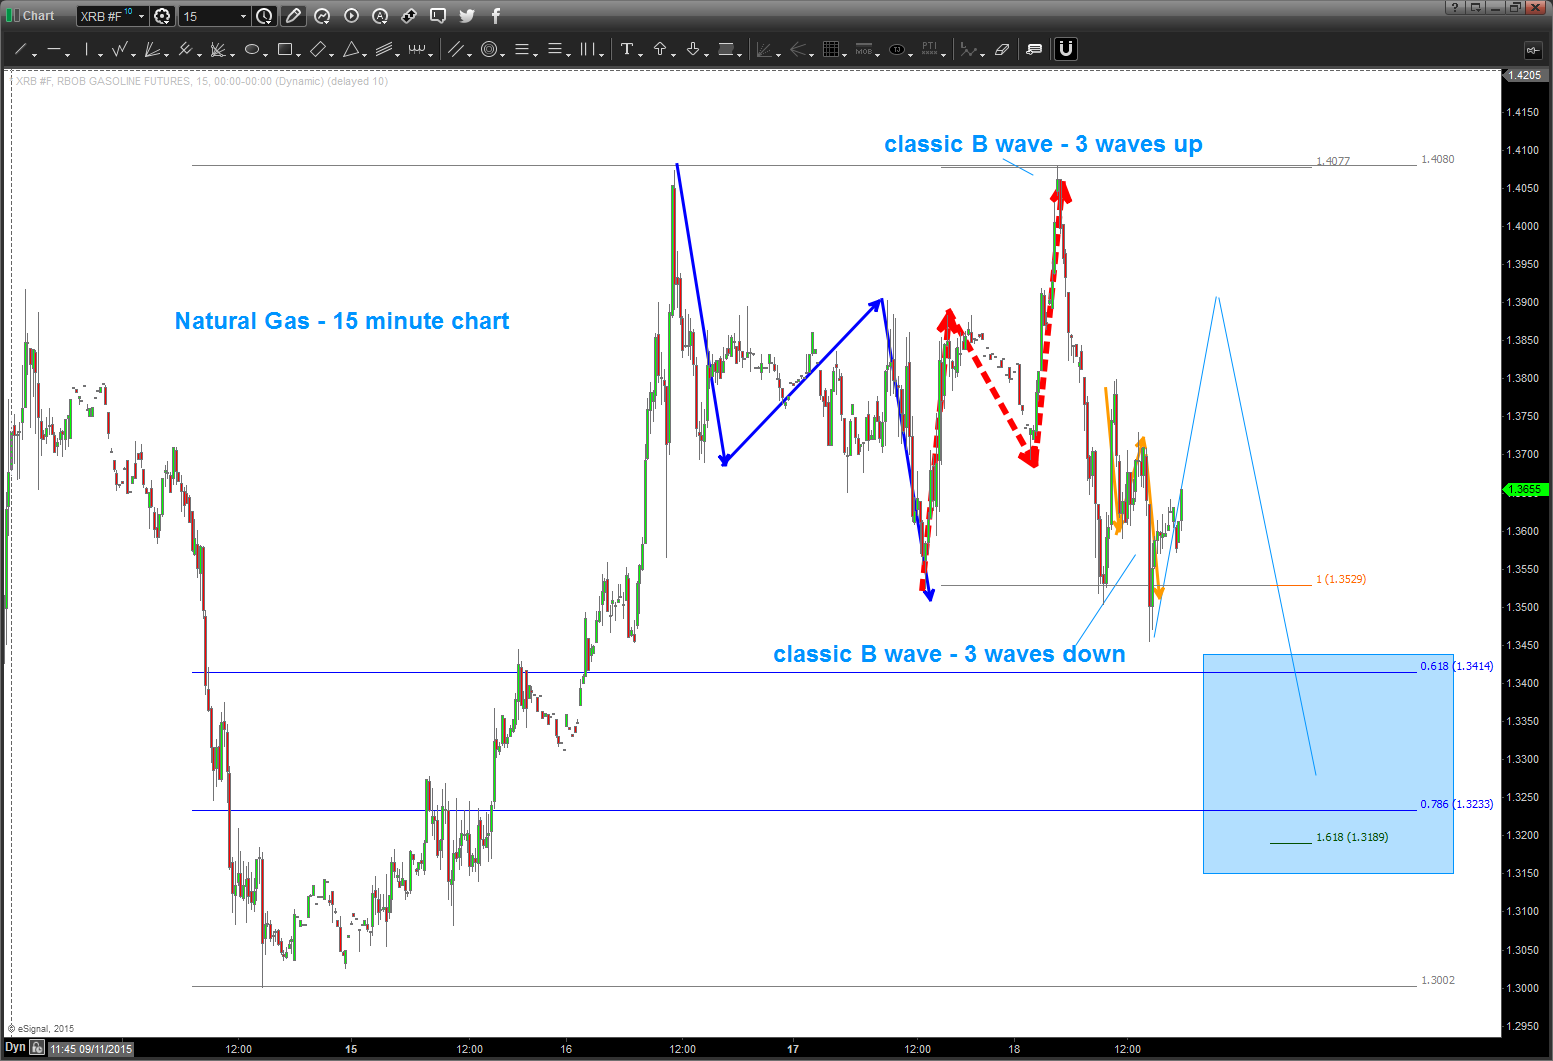
Gasoline futures are giving me a “better” picture because the FORM is very nice. take a peak below – see the 3 wave move UP into a new high – CLASSIC B WAVE STUFF. only problem is the recent price action I convoluted. but, USUALLY, when we have a 3 wave move UP into a new high the move down is 1.618 of the first move down .. shown below.
So, we wait.
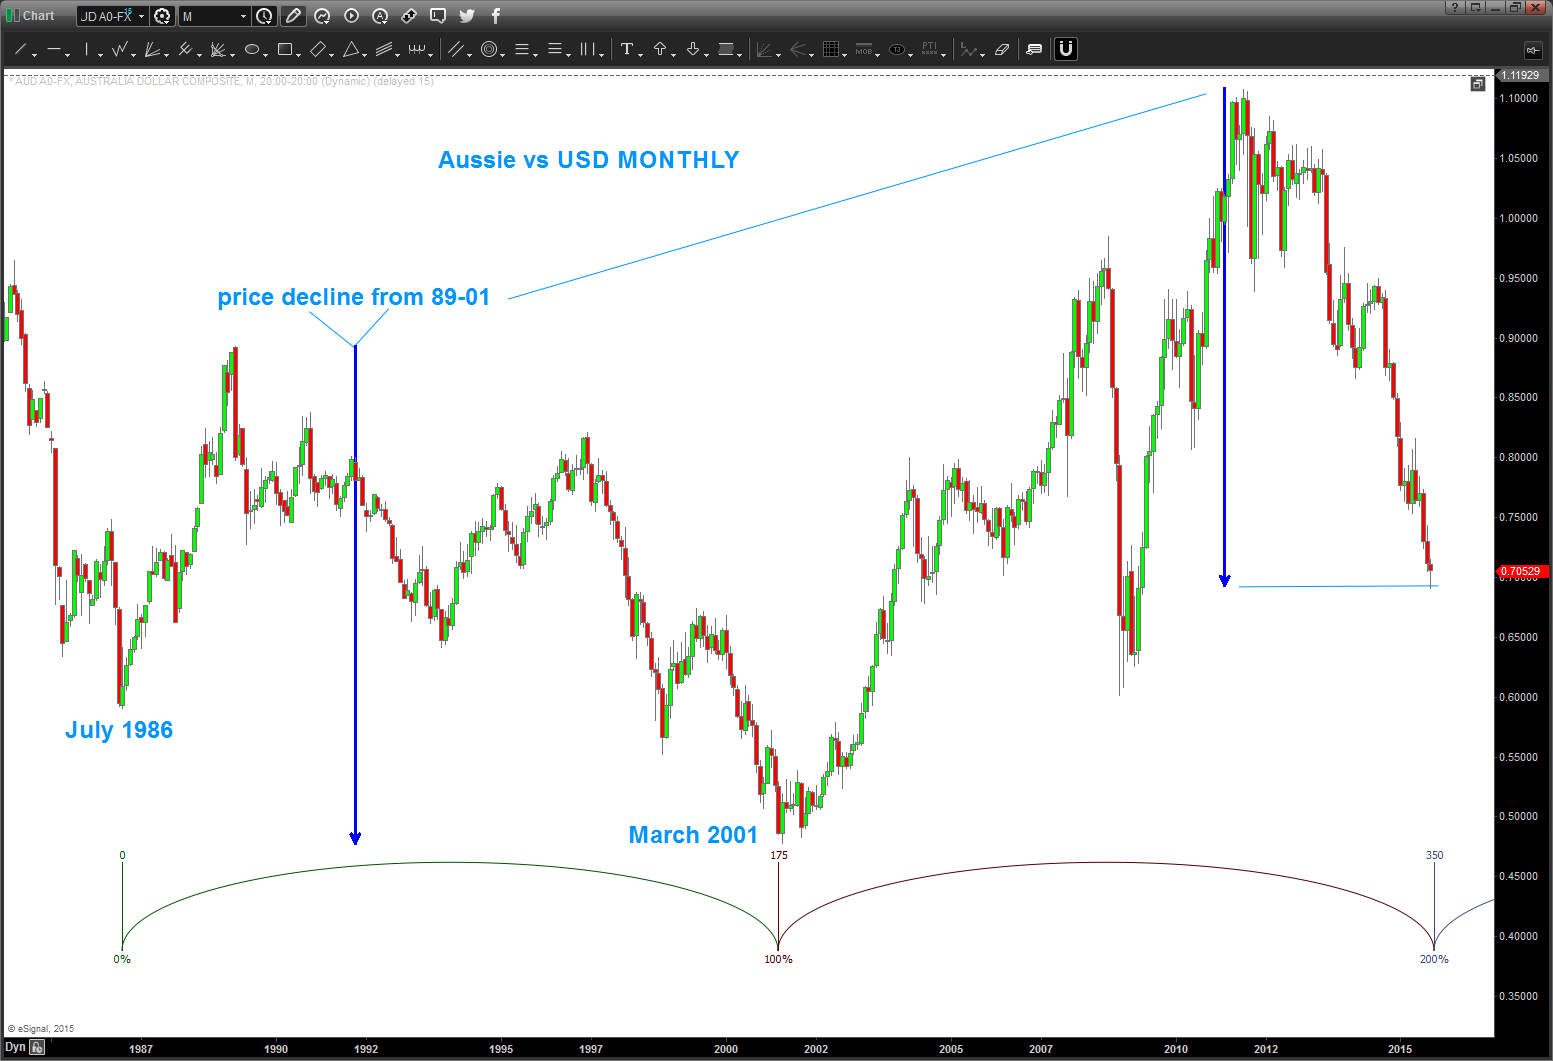
09/08/2015 – my target area/zone got crunched pretty bad, and my count is wrong. all that being said, I didn’t take into account the measured move from 89-01. quite frankly, w/ all that ‘stuff’ coming into the areas as shown below I didn’t think it could. So the age old adage of “thinking” versus “seeing” left my target thumped. W/ so much thrust and momentum going I did not take the long trade but have been waiting …
but, as of last night it has give us a DAILY SRC and when I went back and erased everything I saw a monster cycle coming in and the measured move hit perfectly …hmmm.
how to play ? WAIT for a PATTERN to appear on perhaps a 60 minute chart .. watch gasoline futures and crude and the All Ordinaries for a sign of life and also the Chinese market …
here’s the updated chart:
will update (real time) the play here and the risk and the real time move of a dude in his home juggling dynamite w/ gorilla’s in a cage .. cool hugh?
Bart
Folks, back in October the post below the two dash lines was searching for a low to be in place on the AUD. The form and proportion were just about right. However, w/ the big move in crude, the interest rate extravaganza and the a whole host of other fundamental reasons the real issue is the PATTERN level didn’t work … it went approximately 300 pips below. HOWEVER, the overall thesis that the Aussie is bottoming versus the dollar still holds true. It’s showing some nice strength tonight …would love to get a very nice pullback to go long in/around these levels.
Updated charts below:
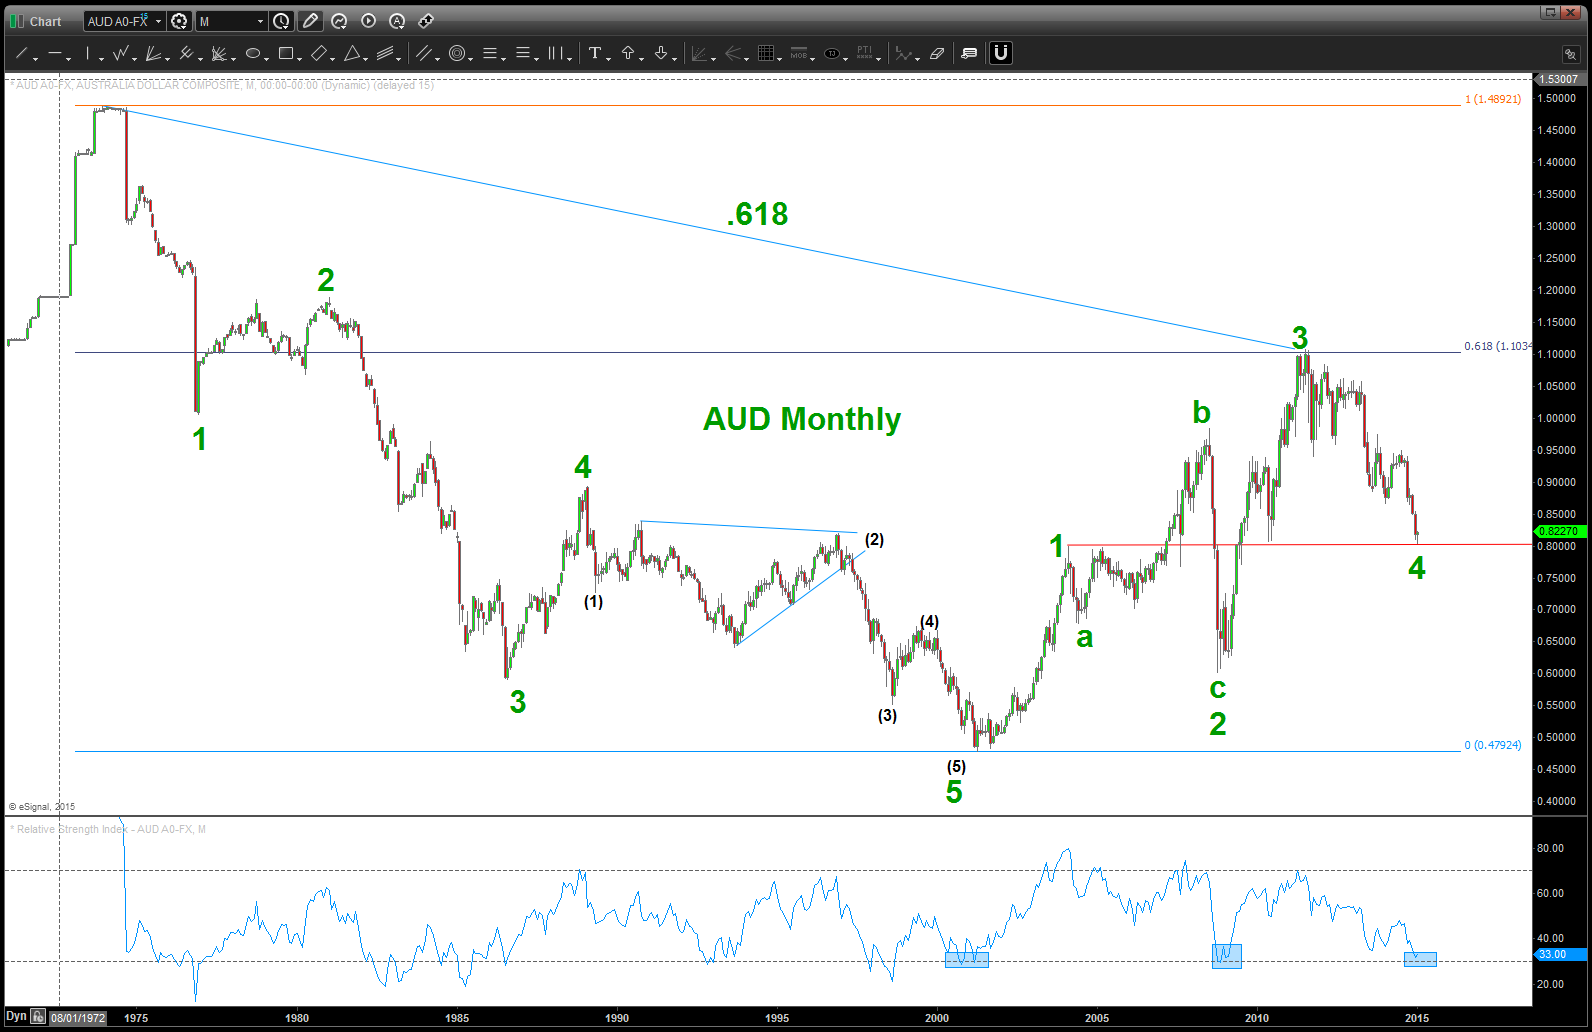
Note the monthly RSI levels … the BIG MOVES UP occurred right where we are sitting. Also, a case can be made that 4 is complete and we are going to new highs …
last time I checked the Aussie wasn’t part of the US Dollar index … so, watch this one closely. At a minimum we are completing/completed an A and a nice B wave up is to occur.
let’s just get on the right side of the trade and right now that looks like bullish entry for the AUD vs USD.
The Aussie has been correcting for a while and, folks, the move down from 1.100 ish certainly appears to be corrective. What does that mean? We are “at” or “near the beginning of a multi year advance that will take out the high July 2011. Here’s the monthly picture …
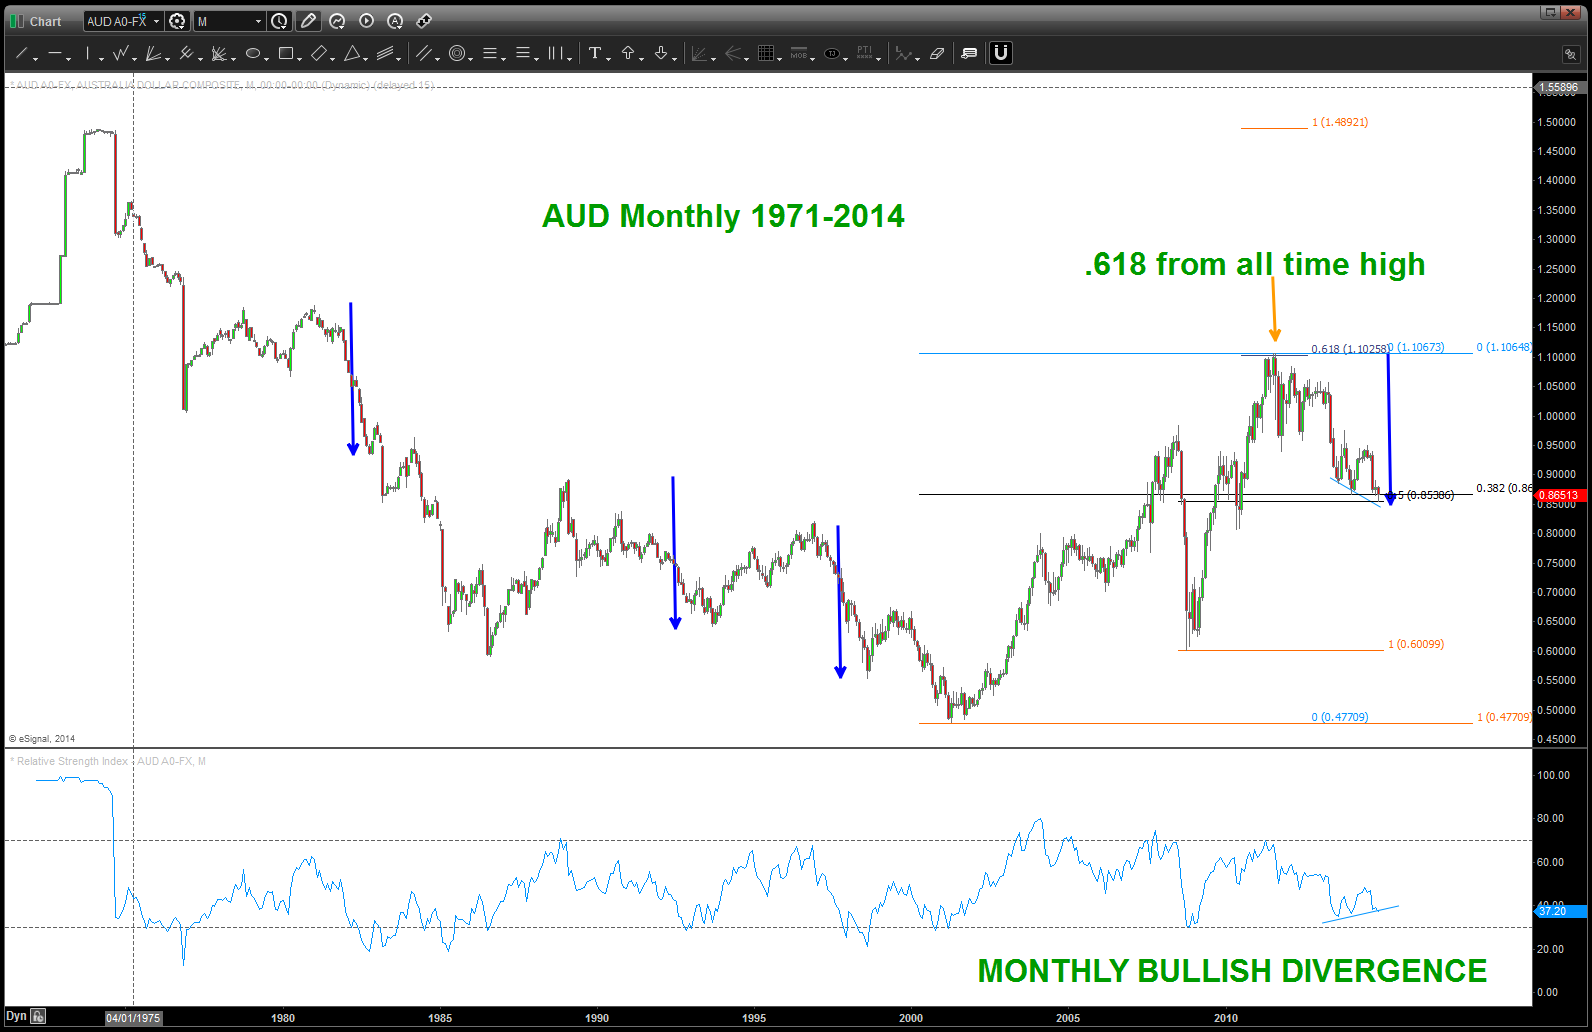
TILT … everyone is talking about US Dollar strength – yes, but they are talking about the dollar index which the Aussie isn’t even a part of it. Or if it is the weight is negligible so in this case we have to take this pair as a single entity – not a weighted index.
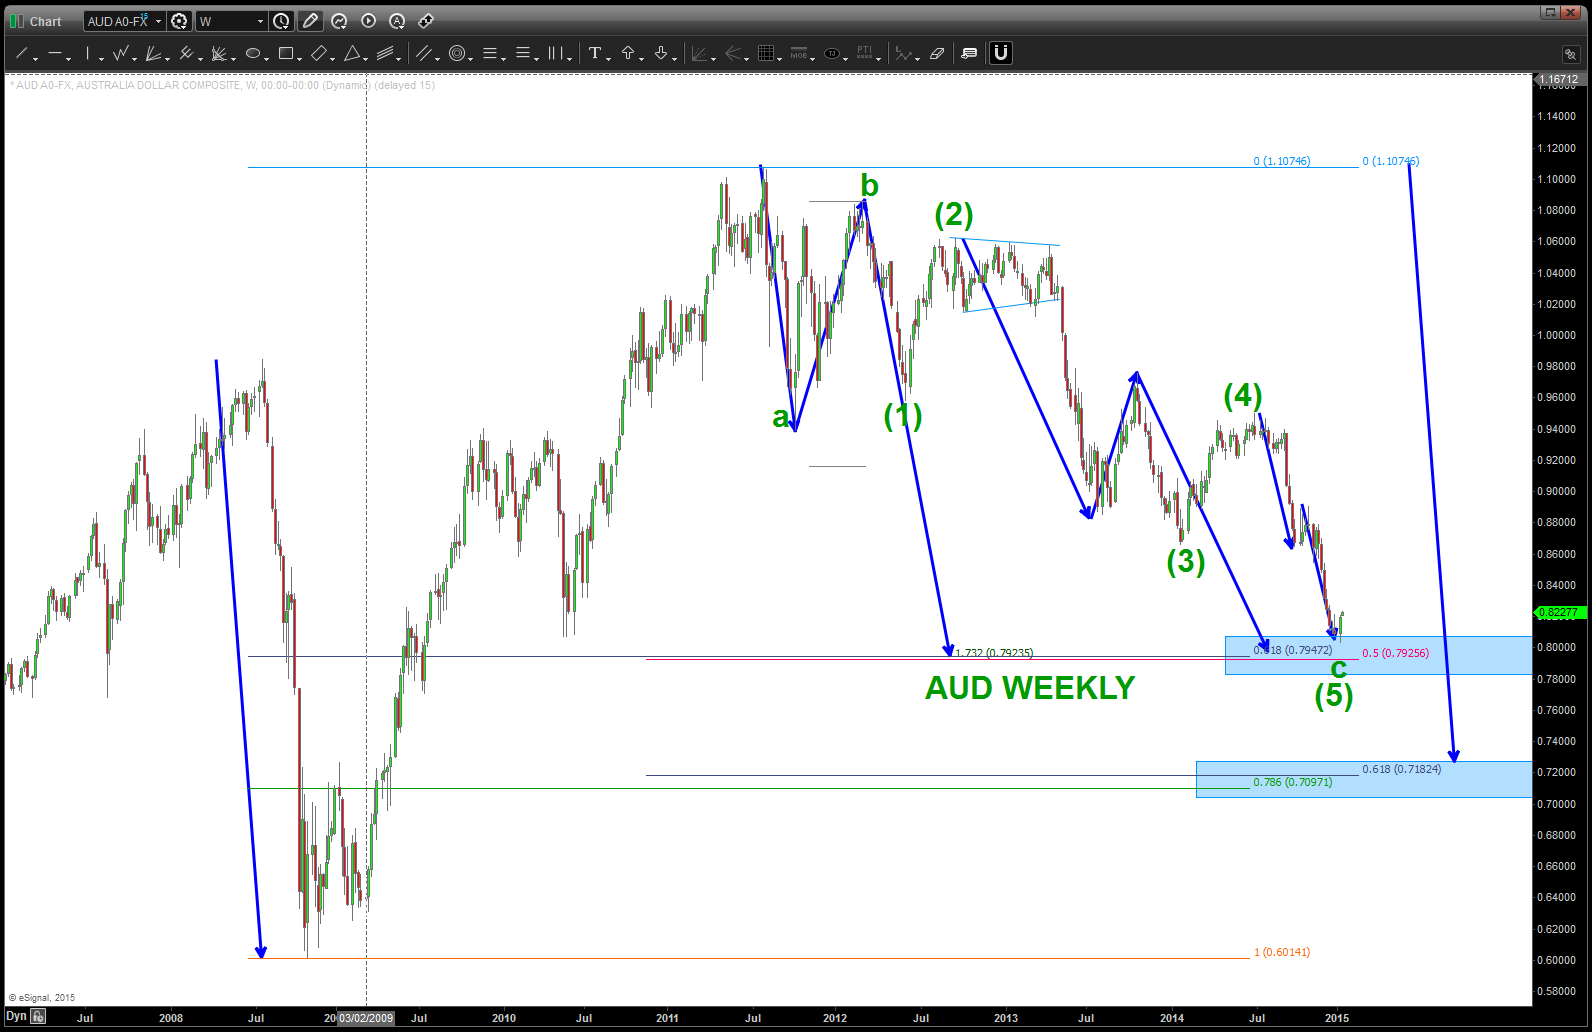
here’s the weekly:
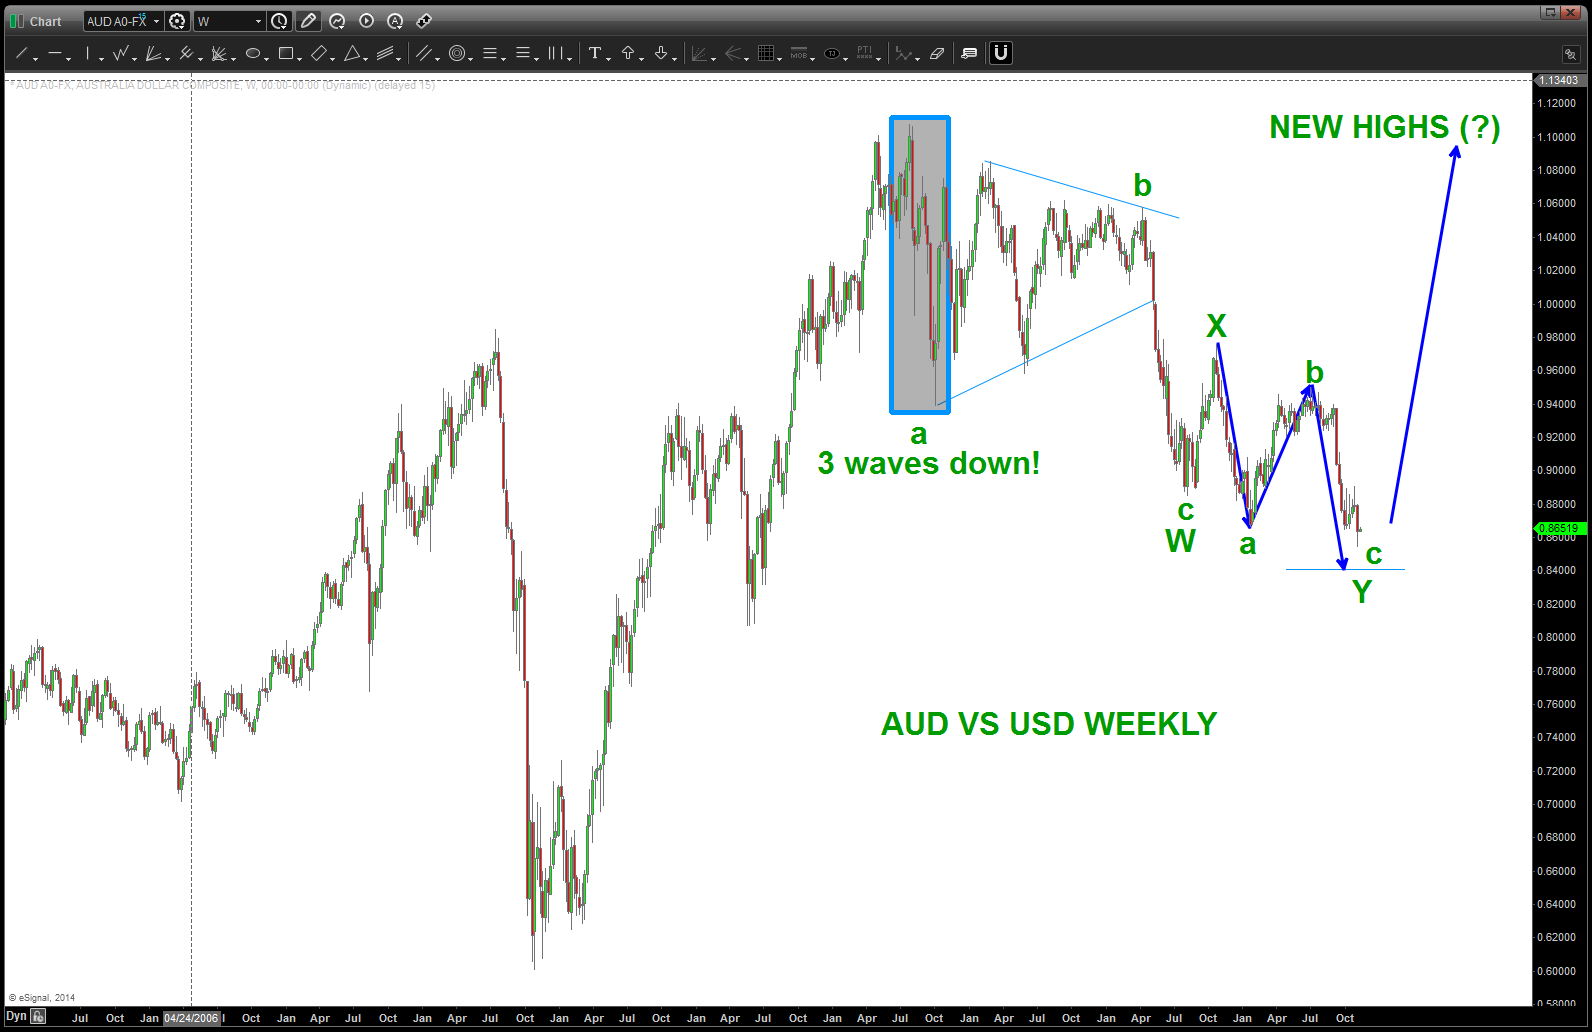
note the 3 waves down … that is the key. it was not a 5 wave movement. has this correction been complex – yes. But it’s falling right in line w/ a double three labeled w,x,y.
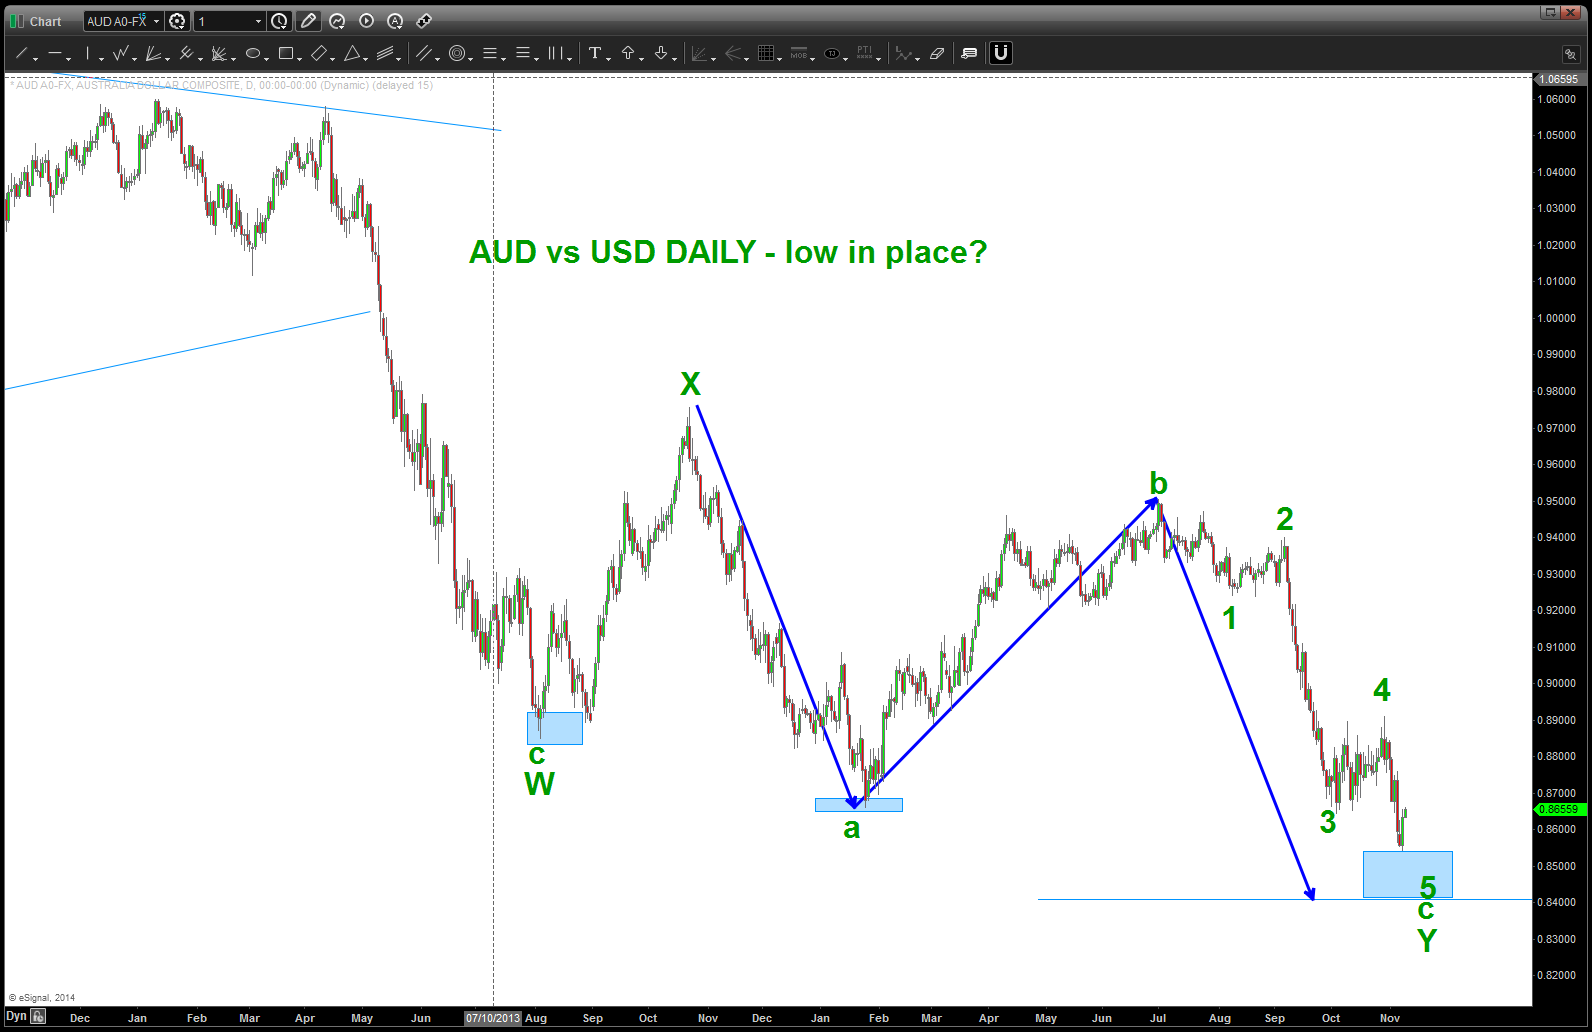
and, the daily, shown below, just completed 5 waves down. While it would be perfect symmetrical three drives to a bottom is we go down and attack 8400 – there is a good case to be made that a low is in place. we’ll have to wait for an intraday pattern to appear …
and finally, we’ll see the move down on a 60 minute chart is a clearly defined 5 waves.
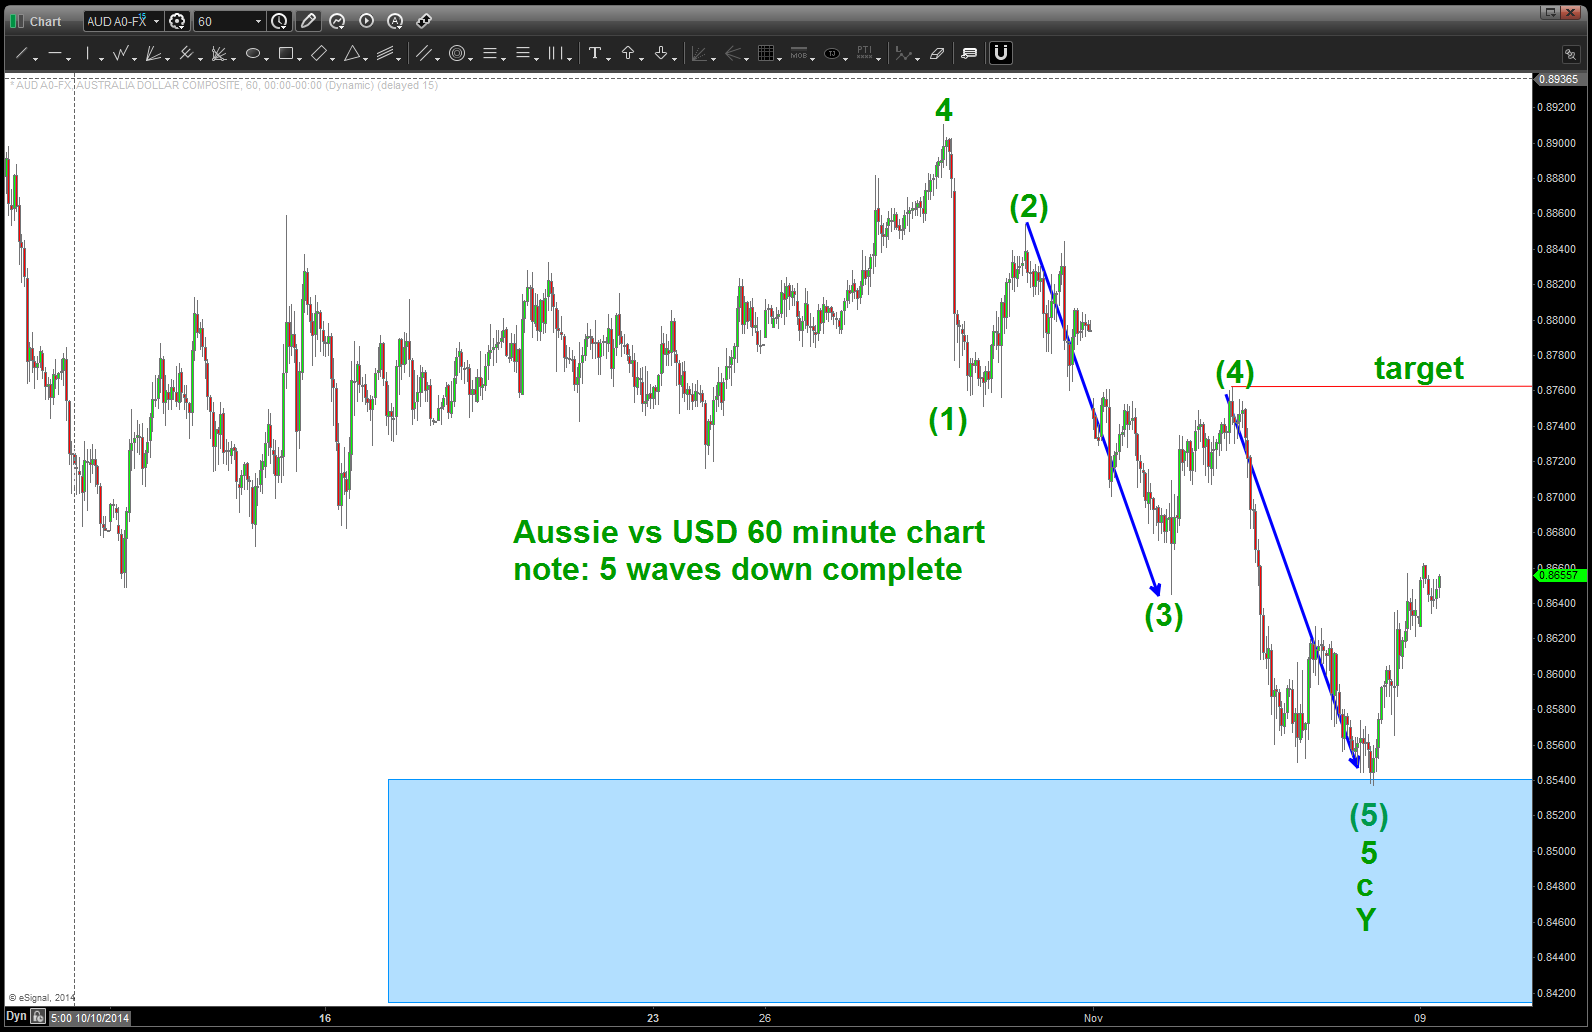
so … there ya have it.
what to do? Well, our thesis is we are beginning a multi year move to take out the old highs from 2011. IF THAT IS CORRECT THEN WE ARE IN the first stages of the advance. the first move up (wave 1) will complete and then wave 2 will come and, more than likely, w/ a vengeance because everyone thinks the “old trend” is in play. That’s the BUYING OPPORTUNITY and price should never go below the low that was formed last week.
stay tuned …get ready to rumble.
Bart
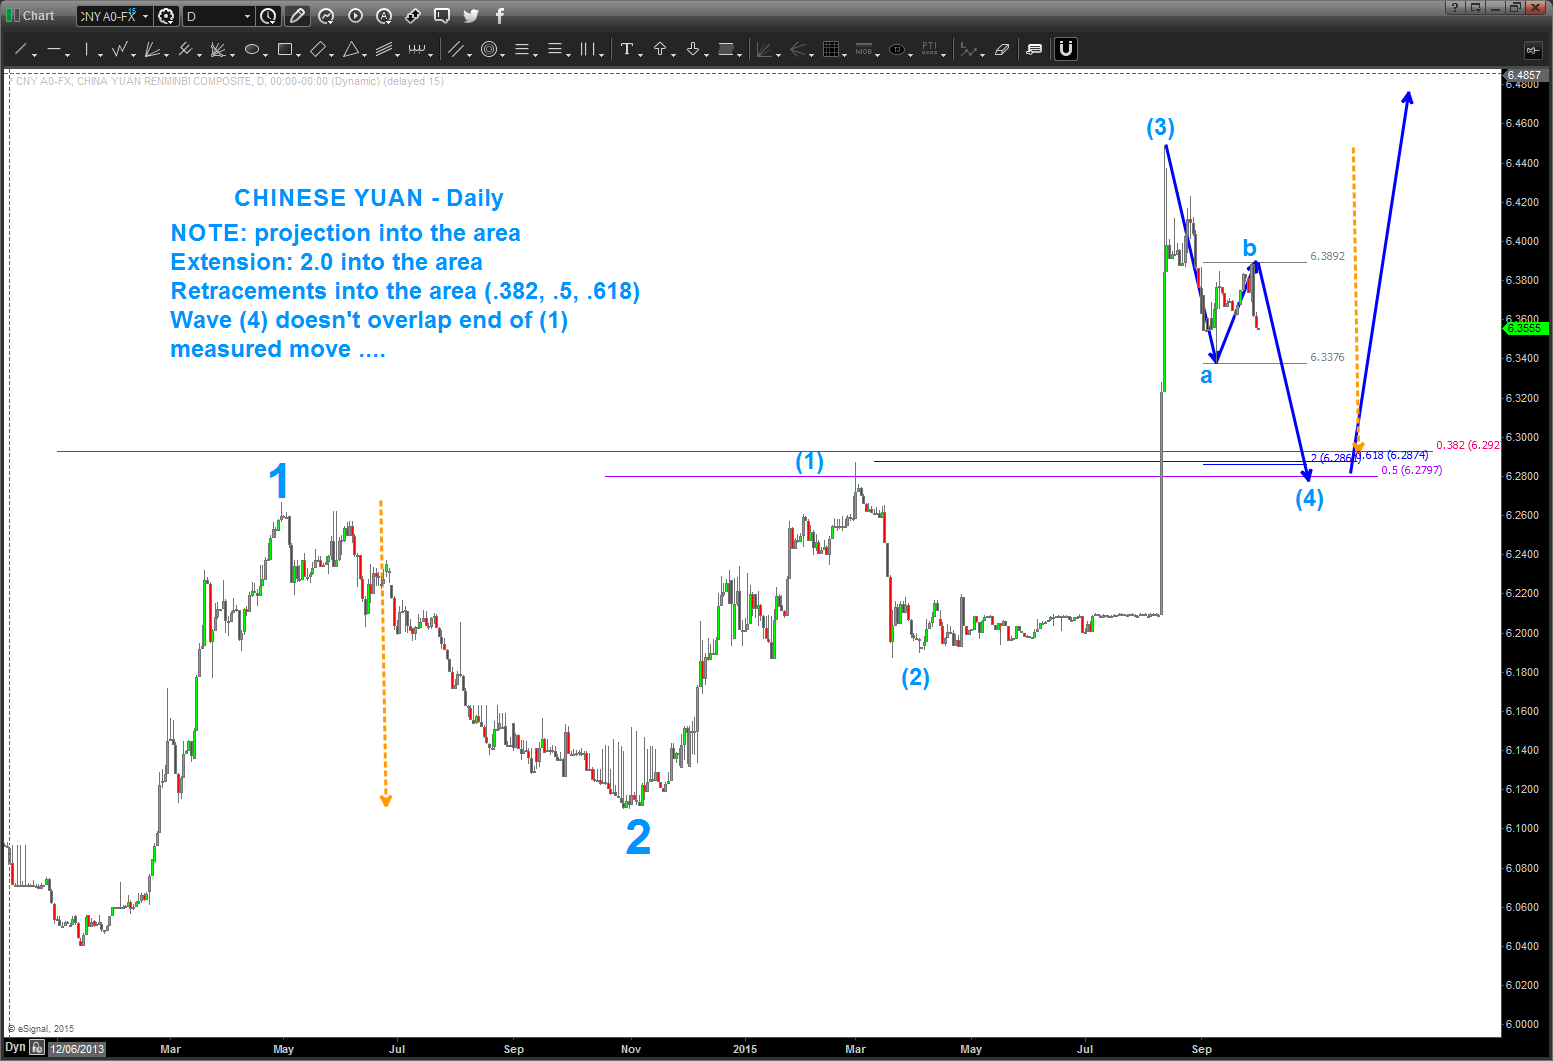
Chinese Yuan PATTERN coming into play …
Posted on September 30, 2015 Leave a Comment
here’s the pattern that’s playing out … a “perfect 3-3-5 zig zag” and then off it goes again. as Bruce Buffer says on the UFC “HERE WE GO”
pay attention to this level over the coming days.
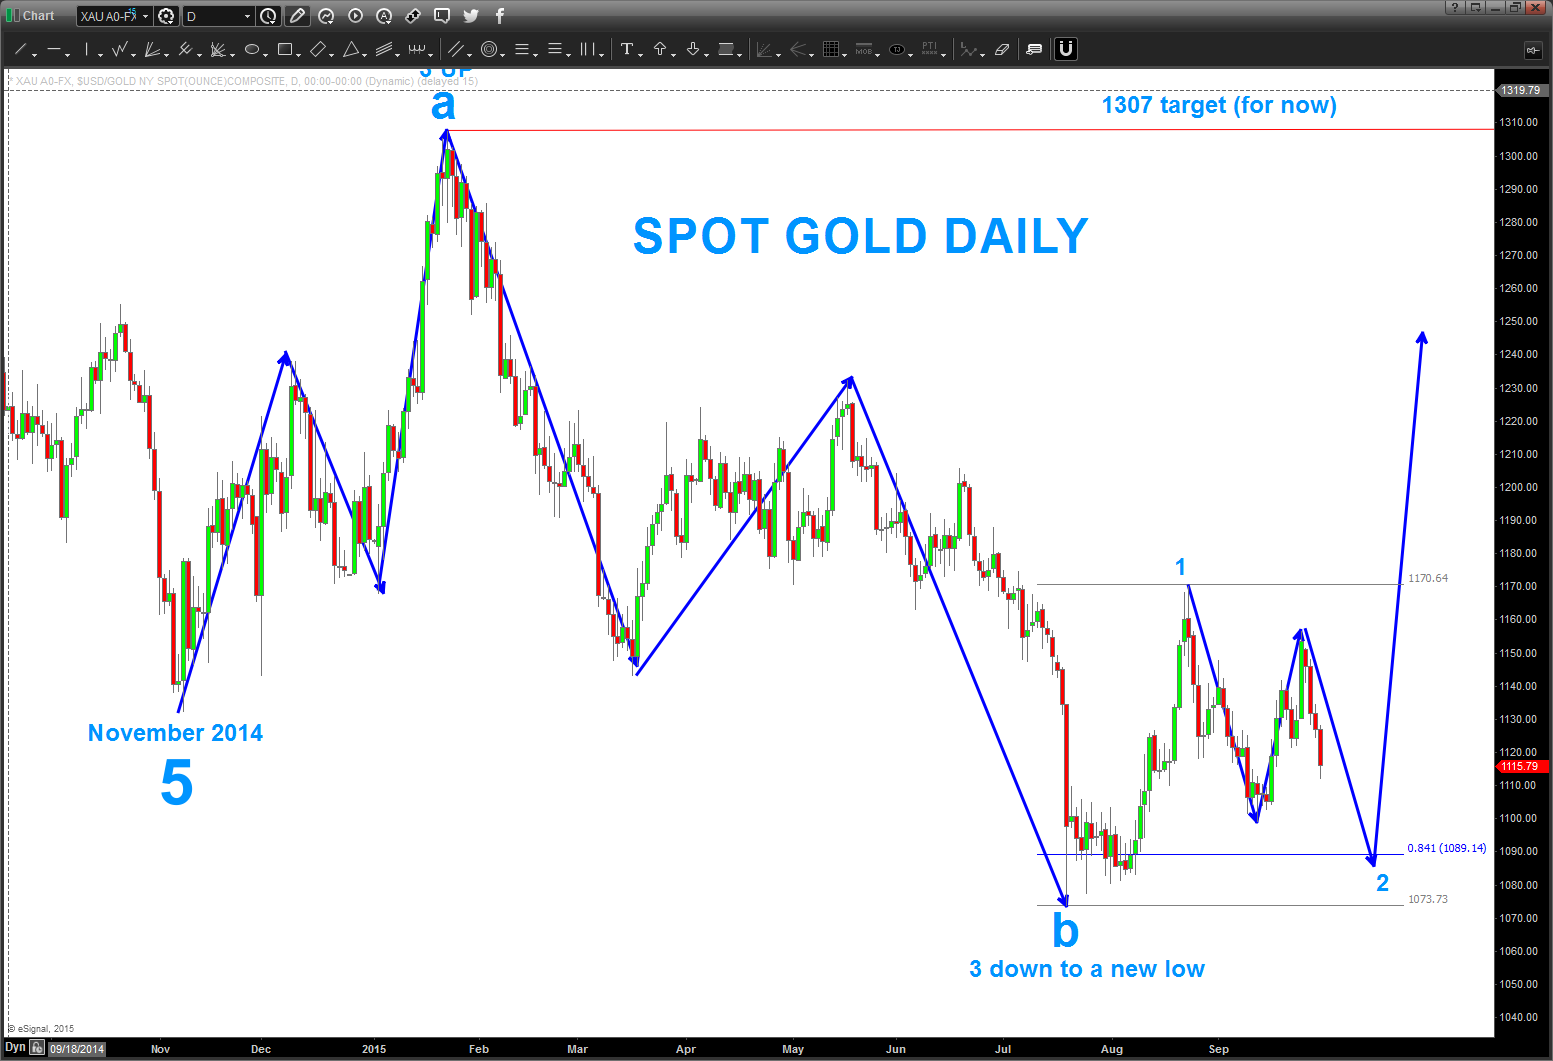
3 waves to a new “low” … don’t get fooled w/ Gold
Posted on September 30, 2015 Leave a Comment
just like were watching the 3 waves into a new high in Coffee and then lower .. same thing is appearing in Gold.
take a look … a “perfect” 3 waves to a new low AFTER 3 waves to high at 1307. My take, were getting ready to blast off in gold up to the 1307 level and a 3-3-5 flat correction.
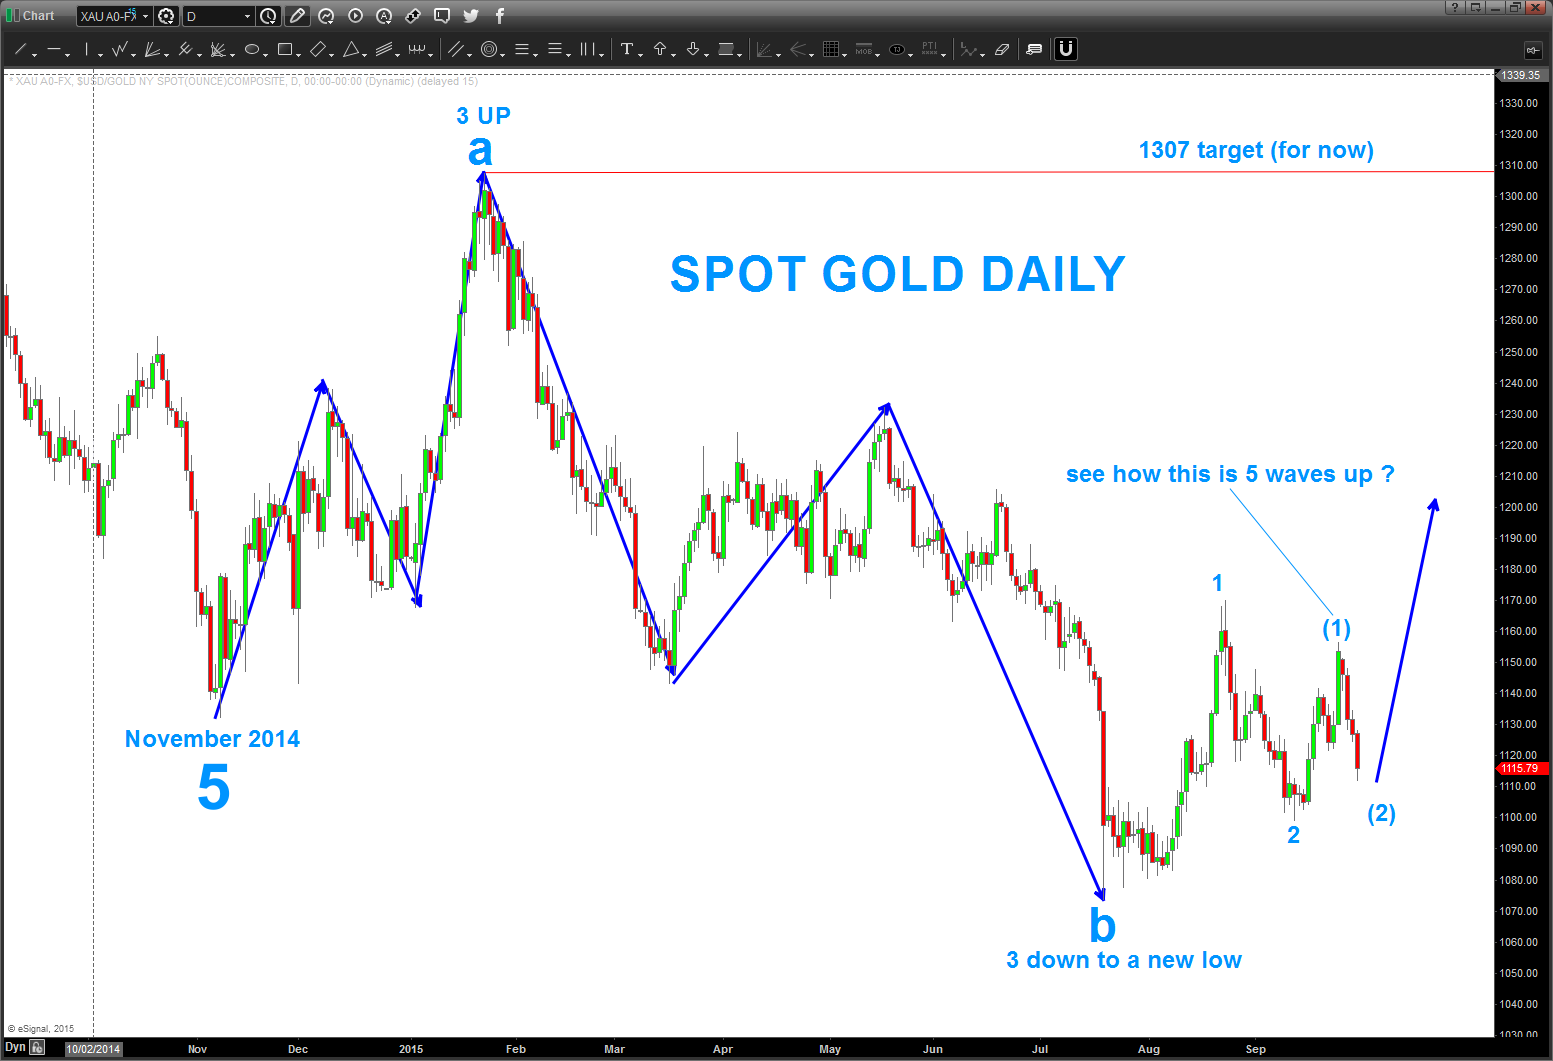
or, this the other alternative … all best are off w/ a daily close below 1073.
Who gives a crap about “zero price points” – musical chartist’s do …
Posted on September 29, 2015 Leave a Comment
cannot wait to see the hate mail that comes in on this one ….
first off – everything – to the best of my ability – that I post is “real time.” If I don’t have something real time I will mention it.
so – zero price? who cares, right ?
well, here we go again, in times of extreme parabolic blow offs the ONLY thing that is going to hold it back or up is the zero price point and geometry.
just saying … don’t believe me? here’s XLV as it took off and note – top of the circle was at 76. So, it missed it by a dollar .. shoot me.
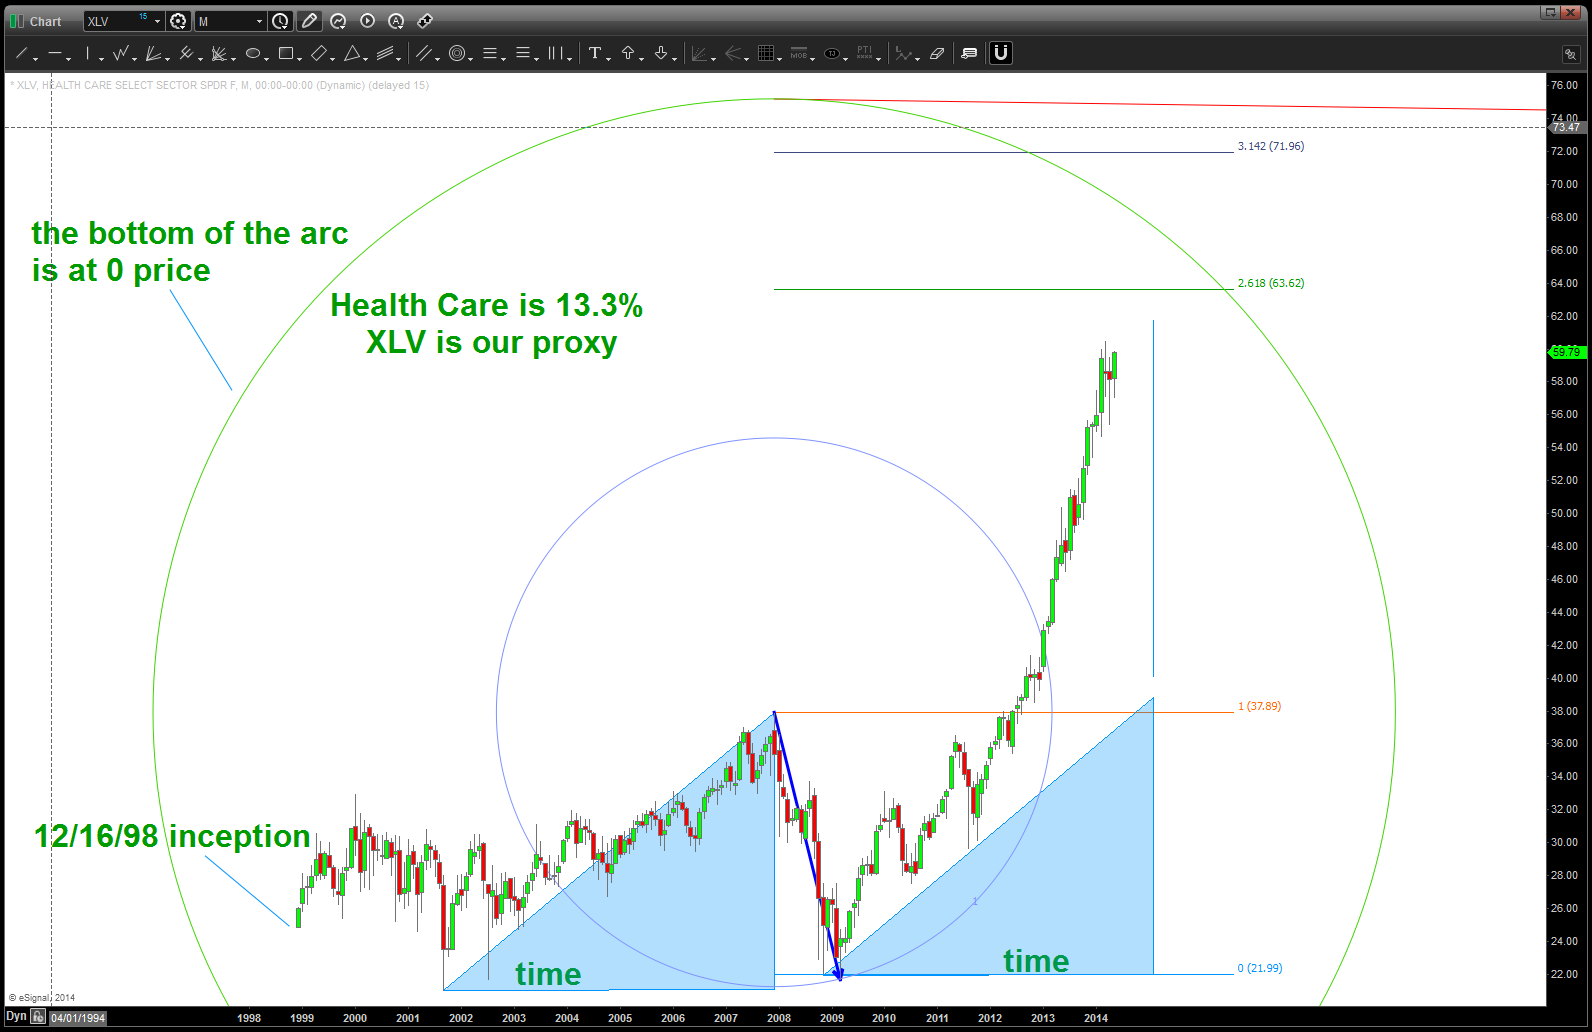
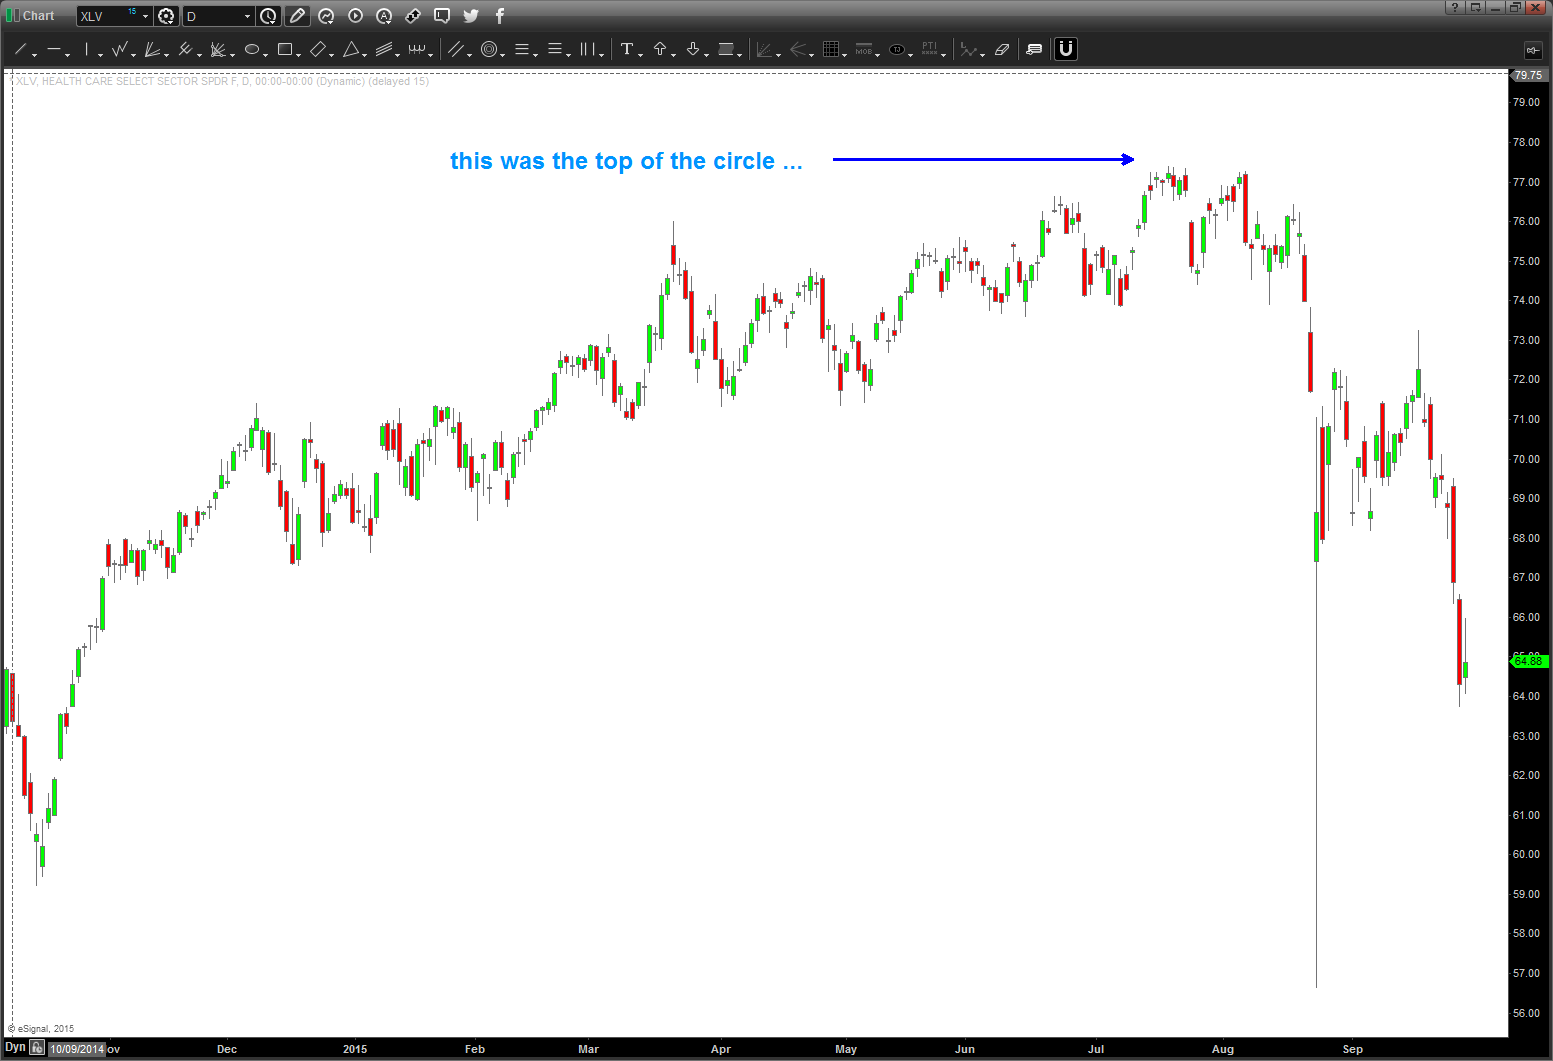
for good measure … why not? It’s my blog right?

PS – in the picture above, the feet are “0” price …. cheers!
B
the Music of $NYA
Posted on September 29, 2015 Leave a Comment
Folks, you know that part of Pink Floyd Echoes around 14 minutes into it when the Seagulls are flying? I always love that part and always ask myself “self, why did they put that in there? It’s perfect.”
The entire 23:32 is perfect harmony and proportion and transitions … and tonight, for whatever reason, it reminded me of a post that I did on the “Music of the New York Stock Exchange Index” – copied below. I did it on August 09, 2015 as I had a “gut feeling” that we were due for stiff resistance.
I have NO IDEA what is going to happen tomorrow. If you notice, of late, I’ve been putting out a bunch of BUY PATTERNS (IBB, JNK, BABA, IBM, GOOG) and guess what – they might work and they might not work. ALL I KNOW IS WHERE I’M WRONG …
That makes life so easy …I’m not trying to read another analyst report about the fundamentals, or blue horse shoe on XXX. I trust that my patterns will be 100 percent every single time. 100 percent at telling me where I’m wrong … the patterns are based on musical theory, vibrations and a bunch of other stuff. Do yourself a favor … try to study them and take all the other shit off your chart.
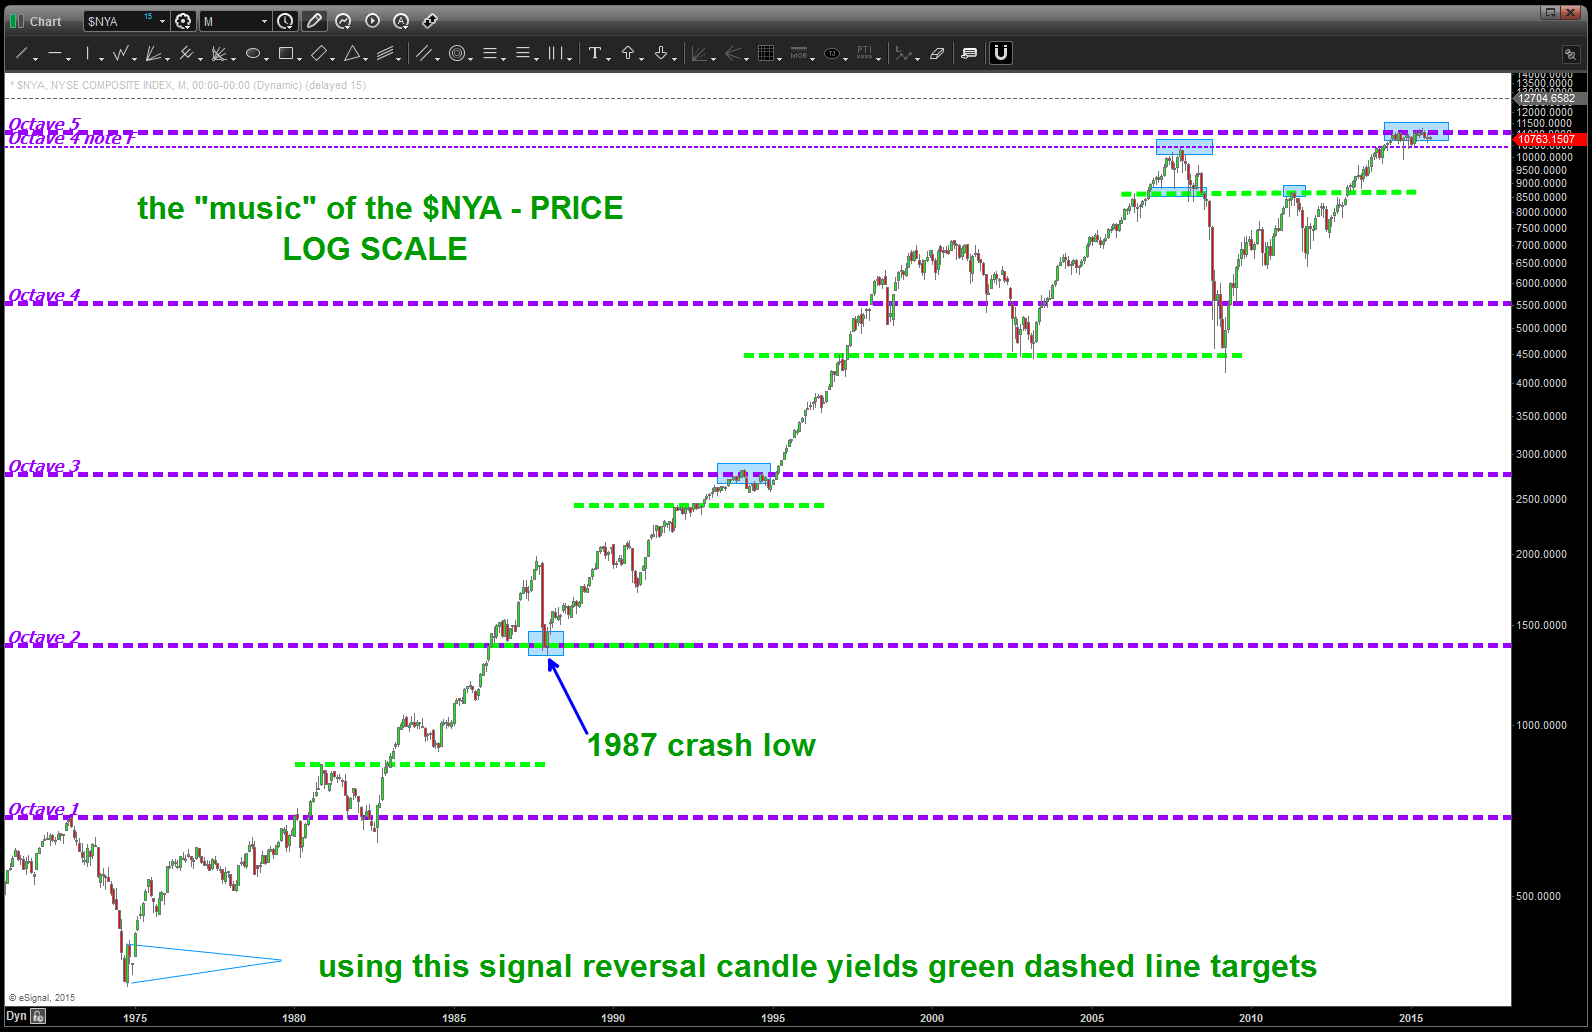
So, on that note … take the time to STUDY this chart. Using the all time low back in the 1970’s on the $NYA you’ll find amazing support and resistance simply based on using that all time low as the SEED and multiply by 1.05946. Every 12 notes, we have an octave. Every 12 notes we also have the 12 disciples, 12 signs of the zodiac, 12 tribes of Israel and, in the end, the 12 cranial nerves. Again, I digress …but also, REALLY PAY attention to the second chart and follow the bouncing ball. Remember – TIME equals PRICE. 🙂
Bart
PS – 5th octave, 5 fingers and toes, 5 “working days”, I’ll stop.
equal octave scale of music is based on the 12th root of 2 … 1.05946. (darn there goes those square roots again)
taking the all time low of 346 we can project price just like we do music.
if you look below, it’s good to pay attention to where an octave ends … looks like we just completed 5 octaves, almost perfectly, on the $NYA.
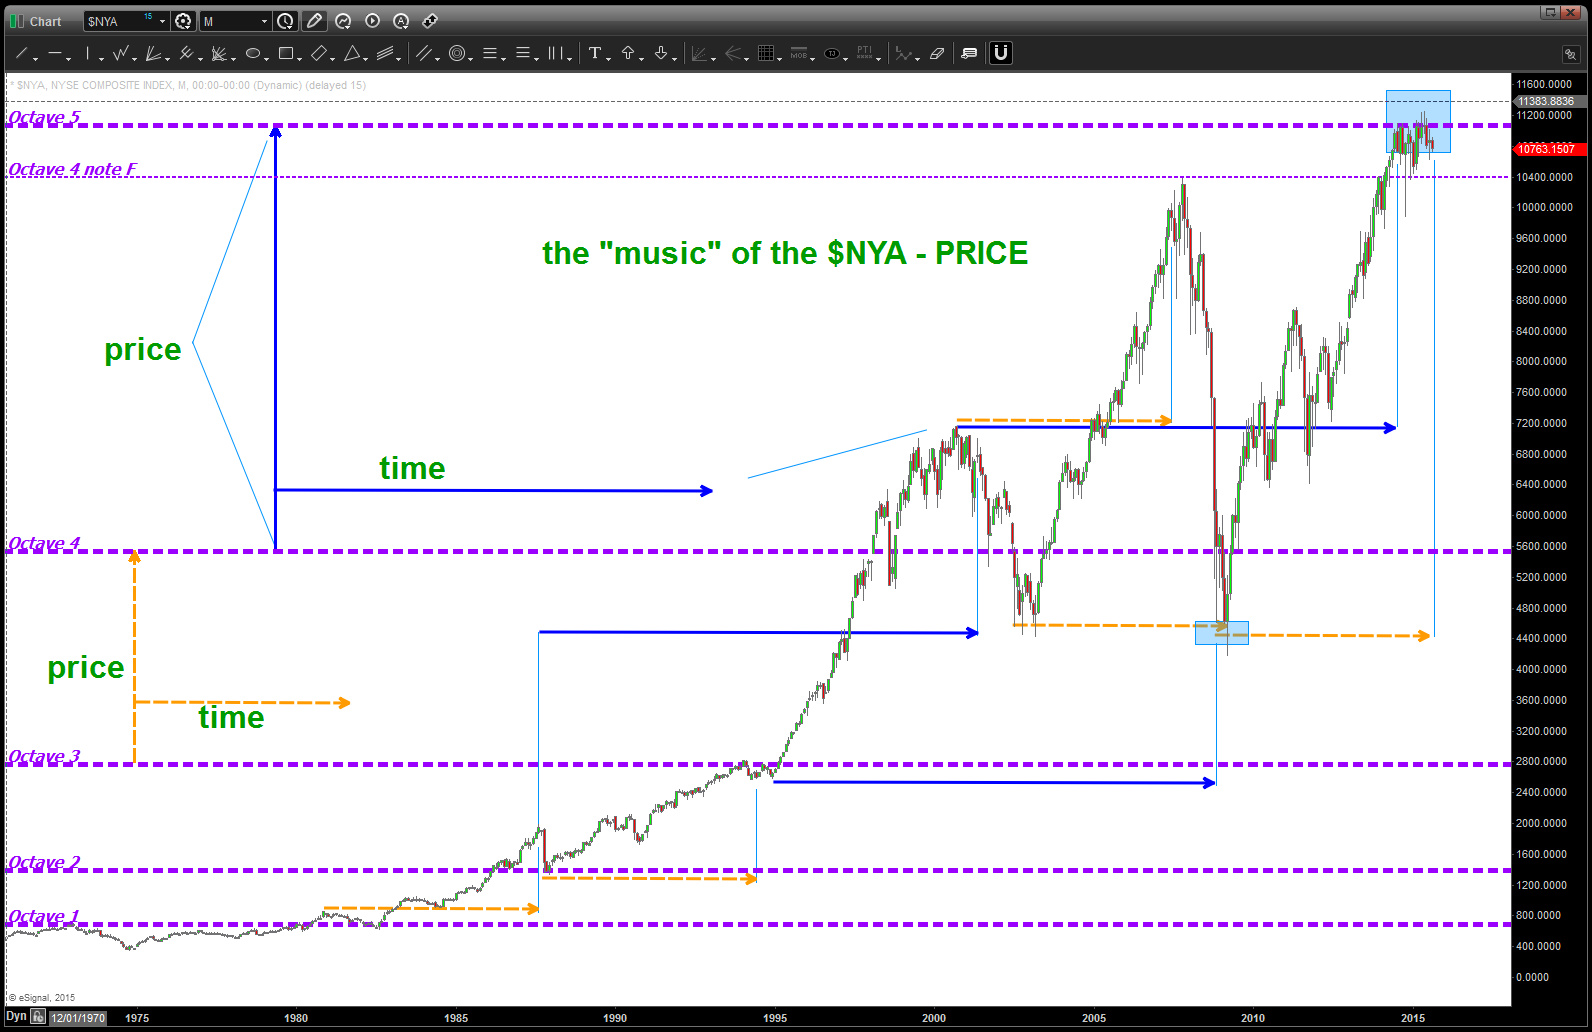
so, if PRICE equals TIME (which it does) THEN we can take a PRICE delta between an octave – in this case between Octave 4 and Octave 5 (non log) and look for a time cycles to spin out from important highs and lows? right?
please see below ….
$BABA
Posted on September 29, 2015 Leave a Comment
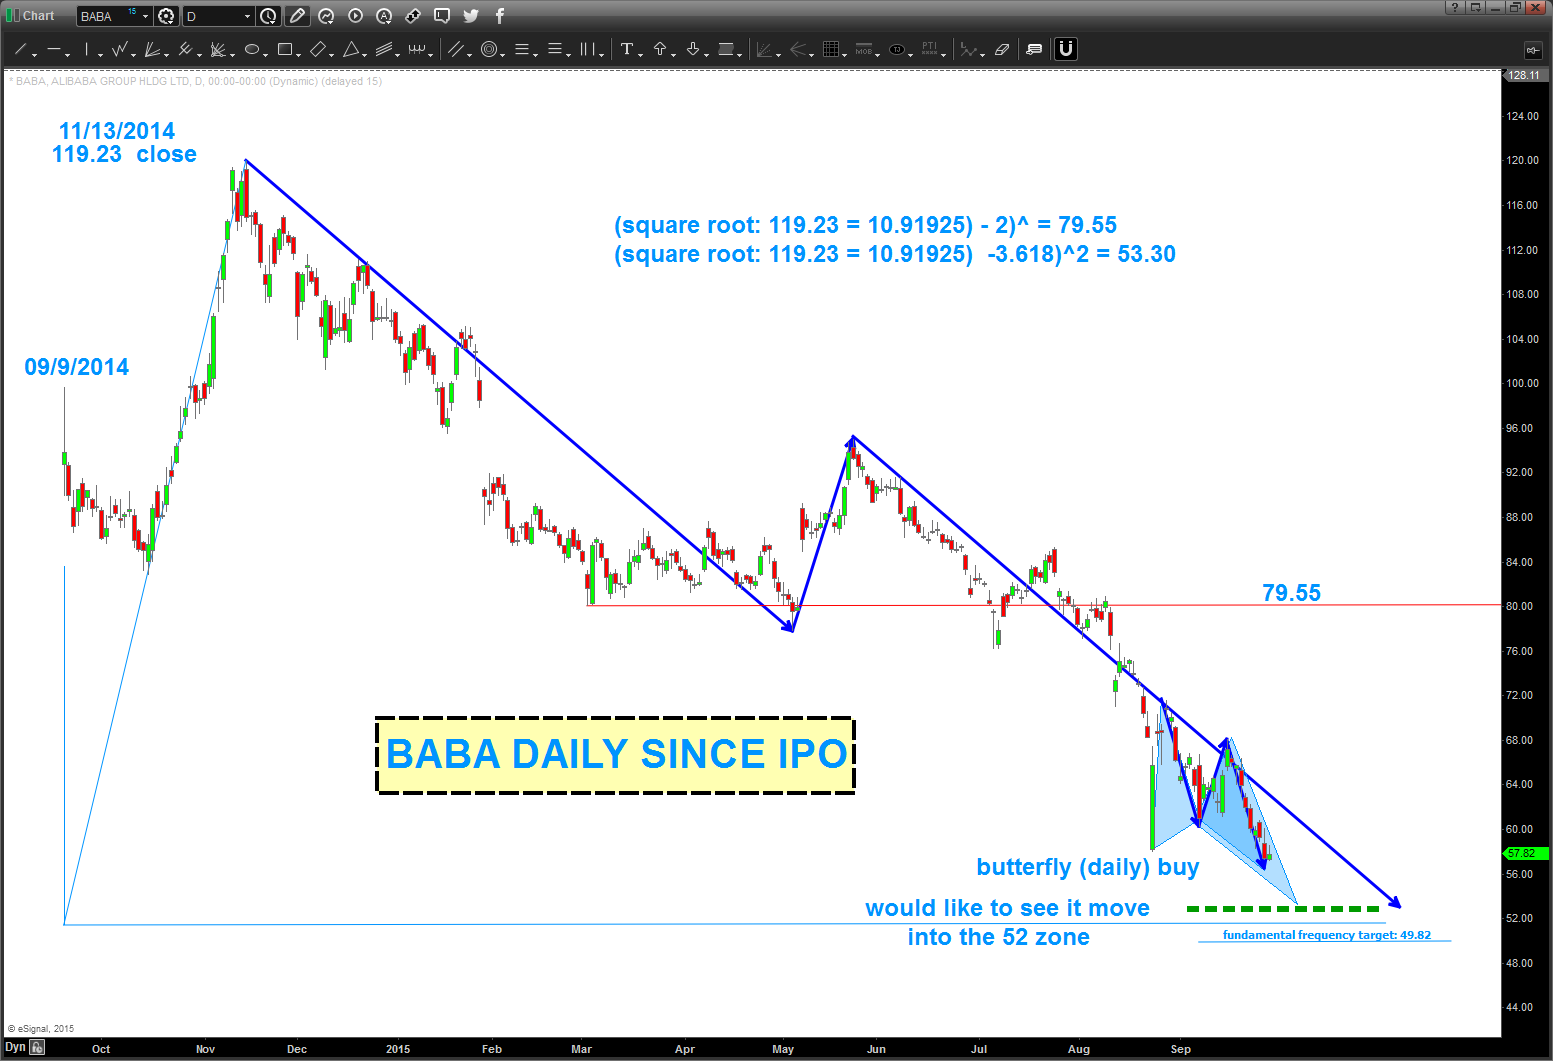
Folks, what a battering for $BABA. The entire world that bought the largest IPO in history has been underwater since basically February 2015. Perhaps, only probability here, their fortunes are about to change (pardon) the pun …
You can see below we have some nice MATH = MUSIC= VIBRATIONS coming into play 50-52.
post w/ the gang over @seeitmarket about Germany and some more …
Posted on September 29, 2015 Leave a Comment
the “powder keg” in this global, interconnected financial world appears to be Germany w/ $DB woes and Volkswagon and a bunch of debt. here’s a post about that:
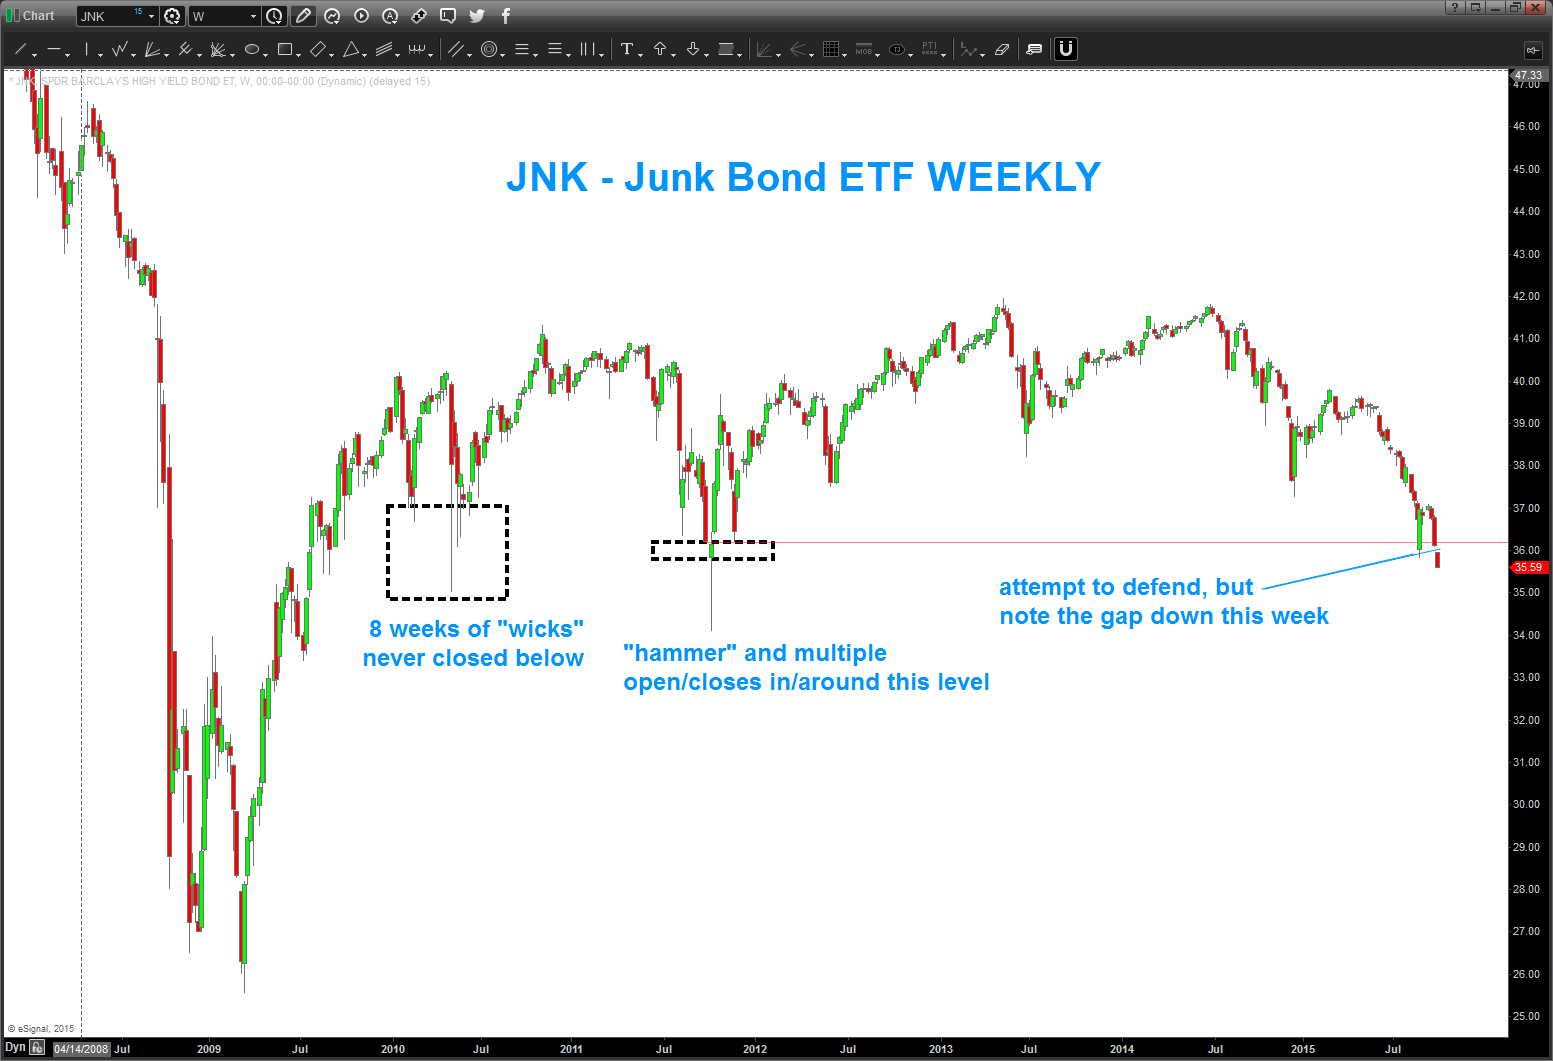
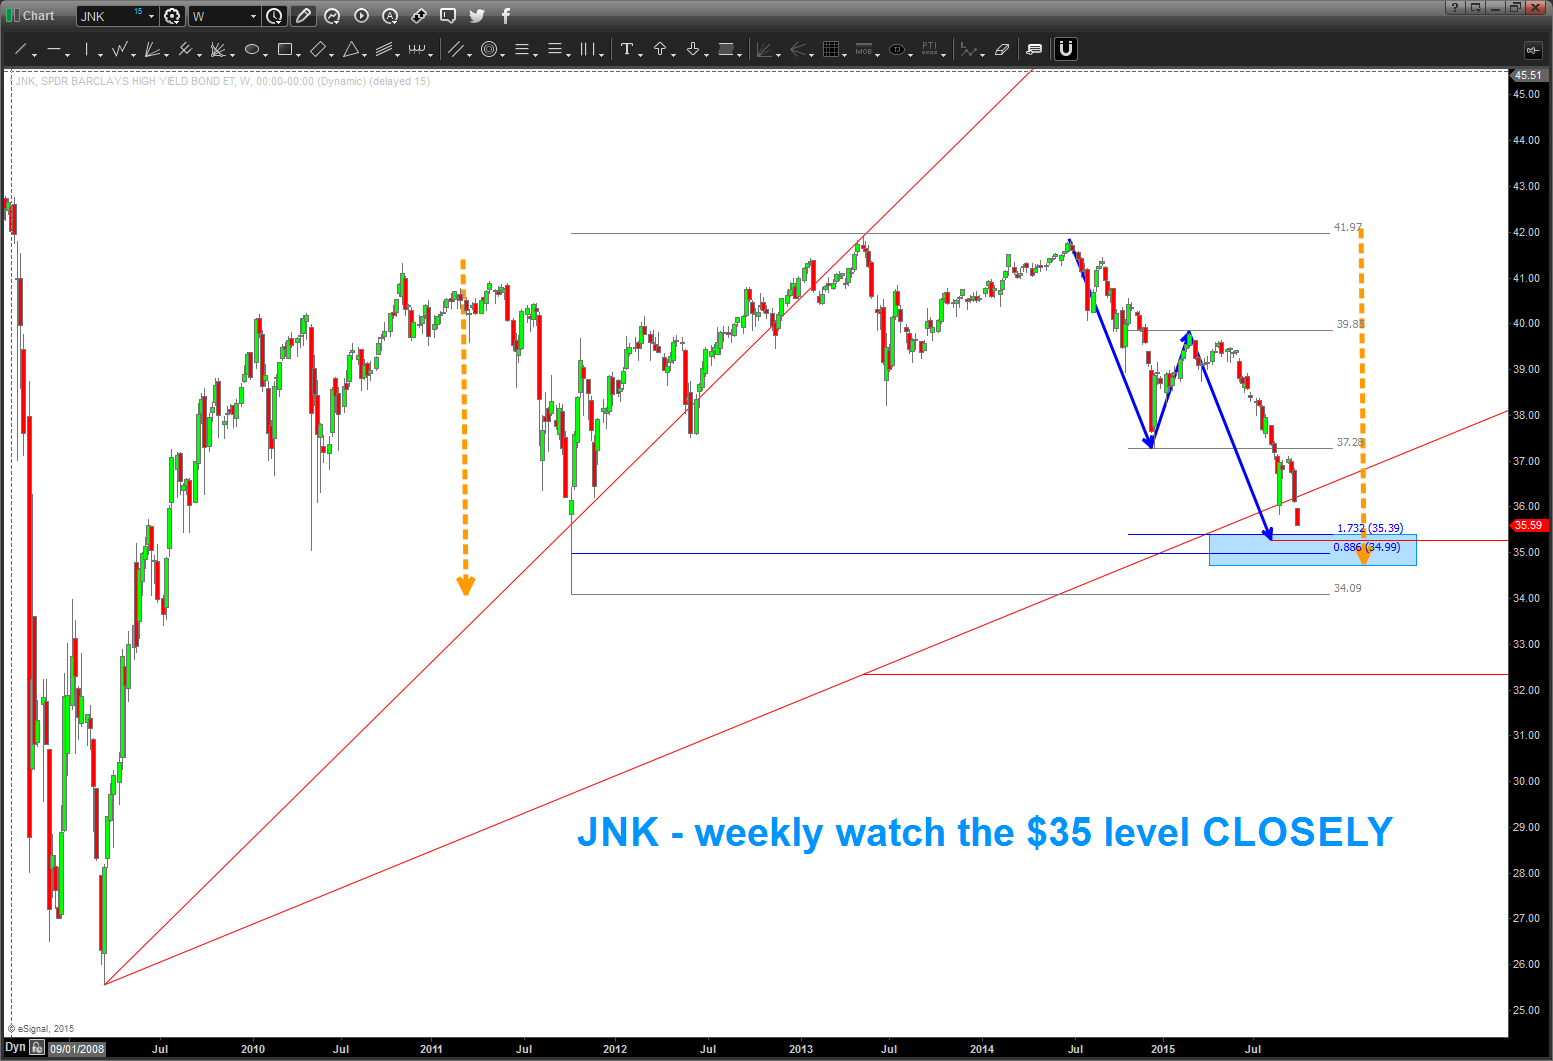
over in the states we also need to watch a very key level in the JNK ETF. Essentially, Junk Bonds are risky low grade bonds and show the appetite of the credit markets. In this day and age of grabbing for yield, somewhere, they have offered a speculative means to grab some yield, maybe. But in times of volatility they fall out of favor … as you can see by the chart below, the $JNK ETF is getting ready for the test of a very key level – 35. It’s nothing more than a pattern but you can see since the “recovery” of 2009 this level has been key. Watch this level, closely.
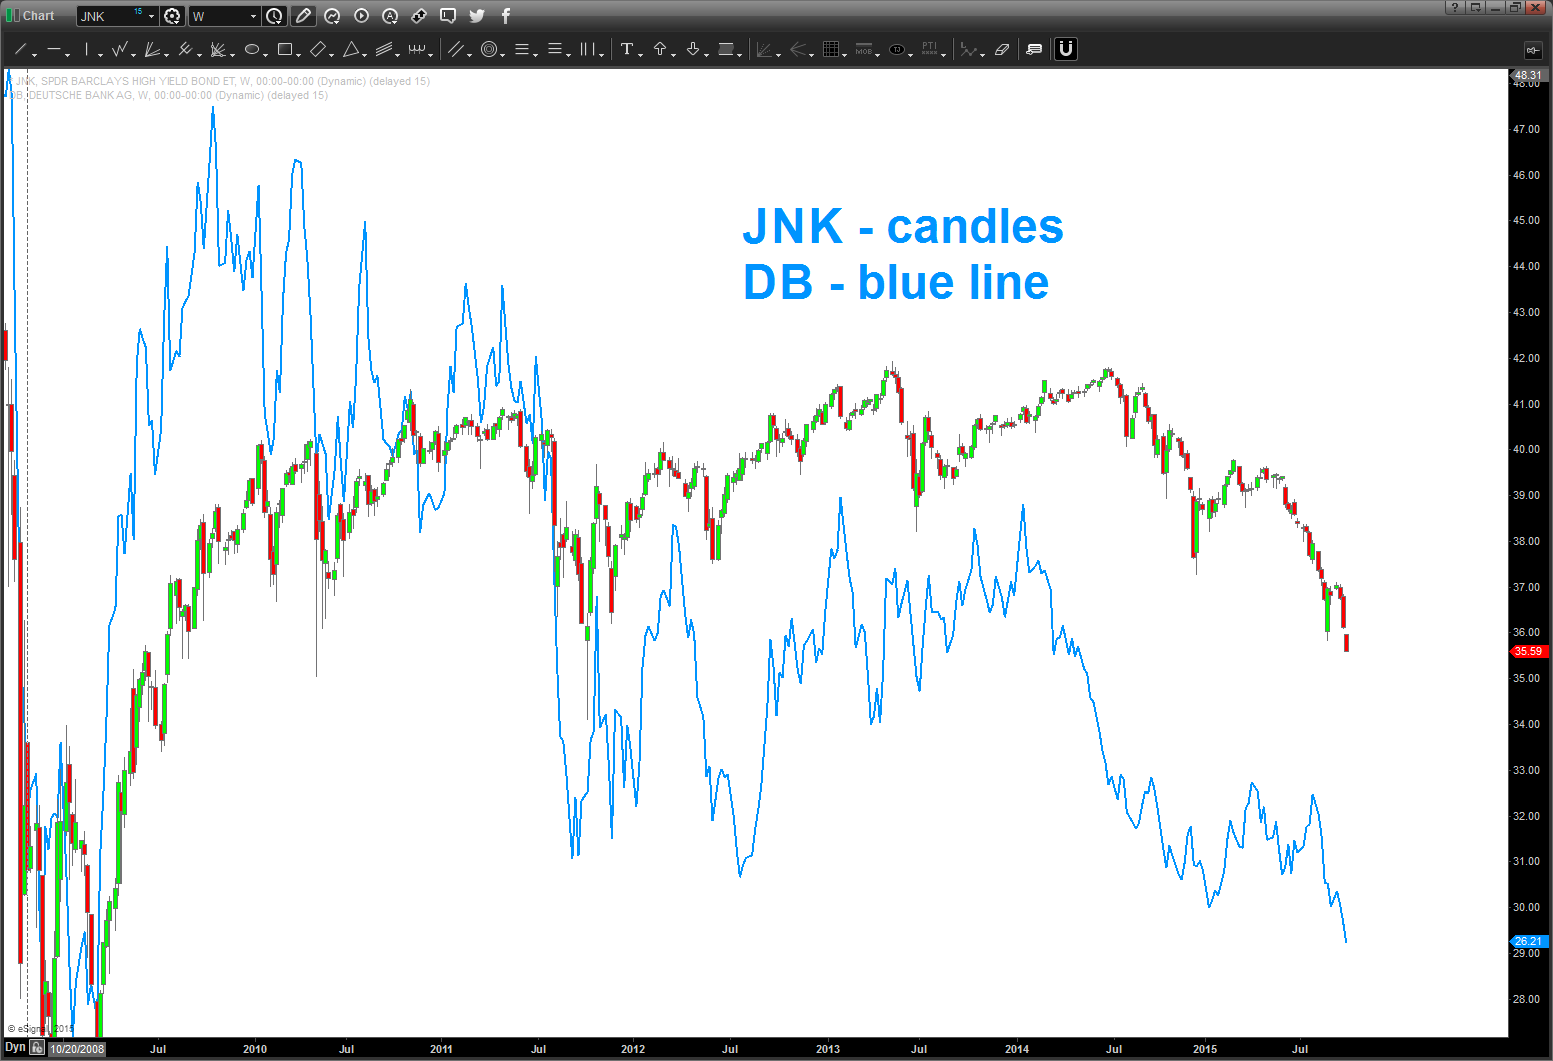
also, take a note of the $DB overlaid on top of $JNK. they shake and move in the same fashion …when the worlds largest holder of derivatives is shaking and jiving w/ $JNK it makes me perk up. now for the “if-then”
IF
$JNK PATTERN HOLDS IN AROUND 35
THEN
$DB HANGS ON AND LIVES ANOTHER DAY
ELSE
THEY BOTH GO DOWN – ALBEIT – PRETTY HARD (?)

