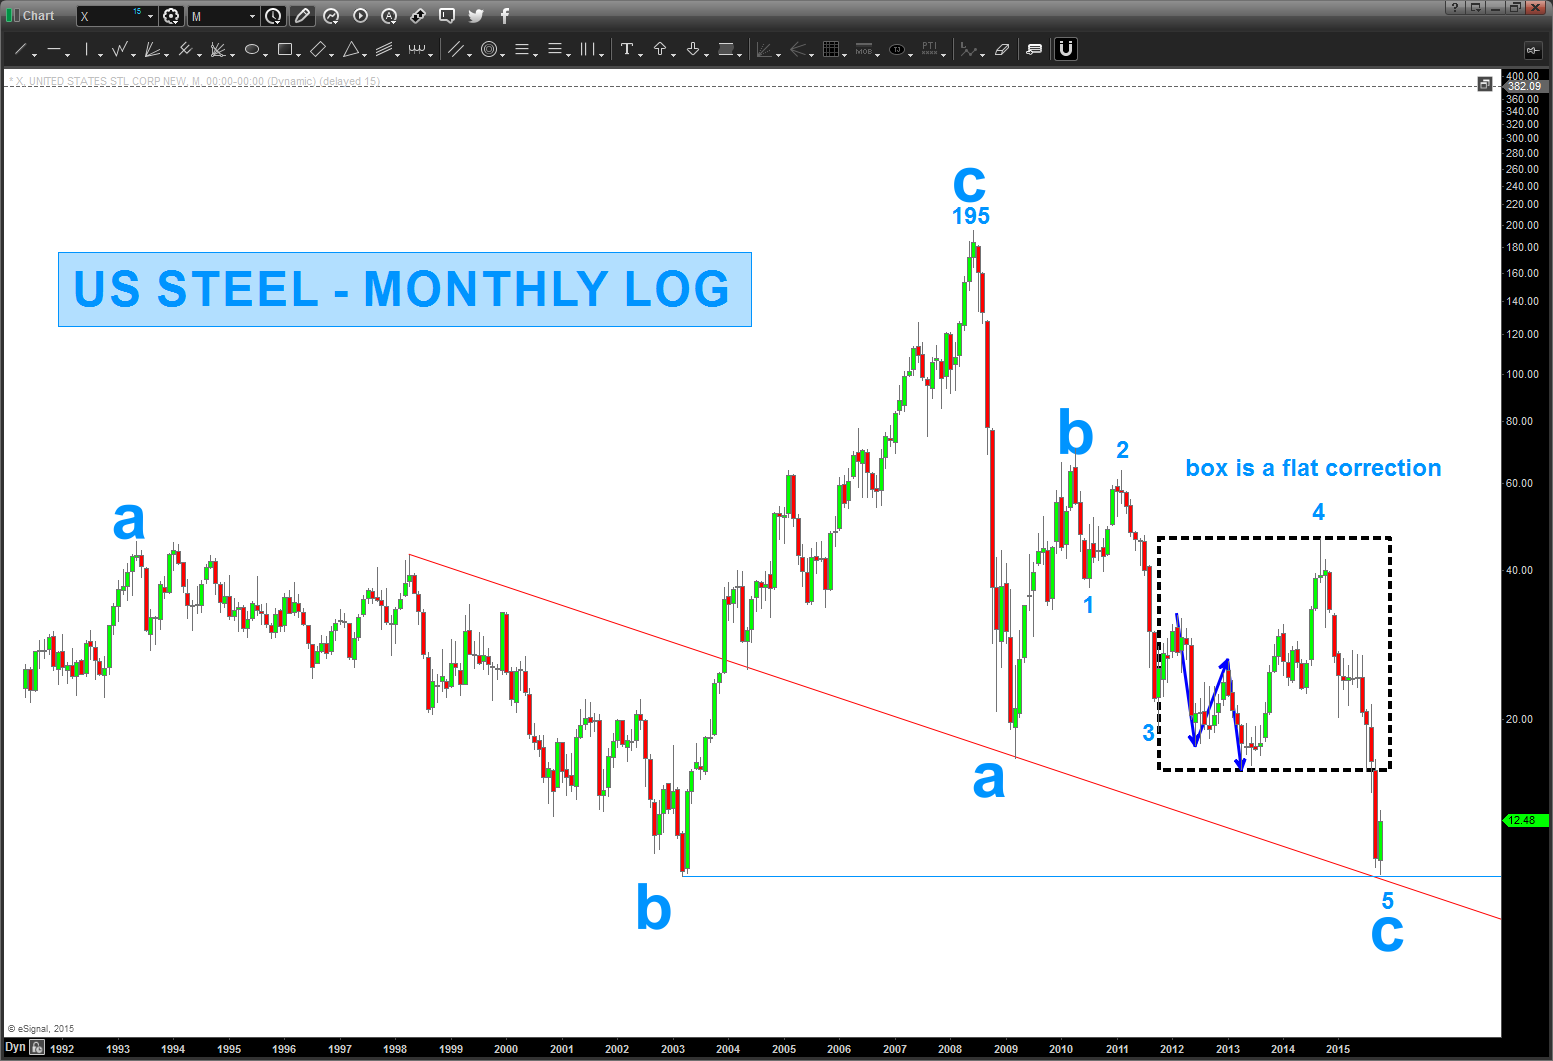
Why Not …? US STEEL
Posted on October 16, 2015 Leave a Comment
X is a dog … but, if you look at the picture painted, why not? Get out below 10 and run w/ it?
I saw the breakout earlier this year and thought we had a run going but it failed, big time into the lows shown.
but taking a step back and looking at it … that counts sure appears tempting to risk a couple to get 10? 5;1?
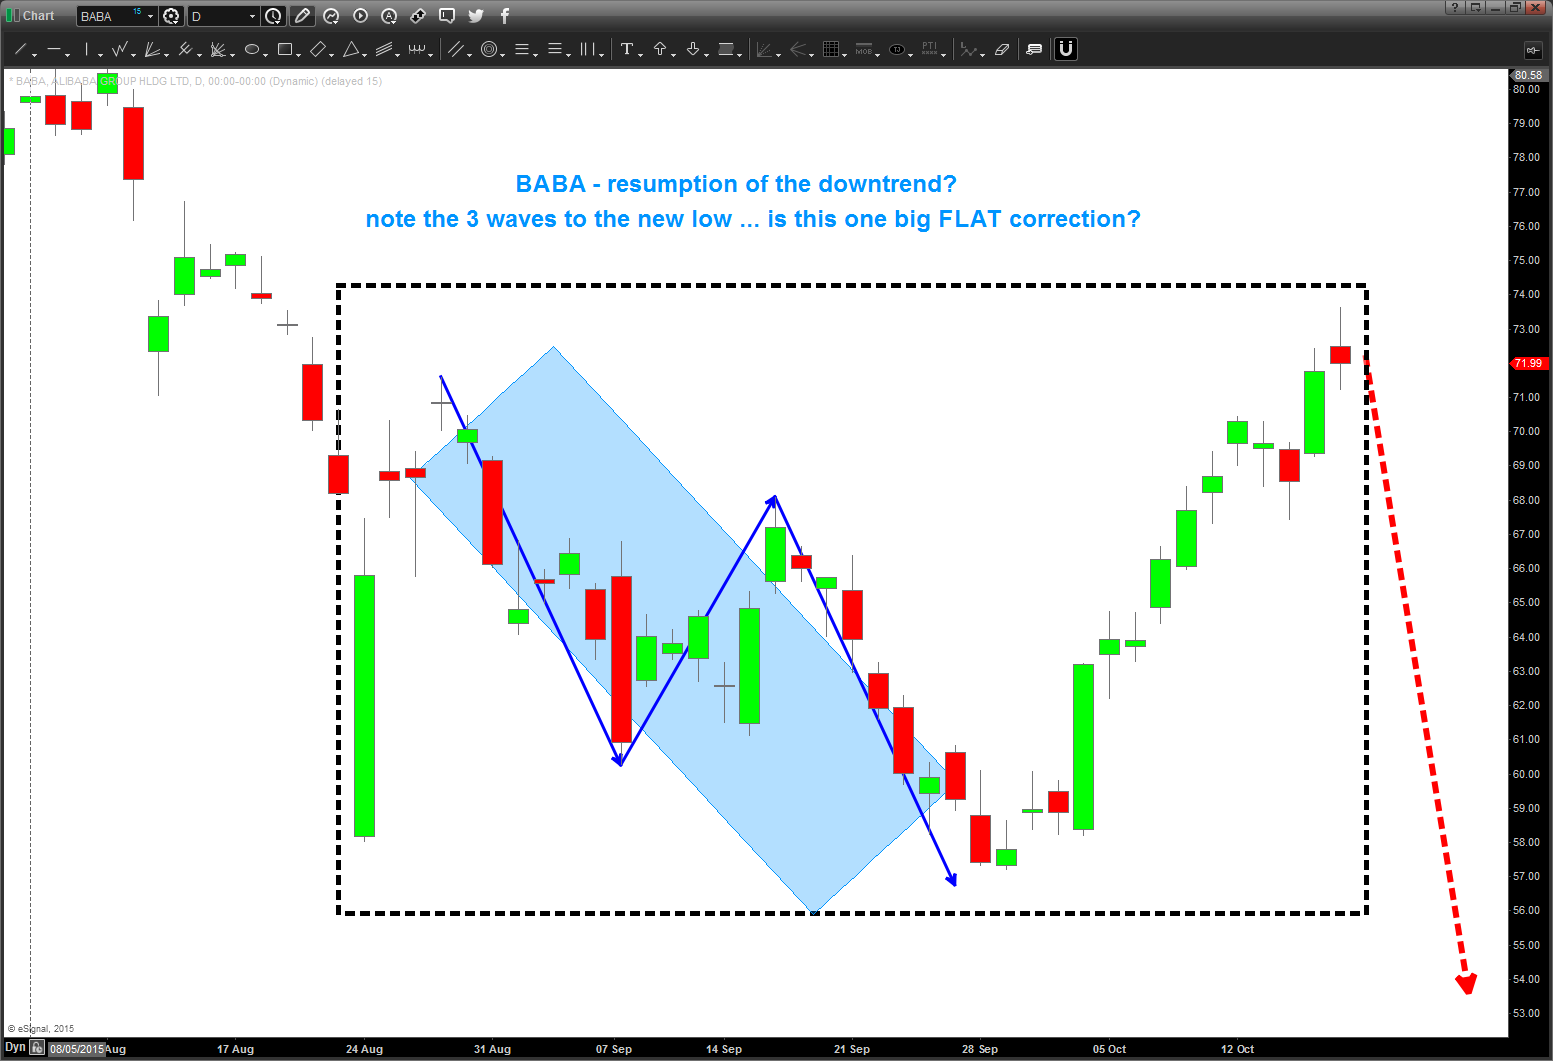
$BABA
Posted on October 16, 2015 Leave a Comment
10/16/2015
update to BABA – note the butterfly BUY that hit. we’ve rallied nicely and when we roll 3 waves into a new low, that’s a B wave and the move from 56 to 74 sure smells like a C wave. So, might want to take some off or close OR perhaps look for an SRC to short into the 52 zone.
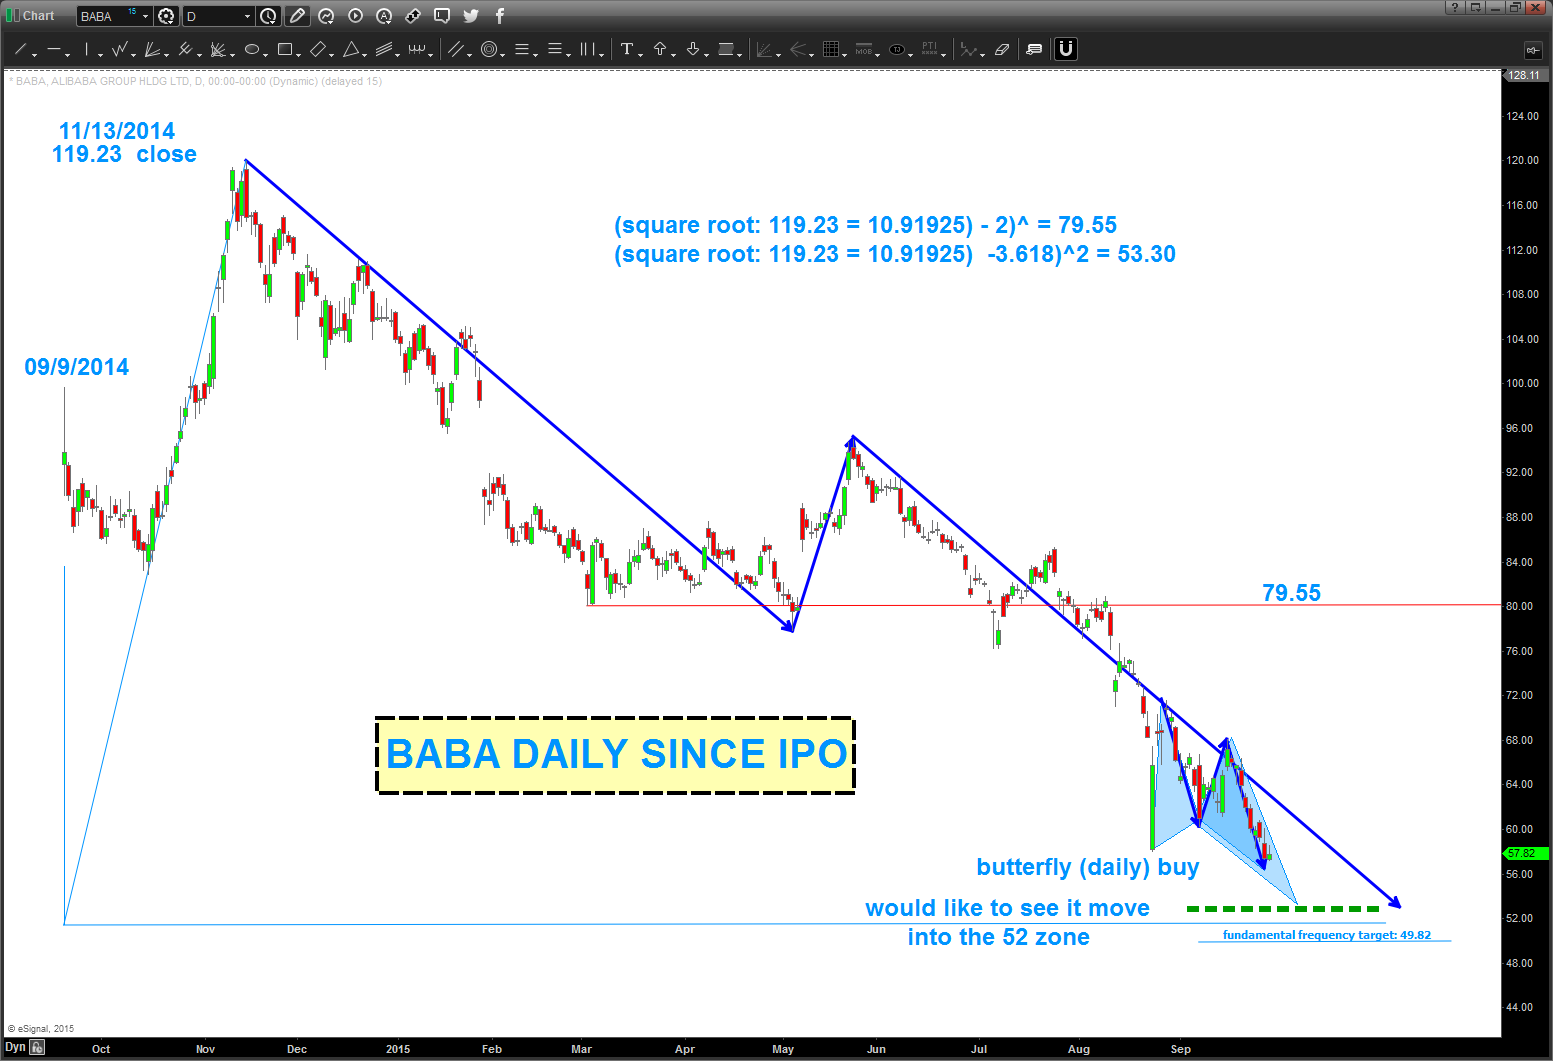
Folks, what a battering for $BABA. The entire world that bought the largest IPO in history has been underwater since basically February 2015. Perhaps, only probability here, their fortunes are about to change (pardon) the pun …
You can see below we have some nice MATH = MUSIC= VIBRATIONS coming into play 50-52.
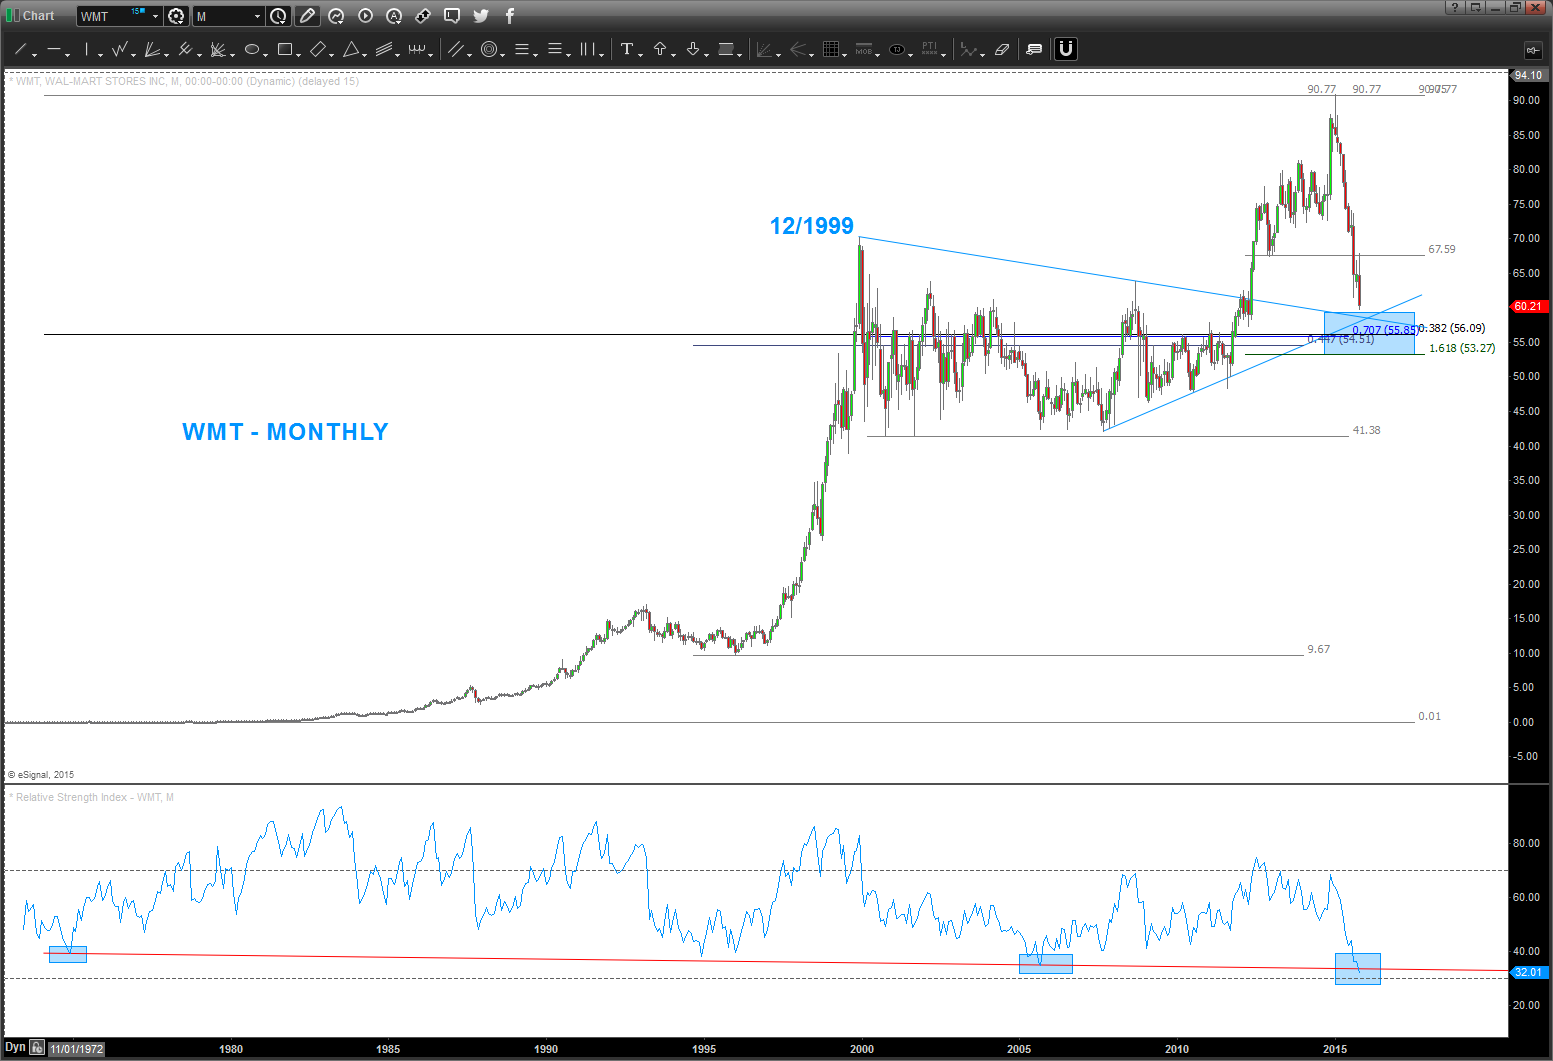
$WMT ,November 2013 looking for the top and now 55-56 for support
Posted on October 15, 2015 Leave a Comment
Here’s the picture of $WMT in 2013 – sure looked, at the time, we were finishing 5 waves and the circle area was the target area for a “potential” top.
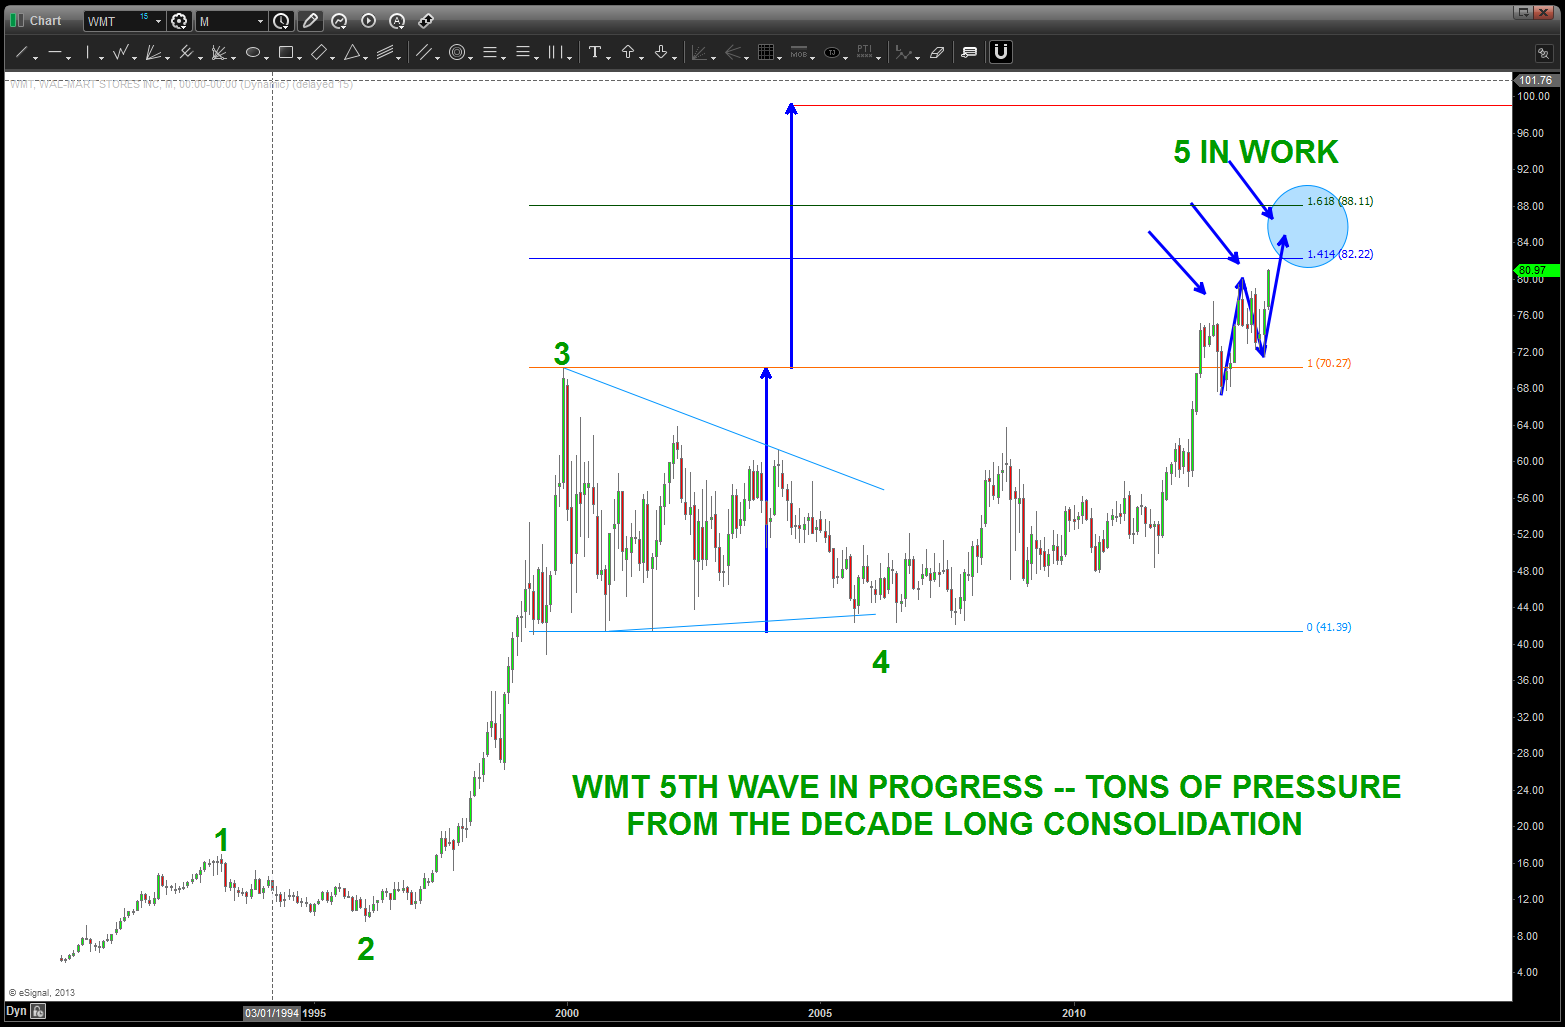
$WMT moving into the highs – Nov 2013
Target was hit and yesterday the move rally began. Hard to believe it’s roughly 2 years ago that this pattern was ID’d and it took that long for it to start to make the “news” so to speak. Anyway, now that the chaos and news is getting ahold of it, believe a look at a potential long swing trade in the mid to low 50’s is reasonable.
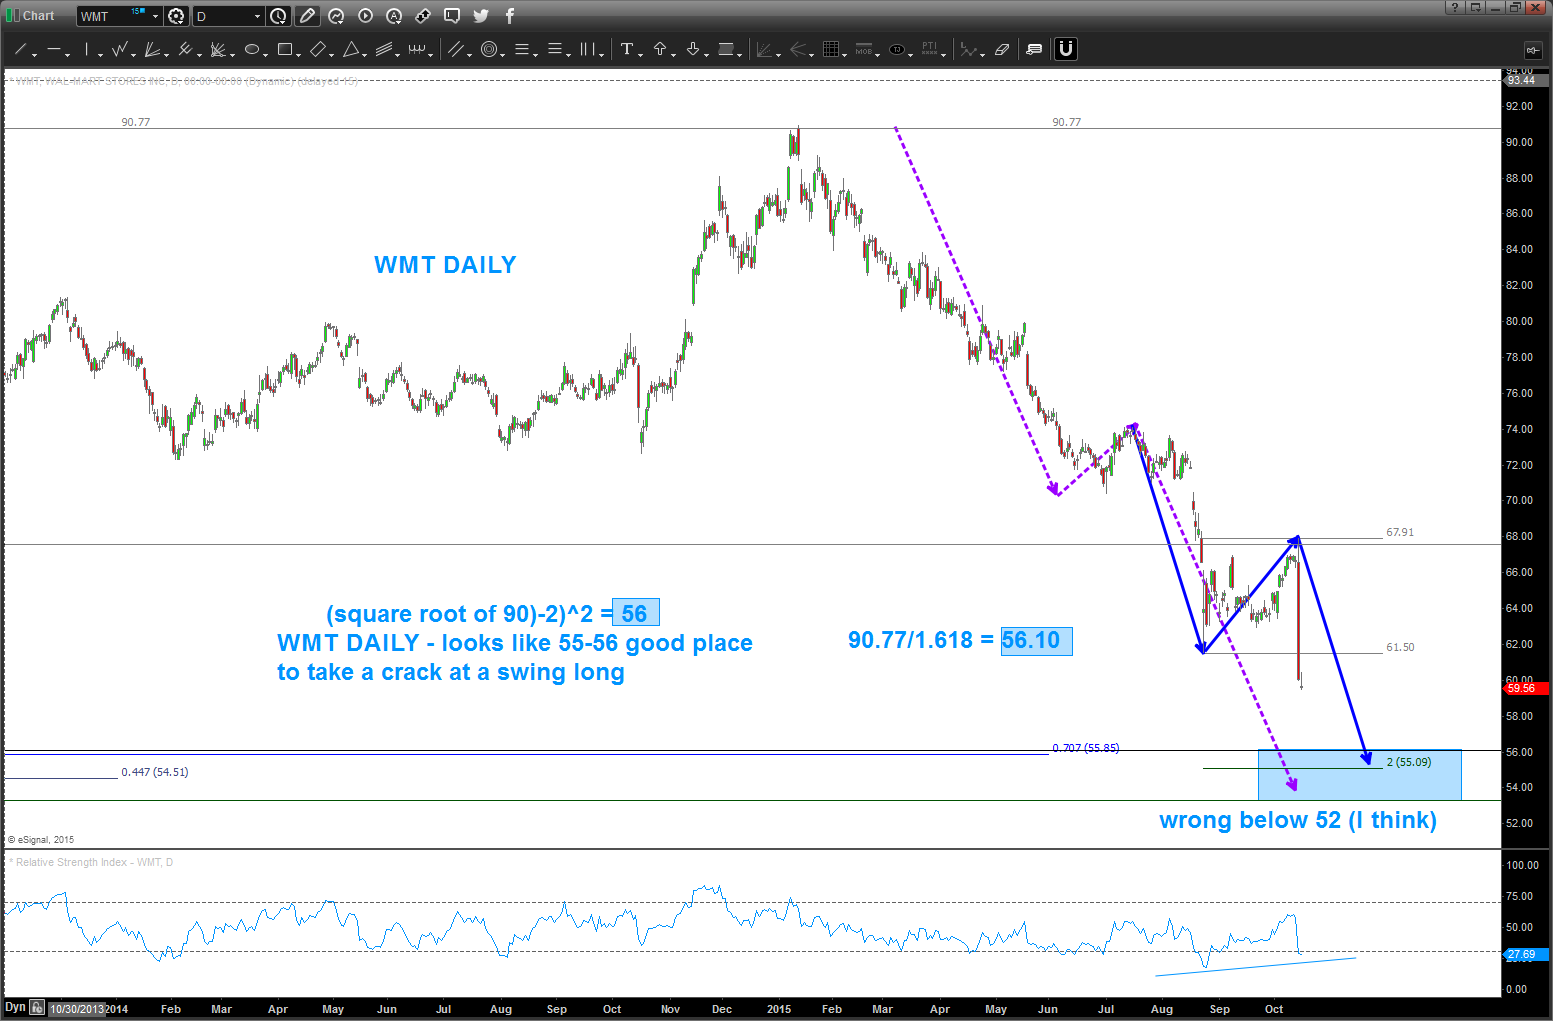
Here’s the daily chart … note the square root target of 56 lands right on the .382 retracement from the all time low. I like that … watch that 55-56 level.
Just another math thing … 90/1.618 = 56. Another reason to like the level.
Here’s the weekly 1/8th projection method …
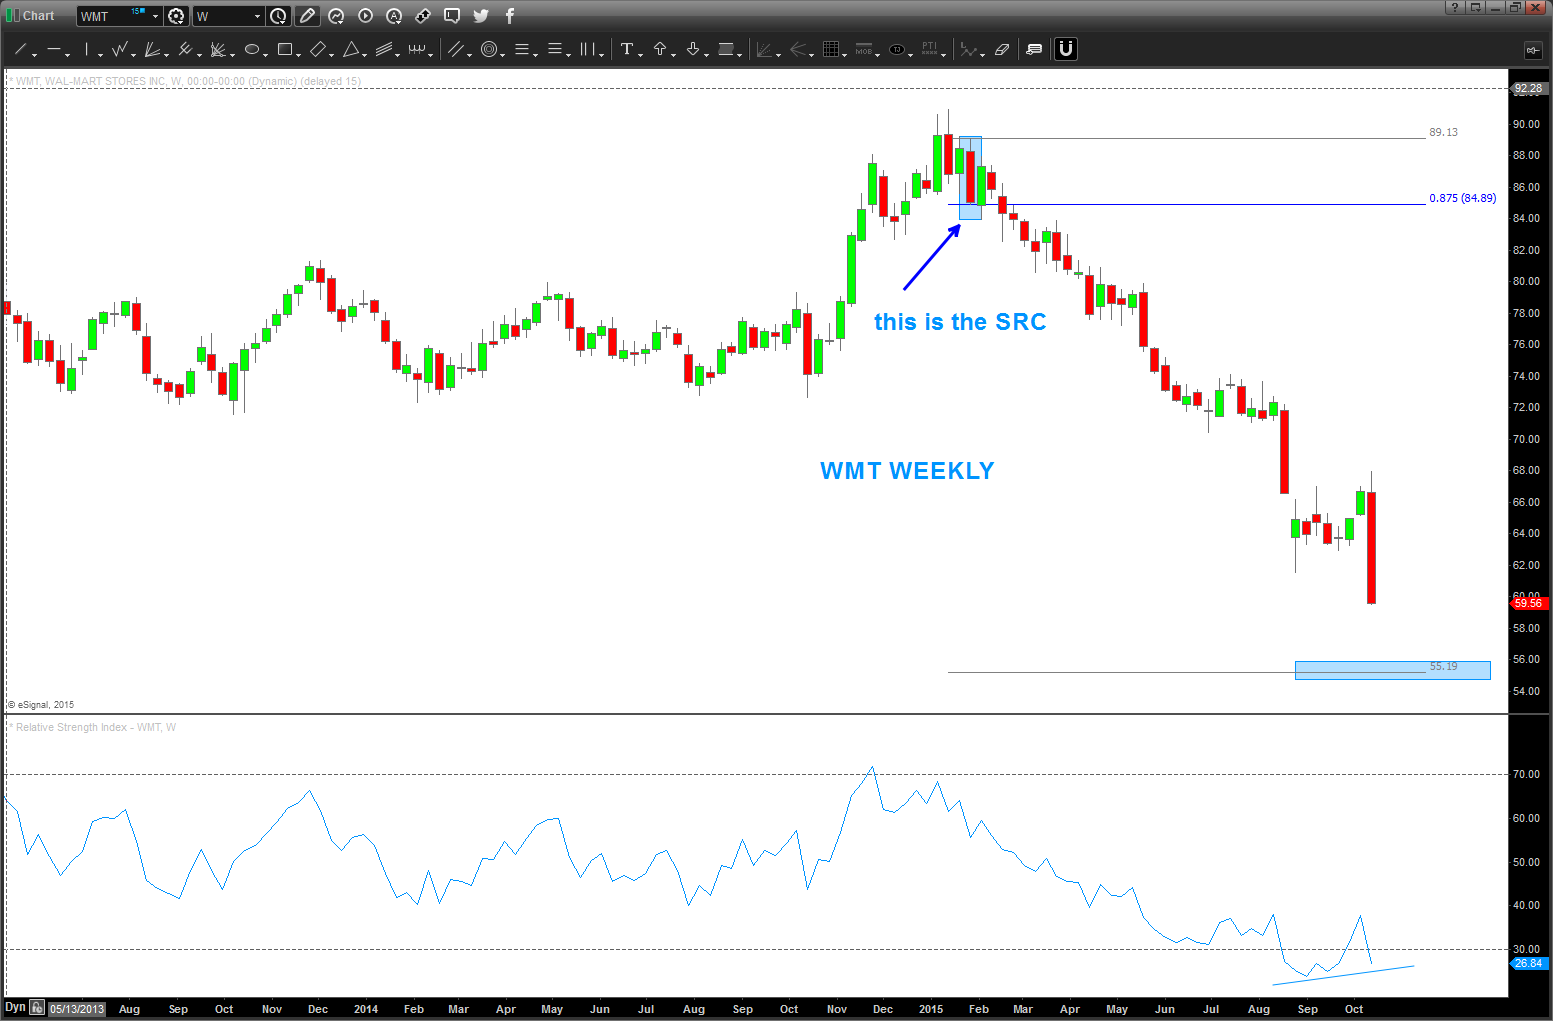
55-56 sure seems like it’s key WHICH MEANS IF IT FAILS THEN WE GOT SOMETHING REALLY WRONG AT THE CIRCLE K.
B
Soybeans
Posted on October 10, 2015 Leave a Comment
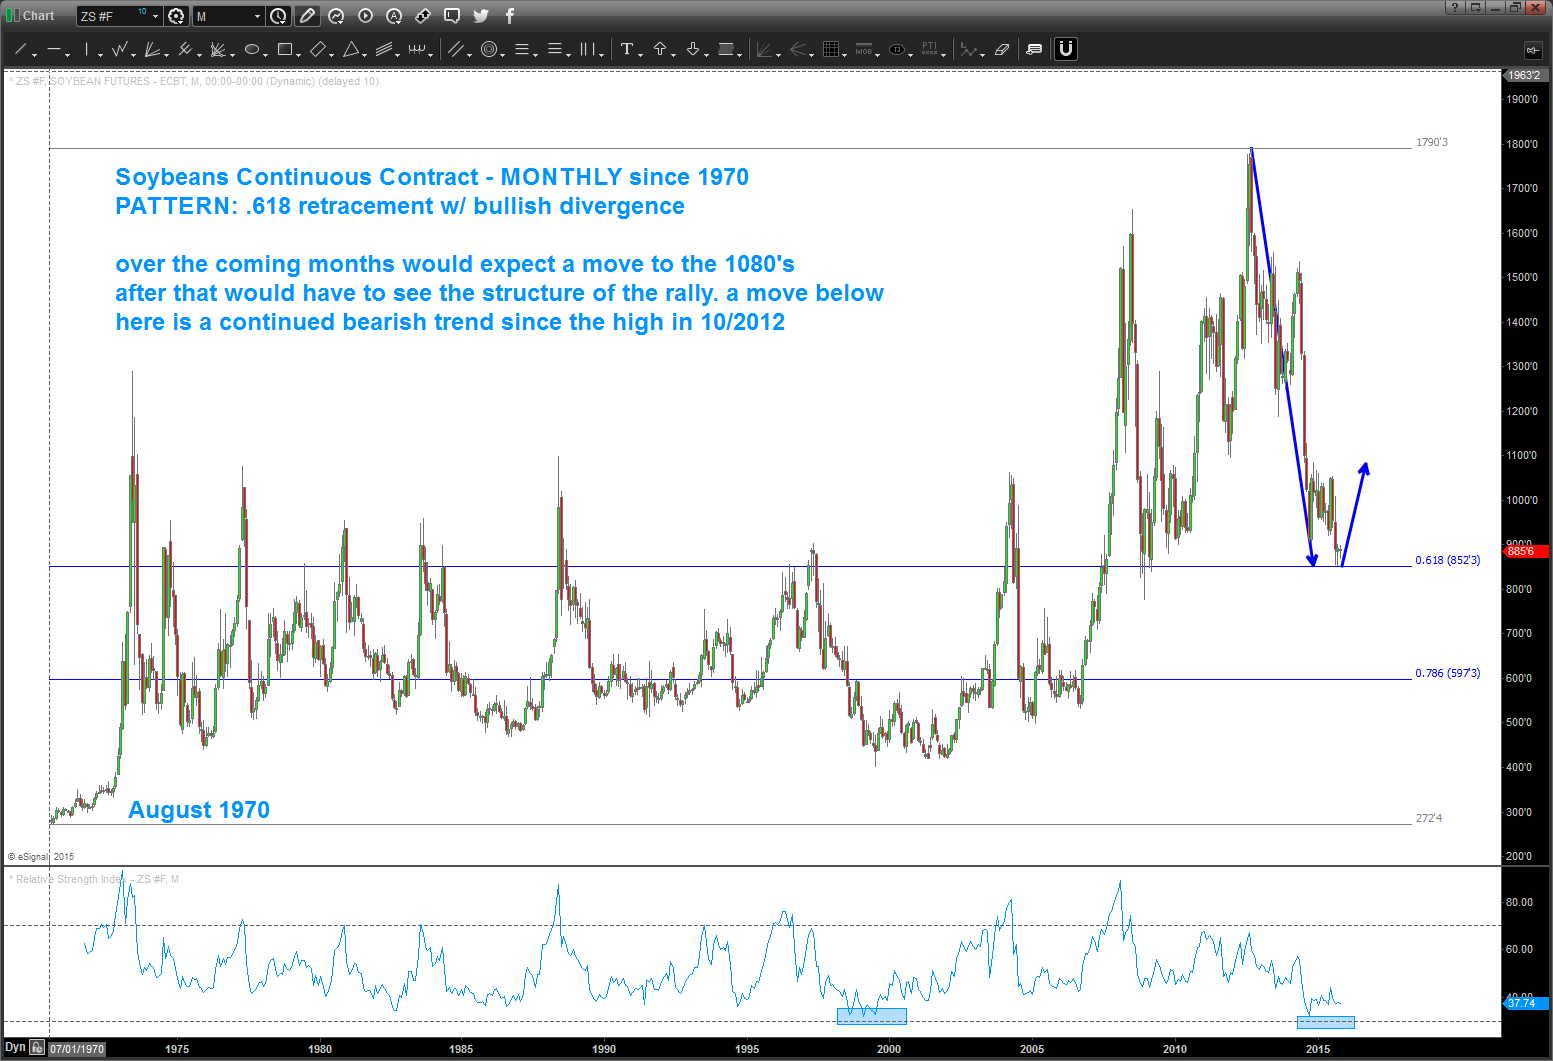 the target was lower than originally planned but it appears the node from August 1970 is holding.
I expect up from here.
Bart
SBUX and Coffee Prices …
Posted on October 10, 2015 1 Comment
one would think that IF the price of coffee is going up THEN it would have an impact on SBUX operations?
first chart – SBUX – candles and Coffee Futures – blue line
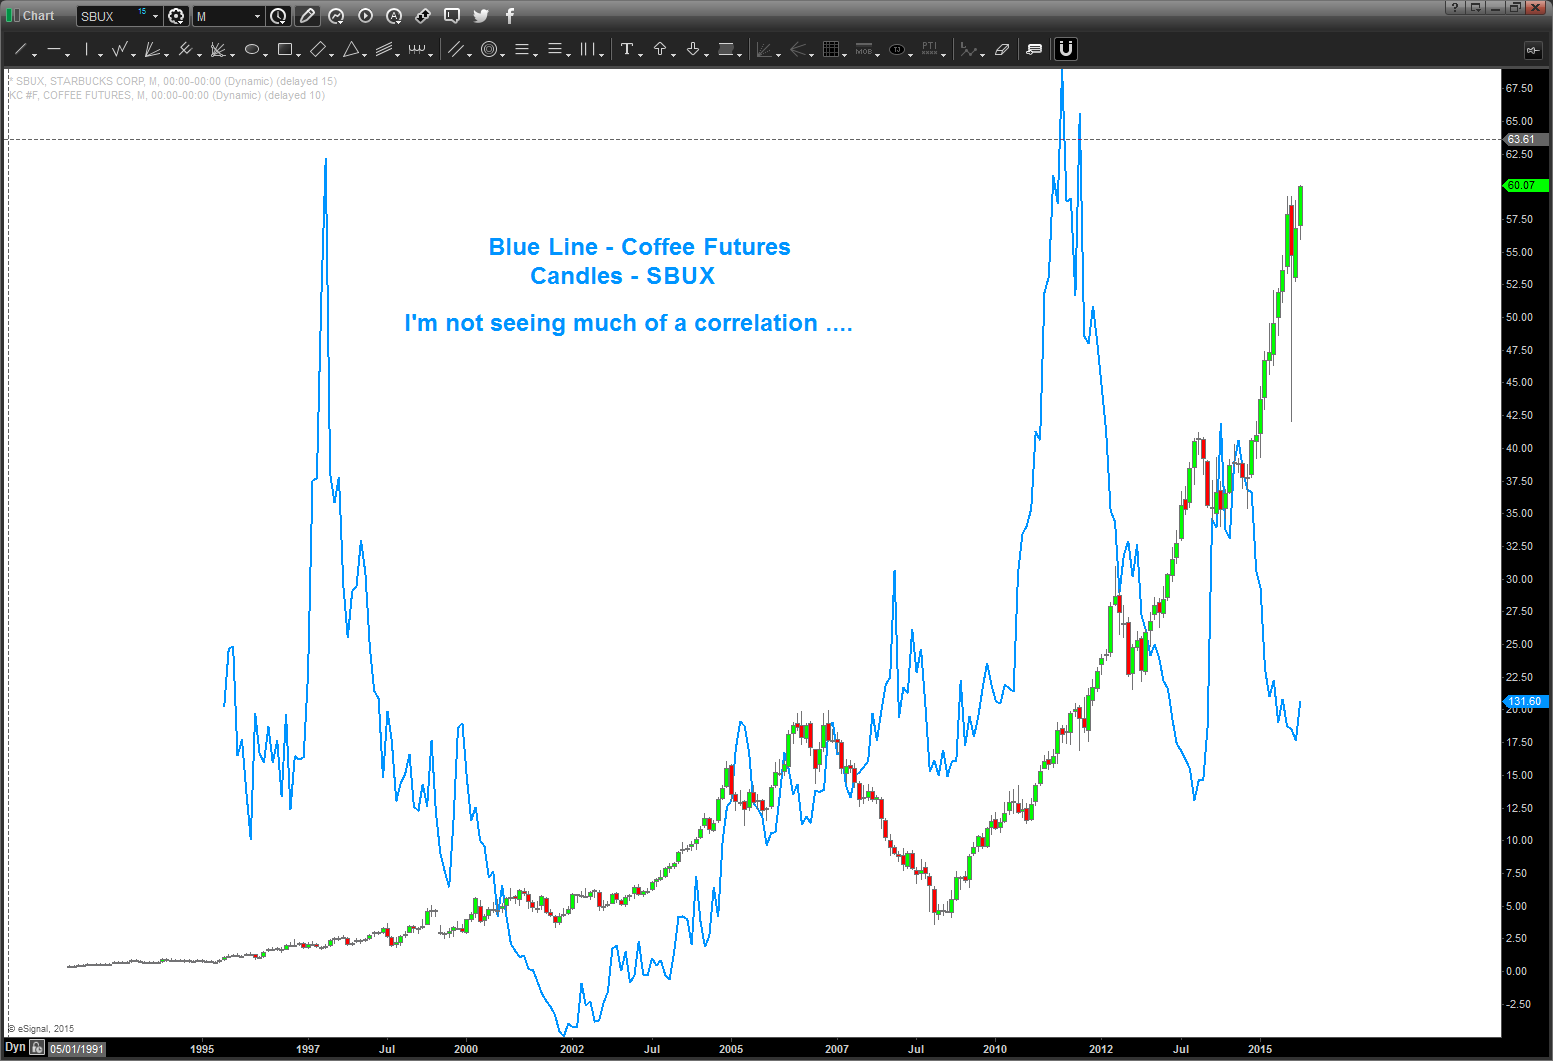
I don’t see much of a correlation …..
How about, SBUX RELATIVE STRENGTH COMPARED TO COFFEE FUTURES? THE RATIO OF SBUX/COFFEE?
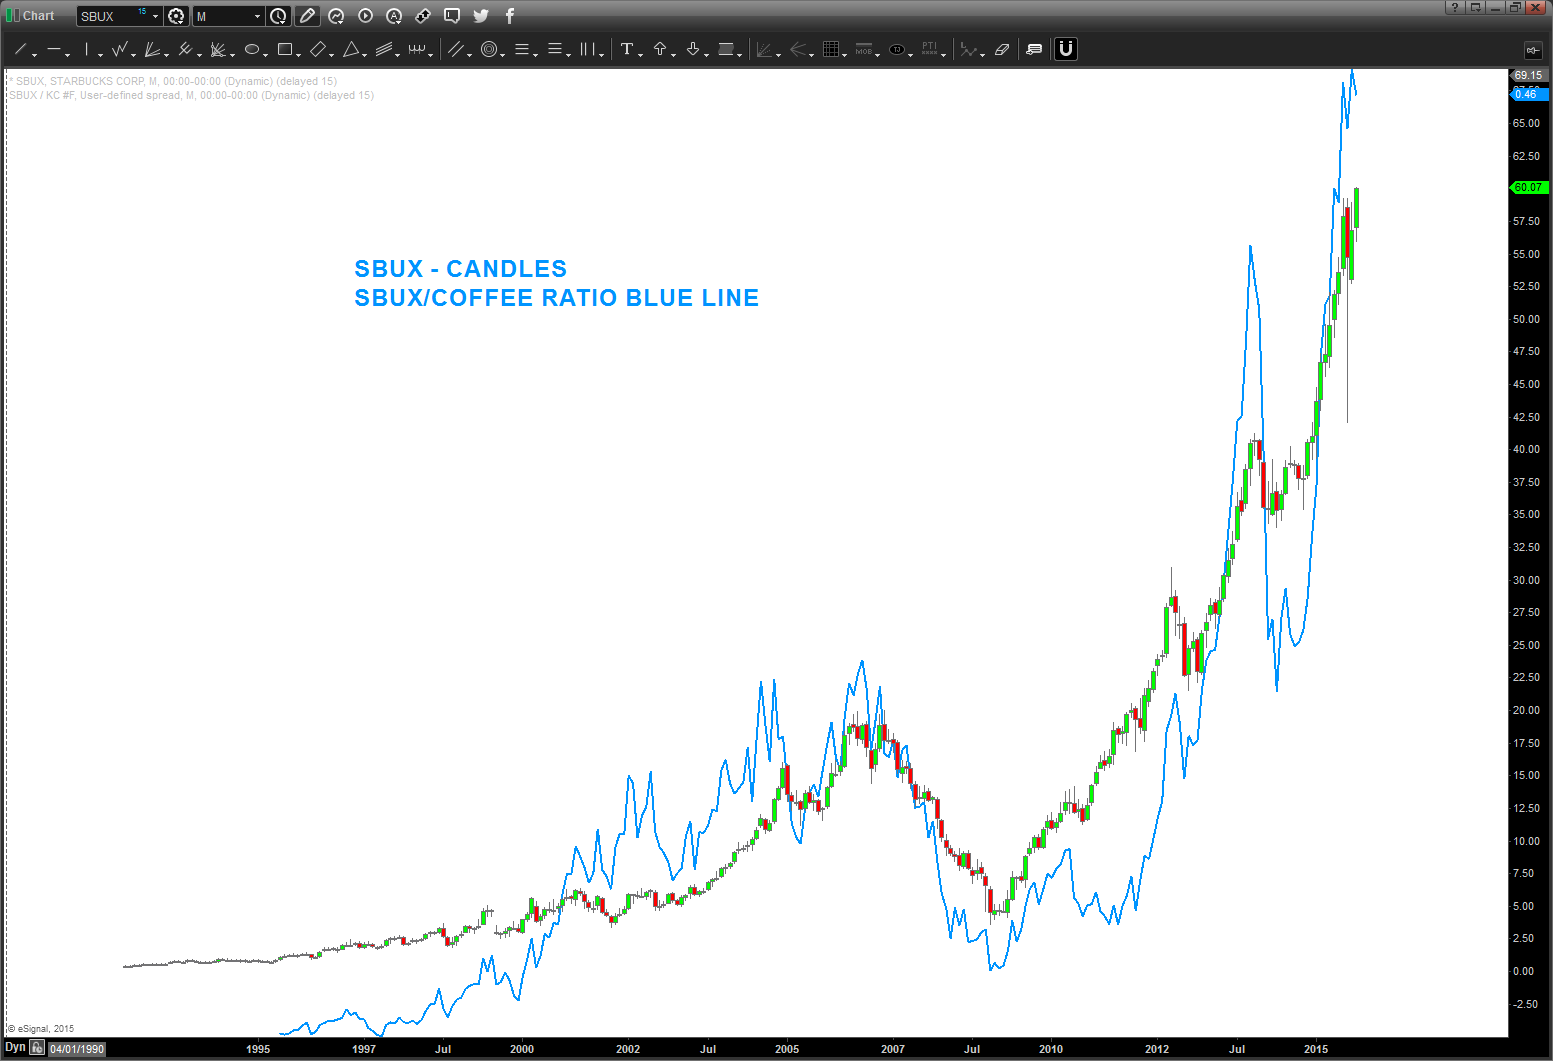
now, that is better … it’s not the price of coffee alone but the relative strength of SBUX versus the price of coffee – using ratio analysis we can see that this is what’s causes the movements in SBUX. SBUX/COFFEE is a good indicator to manage risk …
Is the ratio hitting some targets? Ummmm, yes.
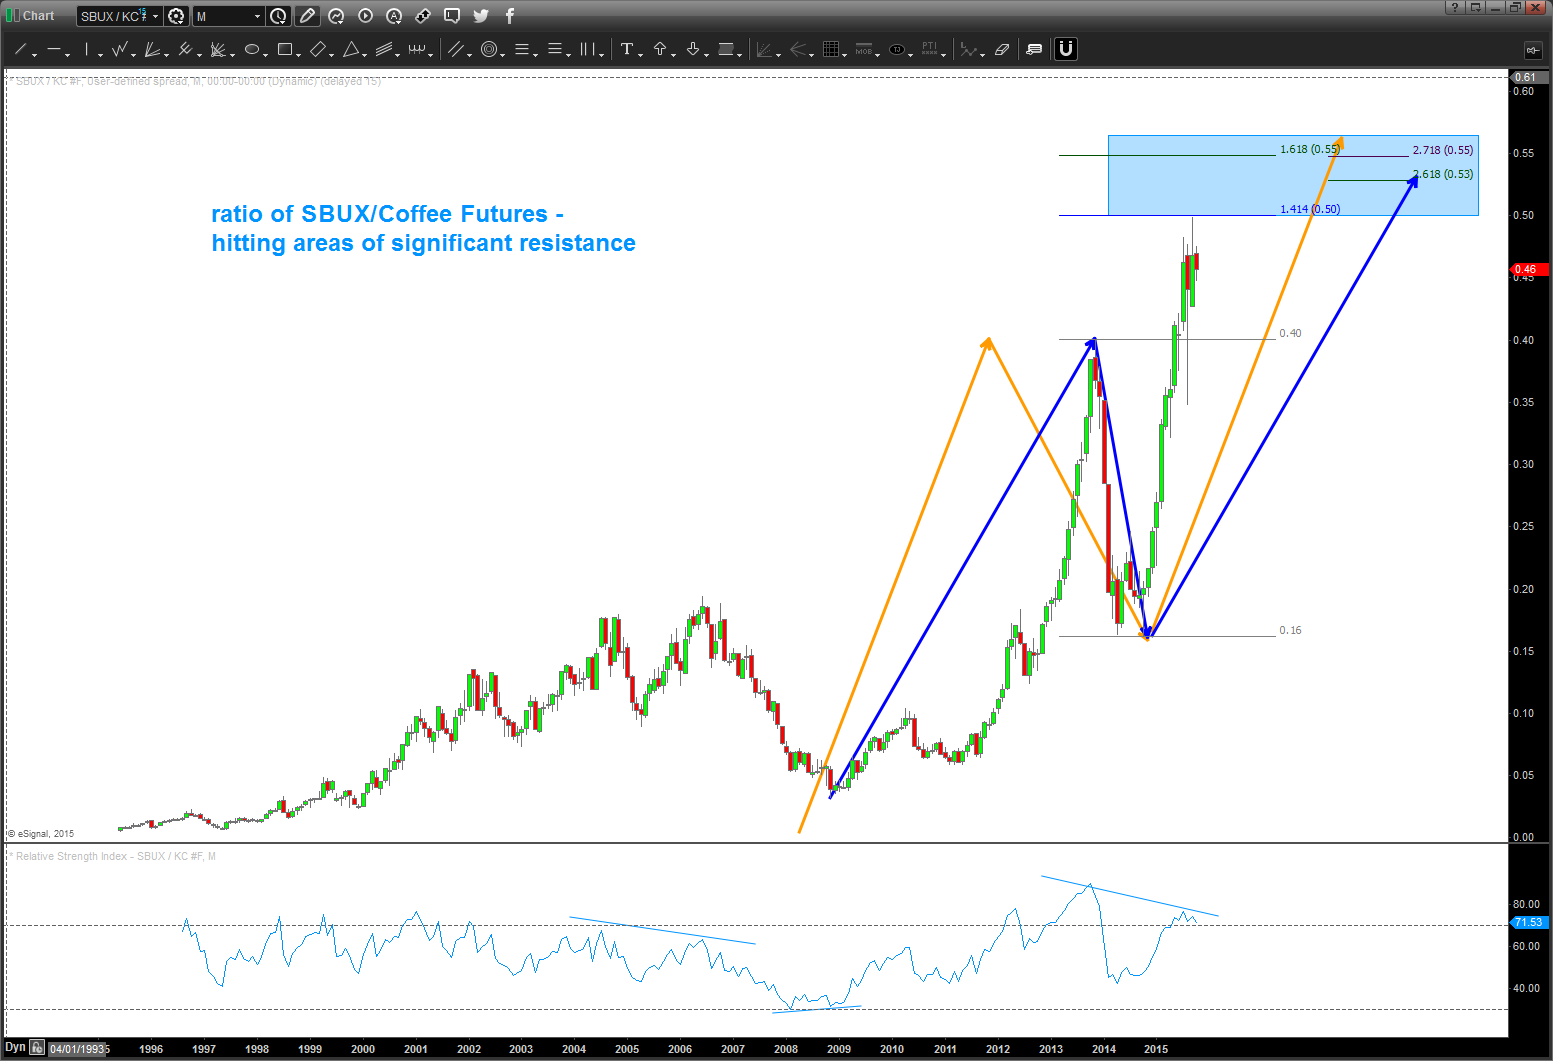
so, SBUX is taking off parabolically …this never ends well and we have some very strong targets coming in on the RATIO. Certainly keep an eye on this ratio as it’s pretty important to future directional moves in SBUX.
Bart
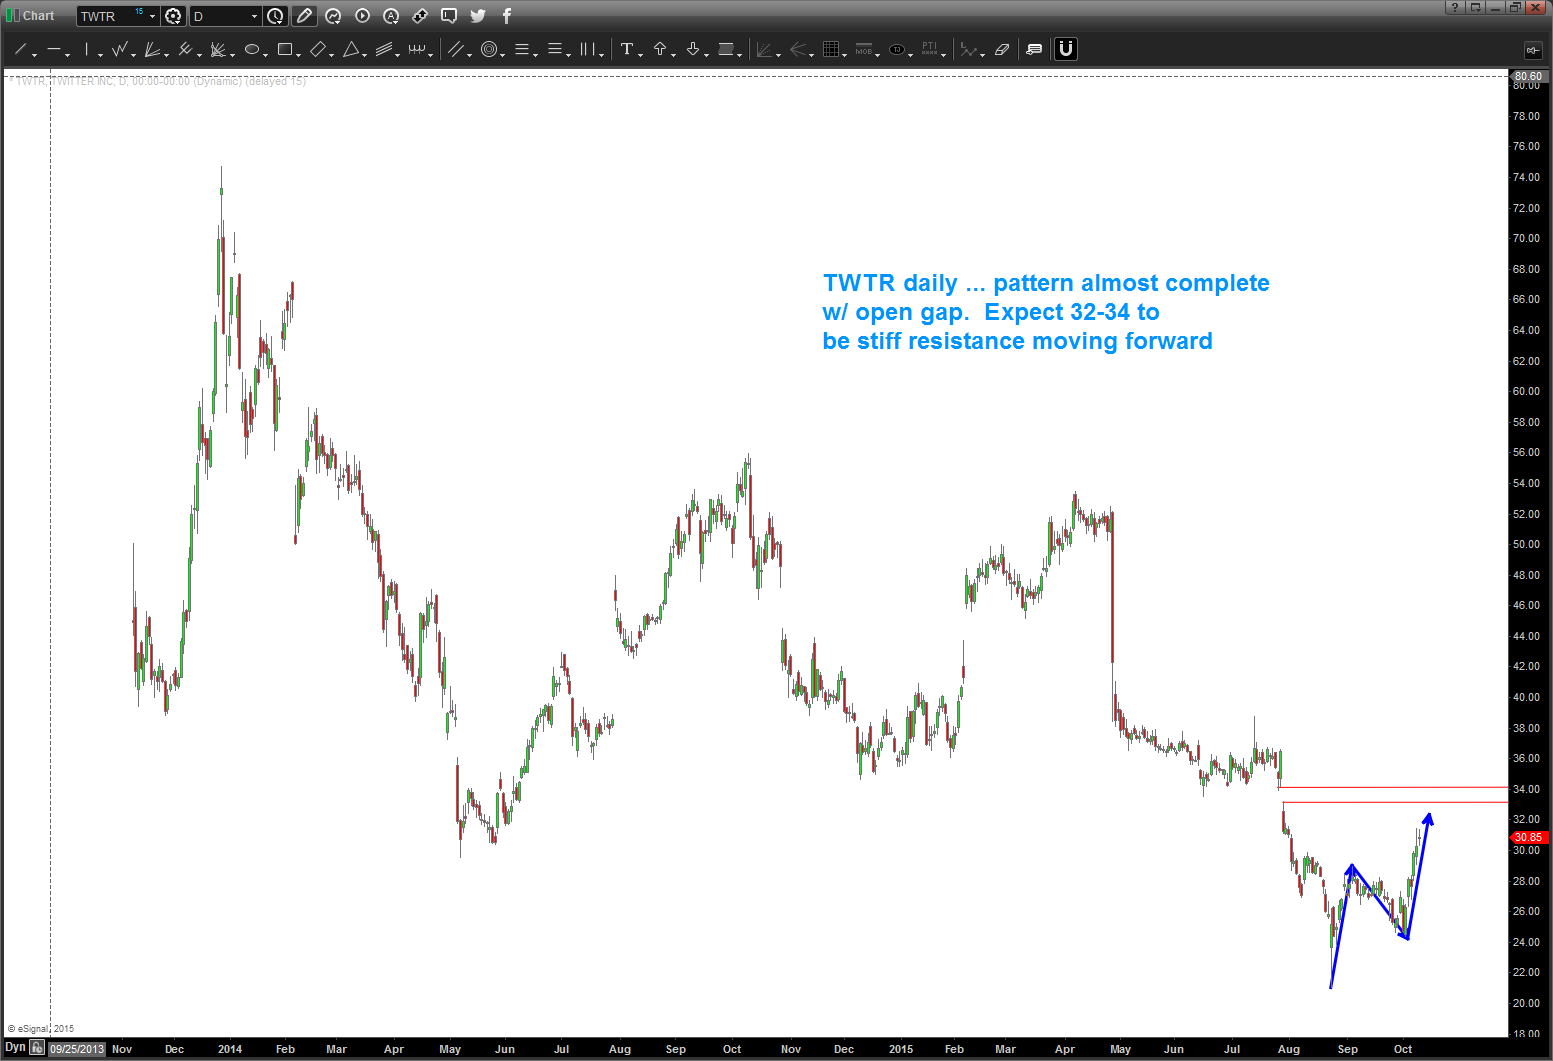
$TWTR update as of 10/10/2015
Posted on October 10, 2015 1 Comment
$TWTR to find significant resistance, if not continue downtrend in the 32-34 area.
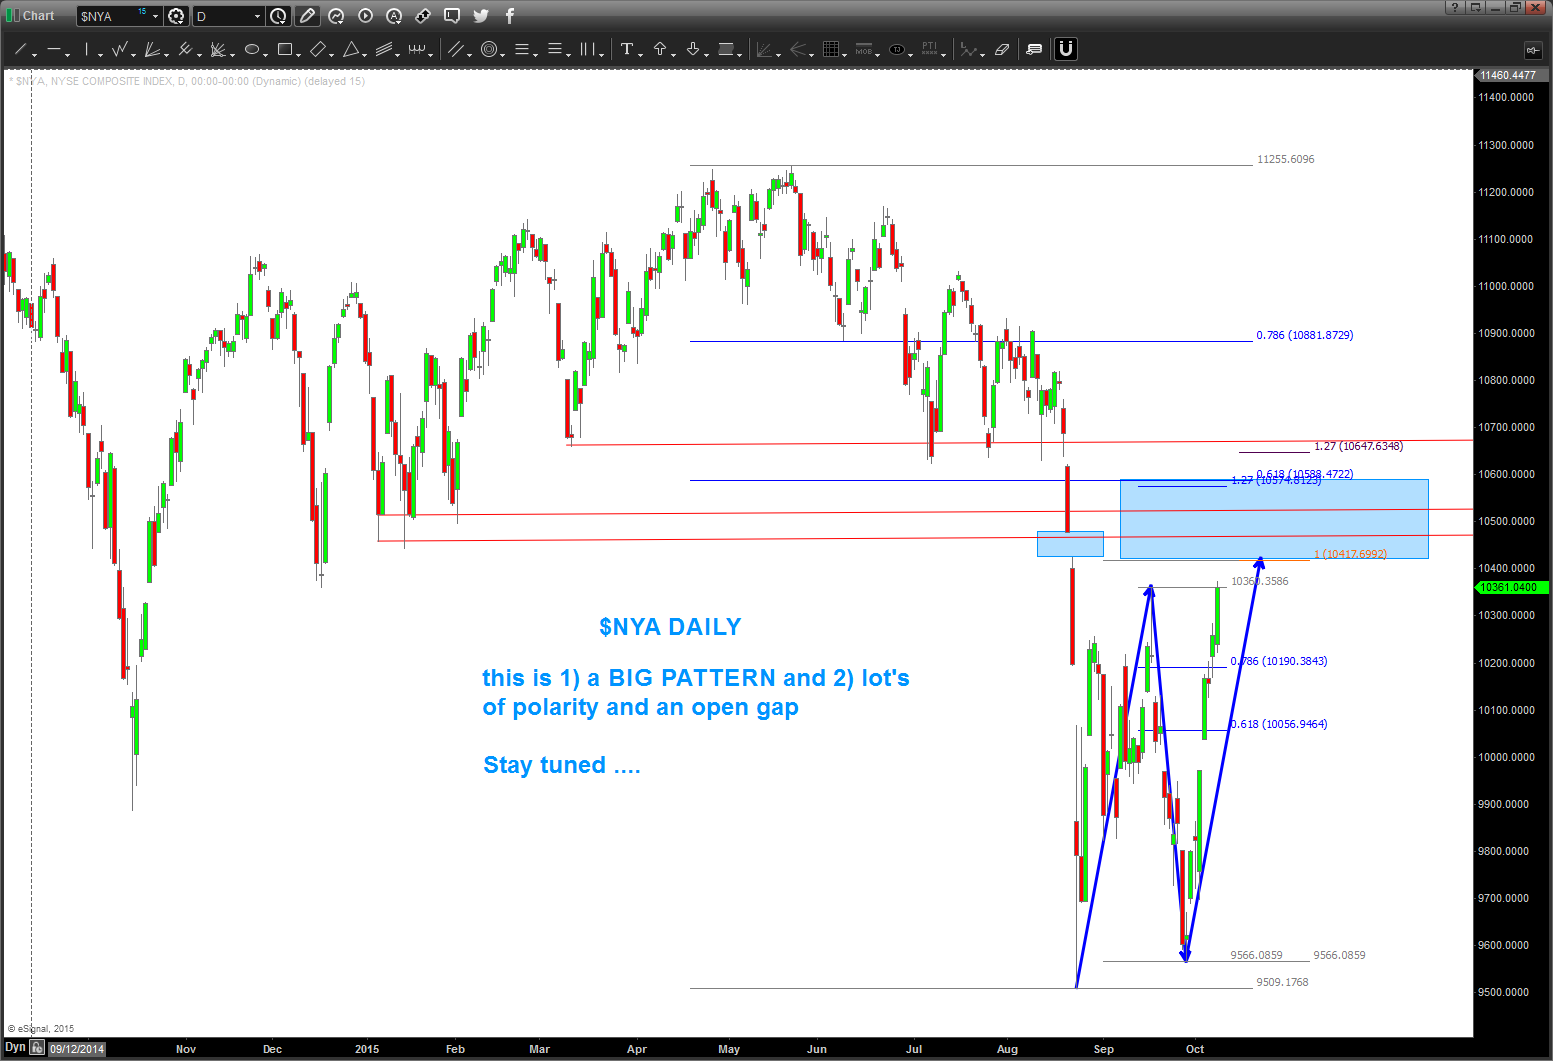
Junk Bonds …boom, right on the target area. K E Y !!
Posted on October 4, 2015 Leave a Comment
Junk Bonds … just think of em’ this way…risk investments and a yield play. in a volatile world, they aren’t so smart so institutions try to get out of them. keep it simple … note coming into the 2009 low they were crashing .. a nice bounce and then meandered around into June 2014 then started to crack. Most recent price action has seen some heavy selling pressure w/ the first noticeable gap down occurring last week AND (this is important) the lowest weekly close since August 2009.
Note the dashed black boxes .. those were all attempts at trying to get below but were defeated. What’s the positive spin? Well, as you can see from the first chart below this level (35) was ID as a pattern and it hit and held for now. Why for now? Well a gap down and some “selling candles” make it probable that we could lose this level to the downside. HOWEVER, if history is our guide, their has been a snap back rally since 2009 each time this level was defeated .. so, watch for strength! a small, dead count bounce isn’t good and will tell us if something is a foot at the circle K so to speak ….
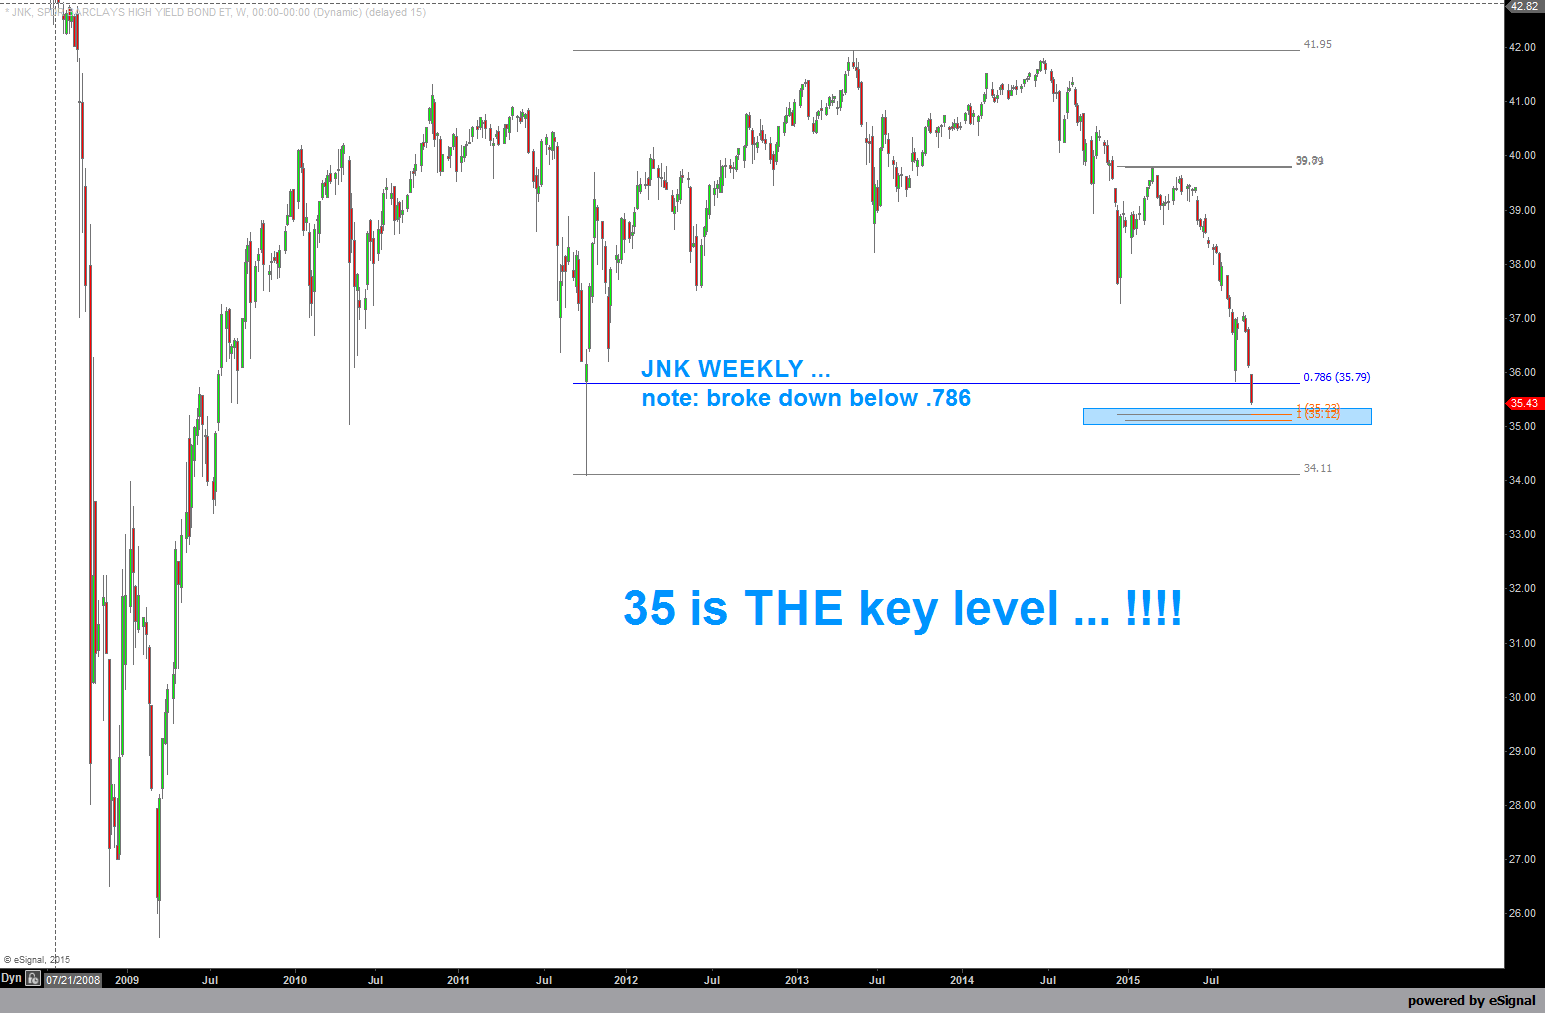
Here is JNK as of Sunday night … over the coming days, expecially Tuesday, monitor this pattern closely for a directional bias and a “risk on” vs “risk off” appetite w/ regard to volatility.
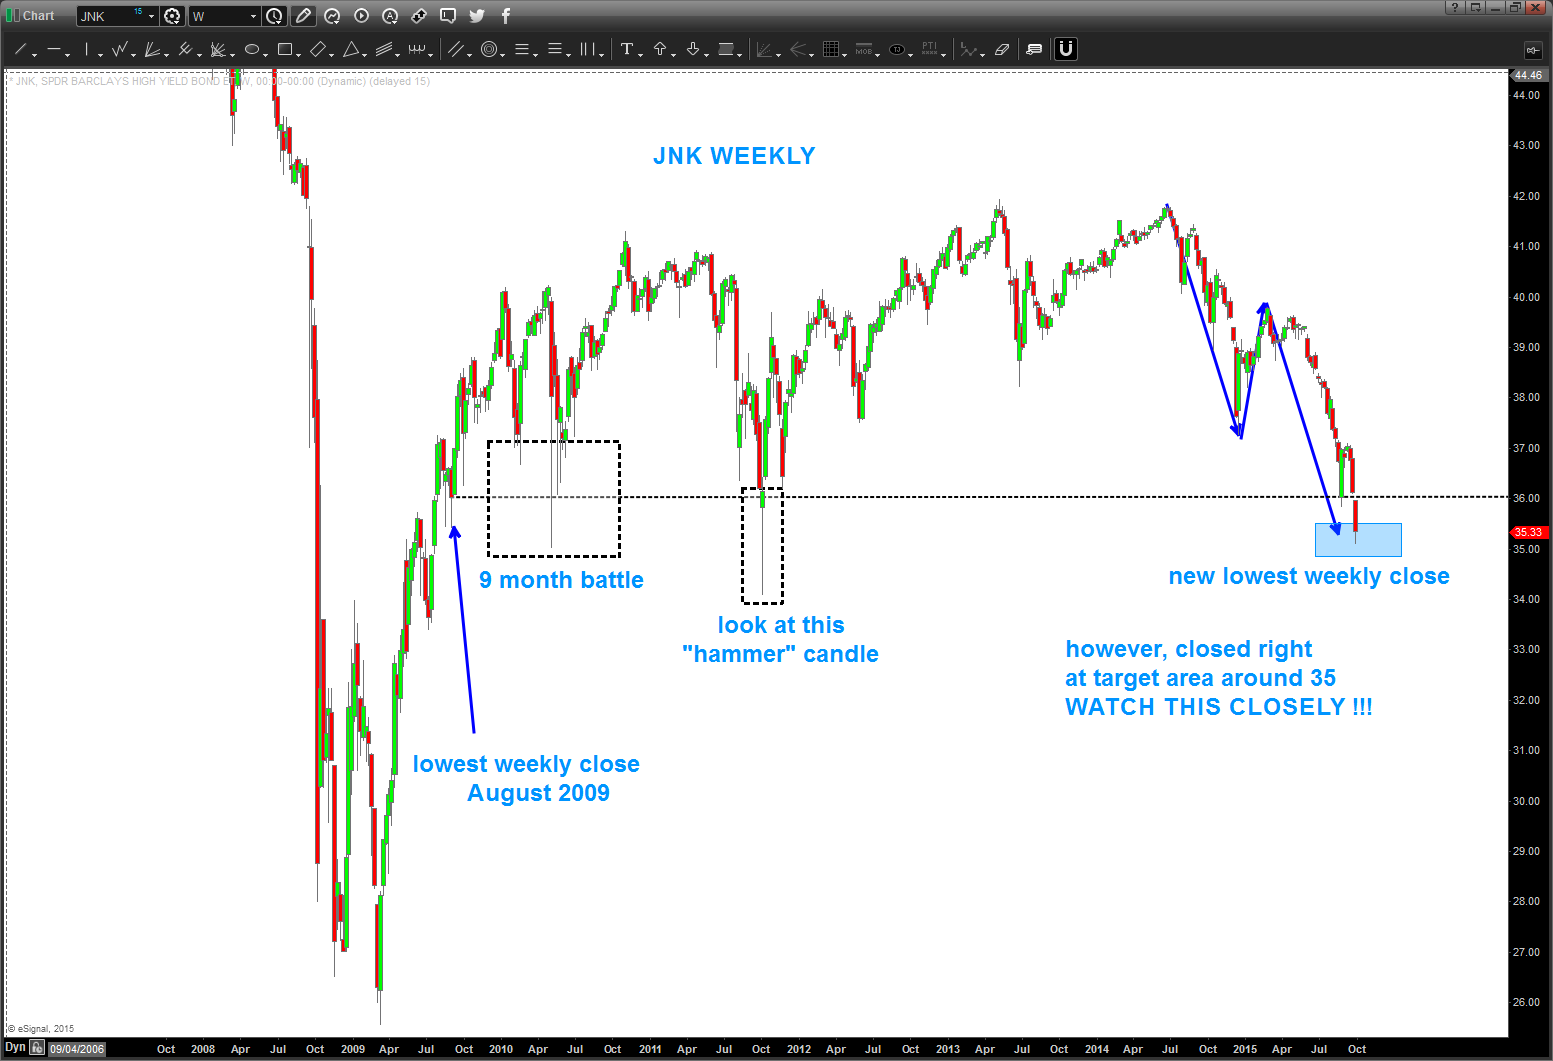
Hope your having a good end to your weekend.
Bart
musical note E, 1896, 1987, 2007 and now
Posted on October 4, 2015 2 Comments
What a great day yesterday … was working thru what my wife calls the “man flu,” it was pouring rain and nothing but great college football and logs. I know, that was geeky but during half-time of the Navy vs AF game I just sat down in front of my computer and said “self, let’s see if music is really involved in the market.” I think it is …
- I have never done this before, what you see is the result of starting from the all time low of 28.48 on 08/08/1896 some 43,250 calendar days ago as of this posting and simply “did the math.”
- Background:
- the frequency of a string is:
- inversely proportional to the square root of its length and
- directly proportional to square root of it’s tension
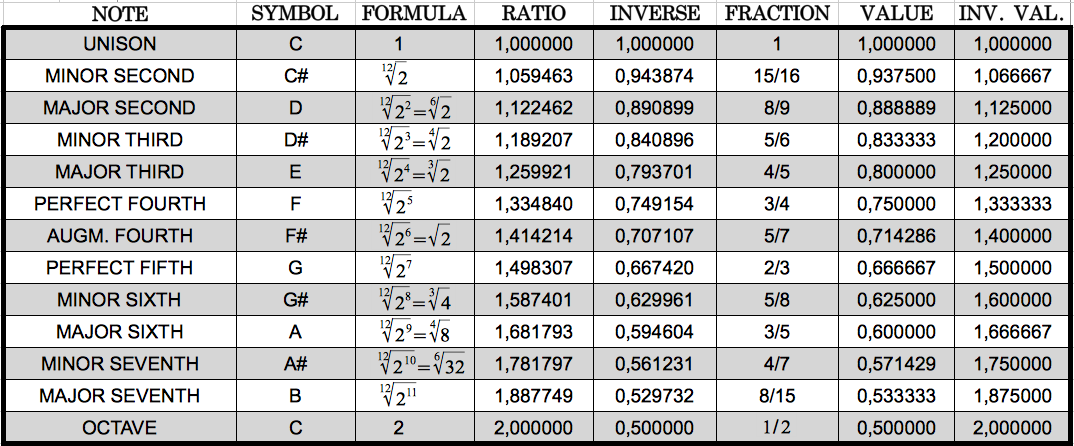
- here is a chart of the notes and the ratio’s and their inverses
- the frequency of a string is:
- Here is the math:
- 28.48 LN = 3.3492
- 3.34492 + ratio of equal octave scale = XXX
- anti-log of XXX = YYY
- plot YYY on long term monthly of DJIA
- For example:
- NOTE E: ratio 1.259921 and the inverse 1/1.259921 = .7937005
- 3.3492+.7937005 = 4.1429005
- 4.1386205 anti-log = 13896
- interesting to note how close that was to the top in 2007
- some 20 years prior the same “E” was wreaking havoc – here’s the math
- 3.3492+.07937005 (note the number stays the same – JUST SHIFT THE DECIMAL POINT) = 3.42857005
- anti-log of 3.42857005 =2683
is it any coincidence that the musical note E was found in 1987 and 2007 from the all time low in 1896?
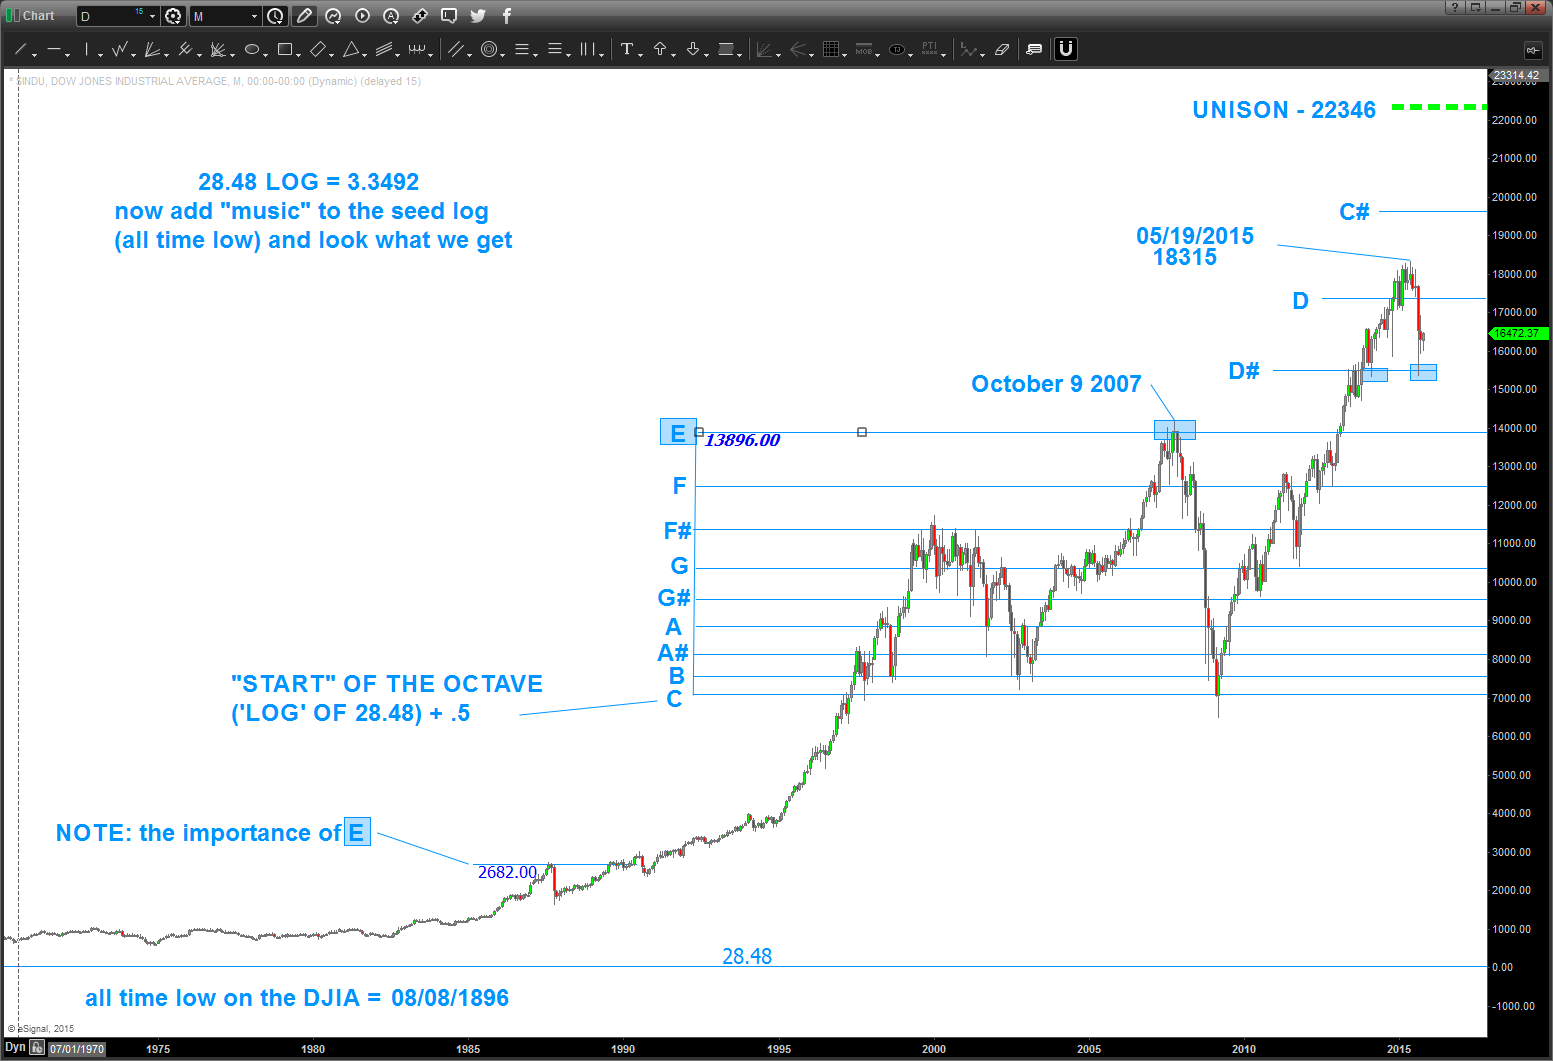
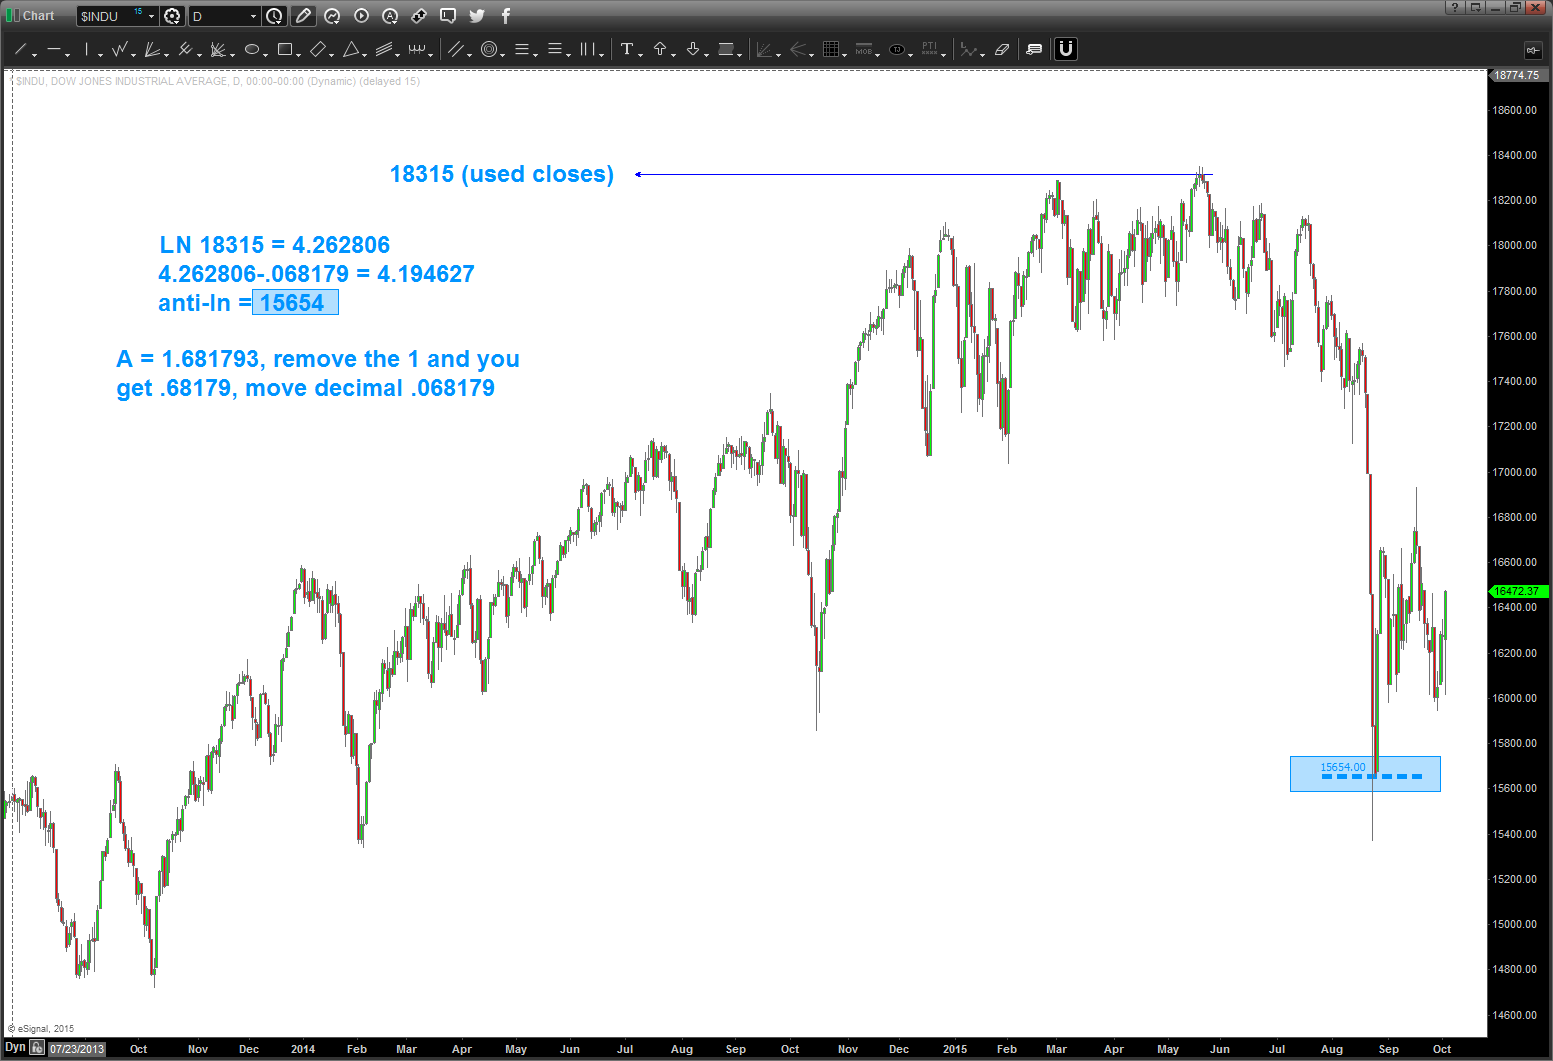
So what does this mean? Well, take a look at the chart … in 1997 the market came up and started another octave and has been banging in/around C-E for the past 20+ years. Note, the market did not CLOSE below the start of the octave “C” in 2009 … if I was in charge (and trust me I’m not) I sure think this market naturally wants to finish it’s symphony, so to speak, so is 22K out of the question? Who knows but I’m certainly going to be aware of these long term targets from 1896 as a guide.
Here’s a look on the way down …
Happy Hunting and study up …
Bart
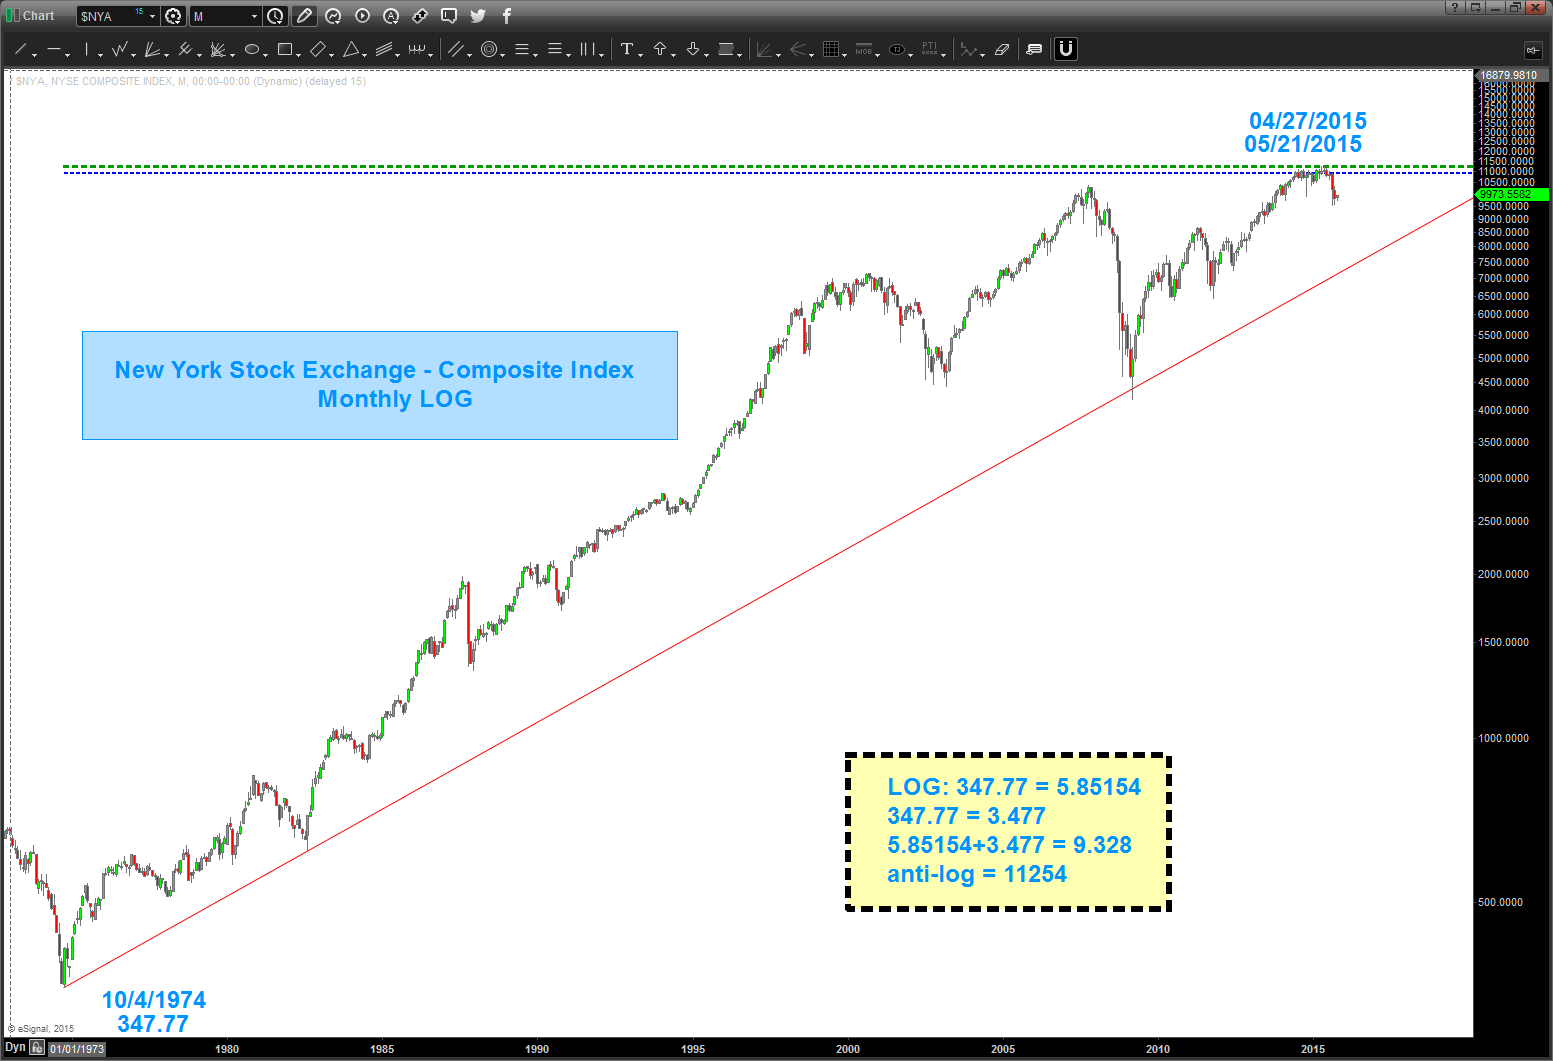
Stonehenge, the Pyramids and the high on the NYSE Index …
Posted on October 3, 2015 Leave a Comment
I’ve been asked, why do you use long term log charts so much …? Frankly, I think they are the MOST important tool in a chartists tool box.
When a mathematical property (LOGS, ANTI-LOGS, EXPONENTS) are responsible for the British Foot System, Stonehenge and the Great Pyramids I take notice …
In a prior post we discussed that “decimal points” are just “things” and when using vibrations (i.e. the market) we can move/adjust the decimal point. Take for instance the all time low on the NYSE Index at 347.77.
- PI = 3.142
- 3.142 = 31.42
- 31.42*347.77 = 10926.93 (see light blue dashed line)
Of note, the amazing Martin Armstrong called for his ECM model to turn October 01, 2015. I suspect if might have something to do w/ PI and the decimal shift. You see the fateful top in 1929 was September 03rd. 10/01/2015 was 31,439 days ago OR 3.1429.
If we go back to your long term LOG charts you’ll see the power of connecting lows via trend lines (those are key cycles) but what we can also do is PROJECT price targets and time targets.
Today, we’ll just focus on PRICE.
- All time low: 347.77
- Log (the LN key on calculator) 347.77 = 5.85154
- 347.77 = 3.477
- 5.585154+3.477 = 9.32854
- anti-log 9.32854 = 11254
Is that the EXACT high? Um, yeah, pretty much but – IS IT THE HIGH? I don’t know but what I do know is everything is tied together and it’s all math …
have a good weekend …
