Stonehenge, the Pyramids and the high on the NYSE Index …
I’ve been asked, why do you use long term log charts so much …? Frankly, I think they are the MOST important tool in a chartists tool box.
When a mathematical property (LOGS, ANTI-LOGS, EXPONENTS) are responsible for the British Foot System, Stonehenge and the Great Pyramids I take notice …
In a prior post we discussed that “decimal points” are just “things” and when using vibrations (i.e. the market) we can move/adjust the decimal point. Take for instance the all time low on the NYSE Index at 347.77.
- PI = 3.142
- 3.142 = 31.42
- 31.42*347.77 = 10926.93 (see light blue dashed line)
Of note, the amazing Martin Armstrong called for his ECM model to turn October 01, 2015. I suspect if might have something to do w/ PI and the decimal shift. You see the fateful top in 1929 was September 03rd. 10/01/2015 was 31,439 days ago OR 3.1429.
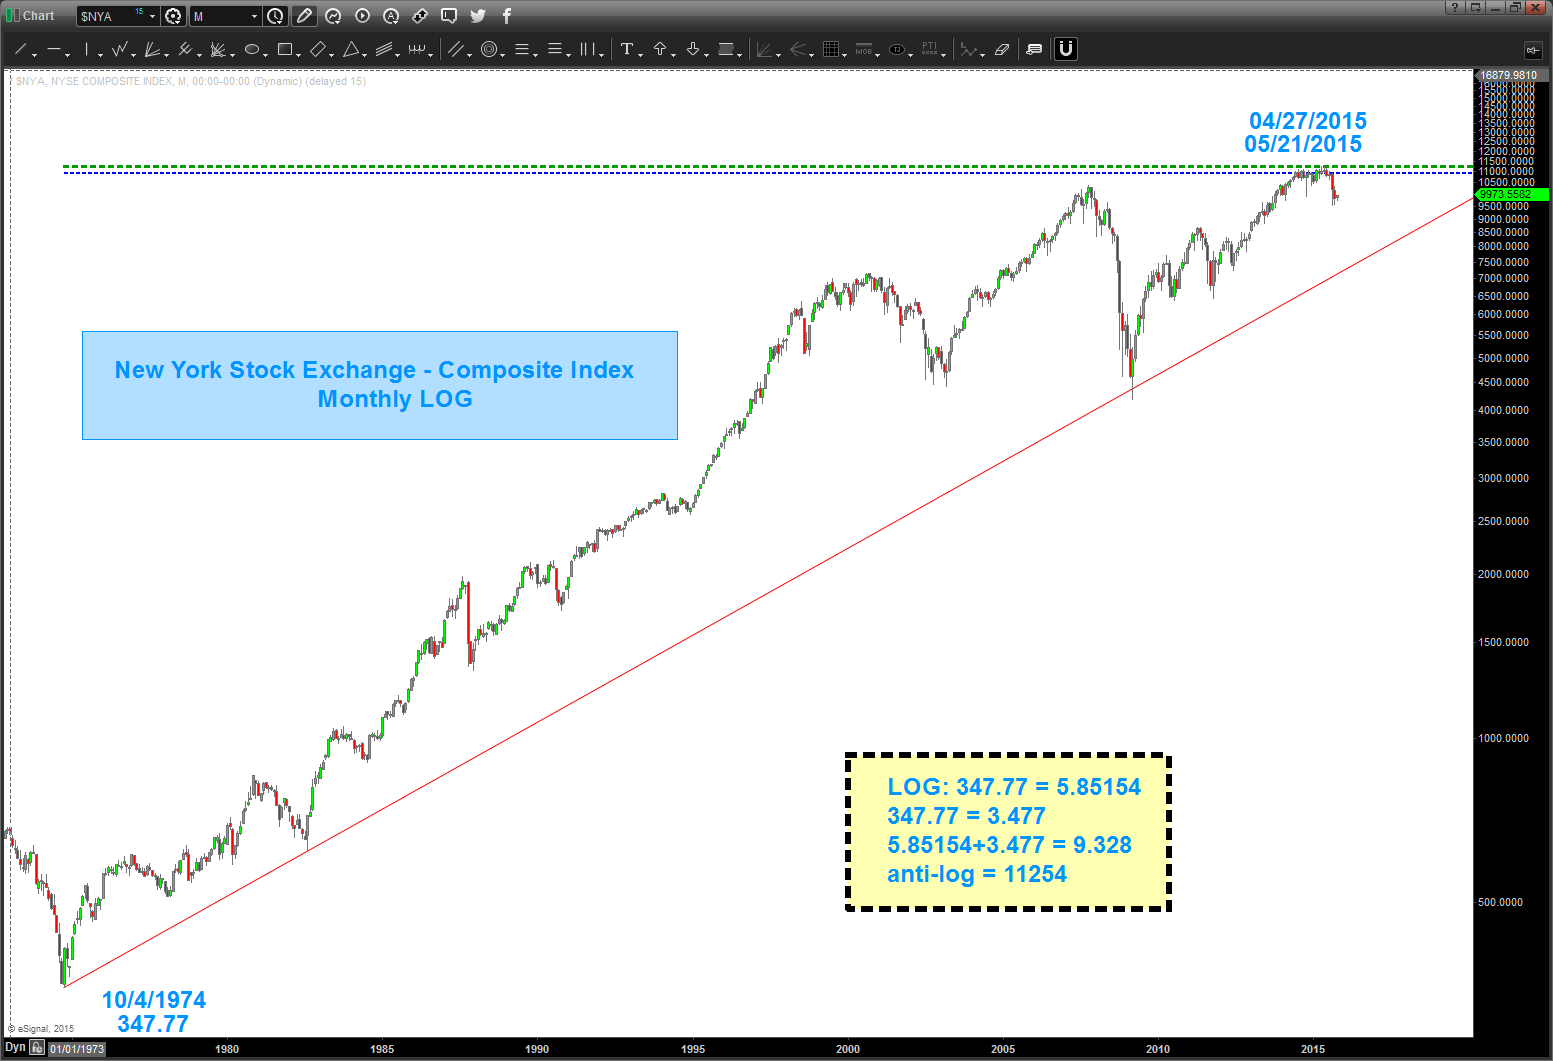
If we go back to your long term LOG charts you’ll see the power of connecting lows via trend lines (those are key cycles) but what we can also do is PROJECT price targets and time targets.
Today, we’ll just focus on PRICE.
- All time low: 347.77
- Log (the LN key on calculator) 347.77 = 5.85154
- 347.77 = 3.477
- 5.585154+3.477 = 9.32854
- anti-log 9.32854 = 11254
Is that the EXACT high? Um, yeah, pretty much but – IS IT THE HIGH? I don’t know but what I do know is everything is tied together and it’s all math …
have a good weekend …
