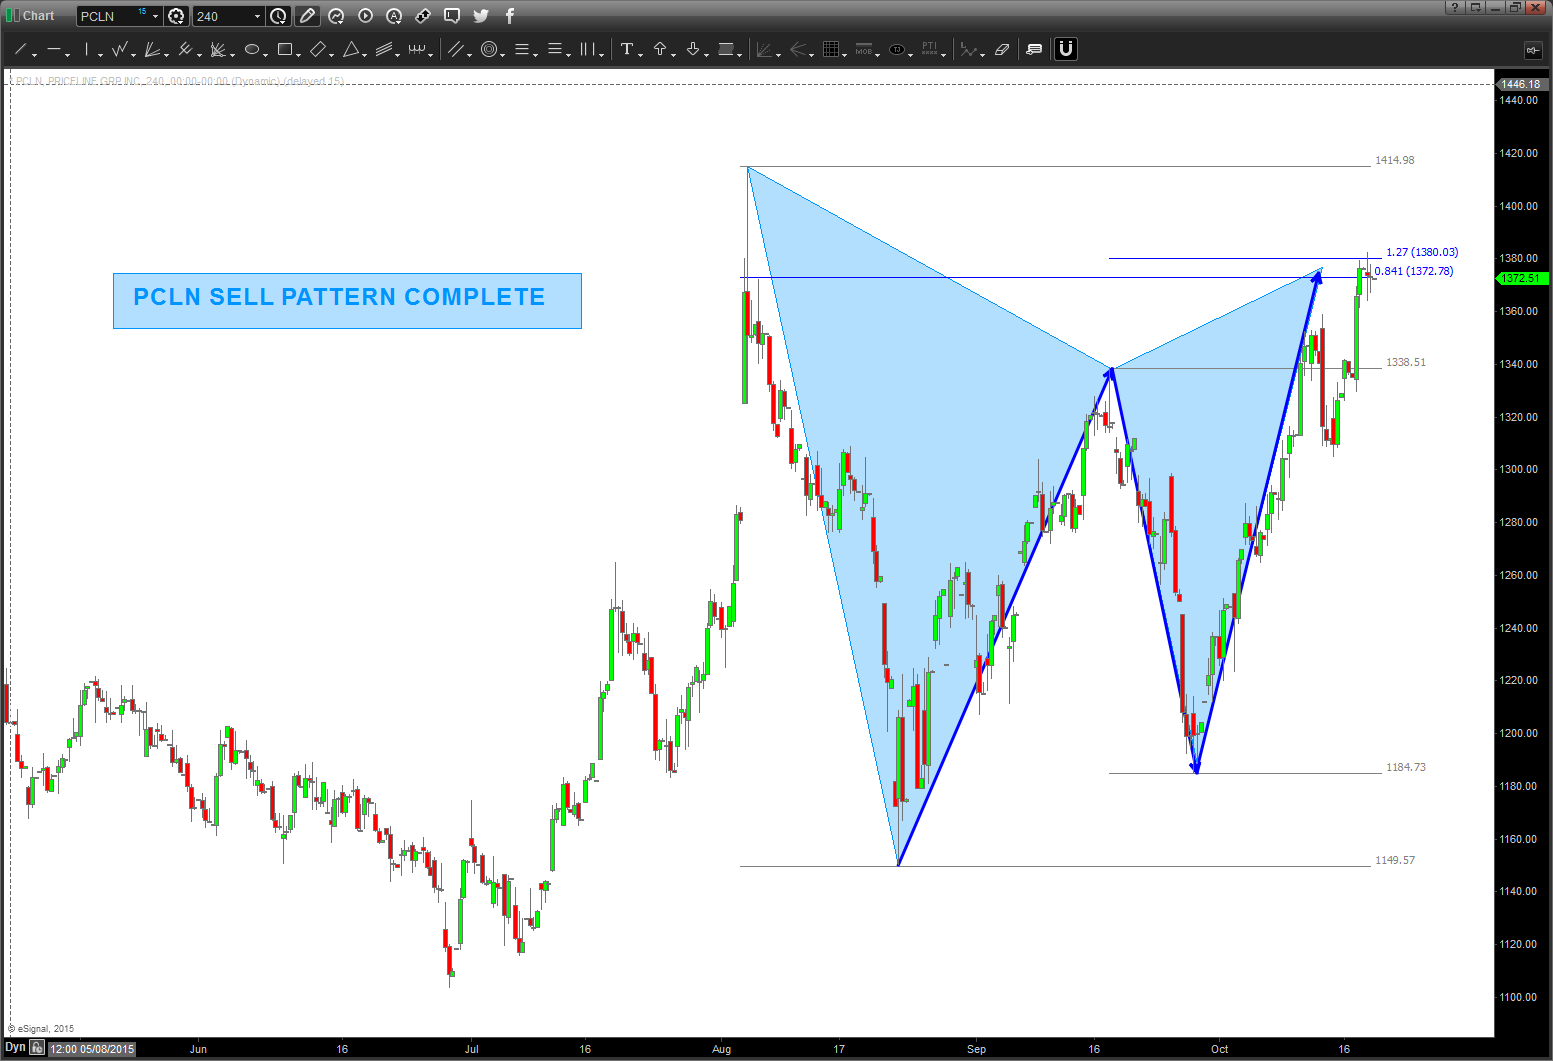
$PCLN sell pattern complete
Posted on October 20, 2015 Leave a Comment
IF the mirror image foldback is in play THEN this pattern needs to hold and start down. a move below 1360 would bolster conviction that the mirror image mentioned earlier is in play.
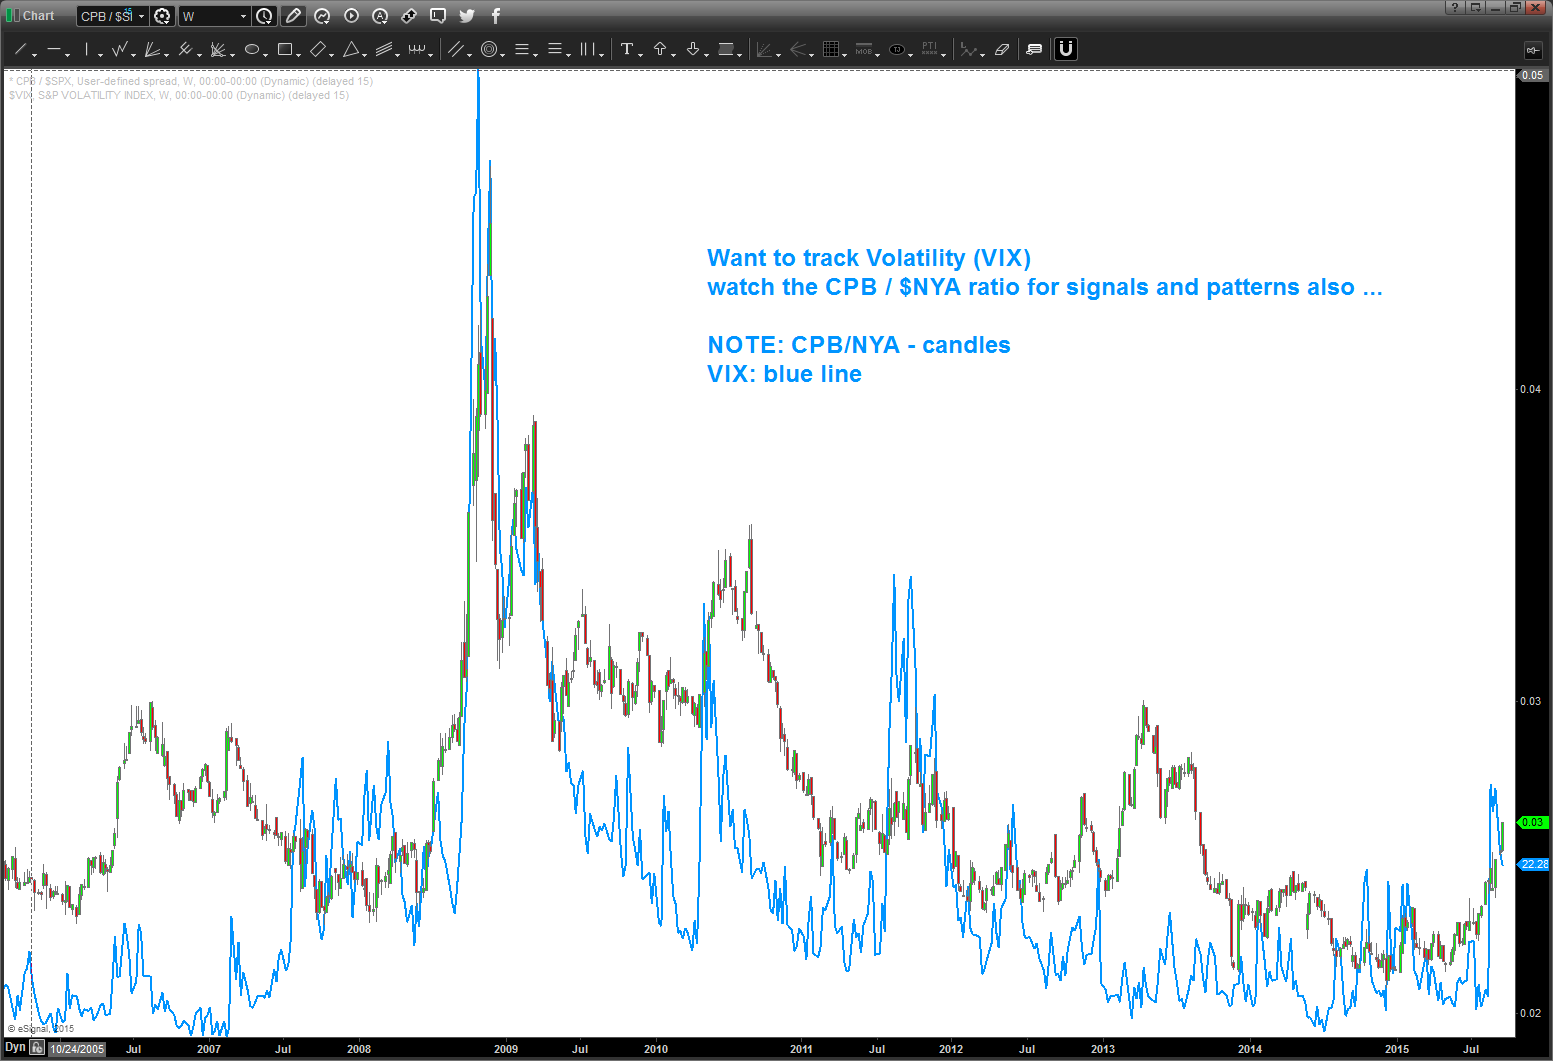
when the big boys eat soup volatility rises ….update
Posted on October 18, 2015 Leave a Comment
October 18 2015: note, the CPB/NYA ratio has been straight down but it running into potential support a little lower. The thesis is during times of “risk off” institutions roll into the staples and stuff like toilet paper, toothpaste, food, soup, etc. has stronger relative strength. Keep an eye on this next week as support for the ratio “should” work it’s way into more volatility and be bearish for the overall equity picture.
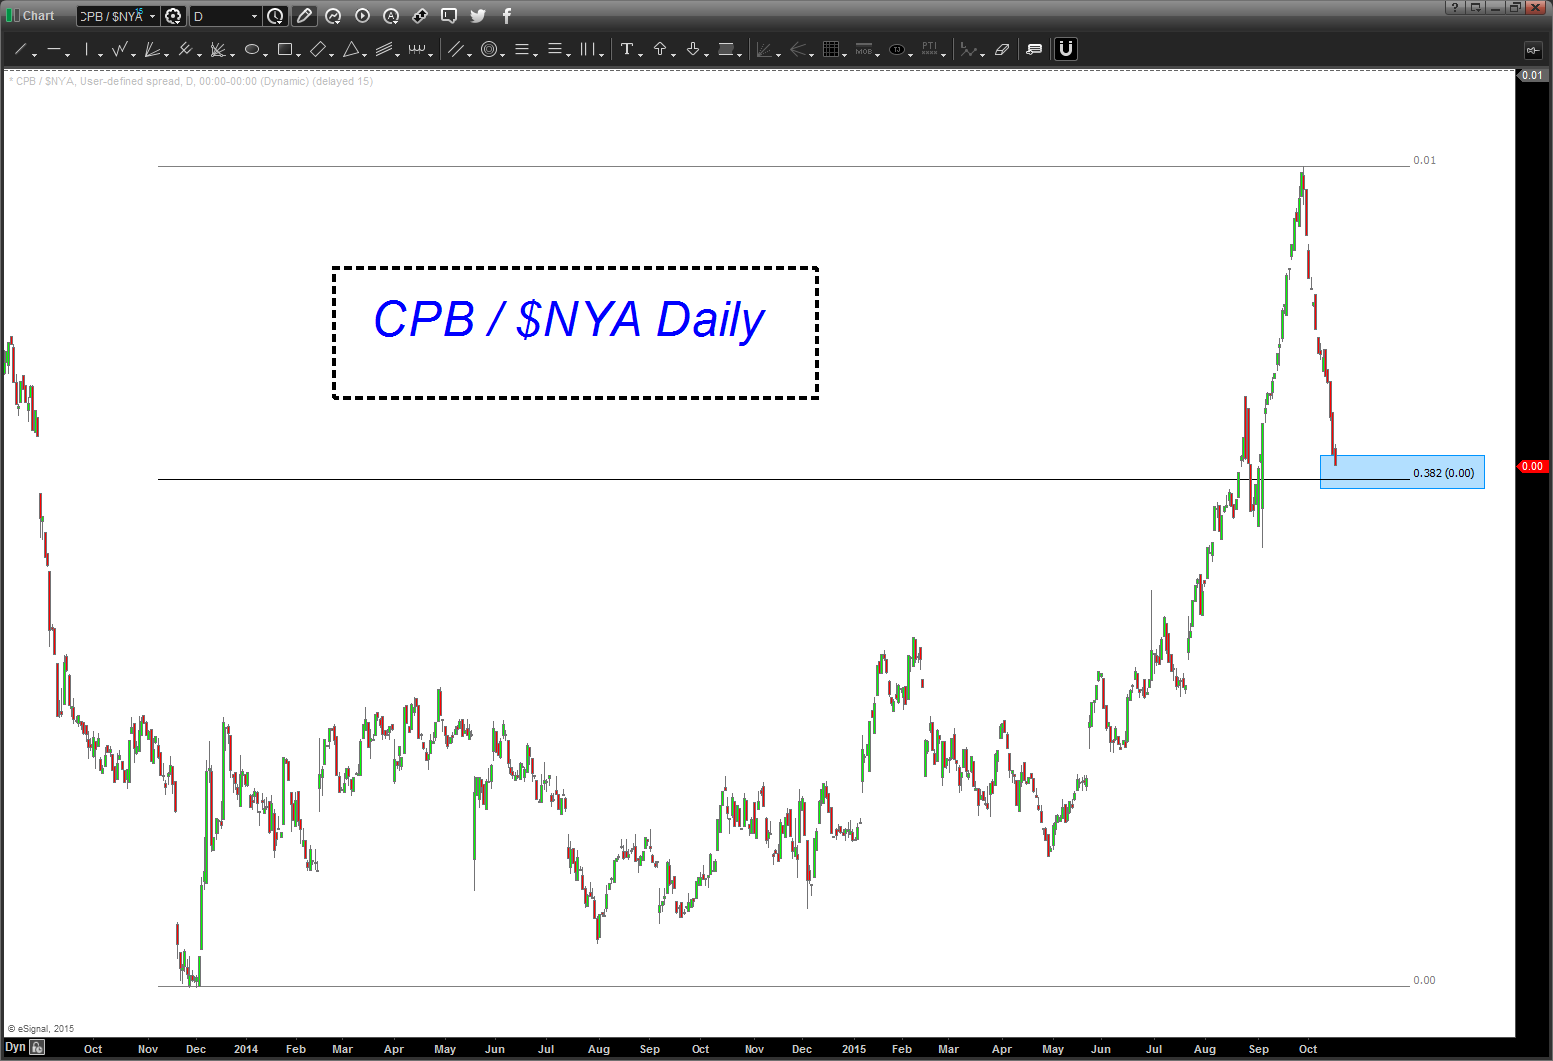
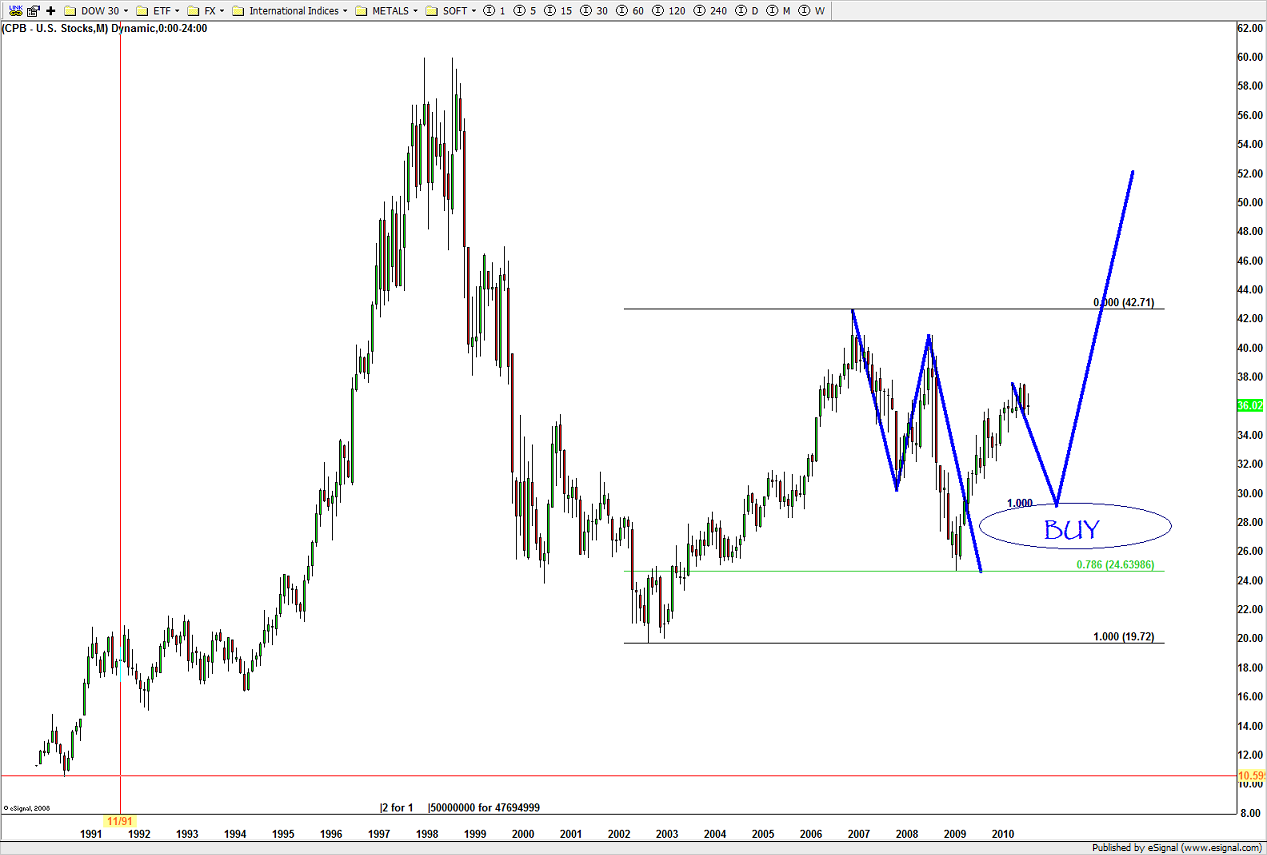
Below the two dashed lines is a post that I did 2 years ago – almost to the day. Pretty amazing …some would call it synchronistic. I’ll just leave it at that …
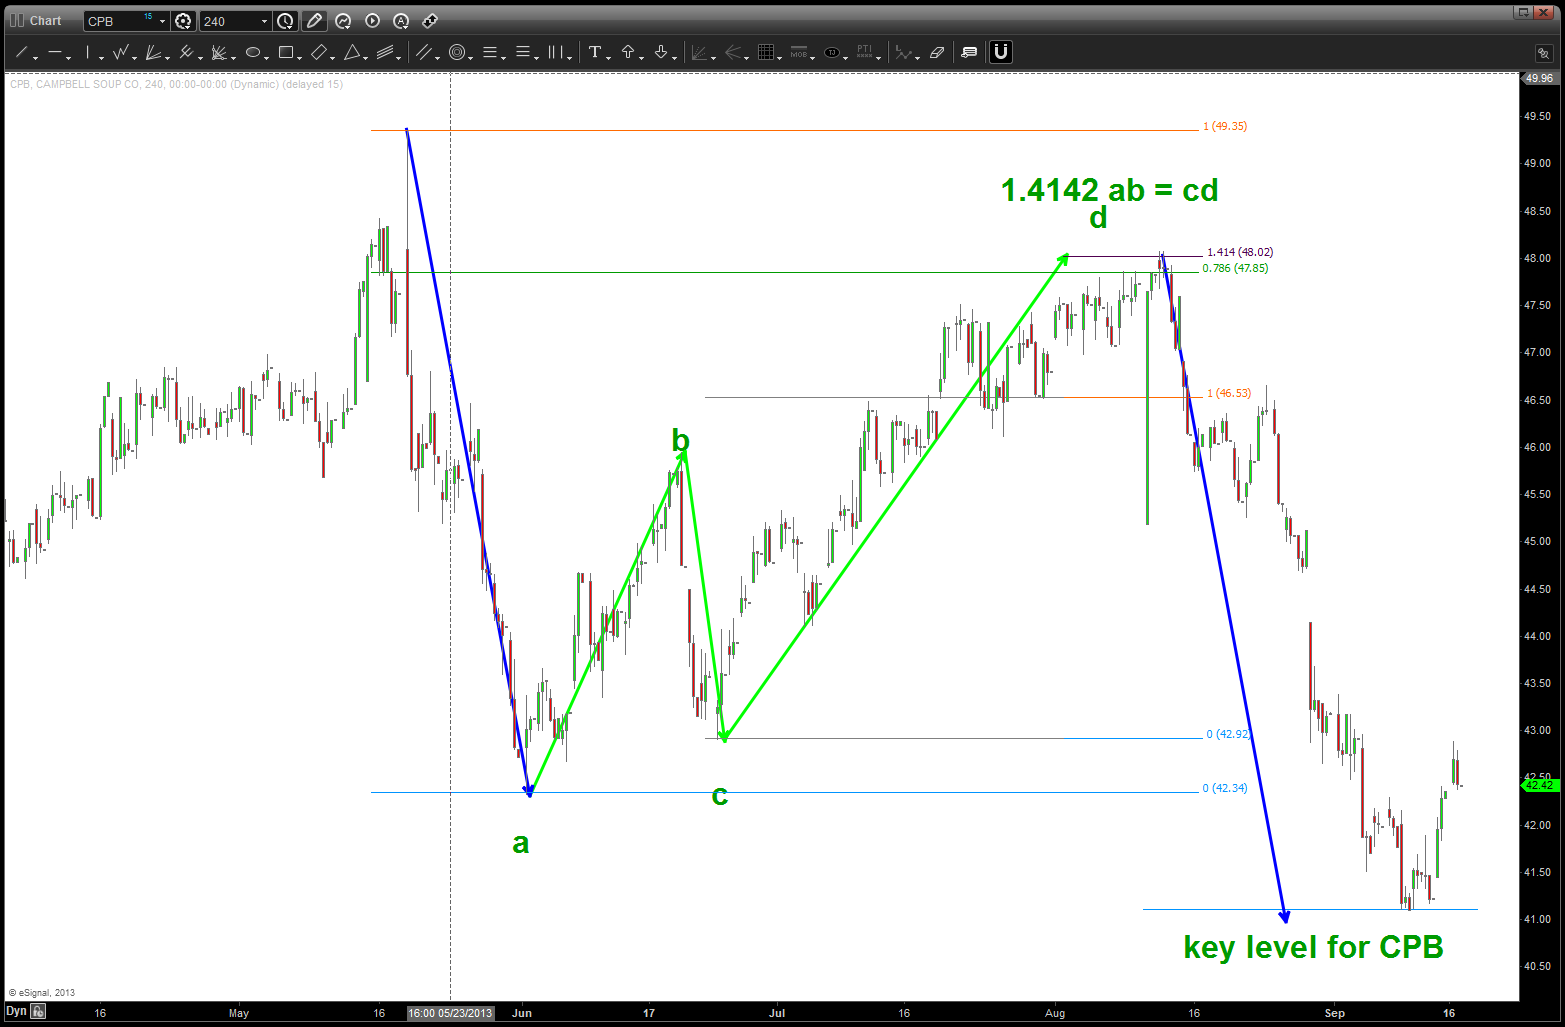
Personally, I enjoy my Saturday and Sunday morning’s w/ a cup of coffee. Nothing going on, put a little Pandora on the headset and just “chill” and enjoy the amazing fall weather in VA. Little Bird said – “hey Bart, how about CPB soup?” So I took a look and – BAM – I was surprised.
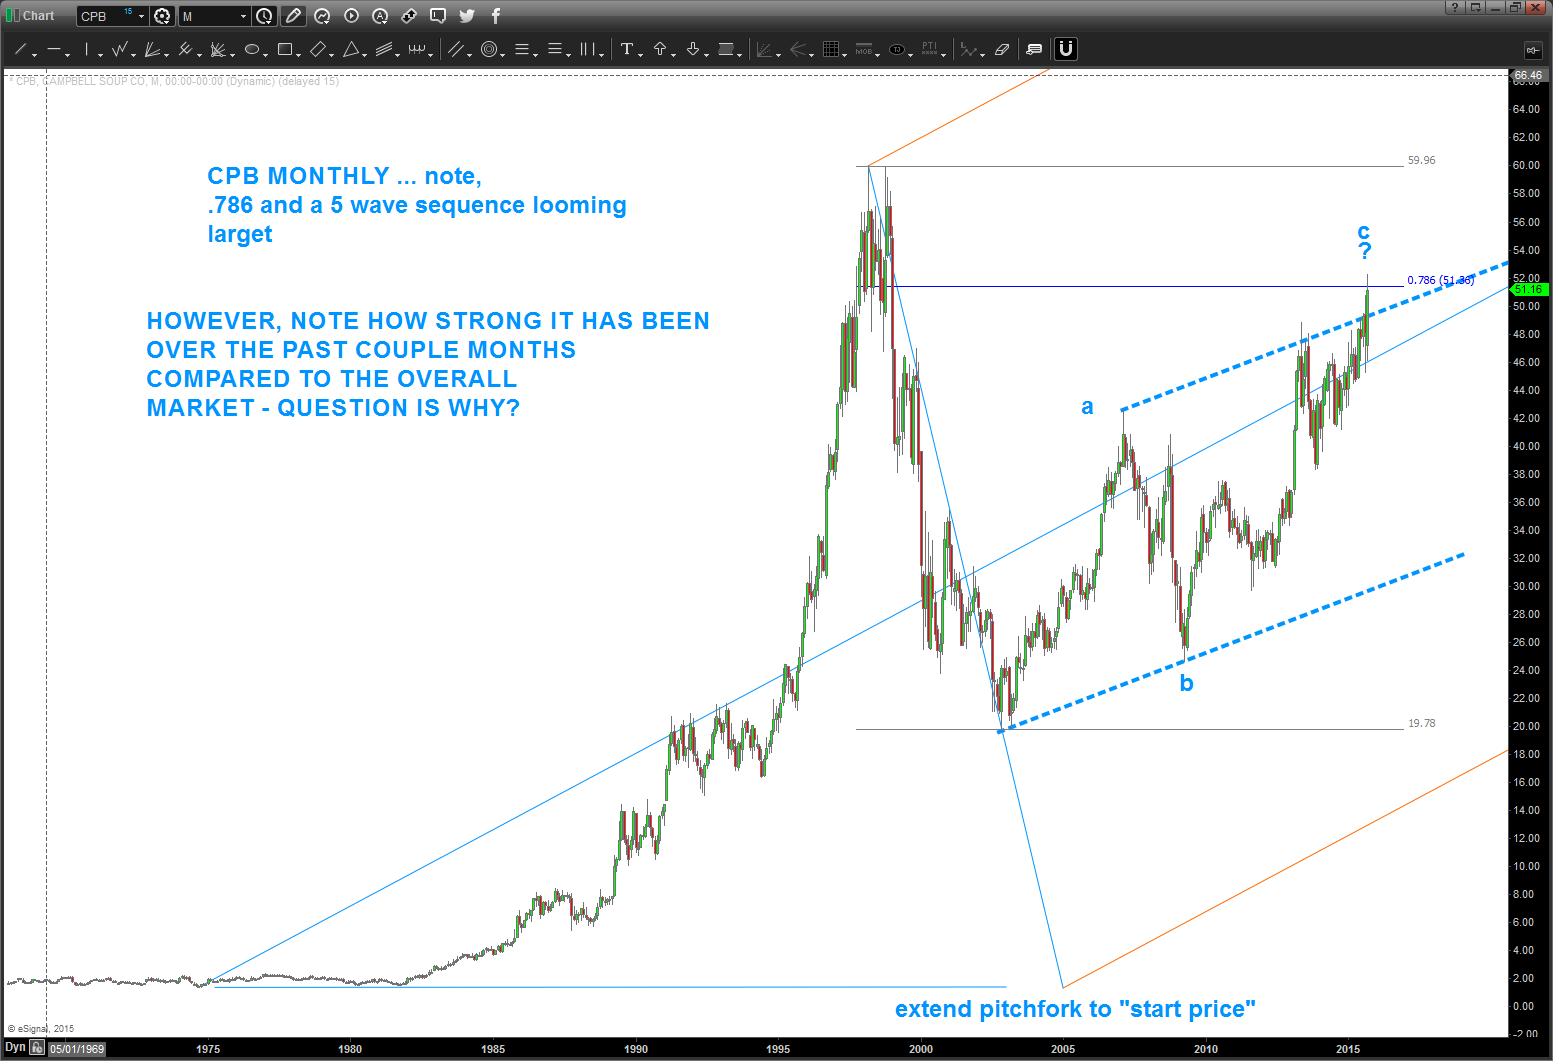
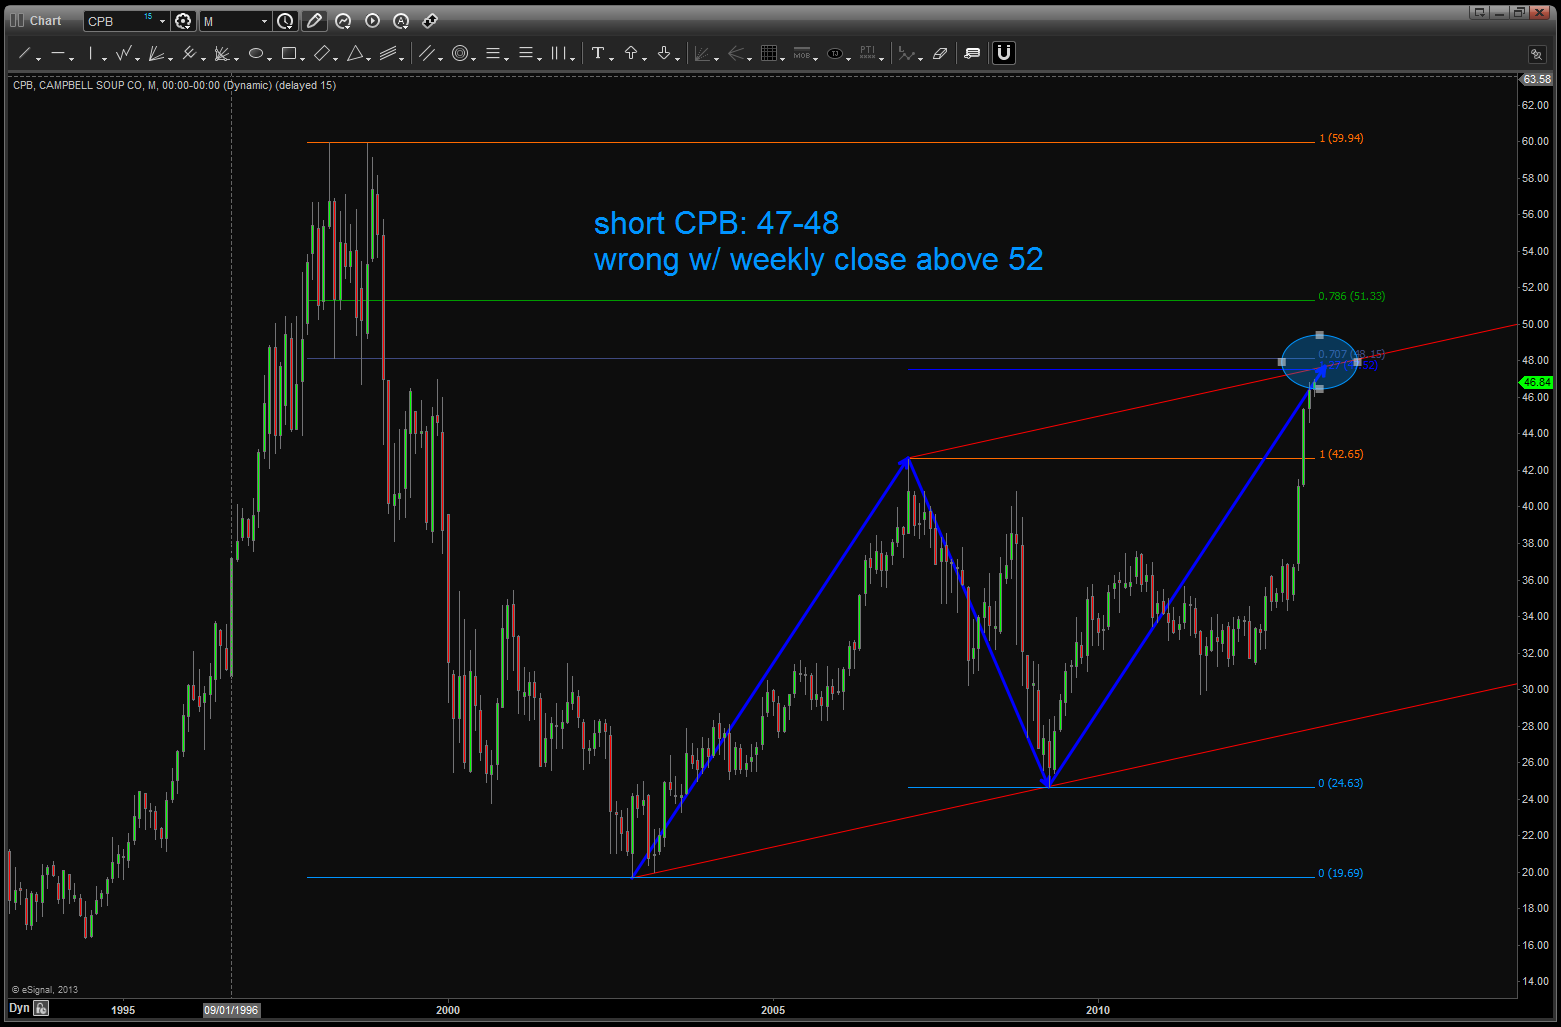
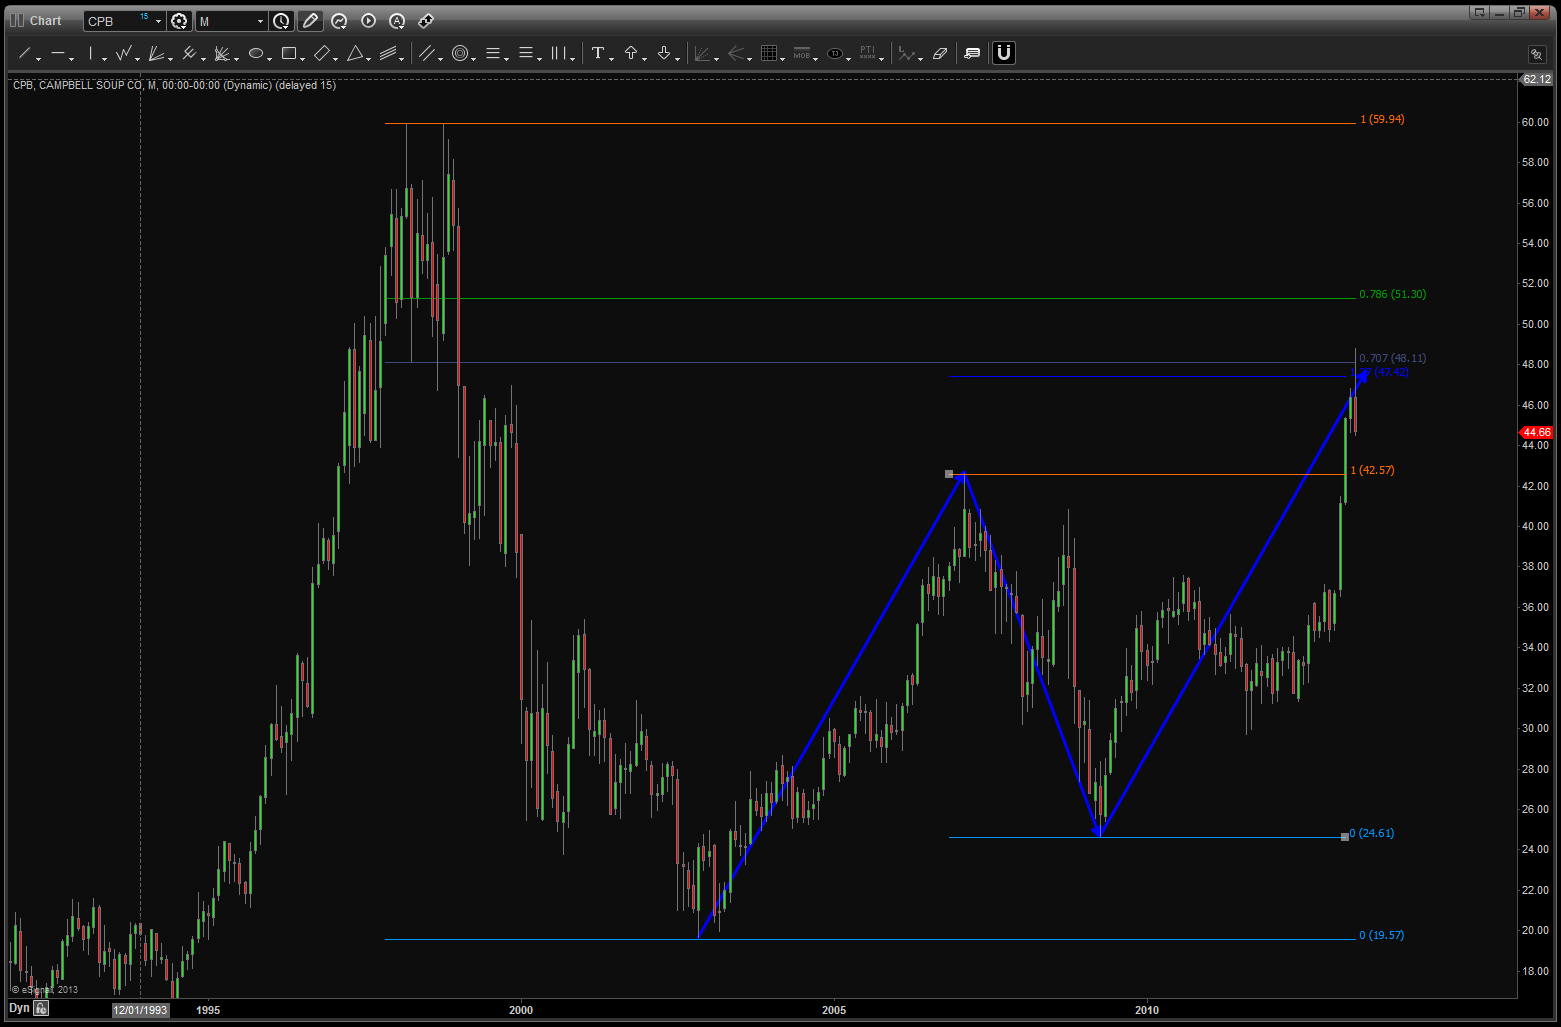
If you go all the way back 2 years ago you’ll see that we had a nice pattern forming and it hit – to a tee at 48.
The market pulled back about 10 bucks and then started to march back up … a slow grind but it did go up.
As you can see above 52 and it was considered a failed pattern.
This week we went up and touched that level and, while I can see a 5 wave count up into this area and seeing an a-b-c type of correction what REALLY made me go hmmm is, of course the relative strength of CPB compared to the NYA. Why? STAPLES BABY …. a couple posts ago I mentioned we should be watching the XLP / $SPX for strength to signal more market weakness. Soup is a staple – period.
So, couple things of note:
- CPB is strong compared to the overall market.
- It has closed, on a weekly basis, the trend channel defined by the blue dashed line.
- there is a 5 wave count into the 52 area so warrant caution here if going to play on the long side.
- the short side is also a play, but would wait for the 48 level to be broken to the downside on a weekly close.
here’s what really has me interested in the RELATIVE STRENGTH OF CPB vs NYA
Points of Interest
- from the 1980’s CPB “outperformed” (the ratio went up) the overall market.
- the ratio TOPPED in 1997. the overall market didn’t top until 2000.
- but when the market did, eventually, top, the relative strength of CPB / NYA bottomed exactly the same time
- think about it for a moment .. the ratio CRASHED going into the top in 2000. Folks, that’s irrational exuberance. throw caution to the wind and get in, get in, get in and then ….ouch.
- while not as dramatic, the same thing occurred in the 2007-2009 period.
- the ratio bottomed as the market topped.
- presently, we do have some strength taking off and we have closed above the black dashed trend line.
- is that a signal that a strong move in the ratio is coming? Potentially, so monitor closely and do not be lulled to sleep. Strength in this ratio is not good for the overall health of the equity market.
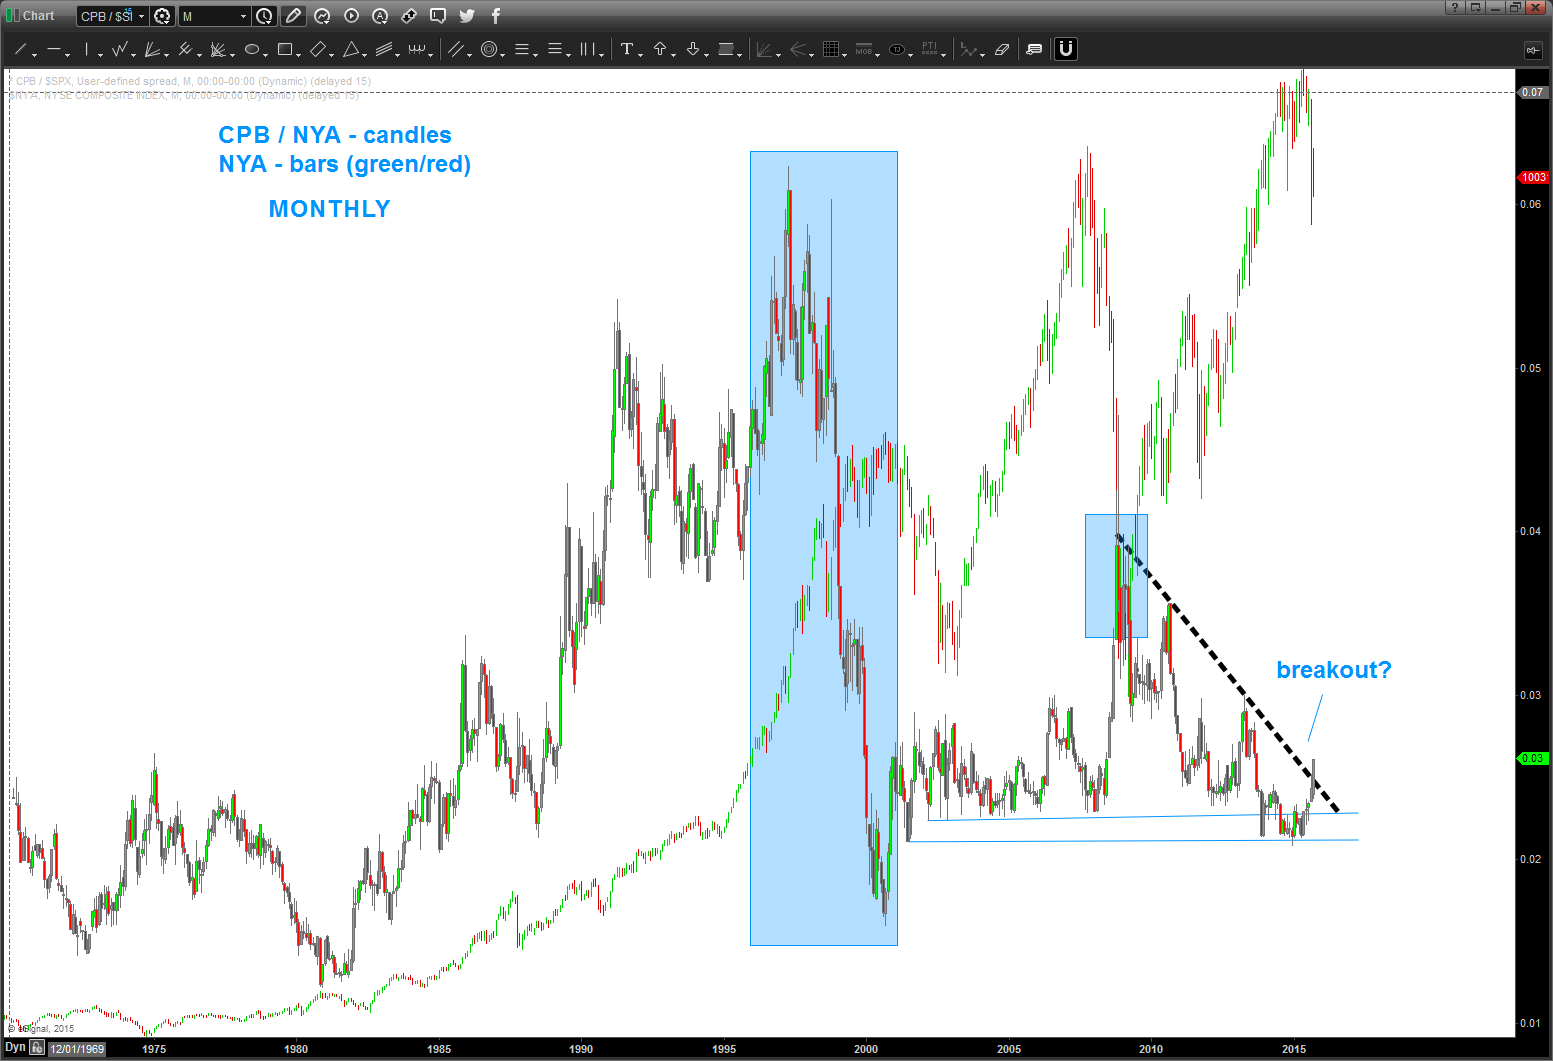
one last folks … let’s not try to “fundamentalize” this last chart. that’s for the really smart people .. but take a look at the CPB/NYA ratio and the VIX. It’s a near perfect match.
When the institutions start eating soup … expect volatility to rise.
swings on this puppy have been extremely nice ….charts below.
just follow the bouncing ball …
nice BUY pattern emerged at level forecast …
long term pattern came into play. good pattern/good defined risk …
level being hit ….
note, now we have completed the equality of swings and the level held at/around 41.
watch the lower level on CPB … if we break it, selling could really come in ….
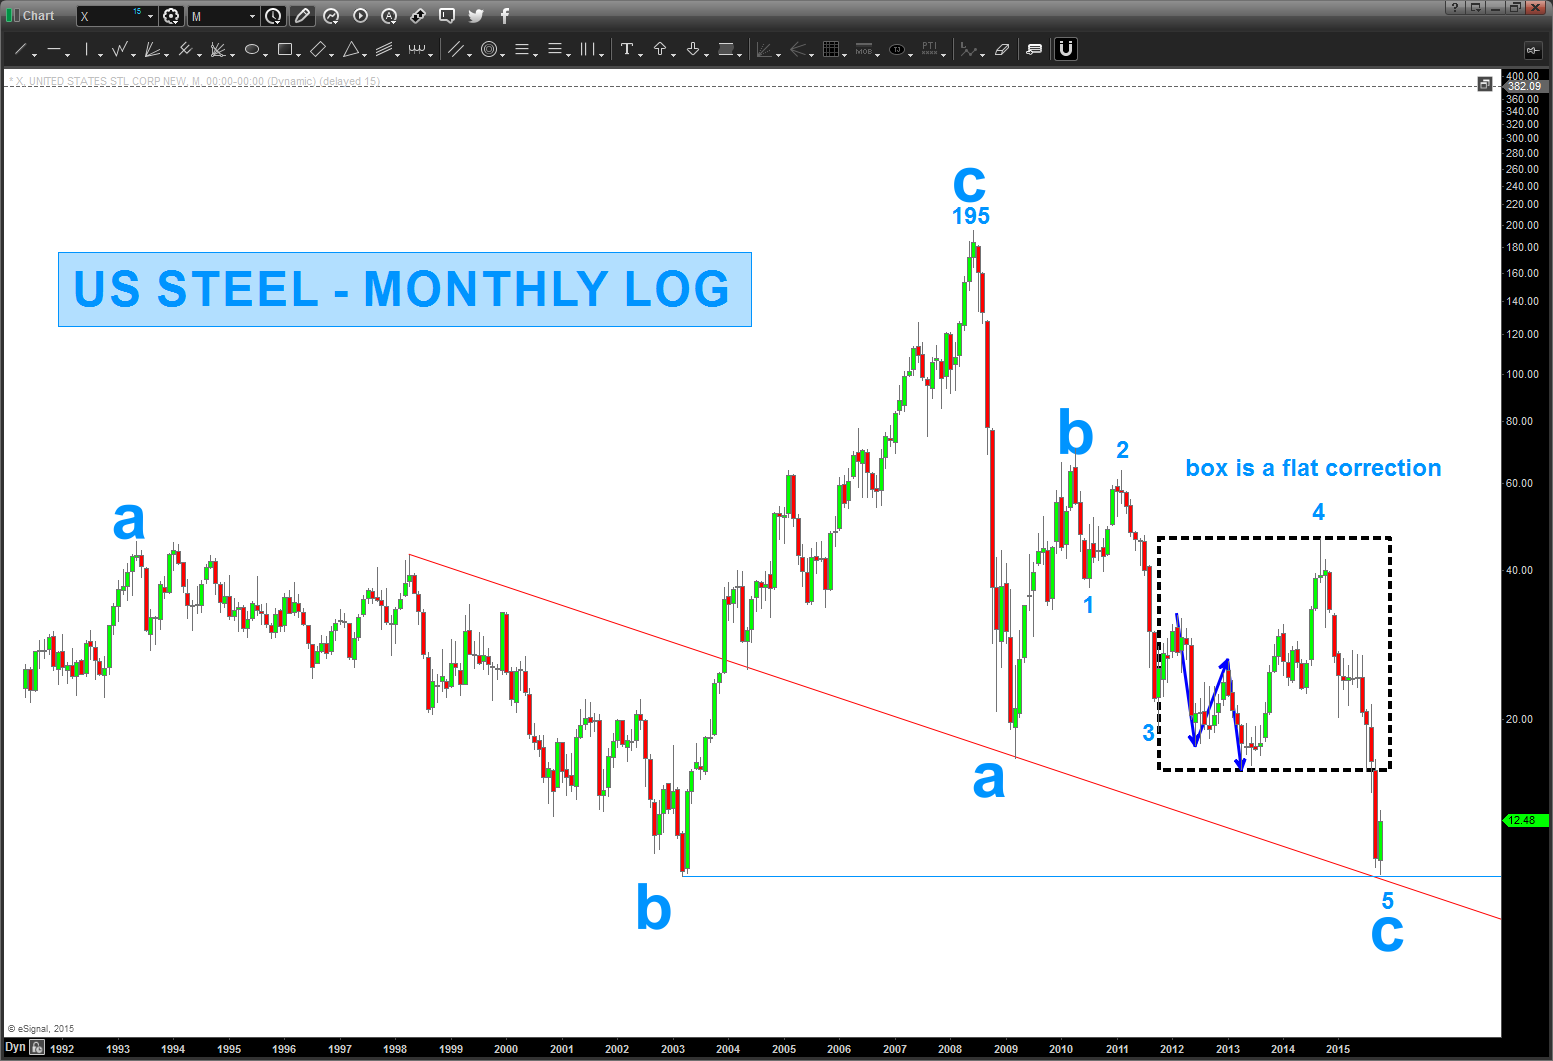
Why Not …? US STEEL
Posted on October 16, 2015 Leave a Comment
X is a dog … but, if you look at the picture painted, why not? Get out below 10 and run w/ it?
I saw the breakout earlier this year and thought we had a run going but it failed, big time into the lows shown.
but taking a step back and looking at it … that counts sure appears tempting to risk a couple to get 10? 5;1?
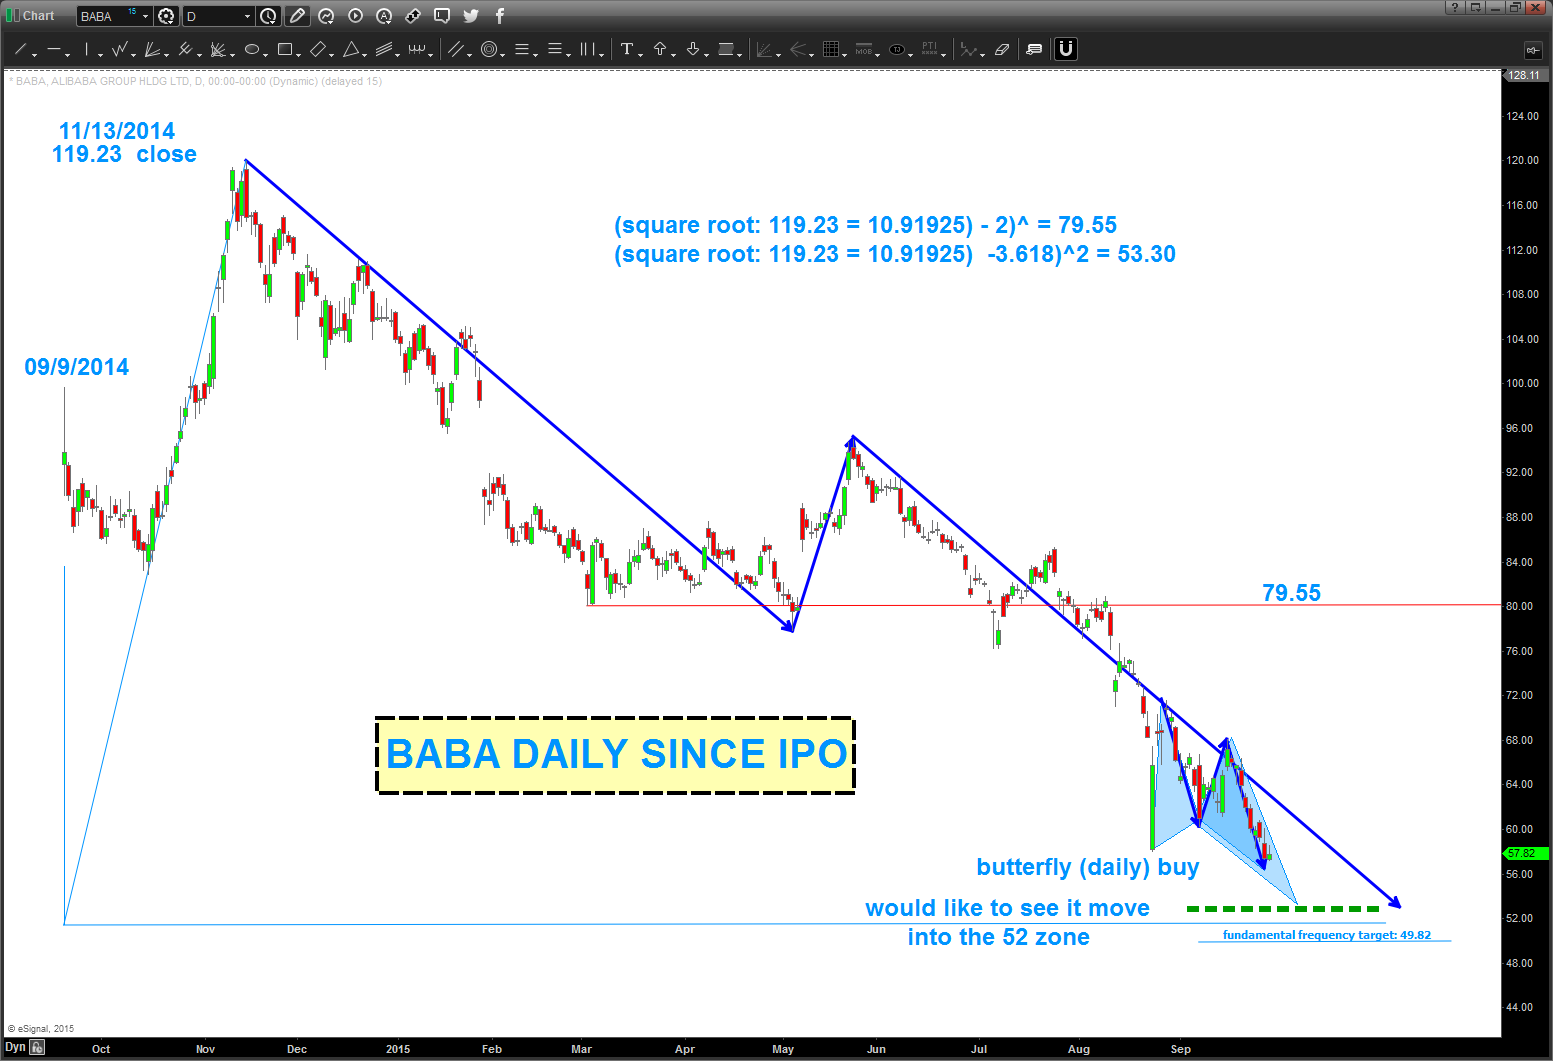
$BABA
Posted on October 16, 2015 Leave a Comment
10/16/2015
update to BABA – note the butterfly BUY that hit. we’ve rallied nicely and when we roll 3 waves into a new low, that’s a B wave and the move from 56 to 74 sure smells like a C wave. So, might want to take some off or close OR perhaps look for an SRC to short into the 52 zone.
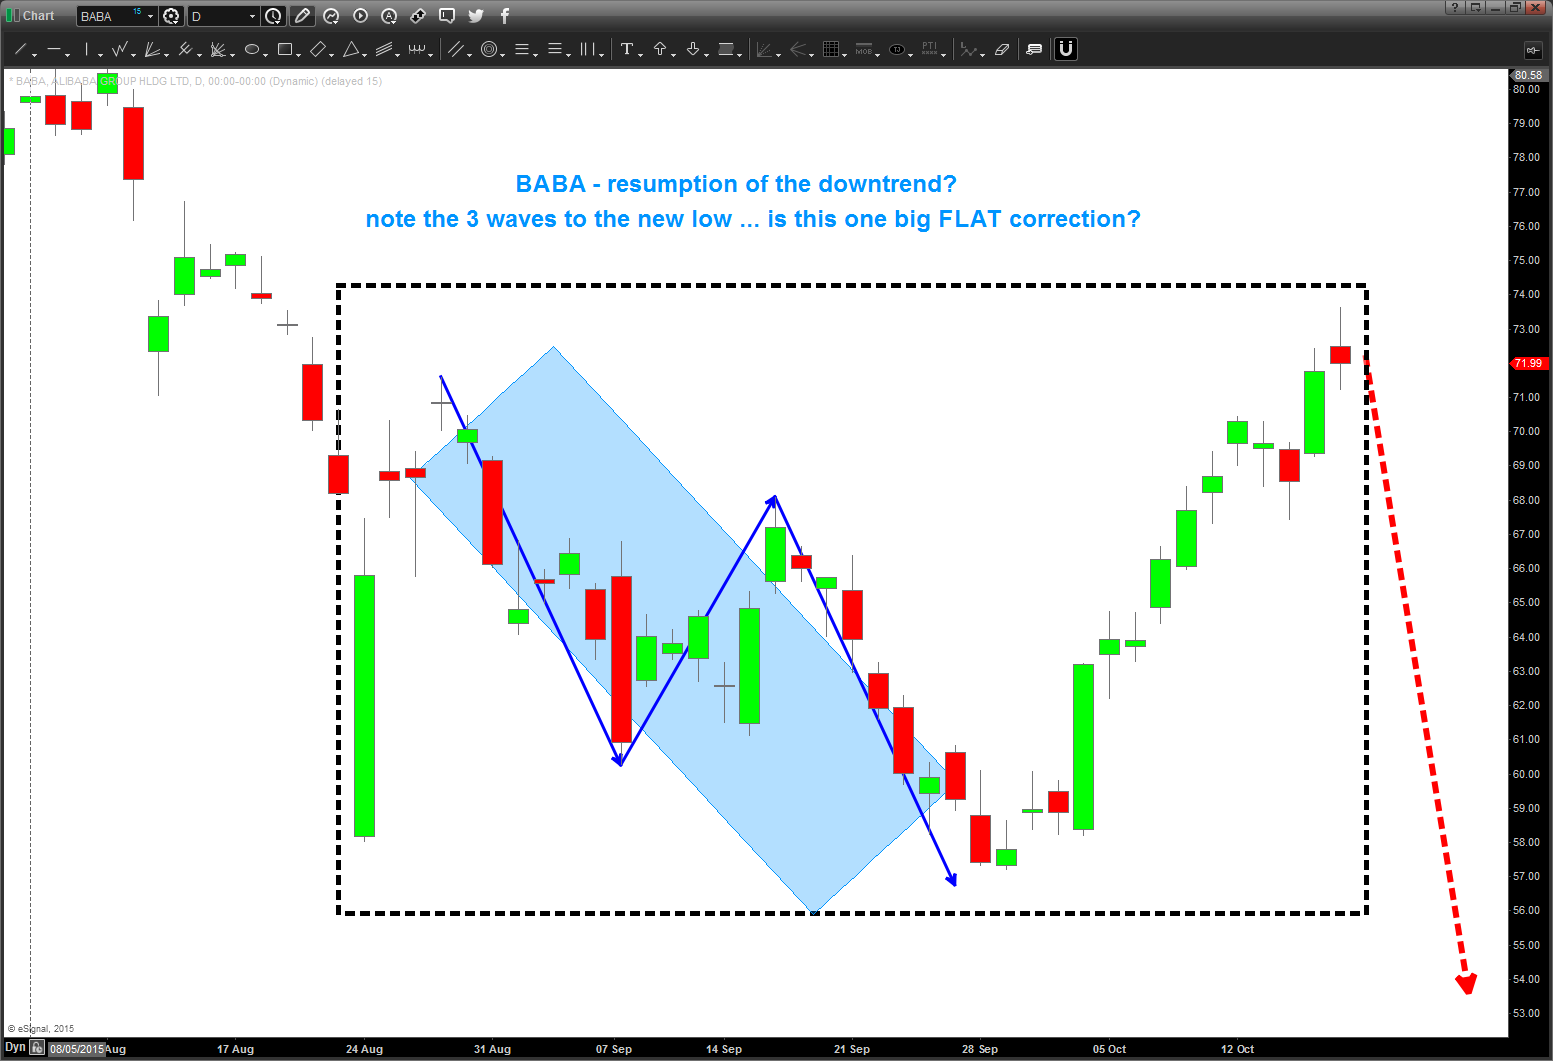
Folks, what a battering for $BABA. The entire world that bought the largest IPO in history has been underwater since basically February 2015. Perhaps, only probability here, their fortunes are about to change (pardon) the pun …
You can see below we have some nice MATH = MUSIC= VIBRATIONS coming into play 50-52.
$WMT ,November 2013 looking for the top and now 55-56 for support
Posted on October 15, 2015 Leave a Comment
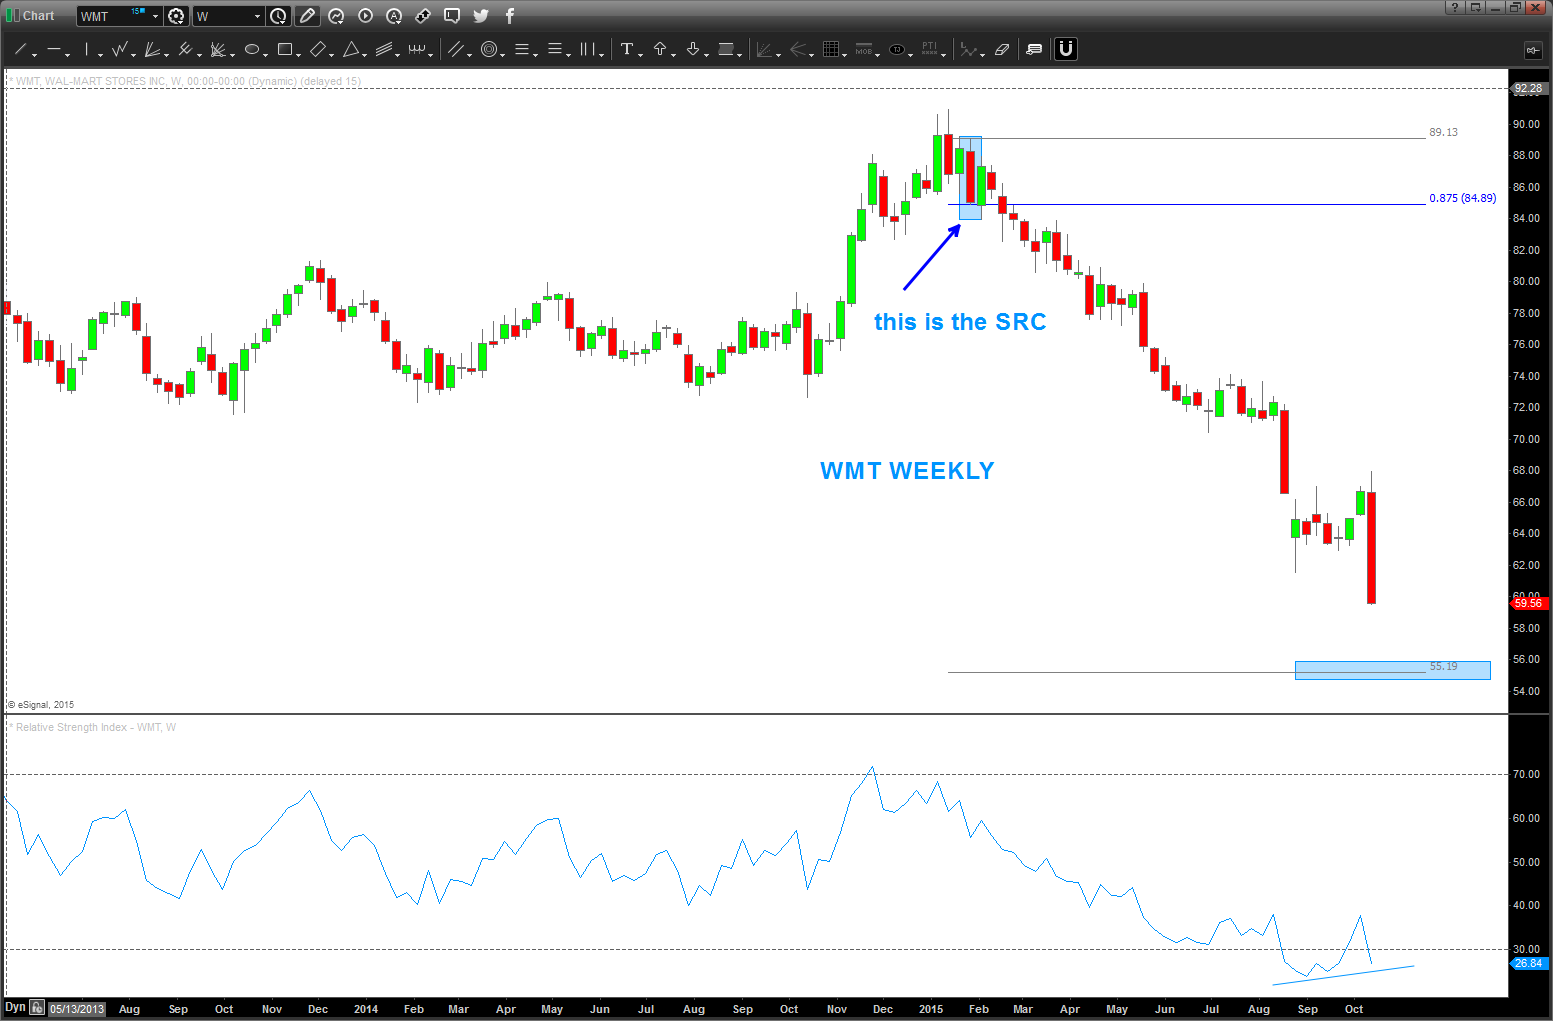
Here’s the picture of $WMT in 2013 – sure looked, at the time, we were finishing 5 waves and the circle area was the target area for a “potential” top.
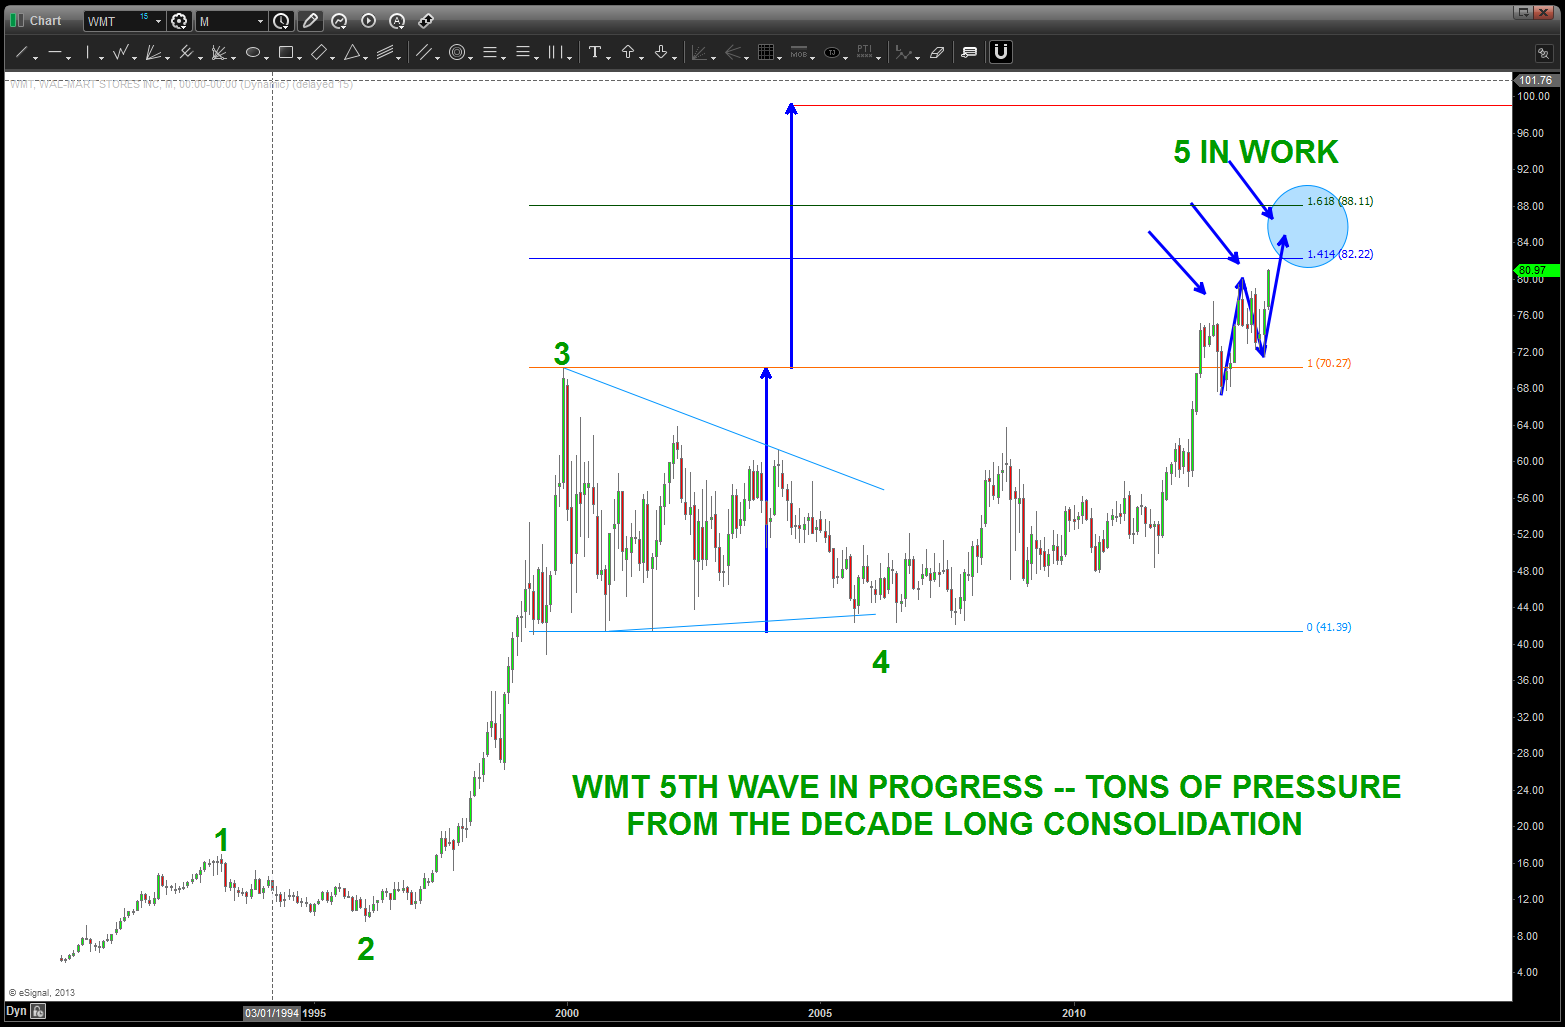
$WMT moving into the highs – Nov 2013
Target was hit and yesterday the move rally began. Hard to believe it’s roughly 2 years ago that this pattern was ID’d and it took that long for it to start to make the “news” so to speak. Anyway, now that the chaos and news is getting ahold of it, believe a look at a potential long swing trade in the mid to low 50’s is reasonable.
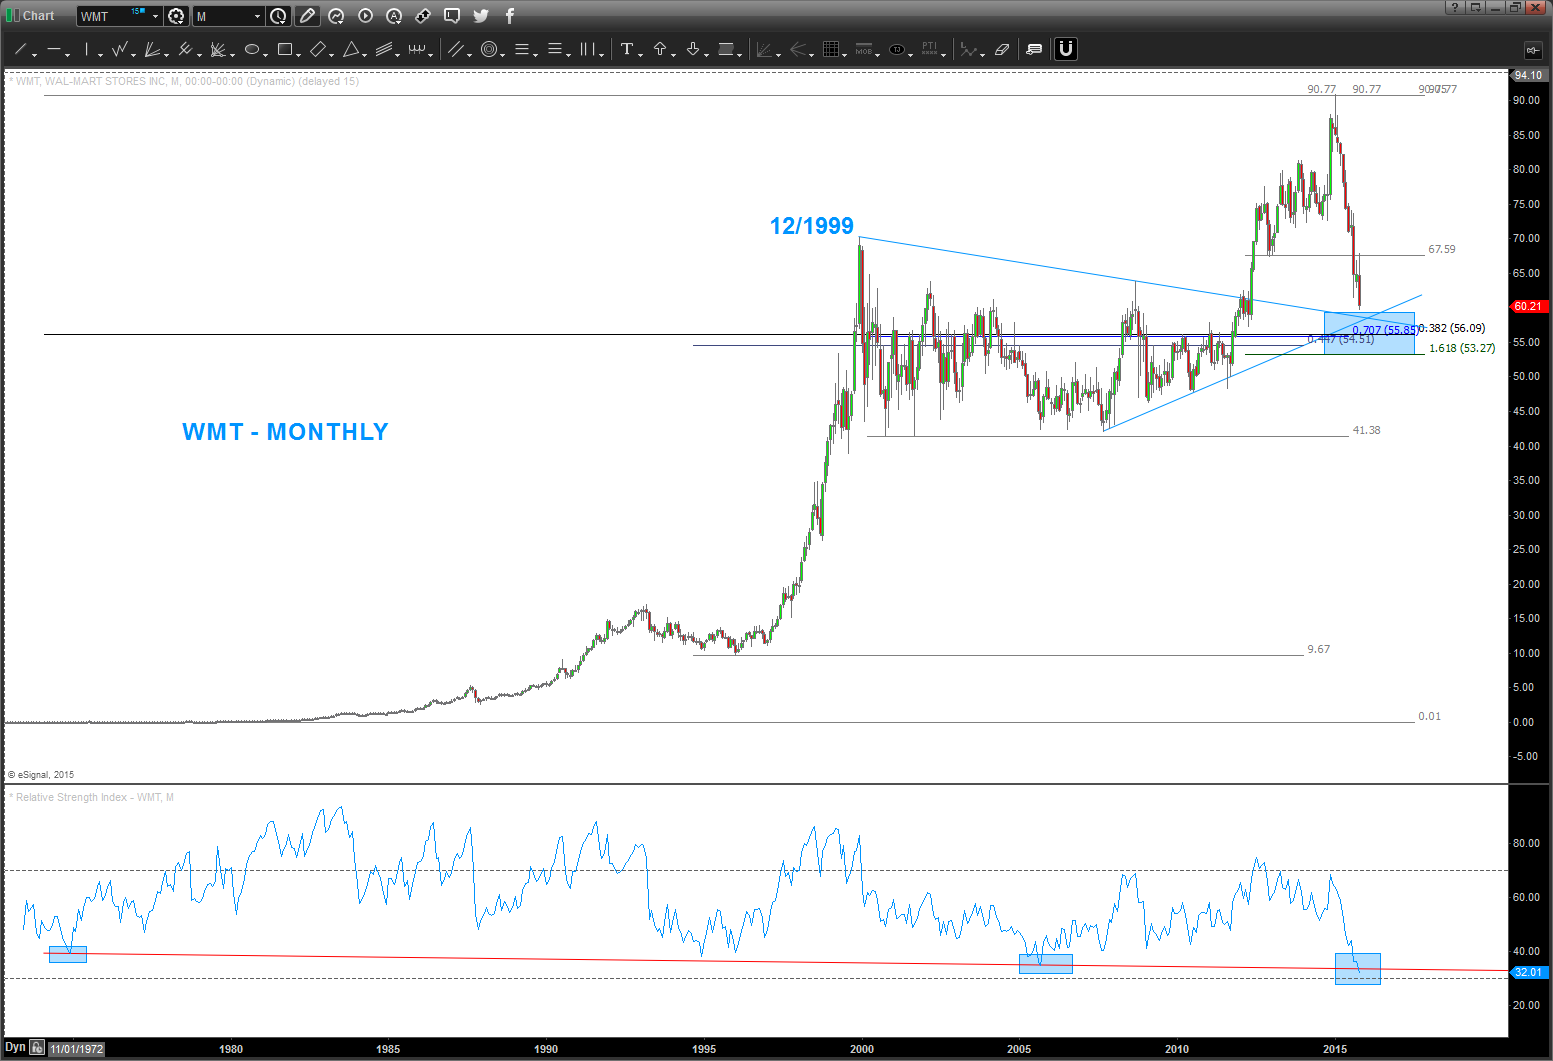
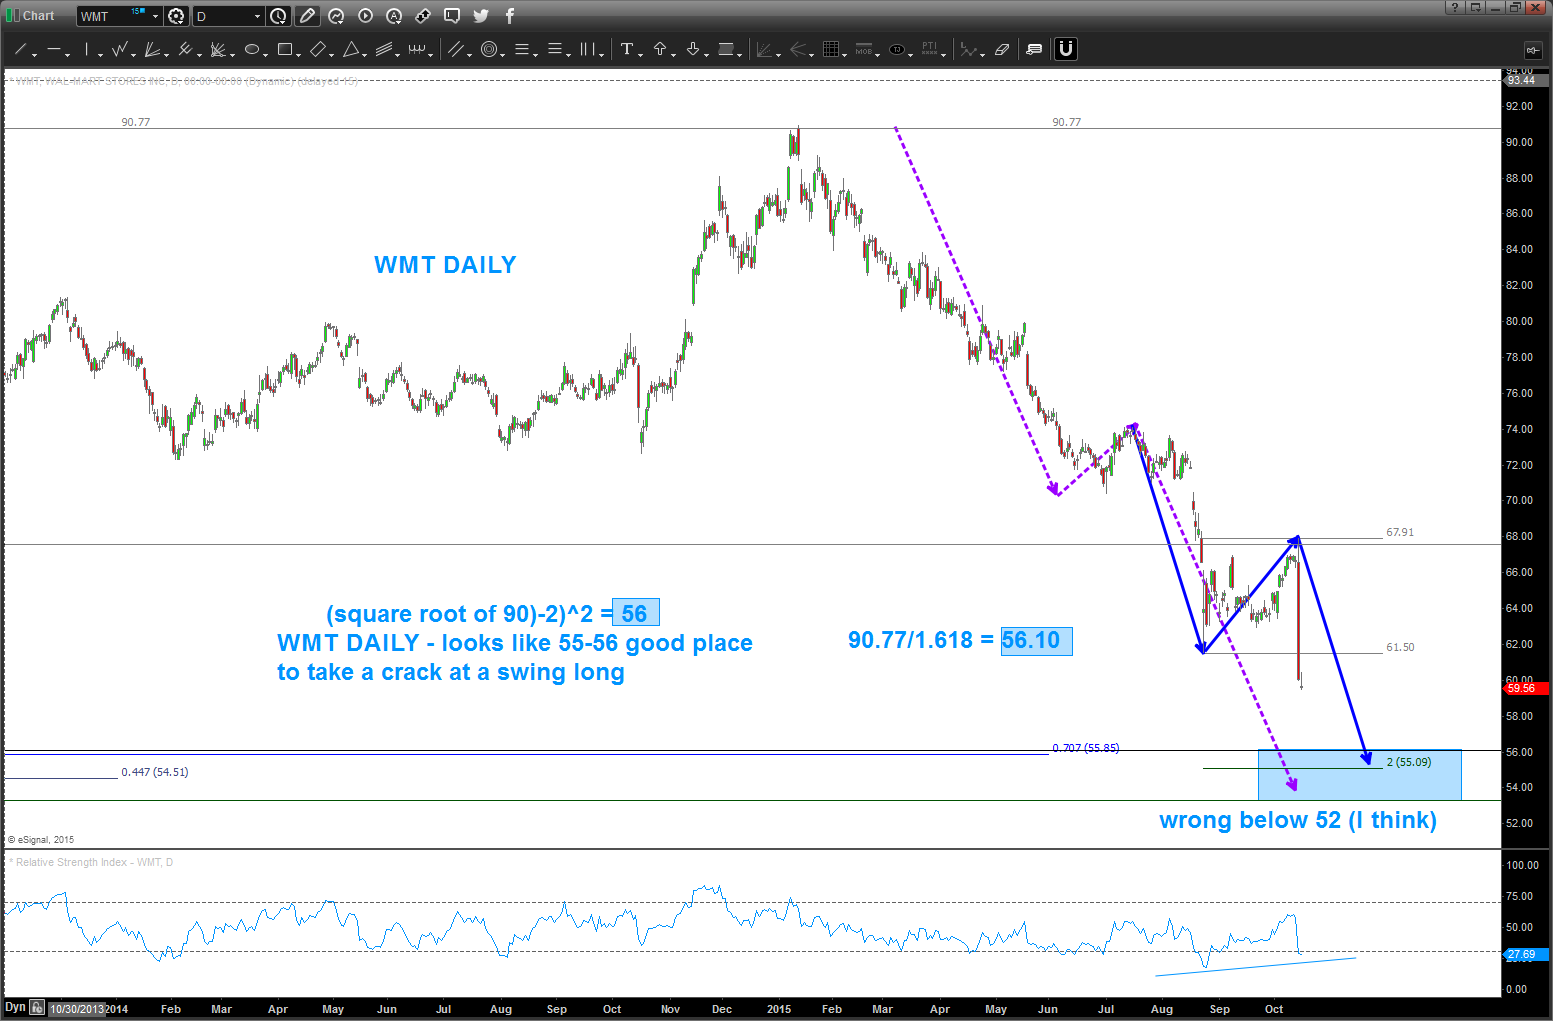
Here’s the daily chart … note the square root target of 56 lands right on the .382 retracement from the all time low. I like that … watch that 55-56 level.
Just another math thing … 90/1.618 = 56. Another reason to like the level.
Here’s the weekly 1/8th projection method …
55-56 sure seems like it’s key WHICH MEANS IF IT FAILS THEN WE GOT SOMETHING REALLY WRONG AT THE CIRCLE K.
B
Soybeans
Posted on October 10, 2015 Leave a Comment
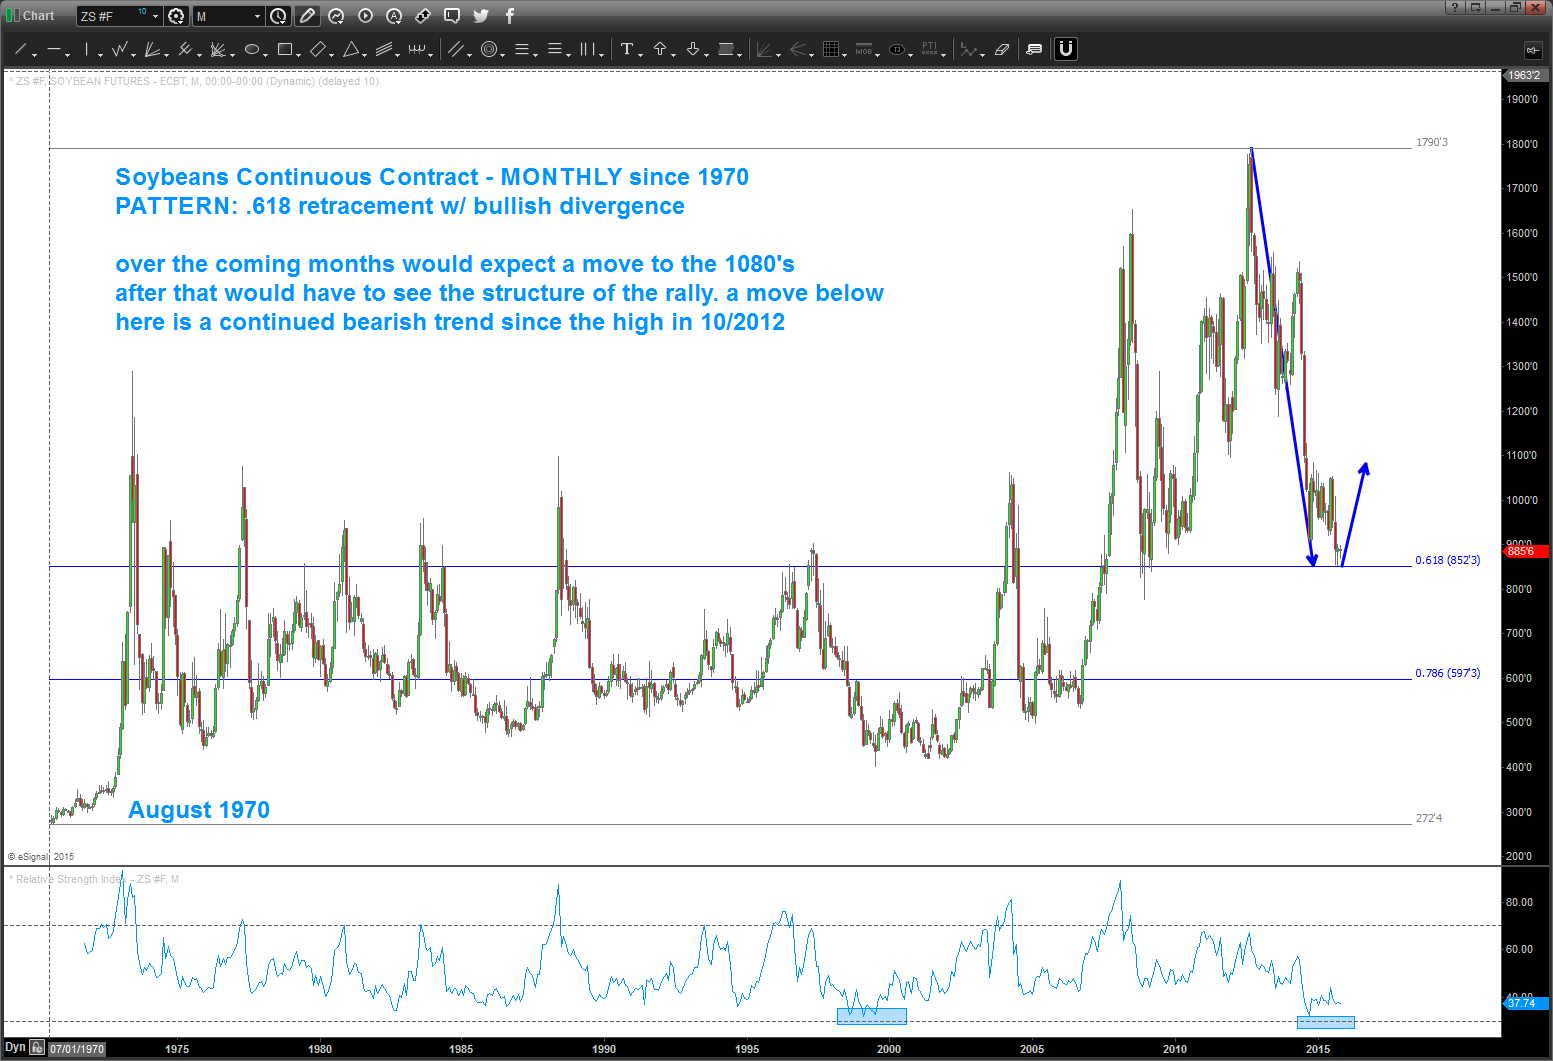 the target was lower than originally planned but it appears the node from August 1970 is holding.
I expect up from here.
Bart
SBUX and Coffee Prices …
Posted on October 10, 2015 1 Comment
one would think that IF the price of coffee is going up THEN it would have an impact on SBUX operations?
first chart – SBUX – candles and Coffee Futures – blue line
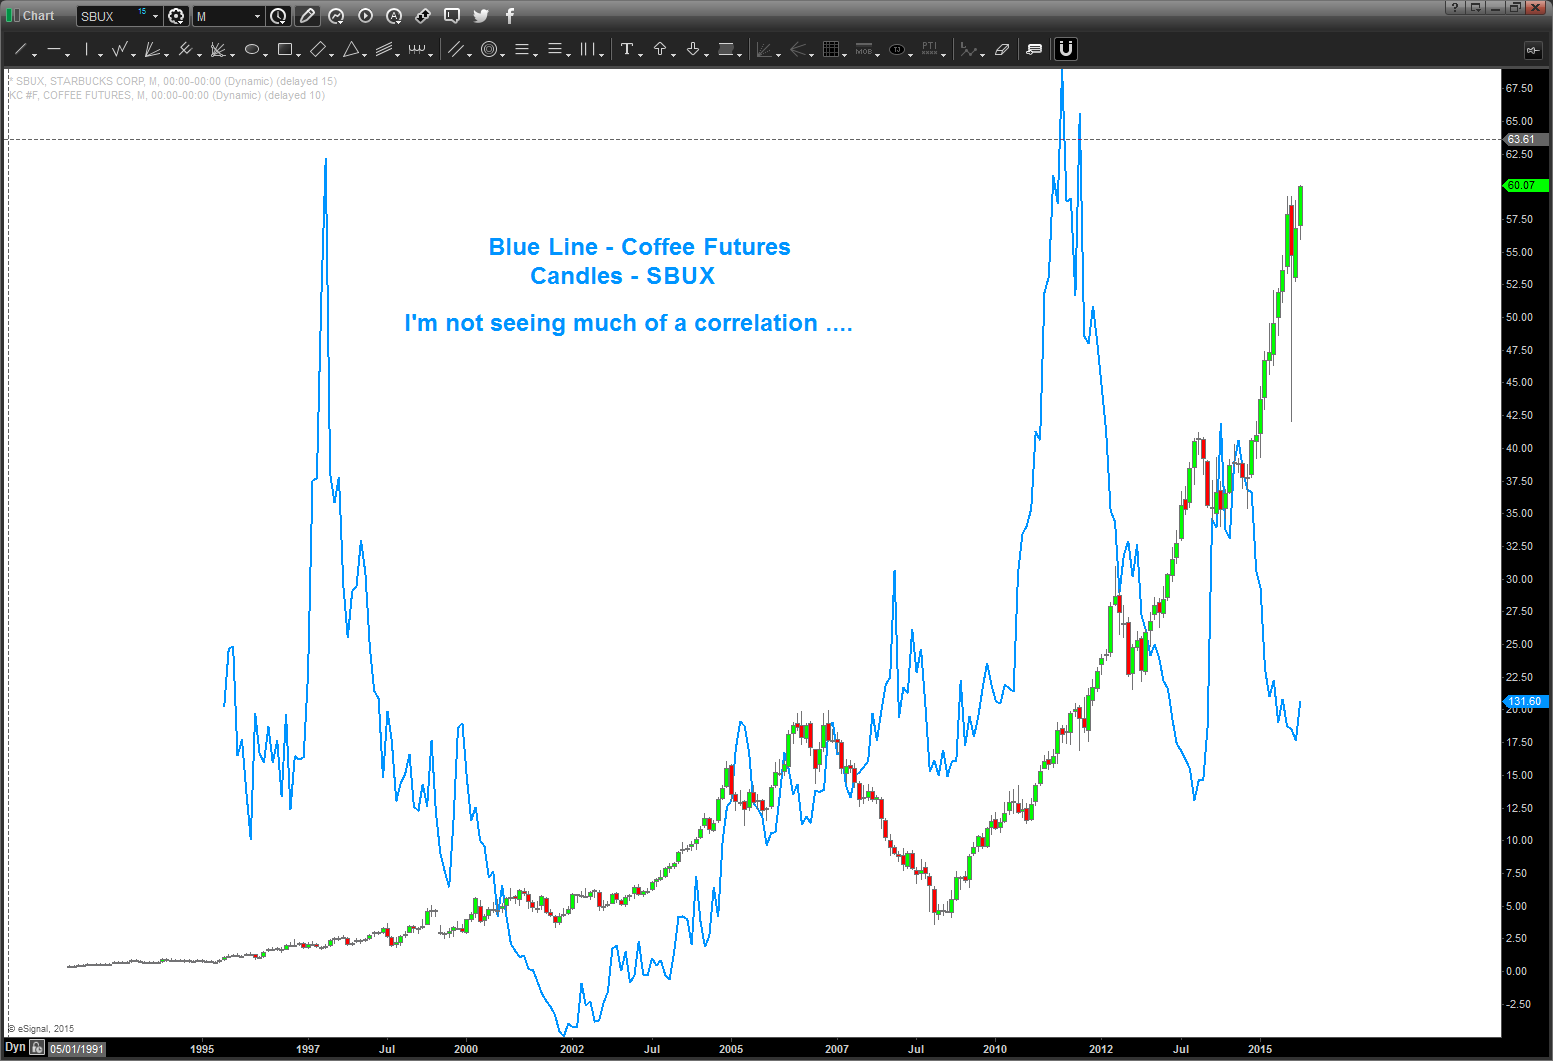
I don’t see much of a correlation …..
How about, SBUX RELATIVE STRENGTH COMPARED TO COFFEE FUTURES? THE RATIO OF SBUX/COFFEE?
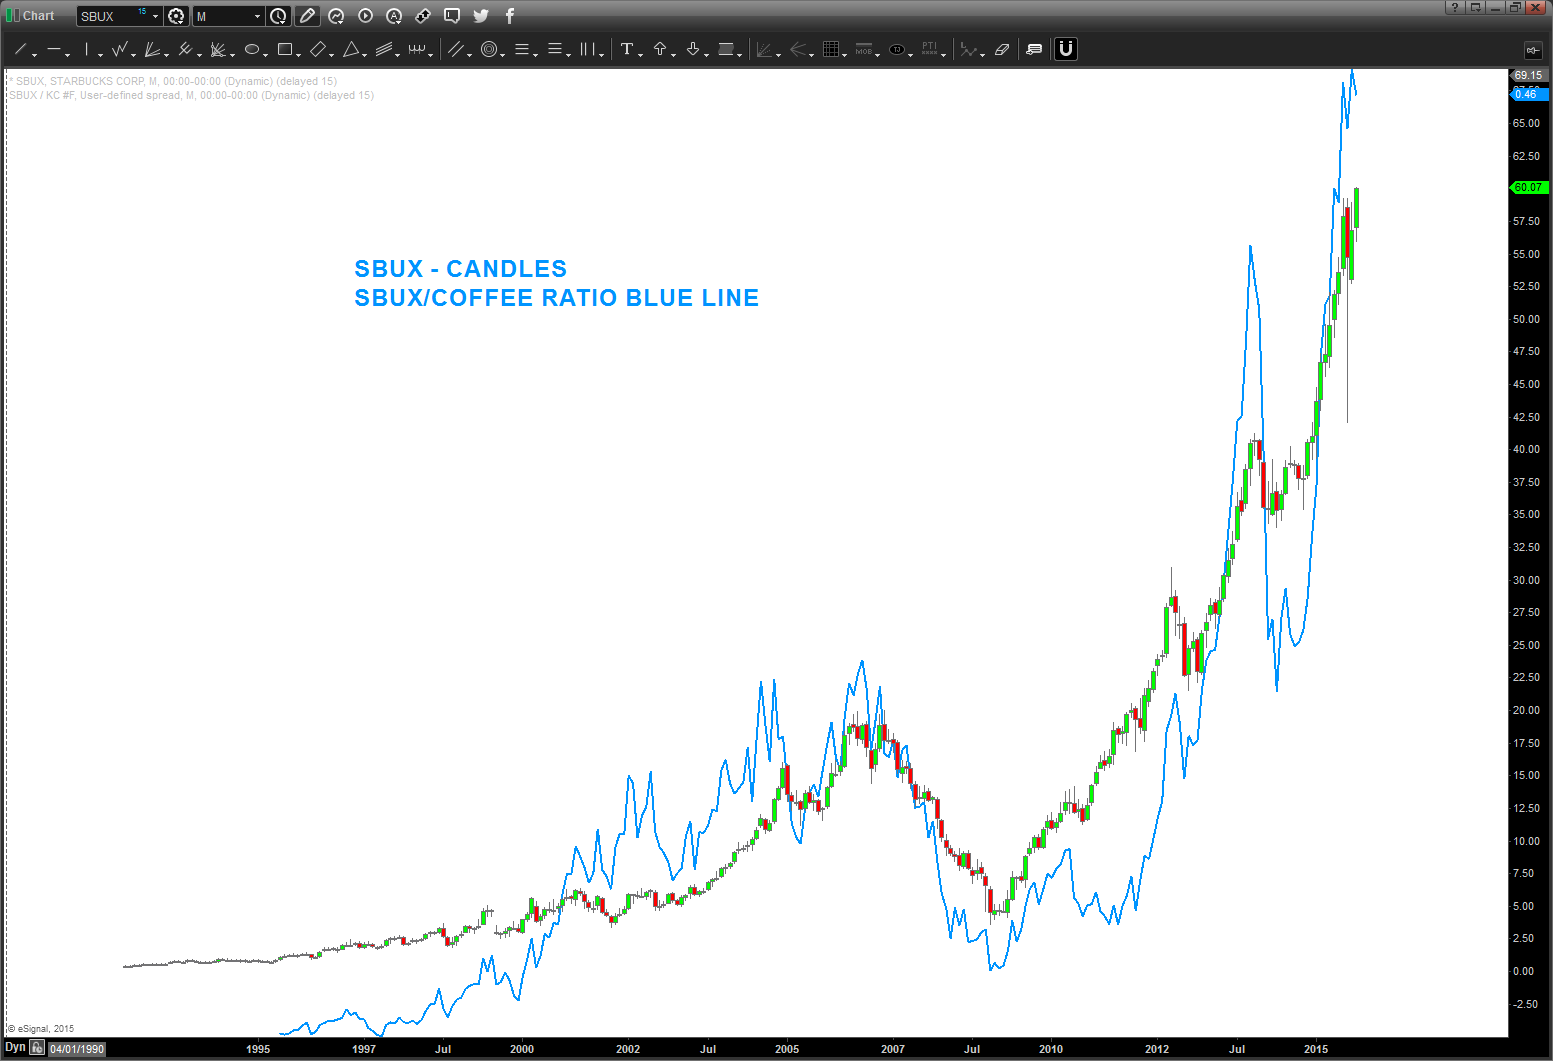
now, that is better … it’s not the price of coffee alone but the relative strength of SBUX versus the price of coffee – using ratio analysis we can see that this is what’s causes the movements in SBUX. SBUX/COFFEE is a good indicator to manage risk …
Is the ratio hitting some targets? Ummmm, yes.
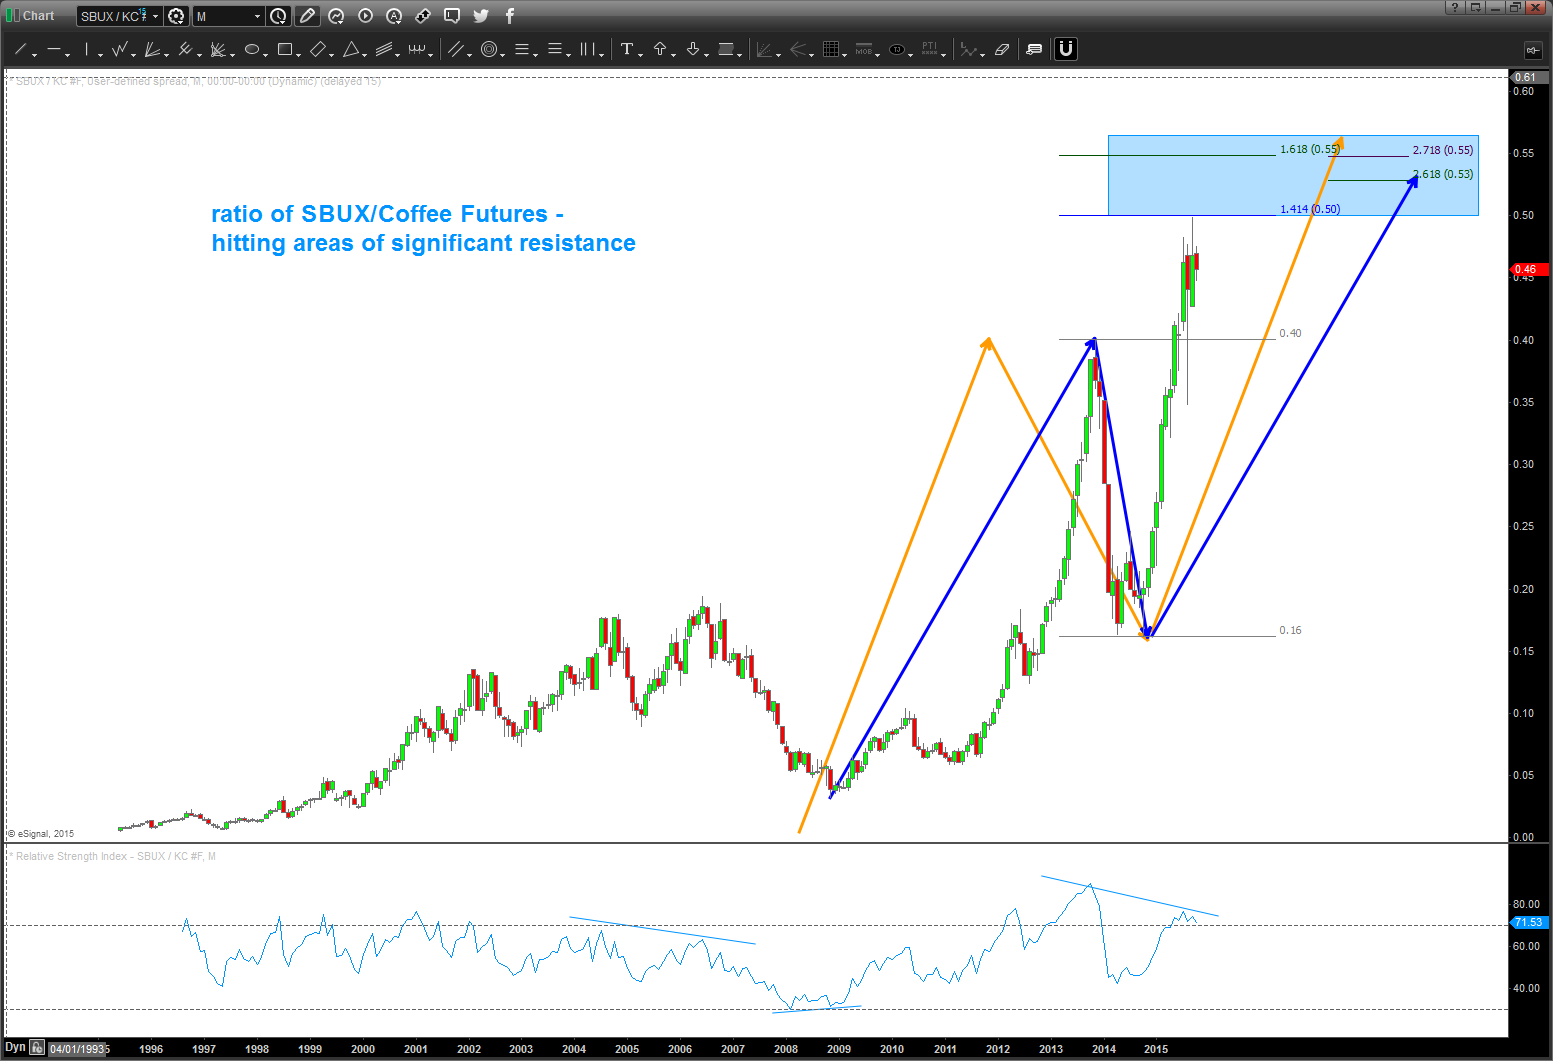
so, SBUX is taking off parabolically …this never ends well and we have some very strong targets coming in on the RATIO. Certainly keep an eye on this ratio as it’s pretty important to future directional moves in SBUX.
Bart
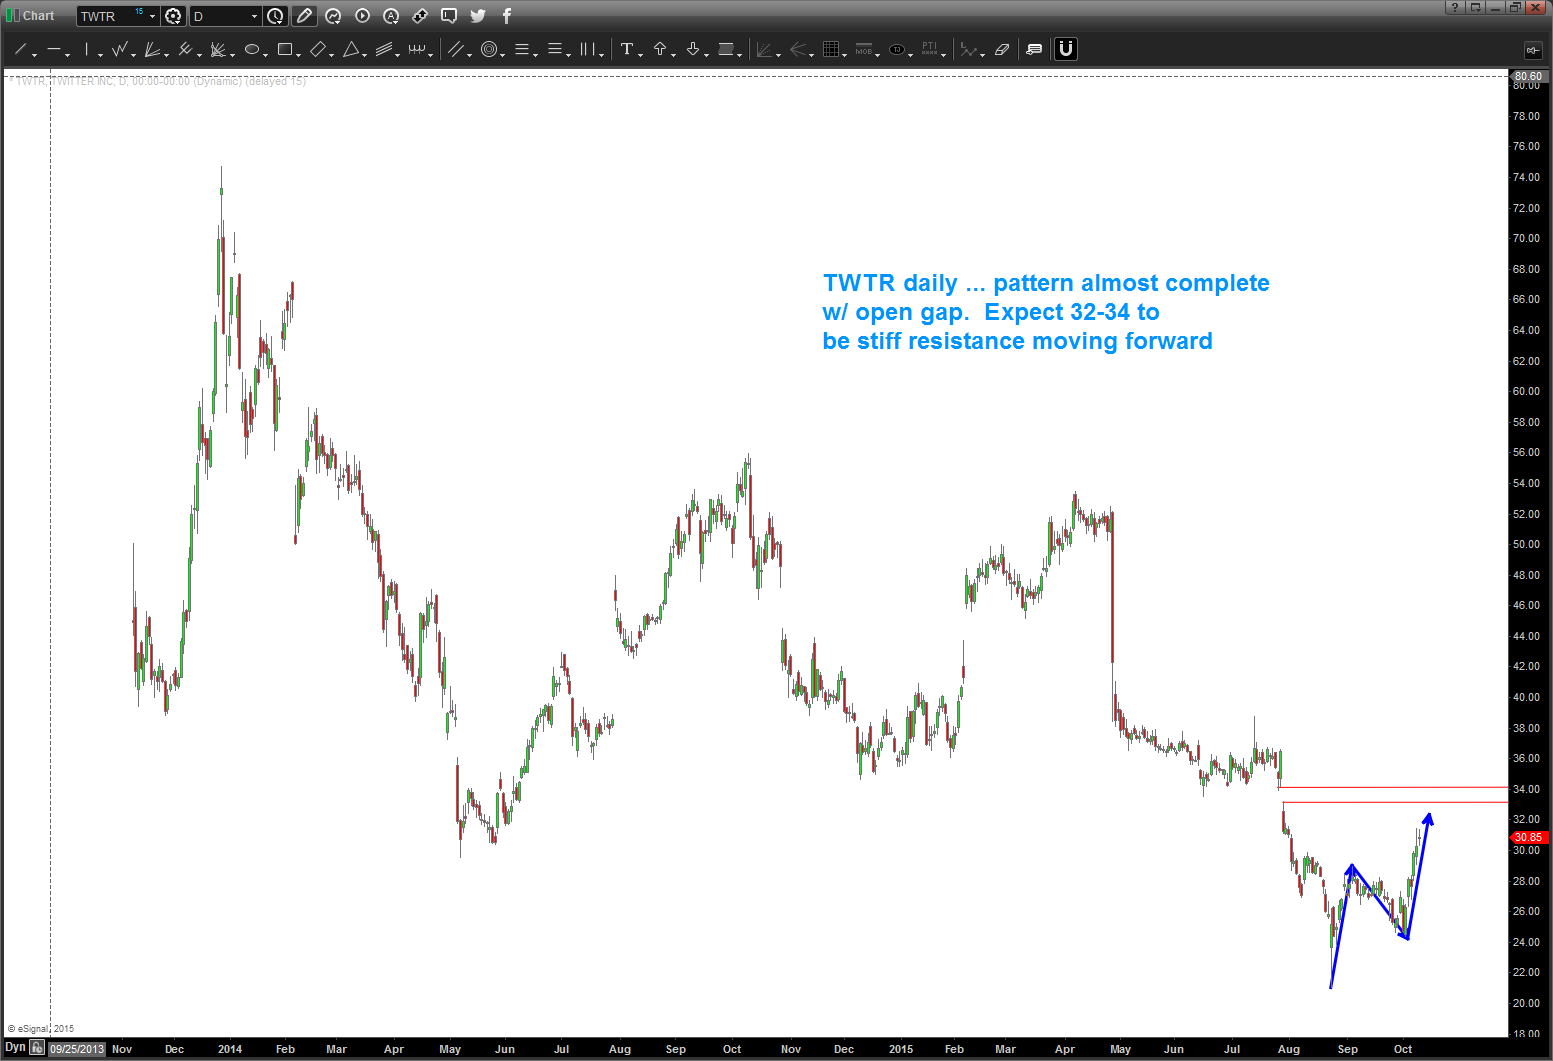
$TWTR update as of 10/10/2015
Posted on October 10, 2015 1 Comment
$TWTR to find significant resistance, if not continue downtrend in the 32-34 area.
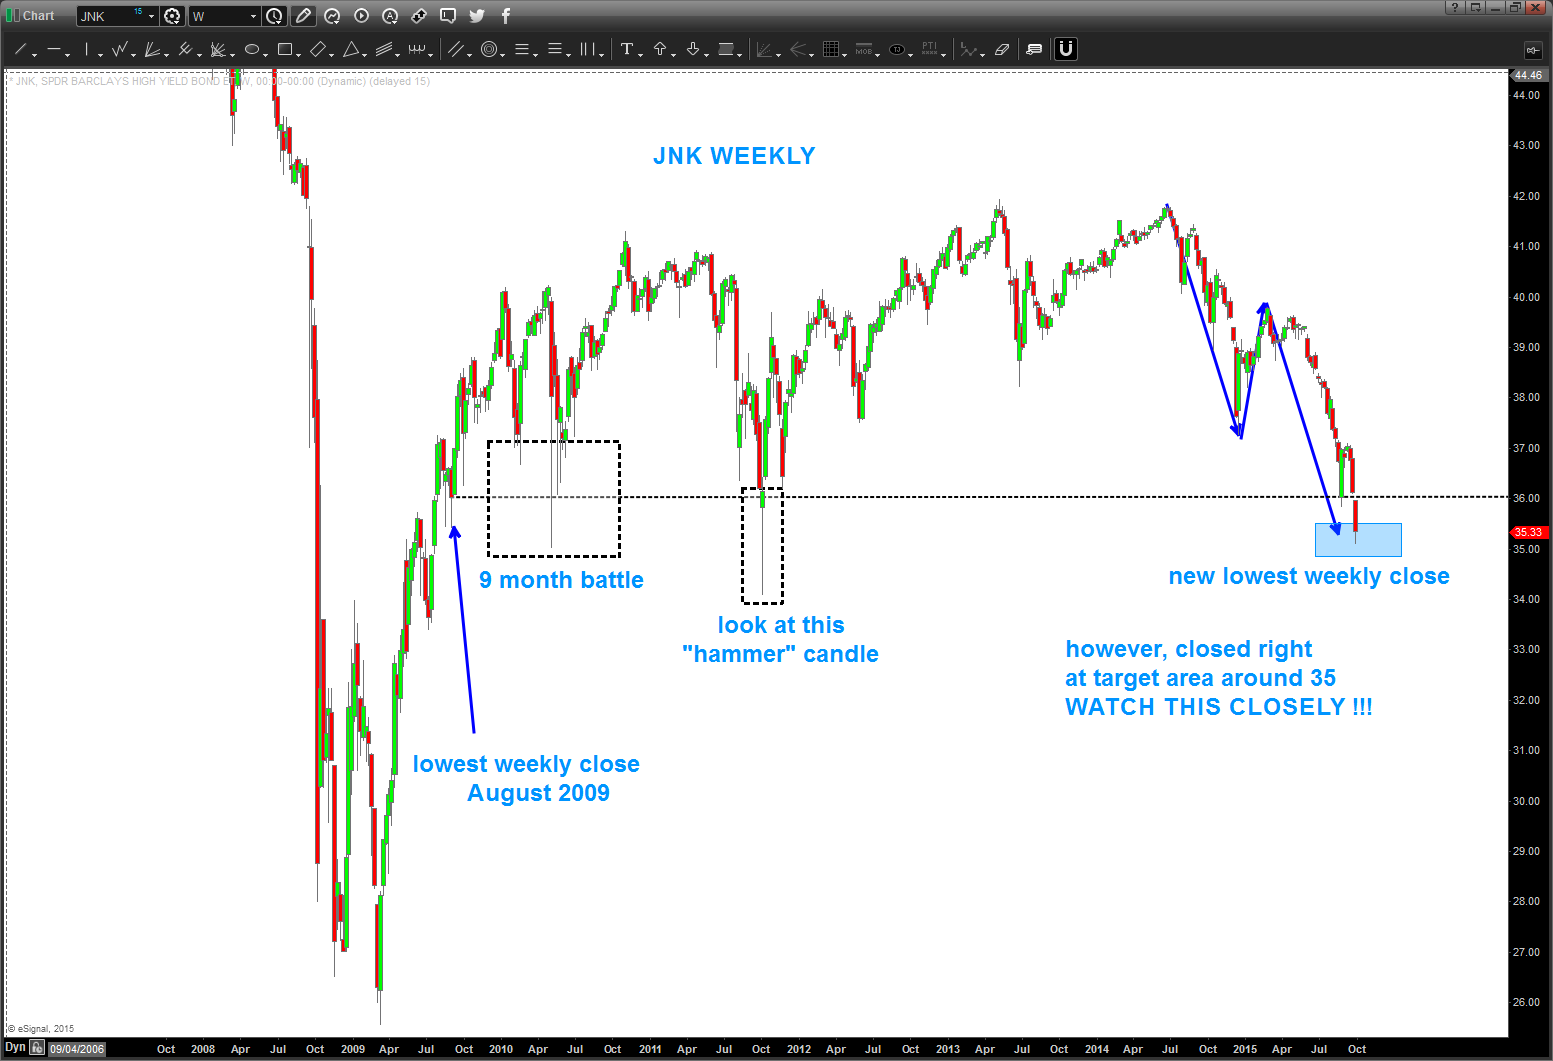
Junk Bonds …boom, right on the target area. K E Y !!
Posted on October 4, 2015 Leave a Comment
Junk Bonds … just think of em’ this way…risk investments and a yield play. in a volatile world, they aren’t so smart so institutions try to get out of them. keep it simple … note coming into the 2009 low they were crashing .. a nice bounce and then meandered around into June 2014 then started to crack. Most recent price action has seen some heavy selling pressure w/ the first noticeable gap down occurring last week AND (this is important) the lowest weekly close since August 2009.
Note the dashed black boxes .. those were all attempts at trying to get below but were defeated. What’s the positive spin? Well, as you can see from the first chart below this level (35) was ID as a pattern and it hit and held for now. Why for now? Well a gap down and some “selling candles” make it probable that we could lose this level to the downside. HOWEVER, if history is our guide, their has been a snap back rally since 2009 each time this level was defeated .. so, watch for strength! a small, dead count bounce isn’t good and will tell us if something is a foot at the circle K so to speak ….
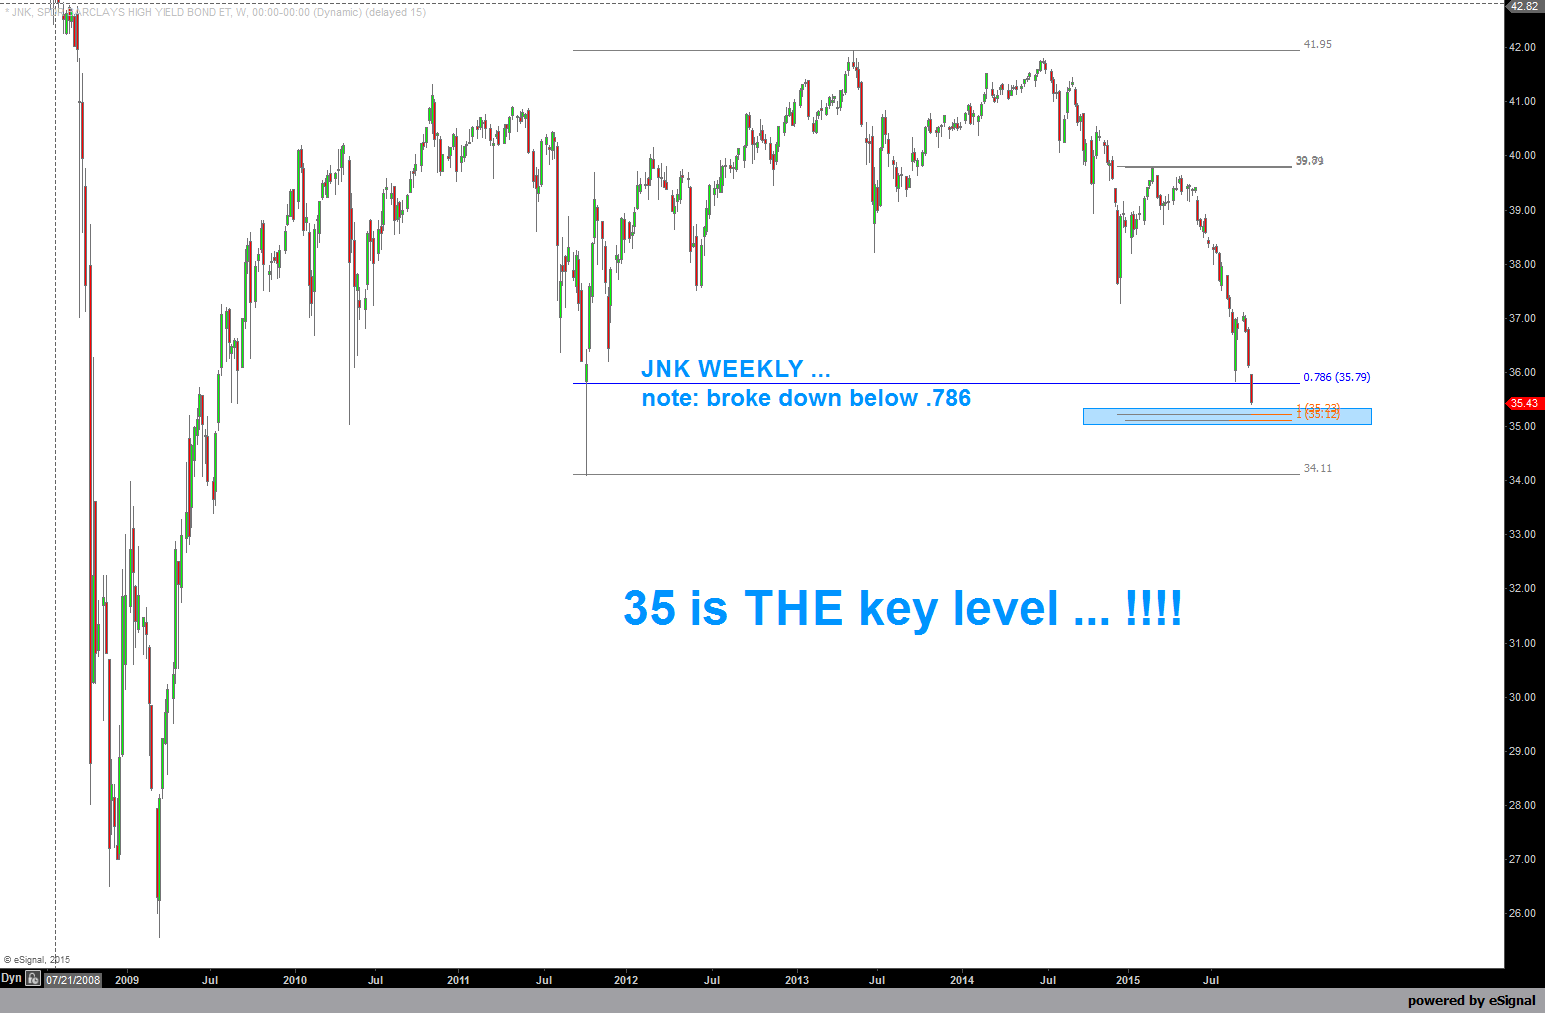
Here is JNK as of Sunday night … over the coming days, expecially Tuesday, monitor this pattern closely for a directional bias and a “risk on” vs “risk off” appetite w/ regard to volatility.
Hope your having a good end to your weekend.
Bart
