if you want to know what’s going to happen, read this post.
Posted on September 16, 2015 Leave a Comment
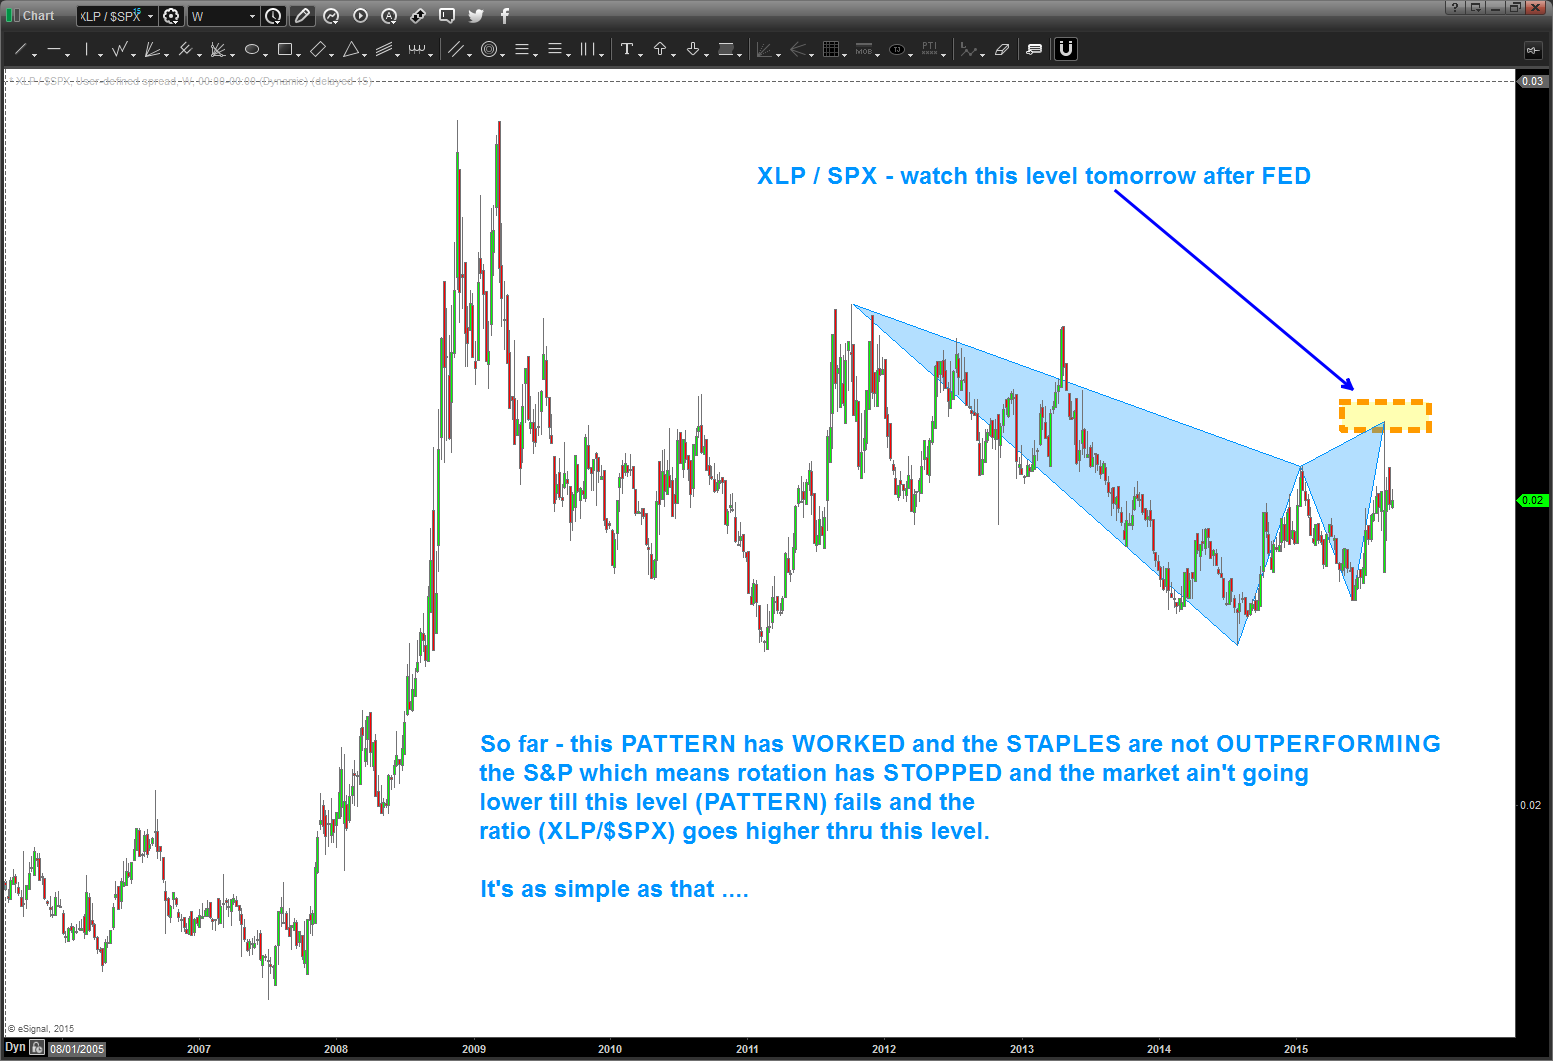
so many people are talking about the FED … who cares, really. I have no idea how they set rates, no idea of PPI and CPI and no idea about any of the fundamentals. nope .. I just know patterns and when combined w/ ratio analysis I don’t need anything else.
this is an update of a post that I put out on 8/26/2015
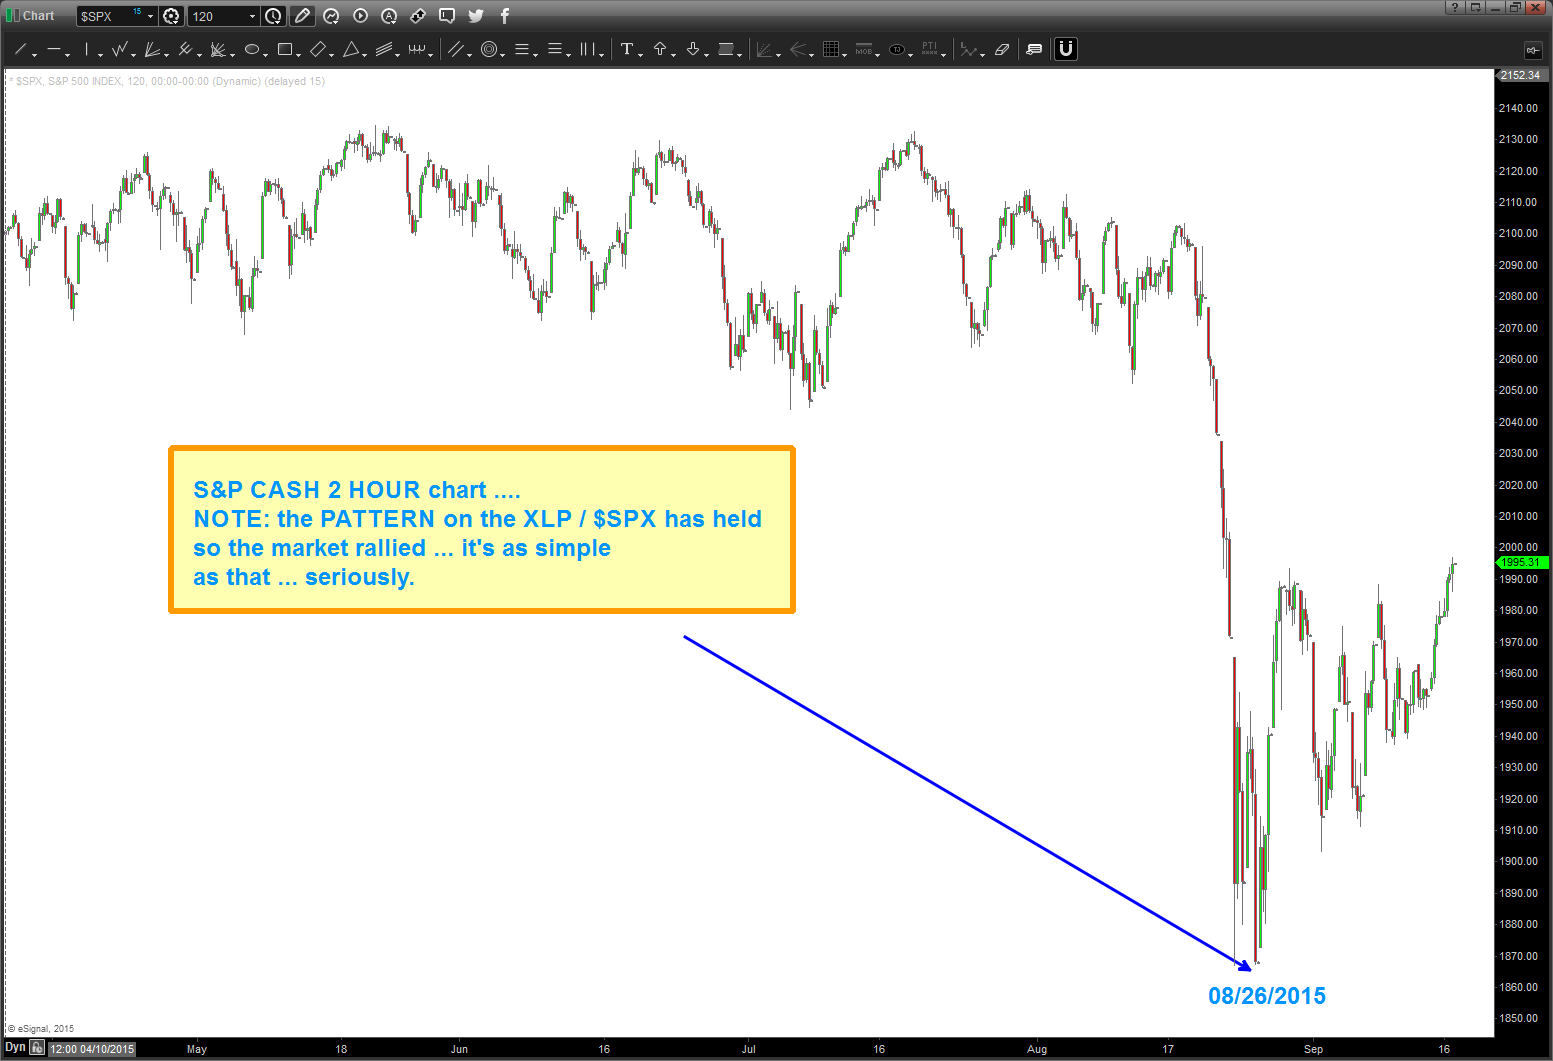
As people were jumping up and down saying CRASH and saying BUY this pullback I was simply looking at patterns. This beautiful SELL pattern worked – perfectly. In the ratio analysis – when the chart goes up the Staples are outperforming which means – institutional rotation out of risk and into, well, staples.
here’s the updated chart as of the close today – it hasn’t sold off tons but it certainly hasn’t closed above this level …
so, in the world of ‘if-then’ lets work thru this …
IF the ratio closes (daily) above the SELL PATTERN then the market is going lower, potentially much lower.
IF the PATTERN holds and the ratio stays below the PATTERN level THEN the market isn’t in chaos mode …
it’s that simple, folks.
if you want, search the site for ratio analysis .. it works and the key is it really gives you a feeling for how the big boys are moving the money around … this move isn’t about “Mom and Pops” folks, it’s about institutional money flow …
we’ve done this before but here it is again:
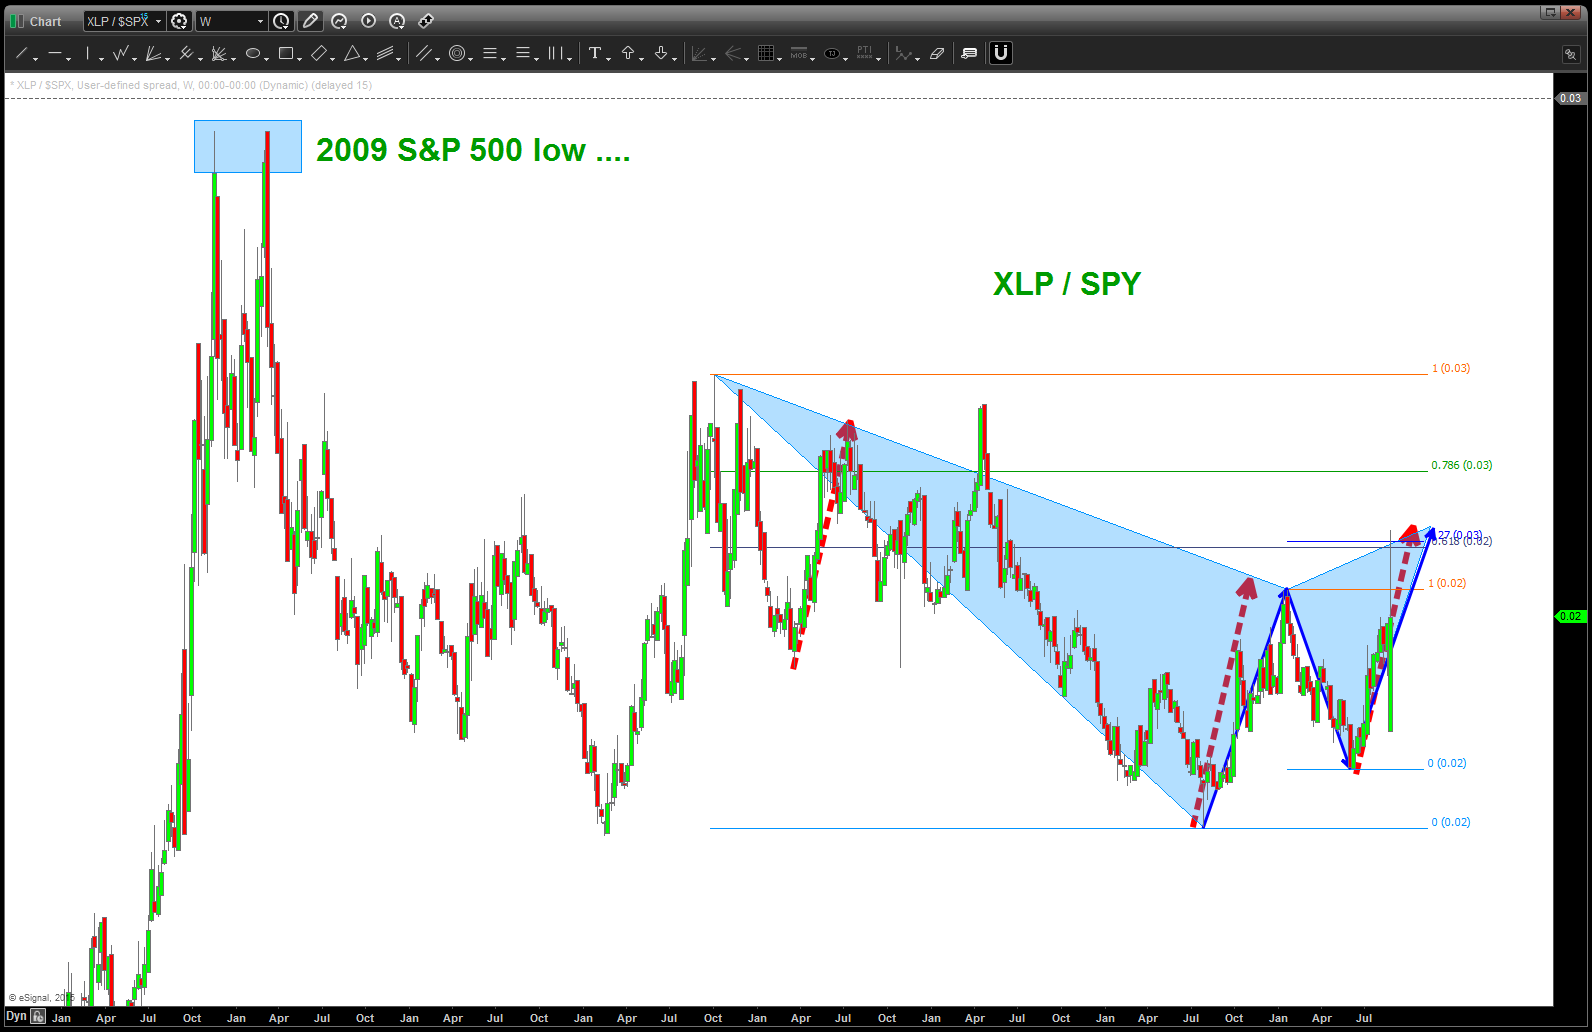
- if volatility rises XLP (staples) outperforms the overall market
- when volatility goes away rotation out of XLP occurs.
today’s move to be expected … a monster SELL of the XLP/SPX ratio occurred.
now, the key will be this level and what happens in around it in the next few days.
B
Trend lines ….the real way
Posted on September 16, 2015 Leave a Comment
If you want to draw “real” trend lines then it’s imperative you have a good place to start …
the key w/ trend lines is “LINING THEM UP W/ THE PLANE OF THE CHART .. the chart doesn’t go just UP and DOWN. It goes according to vector math w/ an X/Y (it also has a Z component but that’s another post) component.
below is the LONG TERM GBP chart … note the dashed blue line. that move will define the geometry of only two more trend lines. a 90 degree and 45 degree angle.
next, you’ll see red “rays” drawn w/ only 90 and 45 degrees. Look at the price action around these lines …
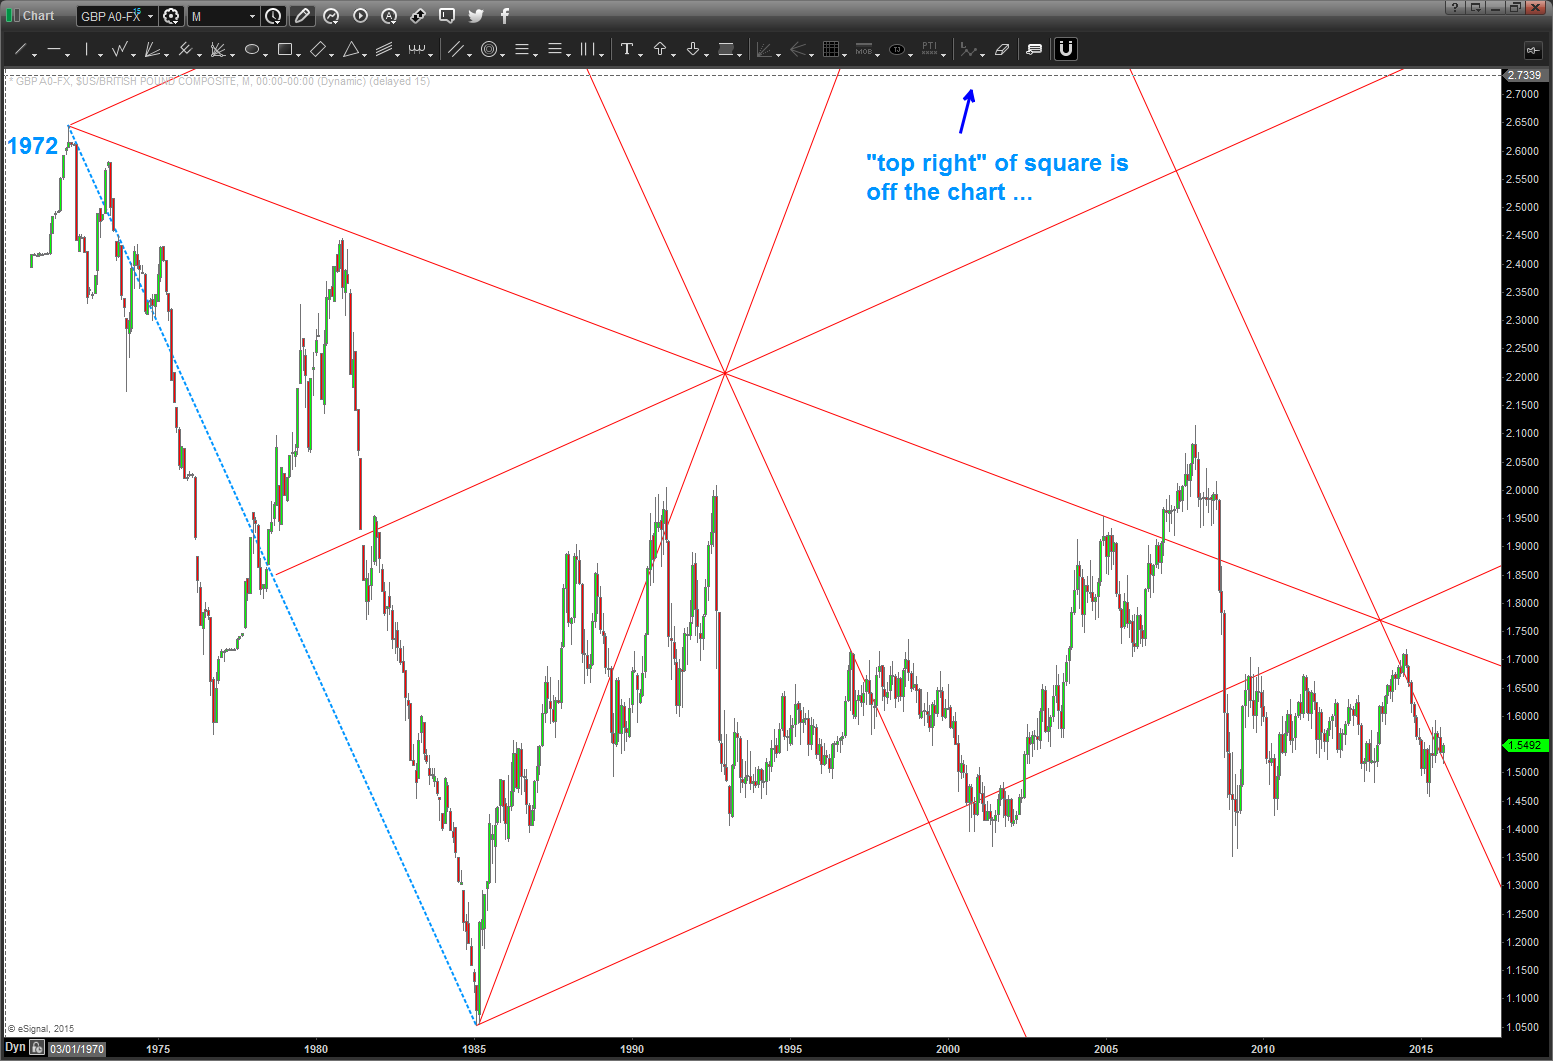
now it’s just a matter of drawing more squares …note the highlighted area. That’s where I wanted to focus but in order to do that I had to go WAY BEYOND the SIDES and TOPS AND BOTTOMS to draw the real trendlines .. once I found at point which “found” the support and resistance area since 2009 I now have a clue of the IMPORTANCE of this area and can/will develop a gameplan around it ..
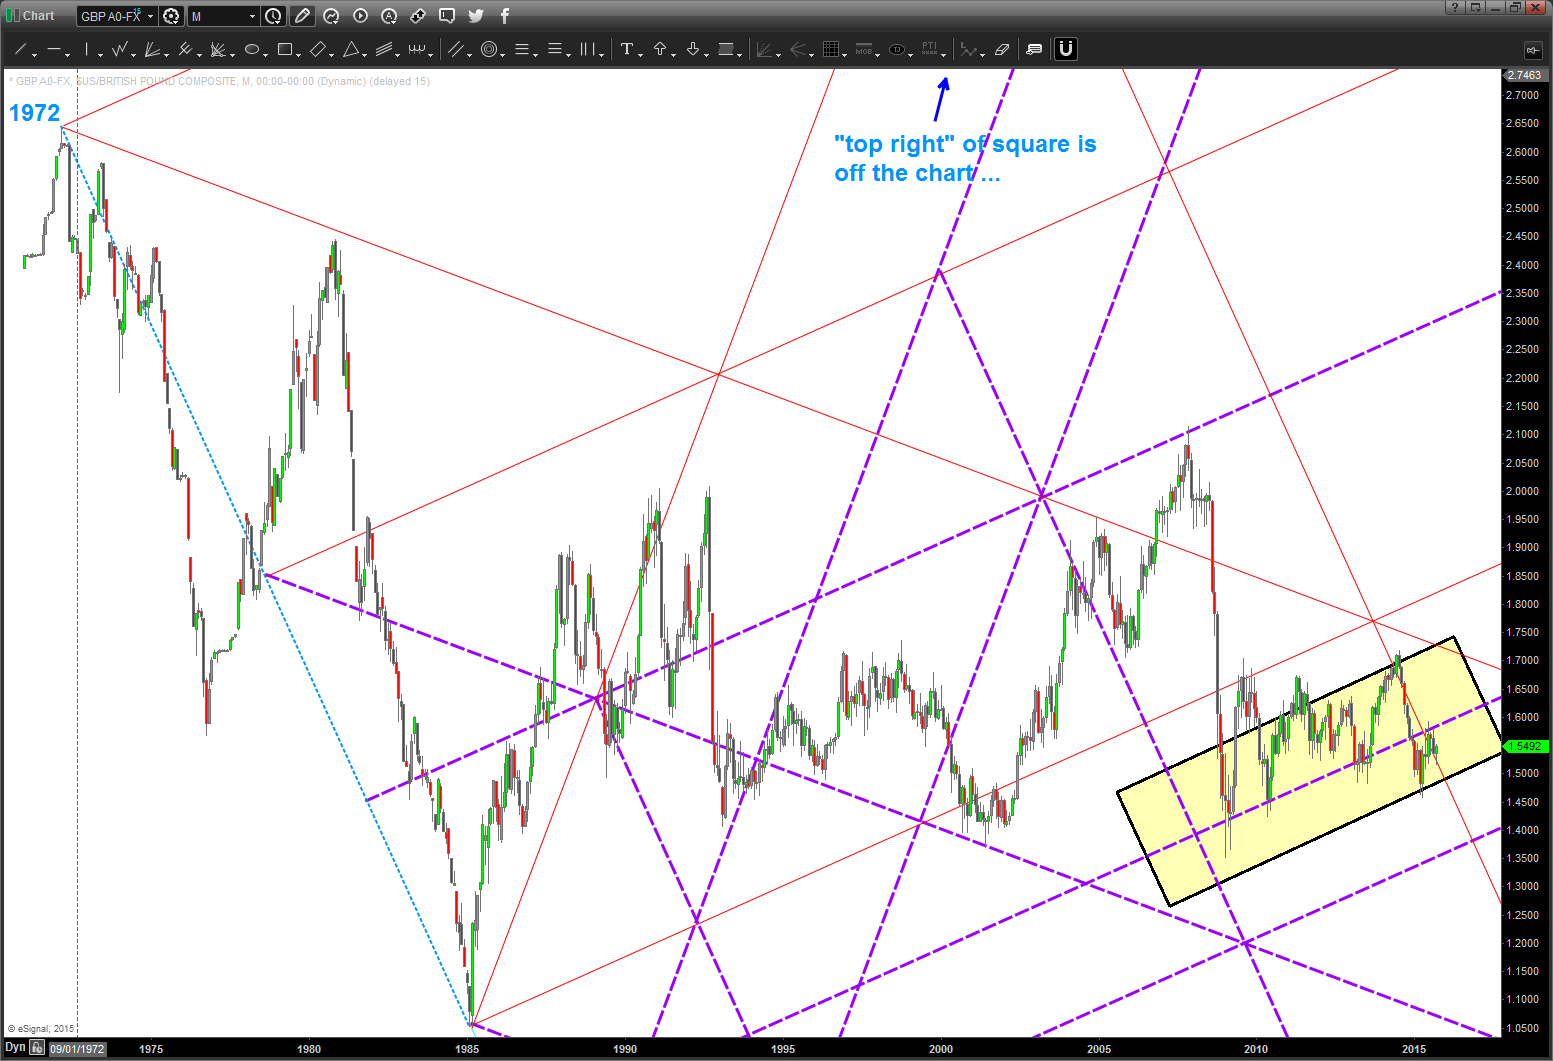
why squares? why not?

let’s have some fun tomorrow and rock and roll ….
Bart
Aussie vs USD updated as of 09/16
Posted on September 16, 2015 Leave a Comment
09/16/2015 – thus far, the AUSSIE vs USD has gained roughly 300+pips. We’re close (depending on Friday) to putting in a weekly Signal Reversal Candle. It’s where the HIGH of the LOW candle (weekly) is taken out by price.
w/ the FED meeting tomorrow, expect volatility to come into play and will be looking to BUY AUSSIE vs USD after the show/games tomorrow and, hopefully, w/ a nice pullback.
The pullback from 7070 was the day of the KIWI rate cut and w/ that much thrust into a level I elected to pass. Nothing has excited me thus far …so still waiting.
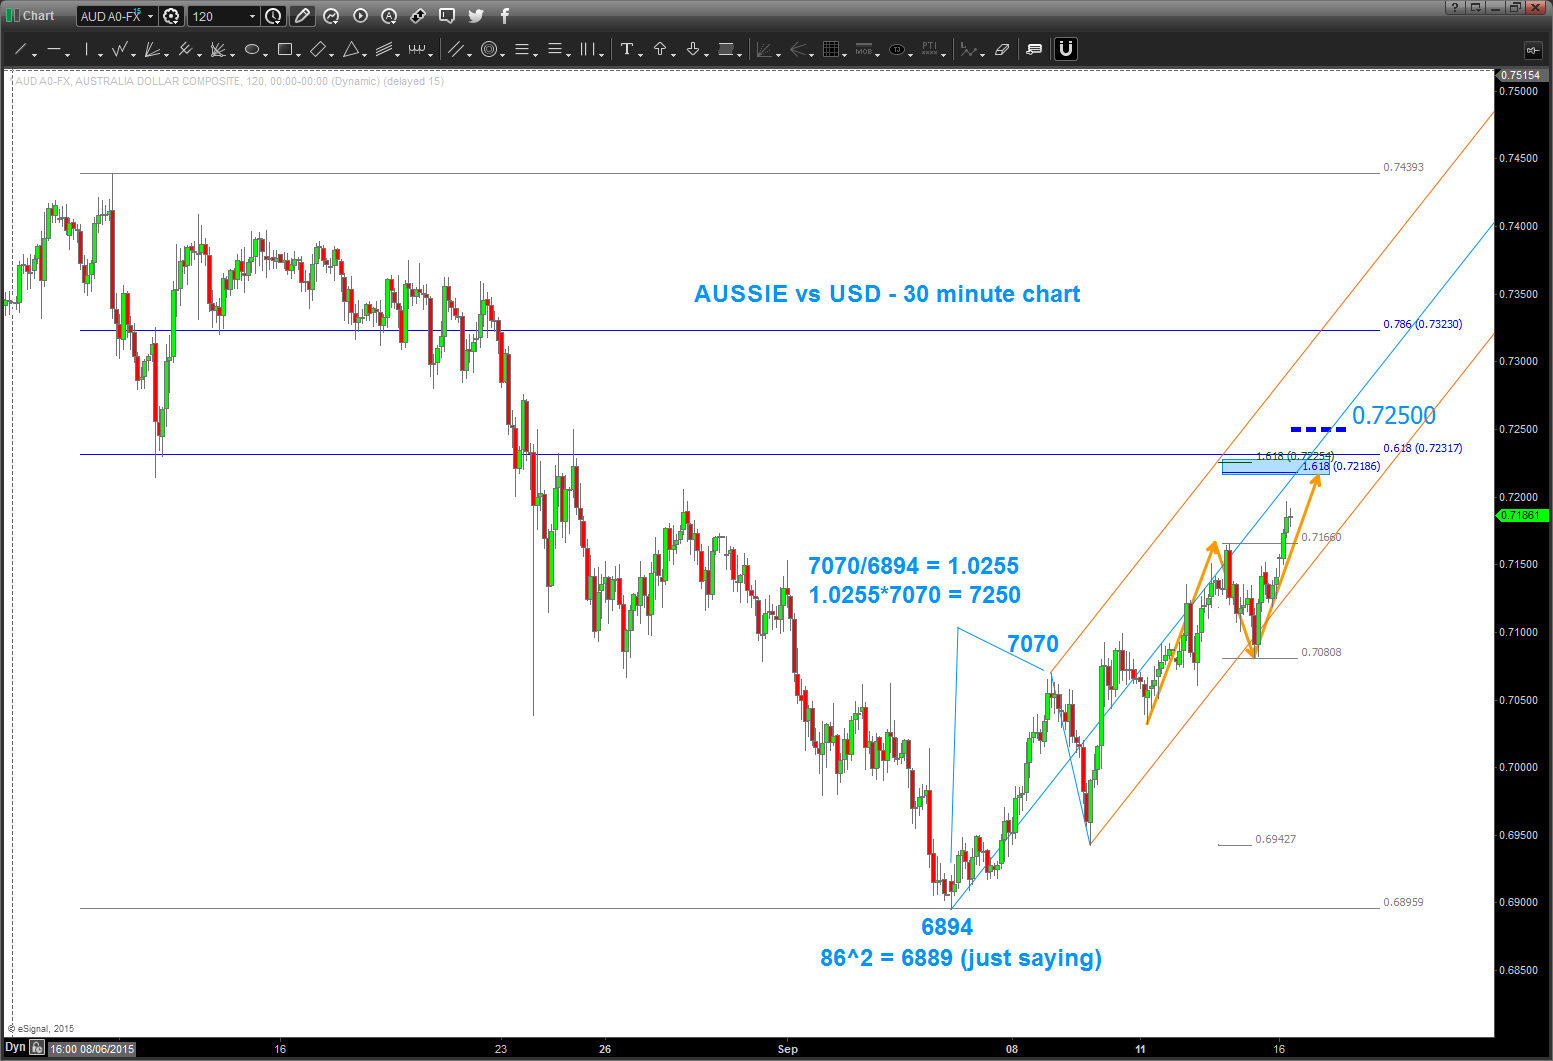
AUD vs USD 30 minute chart
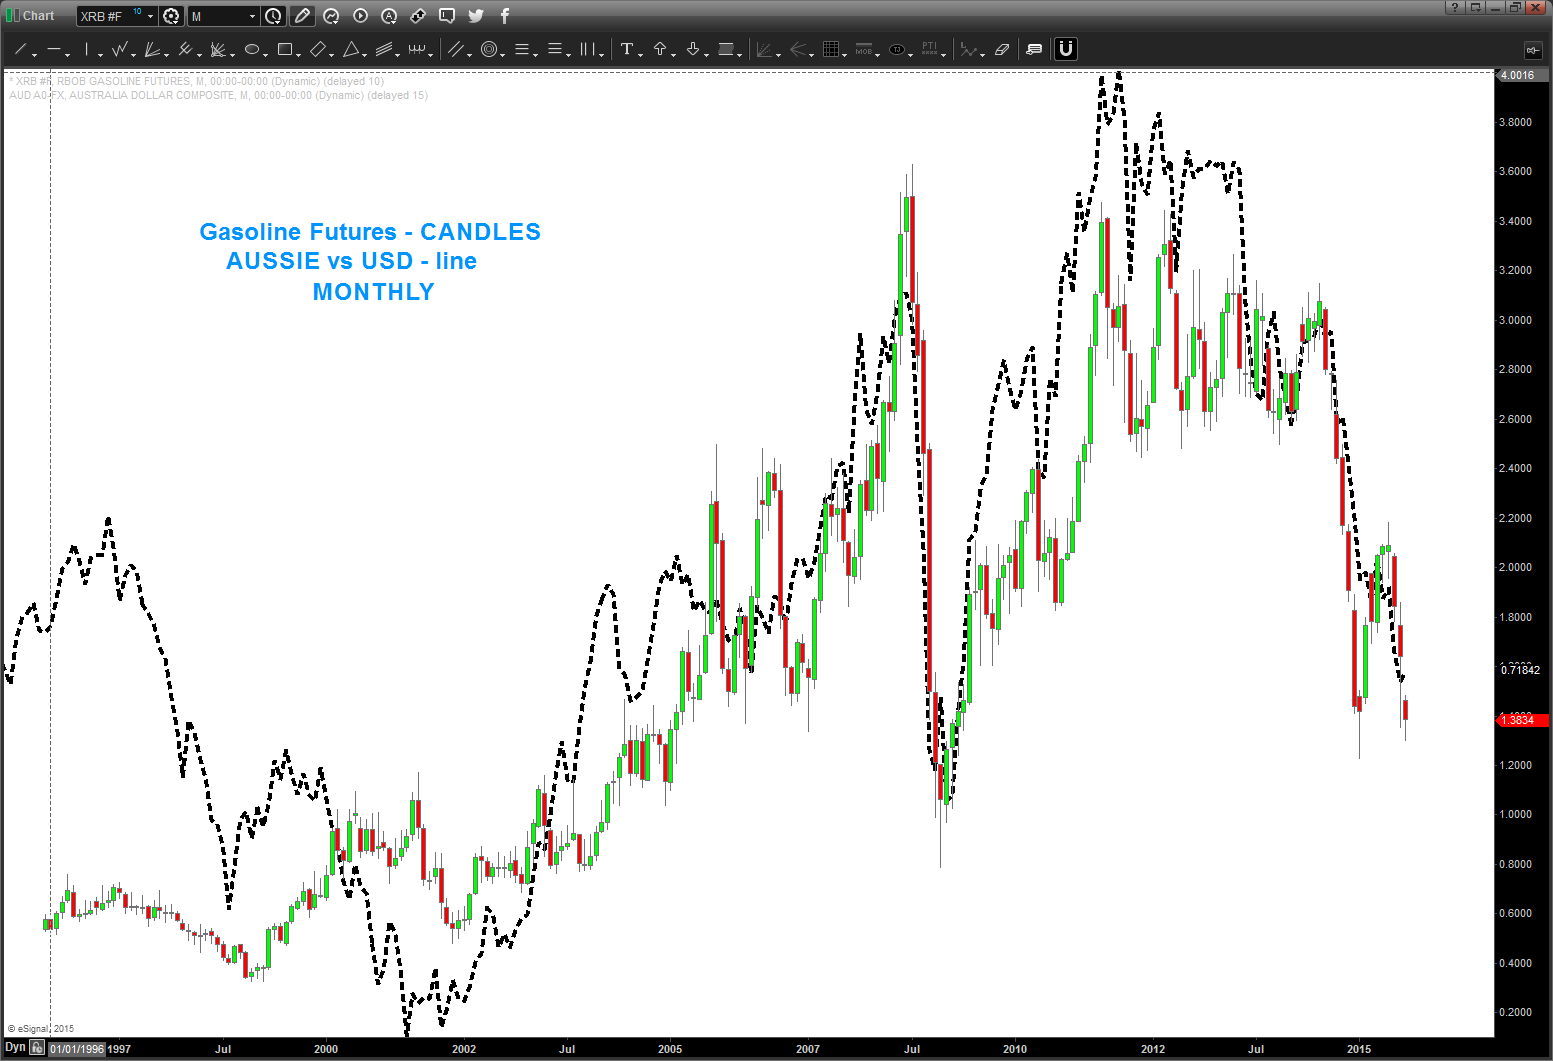
take a look at this picture of Gasoline Continuous Futures – MONTHLY and the PATTERN, long term trend line and most oversold in the history of my price data ….looks like a bottom is forming or close to forming. Either way, the AUSSIE and Gasoline Futures are aligned well. Could be a big move coming …
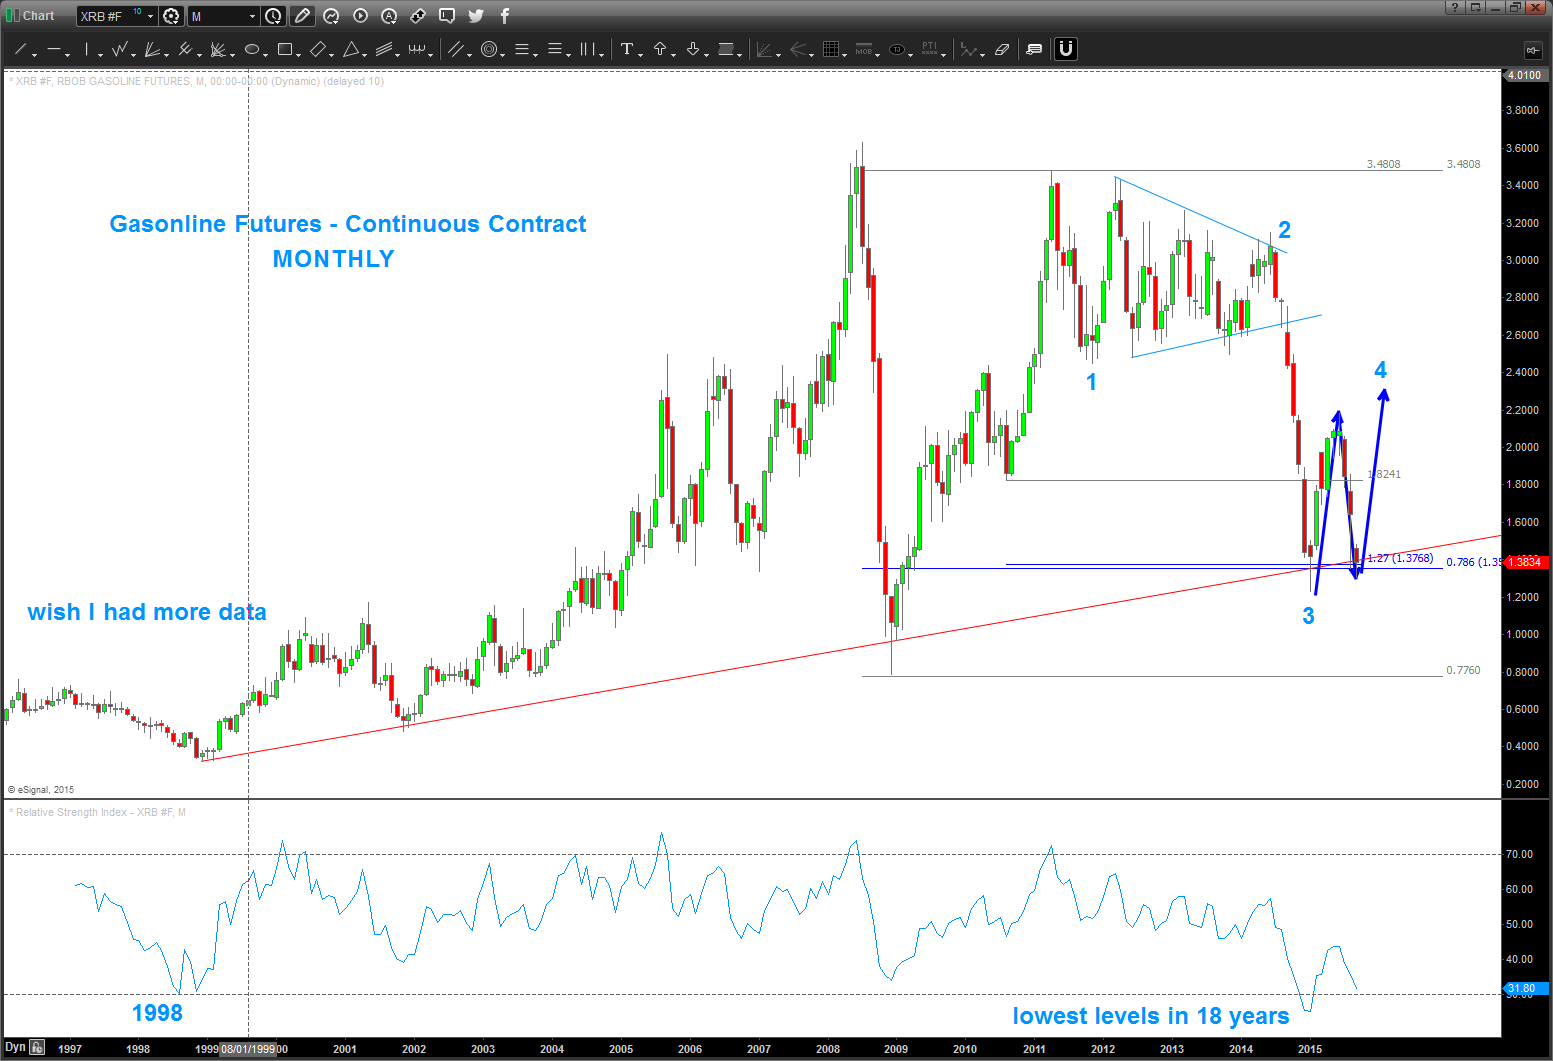
here’s the AUSSIE vs USD w/ the Gasoline Futures:
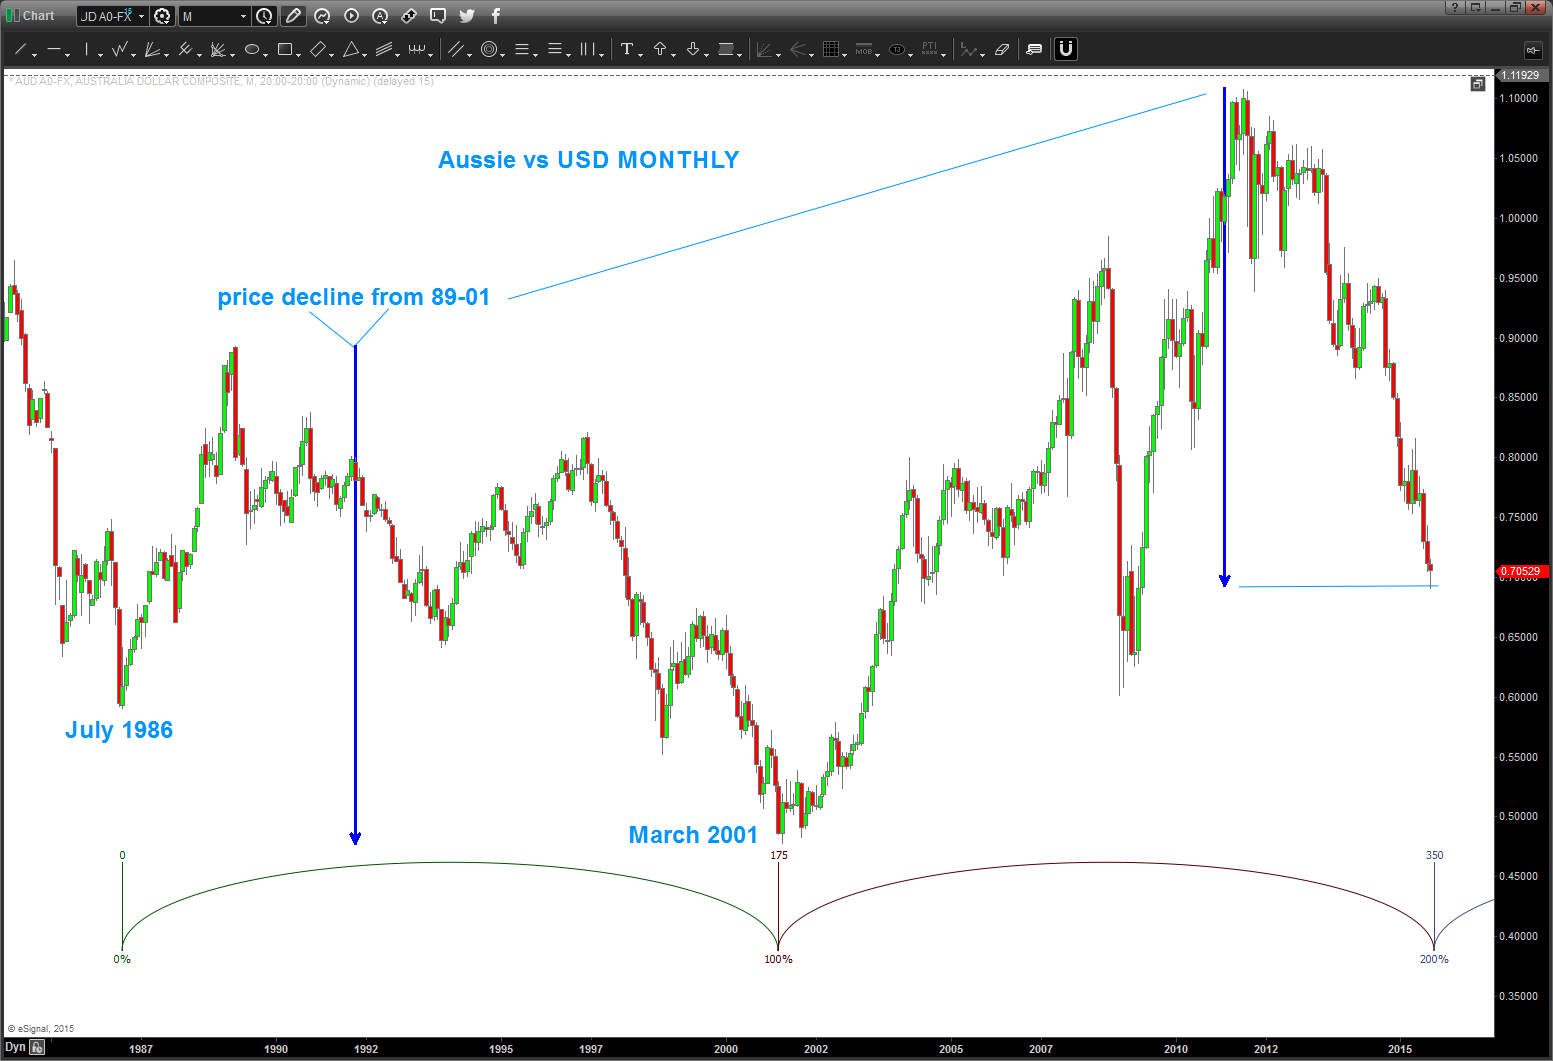
09/08/2015 – my target area/zone got crunched pretty bad, and my count is wrong. all that being said, I didn’t take into account the measured move from 89-01. quite frankly, w/ all that ‘stuff’ coming into the areas as shown below I didn’t think it could. So the age old adage of “thinking” versus “seeing” left my target thumped. W/ so much thrust and momentum going I did not take the long trade but have been waiting …
but, as of last night it has give us a DAILY SRC and when I went back and erased everything I saw a monster cycle coming in and the measured move hit perfectly …hmmm.
how to play ? WAIT for a PATTERN to appear on perhaps a 60 minute chart .. watch gasoline futures and crude and the All Ordinaries for a sign of life and also the Chinese market …
here’s the updated chart:
will update (real time) the play here and the risk and the real time move of a dude in his home juggling dynamite w/ gorilla’s in a cage .. cool hugh?
Bart
Folks, back in October the post below the two dash lines was searching for a low to be in place on the AUD. The form and proportion were just about right. However, w/ the big move in crude, the interest rate extravaganza and the a whole host of other fundamental reasons the real issue is the PATTERN level didn’t work … it went approximately 300 pips below. HOWEVER, the overall thesis that the Aussie is bottoming versus the dollar still holds true. It’s showing some nice strength tonight …would love to get a very nice pullback to go long in/around these levels.
Updated charts below:
Note the monthly RSI levels … the BIG MOVES UP occurred right where we are sitting. Also, a case can be made that 4 is complete and we are going to new highs …
last time I checked the Aussie wasn’t part of the US Dollar index … so, watch this one closely. At a minimum we are completing/completed an A and a nice B wave up is to occur.
let’s just get on the right side of the trade and right now that looks like bullish entry for the AUD vs USD.
The Aussie has been correcting for a while and, folks, the move down from 1.100 ish certainly appears to be corrective. What does that mean? We are “at” or “near the beginning of a multi year advance that will take out the high July 2011. Here’s the monthly picture …
TILT … everyone is talking about US Dollar strength – yes, but they are talking about the dollar index which the Aussie isn’t even a part of it. Or if it is the weight is negligible so in this case we have to take this pair as a single entity – not a weighted index.
here’s the weekly:
note the 3 waves down … that is the key. it was not a 5 wave movement. has this correction been complex – yes. But it’s falling right in line w/ a double three labeled w,x,y.
and, the daily, shown below, just completed 5 waves down. While it would be perfect symmetrical three drives to a bottom is we go down and attack 8400 – there is a good case to be made that a low is in place. we’ll have to wait for an intraday pattern to appear …
and finally, we’ll see the move down on a 60 minute chart is a clearly defined 5 waves.
so … there ya have it.
what to do? Well, our thesis is we are beginning a multi year move to take out the old highs from 2011. IF THAT IS CORRECT THEN WE ARE IN the first stages of the advance. the first move up (wave 1) will complete and then wave 2 will come and, more than likely, w/ a vengeance because everyone thinks the “old trend” is in play. That’s the BUYING OPPORTUNITY and price should never go below the low that was formed last week.
stay tuned …get ready to rumble.
Bart
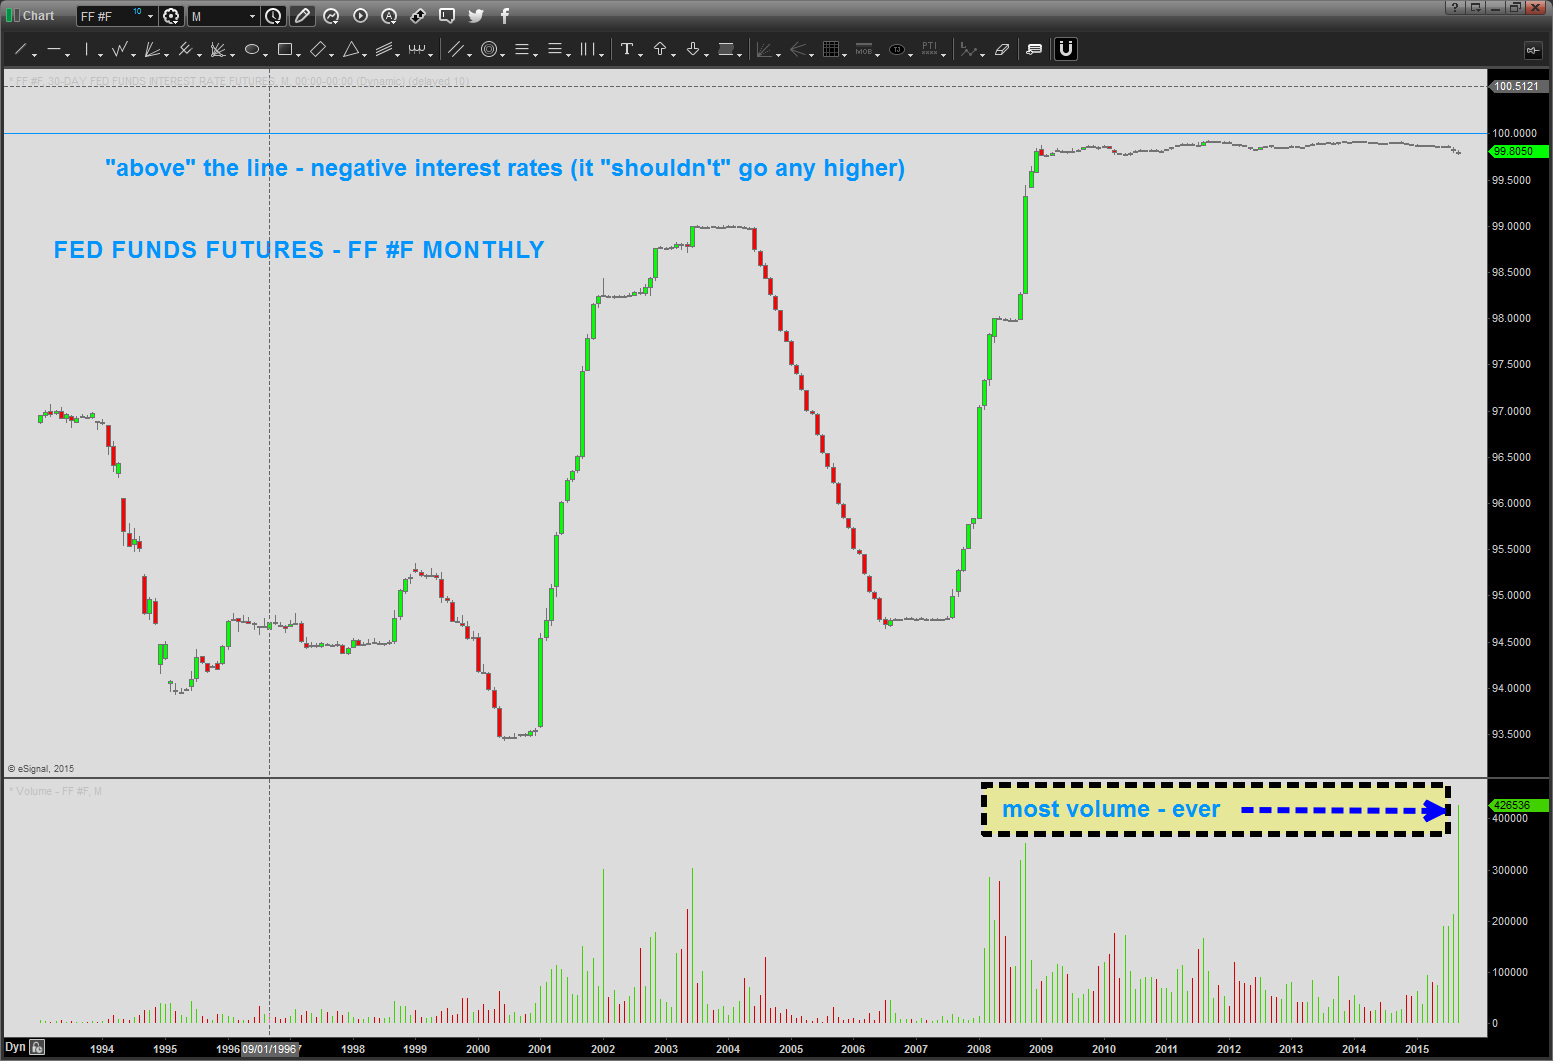
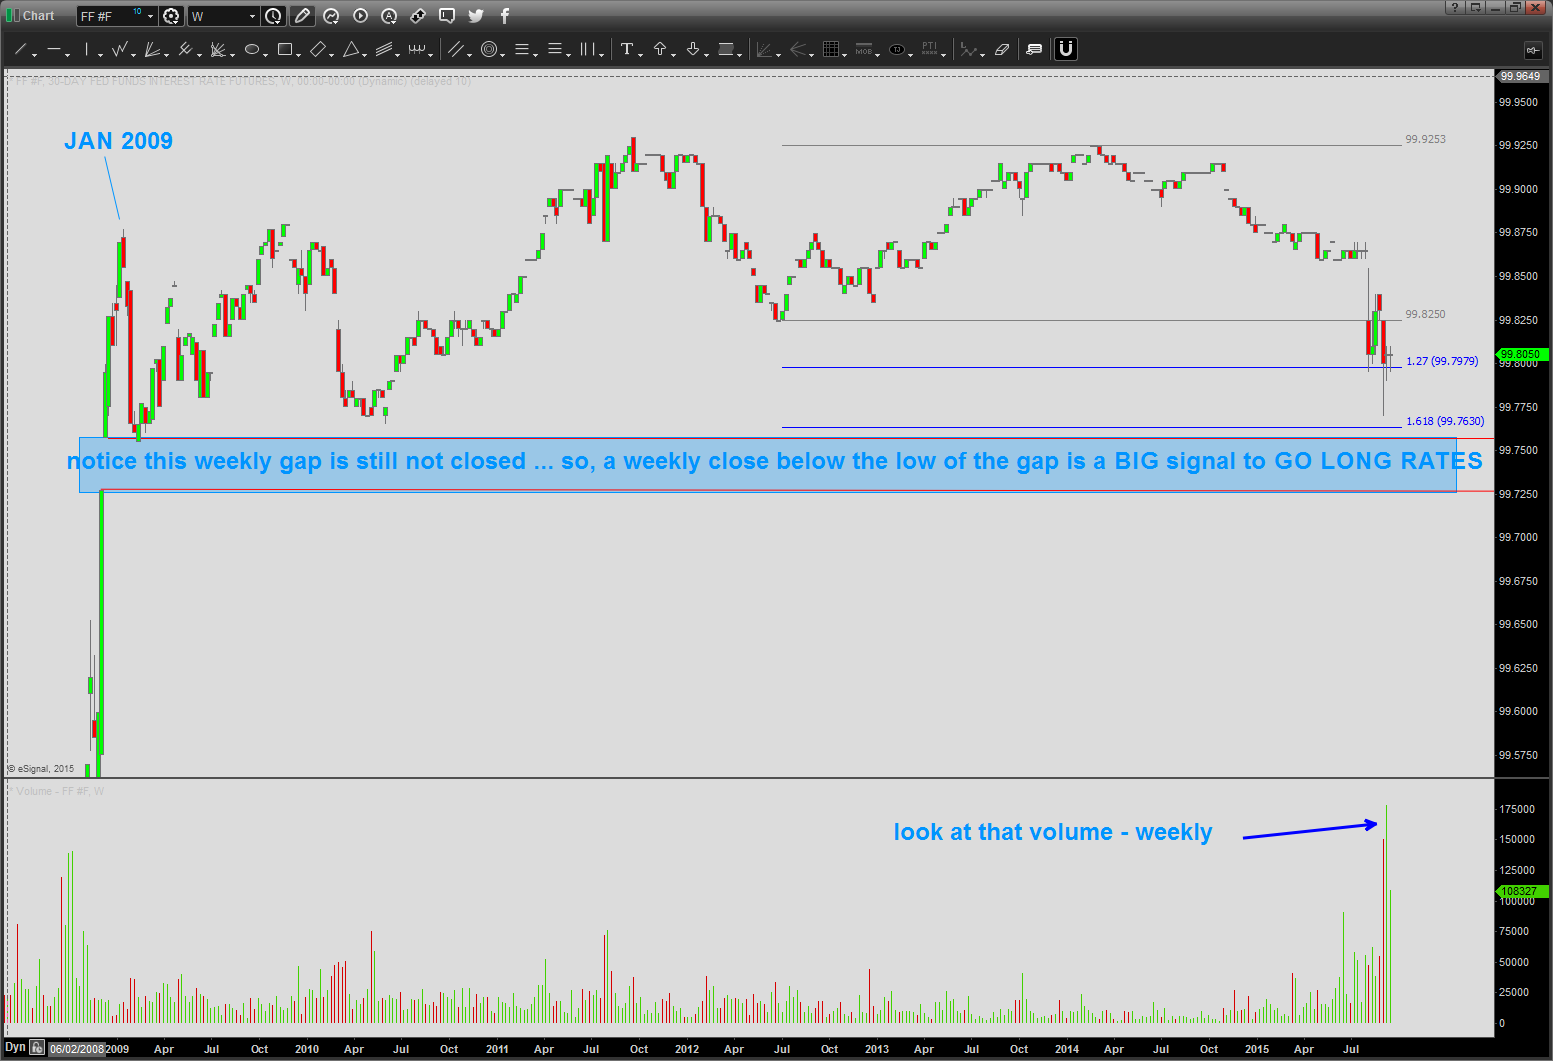
most volume, ever. is something a foot at the Circle K?
Posted on September 15, 2015 Leave a Comment
Folks, no clue which way interest rates are going w/ the FED.
do know their is 1.4 quadrillion outstanding derivatives, 100 fold increase in the money supply and – of course – 5000 year low in interest rates. so, in the big picture does what happens on Thursday really matter? Um, no … unchartered waters folks.
teach yourself how to look for supply and demand points – resistance and support on a chart and go for it …
that being said, note we have the most volume ever showing up on the Fed Futures Monthly chart … we have a bottom that has been “chilling” out for 6 years so – again – if we get a weekly close below the daily gap (shown on the second chart below) rates are going higher … no matter what the Fed does.
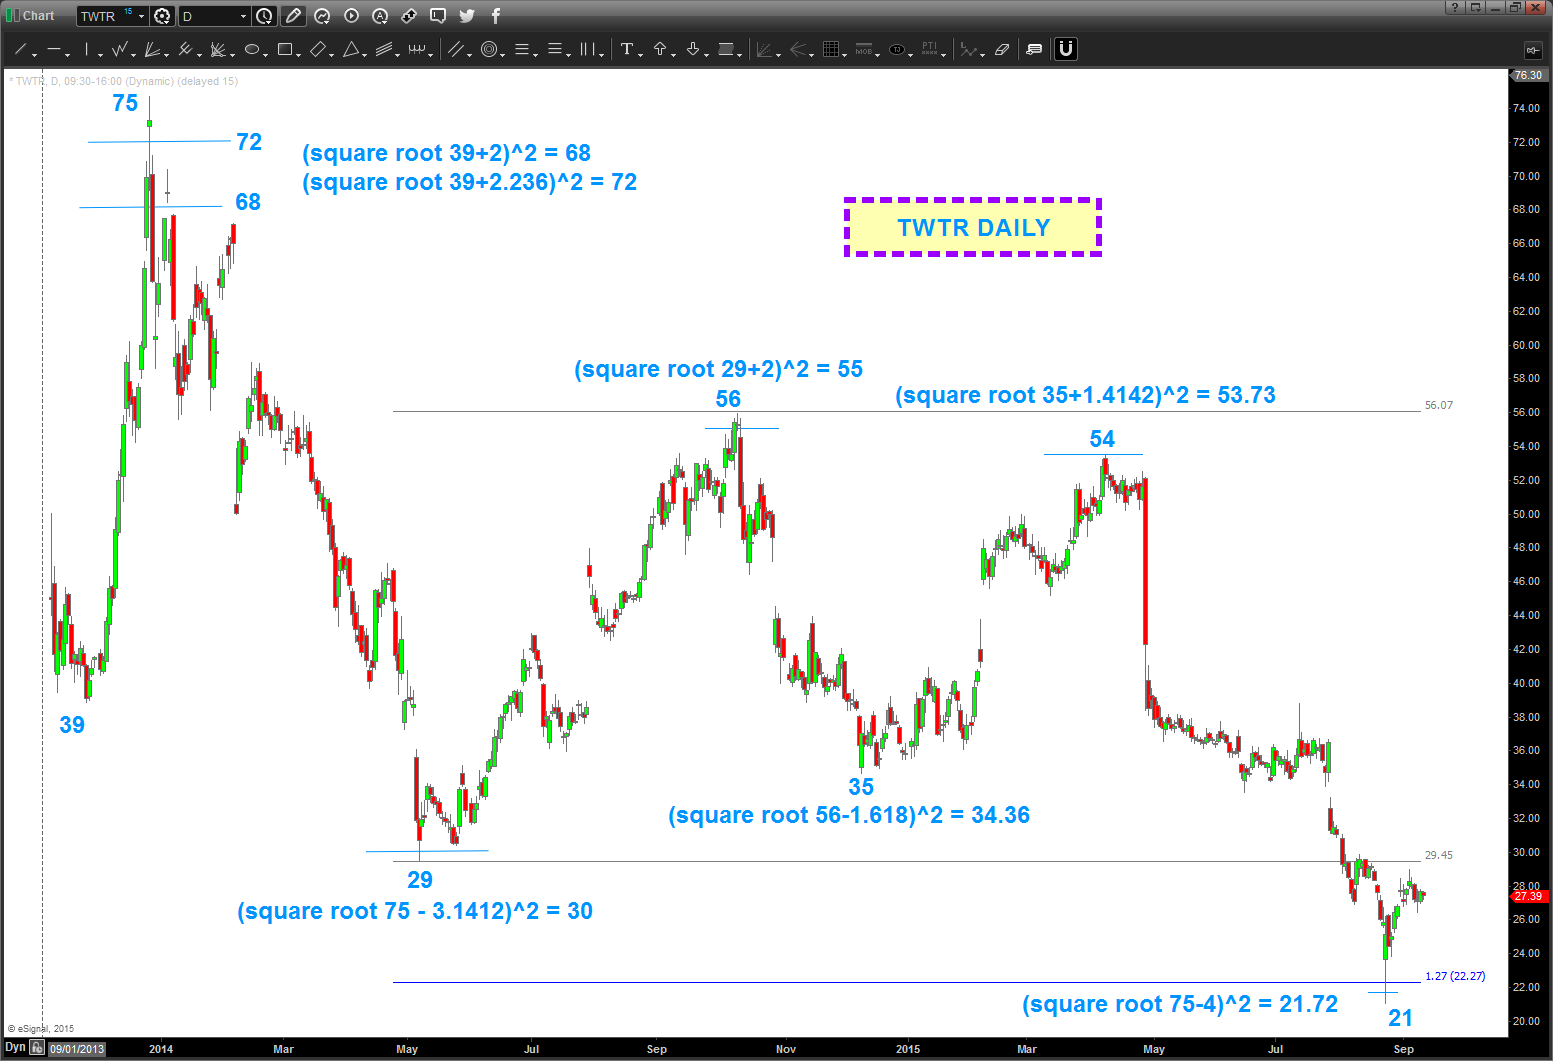
$TWTR square roots …
Posted on September 13, 2015 4 Comments
I received a lot of “comments” from people about my most recent GoPro post.
No kidding, people were vehemently angry … folks, not trying to make anyone angry or anything like that, it’s a blog and I enjoy sharing my thoughts as it 1) makes me think about the next investment in currencies, 2) solidifies my thought process, 3) helps me maintain my skill and 4) pr0vides some education on a POTENTIAL way to manage risk in these markets. So, if you get all bent out of shape because the “geometry” says GPRO can go to XXX or YYY. Don’t worry about it ok …
TO ME IT’S ALL NUMBERS .
I DO NOT CARE about a particular securities fundamentals, profitability or any of that .. if you do, great. if you don’t, great.
A couple people have approached me and asked me to blog about square roots.
SQUARE ROOTS ARE THE KEY UNDERLYING STRUCTURE OF ALL PRICE and TIME ON A CHART OF ANYTHING …
it’s theory is musical in the frequency of a string and the tension are components of the square roots of it’s length and 1/square root of tension and blah blah blah. not going to any farther than that …
the “ancients” believed that the numbers 1-5, their square roots and the inverse of those square roots were responsible for all of creation. sounds cool and not going to debate if it’s true or not but somehow they knew how to PRECISELY calculate every eclipse, planetary synodic period and, OBTW, the exact end of the great year (26,000 years ish) and some other cool stuff.
so, if Pythagoras (smart dude) discovered the power of ratio’s and musical theory AND the slight possibility that the market is vibrations and musical then there must be a square root component – correct?
so in order to reinforce my belief that there is a natural vibration and harmony to the market I chose a random stock – TWITTER to check it out. (I was just on my Twitter feed so that’s why …) I truly had no idea where this was going to take me – those of you who know me realize that I really didn’t and then some of you will think I planned it. Folks, I didn’t …I erased everything on my TWITTER chart and just pulled out a calculator.
So, take a ride on the TWITTER train and note the PRICE component of the square roots starting w/ the low of 39. There is also a timing component of the square root – we’ll do that sometime in the future.
The Gann Square of 9 is based on square roots …one full trip around the circle is the (square root of XXX+/-2)^2. If you want to go 2 trips around then it’s +/- 4 ….note the all time low on Twitter – it was a 2 trip turn around the wheel from 75 AND a 1.27 (square root of 1.618) extension. When that happens (overlapping square root target and pattern levels overlap) it’s a good probability that ‘stuff’ is going to happen.
Also note, just like we do “typical” projections from price we can do the same thing w/ the square root targets … we used Pi, the golden mean and the square roots of 2 and 5 to project POTENTIAL inflection points.
ALL OF THEM HIT … so, one has to ask “self, does the entire trading Twitter universe know about the square roots or is something else happening?”
You do the math (that was a joke) and decide for yourself.
No matter what your trading/investing style is HOPEFULLY this will show you how powerful square roots can be to manage risk.
the current market conditions and the AUDJPY
Posted on September 12, 2015 Leave a Comment
folks, this is not a “I told you so” blog or any of that because I have no idea what’s going to happen from one minute to the next in the market. just look for patterns and then “IF-THEN” the resulting move if the pattern works or doesn’t to manage risk … seriously.
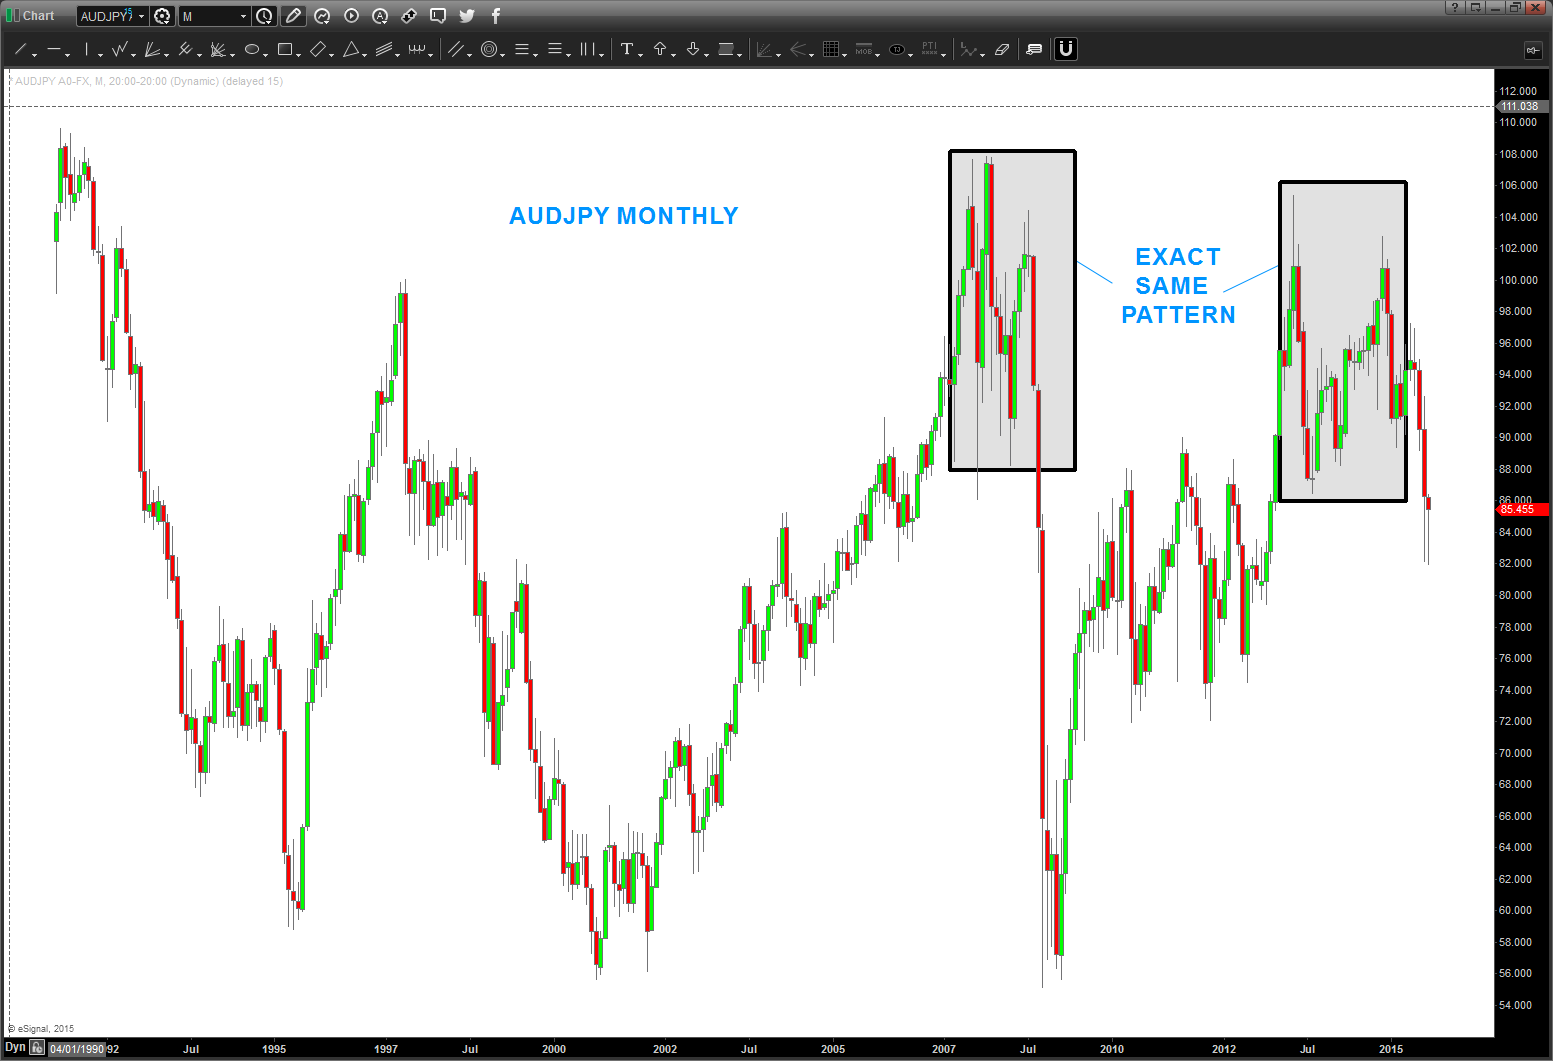
but I did want to spend just a little bit of time on the PATTERN that appeared on the AUDJPY back in November 2014. Yes, almost a year ago.
first off – here’s the foot stomp – GO BACK AND LOOK AT LONG TERM CHARTS and, obtw, take all of the indicators and oscillators and all that other useless garbage off the chart and look for PATTERNS and MEASURED MOVES. Once you find them, then throw all the indicators you want onto the chart … it’s like using steak sauce on a perfectly grilled steak.
anyway – look at the PERFECT repeat of the pattern in 2007-2008 on the AUDJPY:
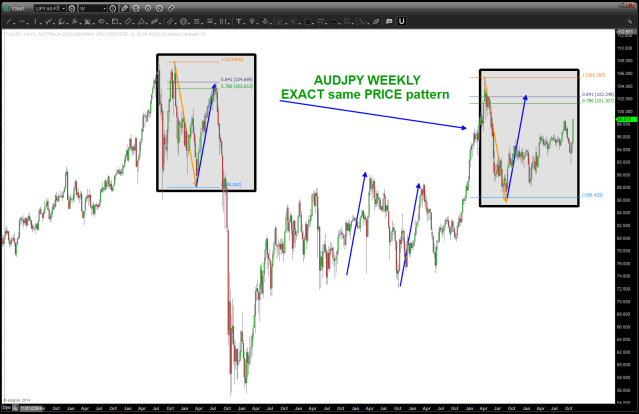
here’s the result:
Why is this important to the US Equity Market? Here’s a chart showing the $NYA overlaid on the AUDJPY. Note the close correlation that occurred in the early 2000’s. Since then it’s been highly correlated.
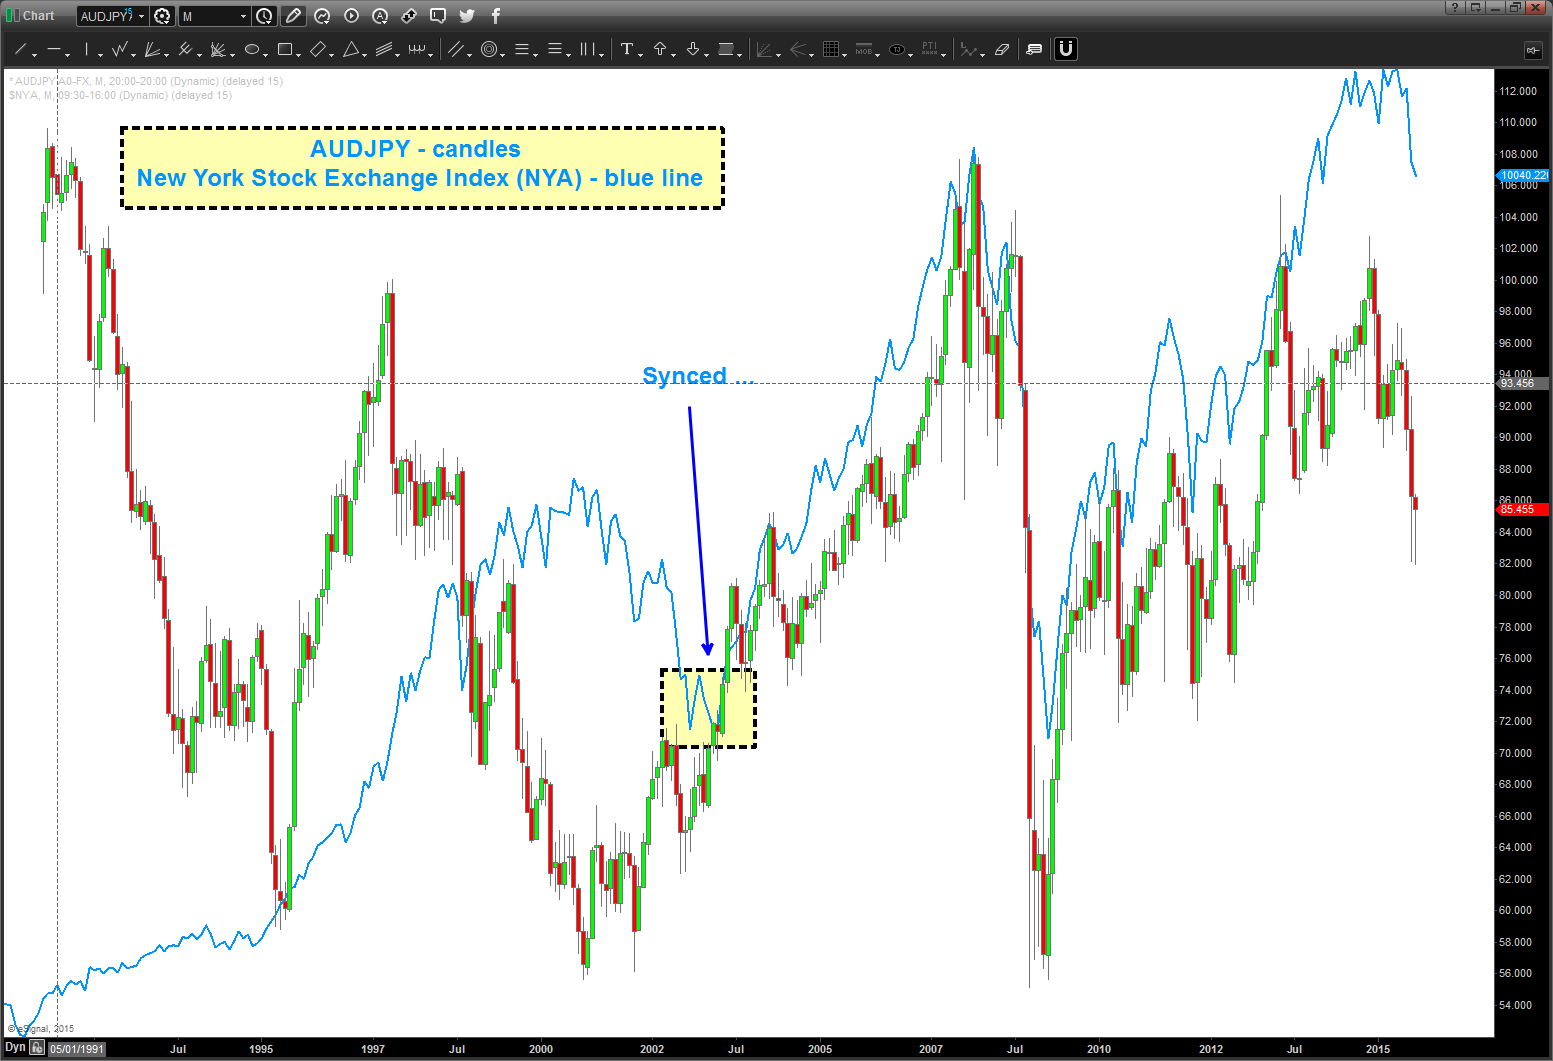
So, is the “correction” in the AUDJPY and the EQUITY markets over? Using Fundamentals (which I don’t) I can tell you I don’t have a clue. However, we do have a PATTERN that is crucial to the overall direction of the equity markets.
so here we go …
IF the AUDJPY can stay above the crucial 81.90 level THEN equity markets should rally.
IF AUDJPY loses this level (81.90) THEN equity markets will continue to slide lower.
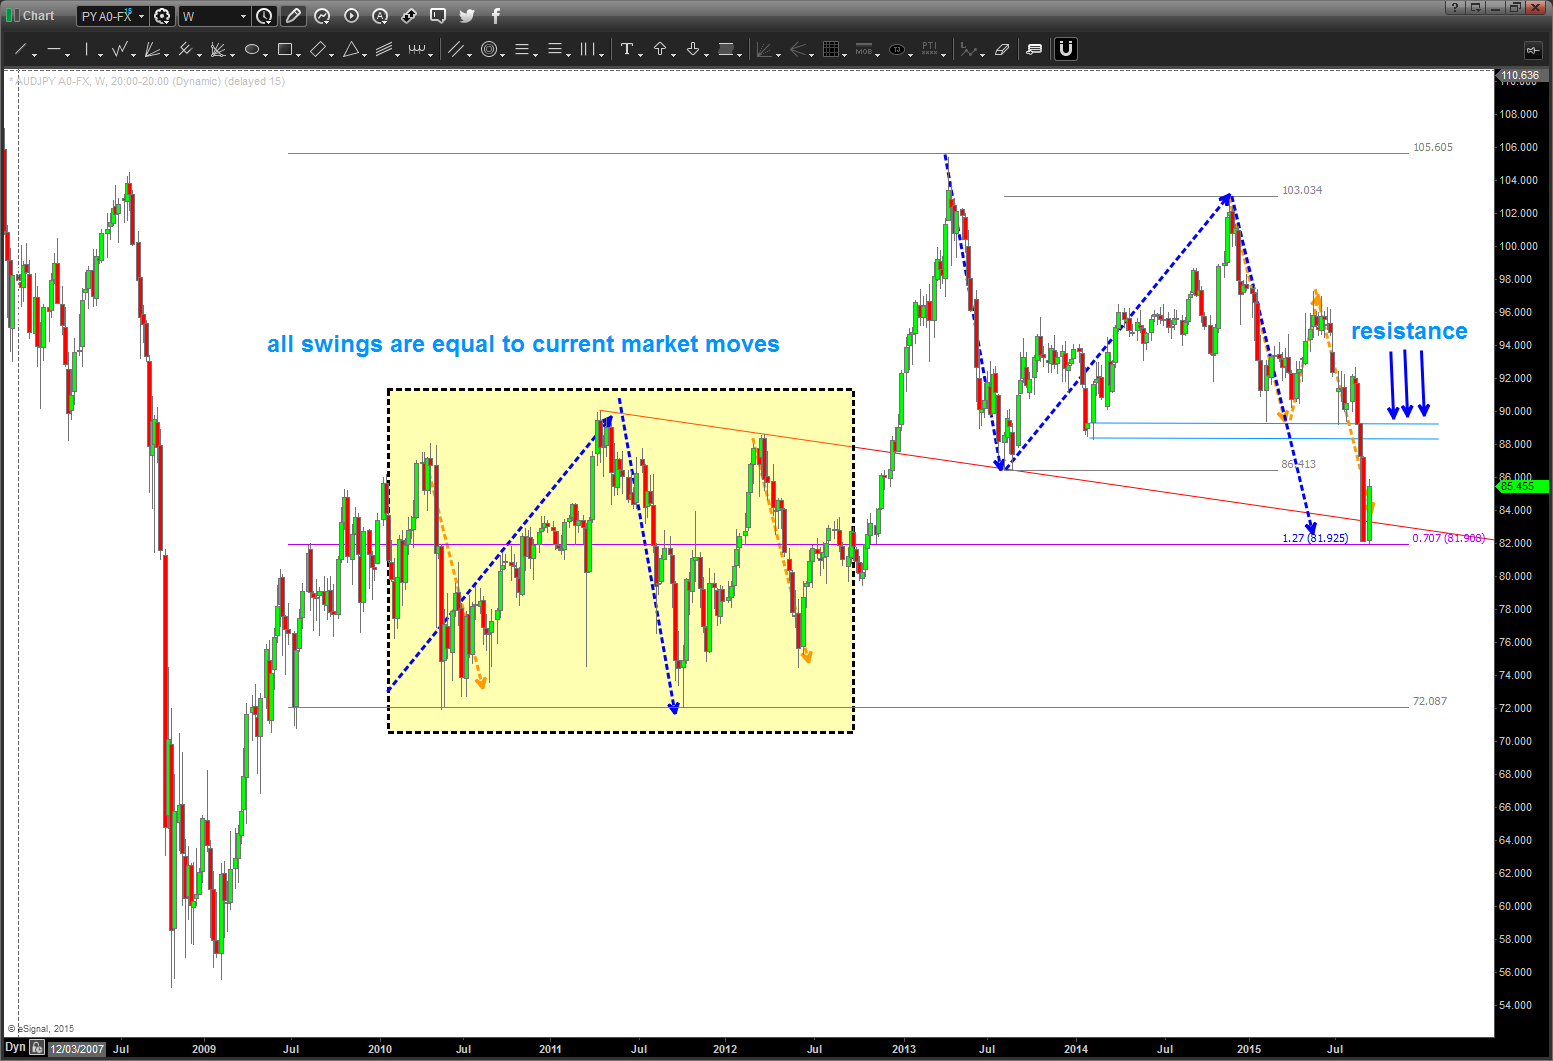
NOTE: the yellow boxed area contains ALL of the current AUDJPY moves. It’s also a region of 4 years of resistance. Note, the red trend line coming from the Jul 2011 top into current market price. We spiked thru it but are still above it – watch that closely.
thanks for reading and let me know if you have any questions.
rock on, ok?
B
EURO – is it “time”
Posted on September 10, 2015 Leave a Comment
when I get ready to put a “position” on I ALWAYS erase the chart and start at the longest, most “biggest” time frame that I can use …
in getting ready to put a “positional” idea to work I like to understand where it’s been and where it’s going … as they use to say in the Navy – “go big or go home.”
so, in order to do this I’ll put the chart on first and then discuss what I “see” – not believe.
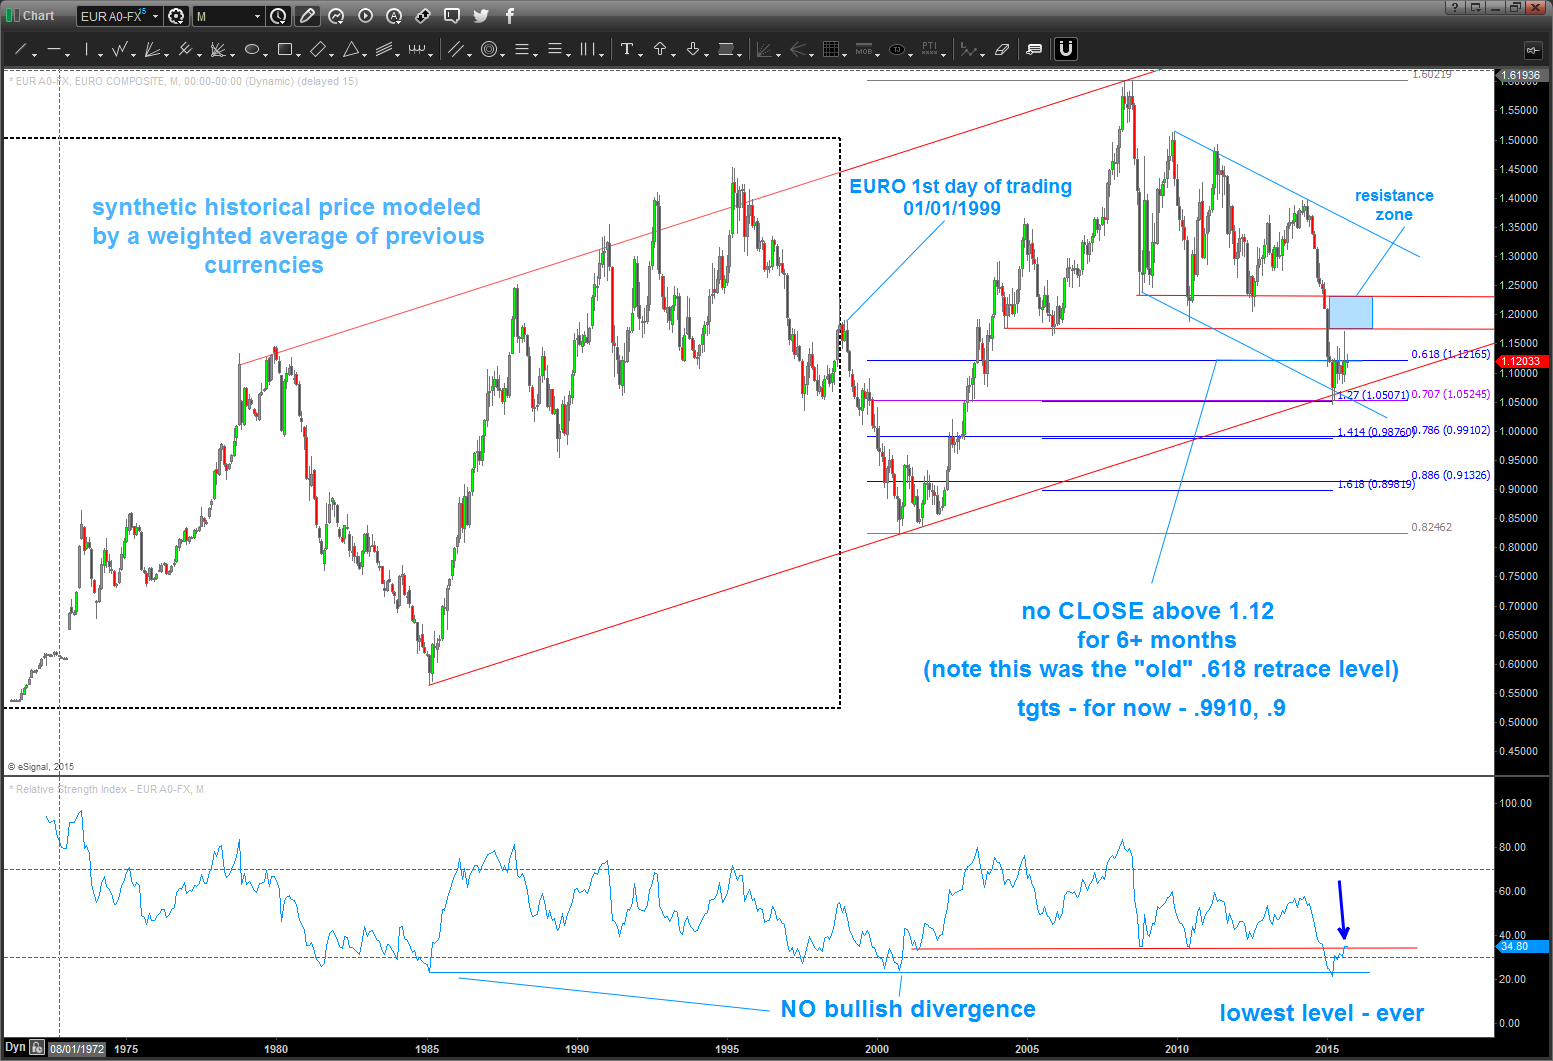
- Euro started trading in 1999. Synthetic (based on interest rates, GDP, compilation of combined currencies, etc) prices are shown in the black box.
- RSI – lowest, ever. note, don’t need bullish divergence to get this thing moving UP big
- Trend line from 1984 appears to be in force …
- It hasn’t closed above 1.12 for 6+ months
- the “extension” point 2005 low nailed the low this year at the 1.27 extension point (square root of 1.618)
- a break down from here “should” lead to .9910 or .9000
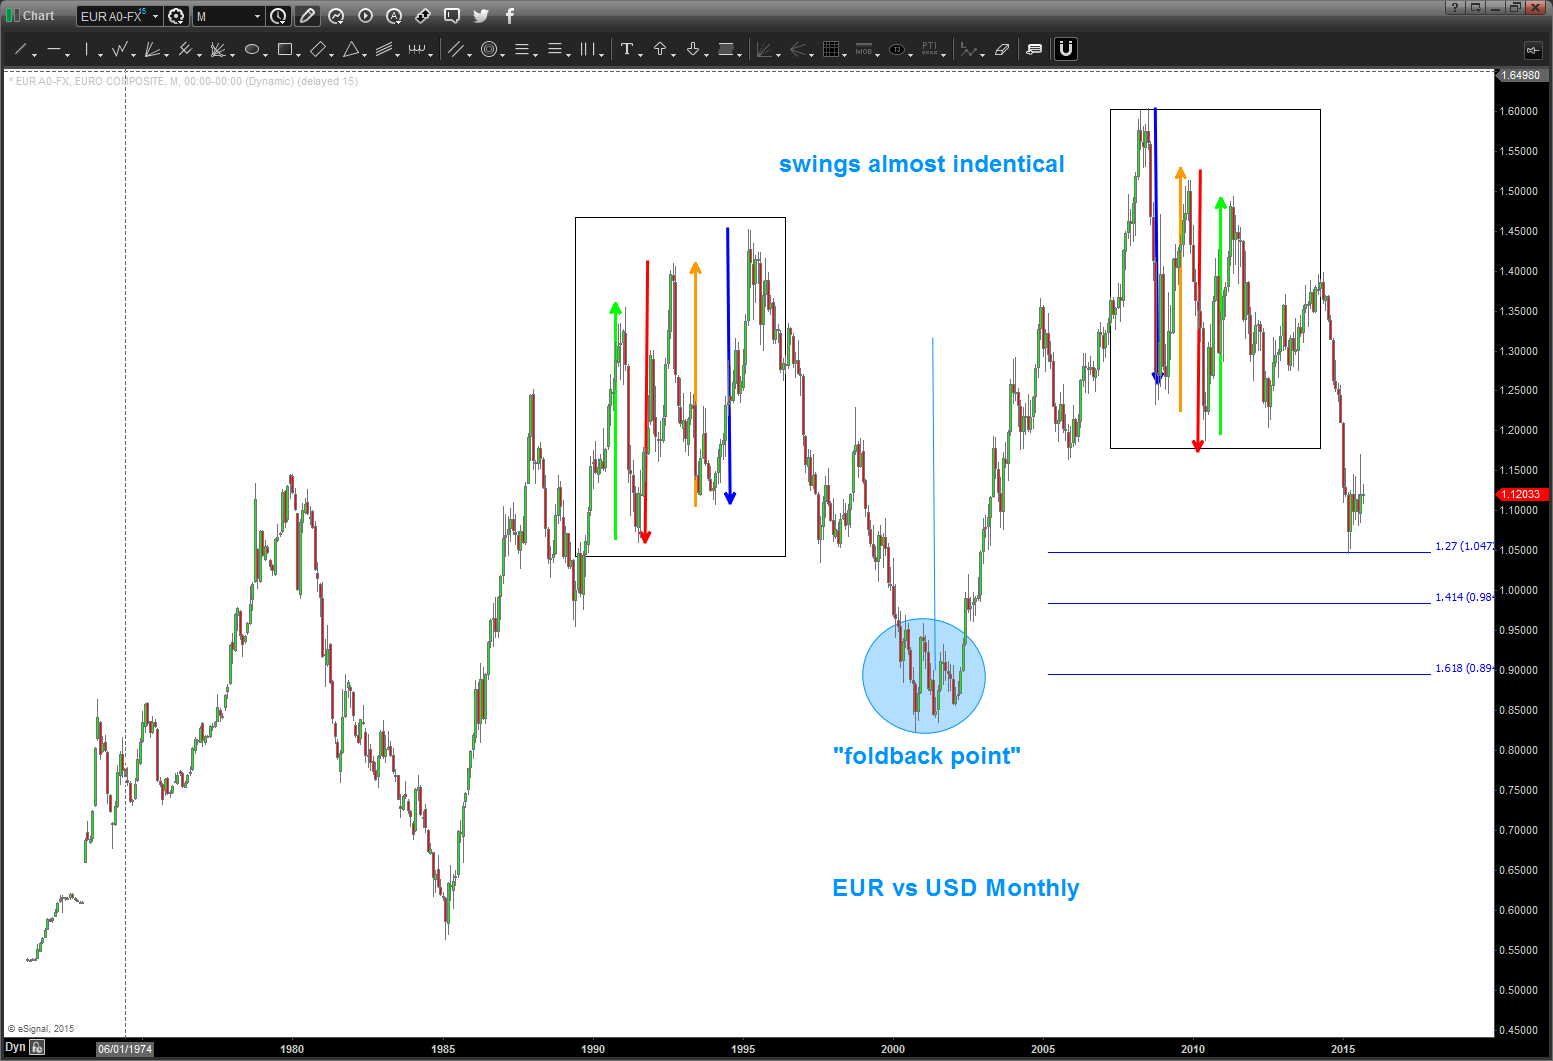
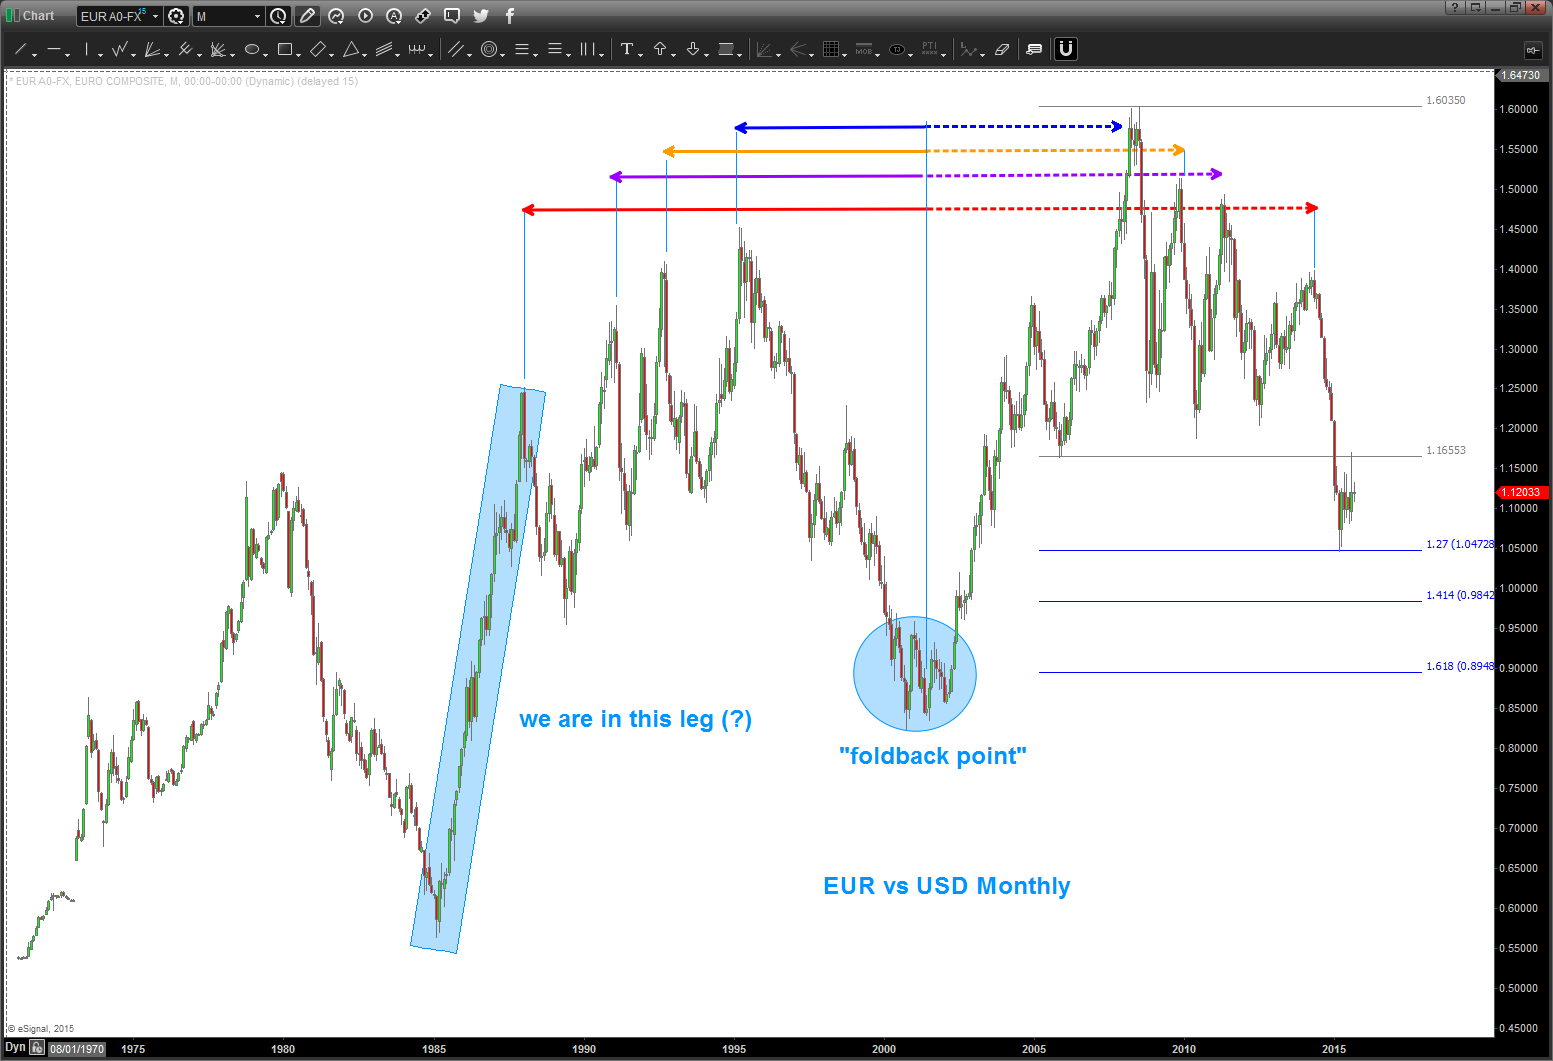 Mirror Image Foldbacks .. they are planetary in nature and think of the rule in math .. the angle of incidence equals the angle of coincidence. yup… price will come INTO a point and, sometimes, go back out that point in the same manner.
- note the foldback point … then note how after the 2009 high we came down the EXACT same way and now it appears we are in the final blow off move lower … I think there is lower to go based on this foldback picture.
now, look at the price swings present on the foldback – they are almost exact. I like this foldback picture – so believe we have another move lower based on that picture.
so, where are we now?
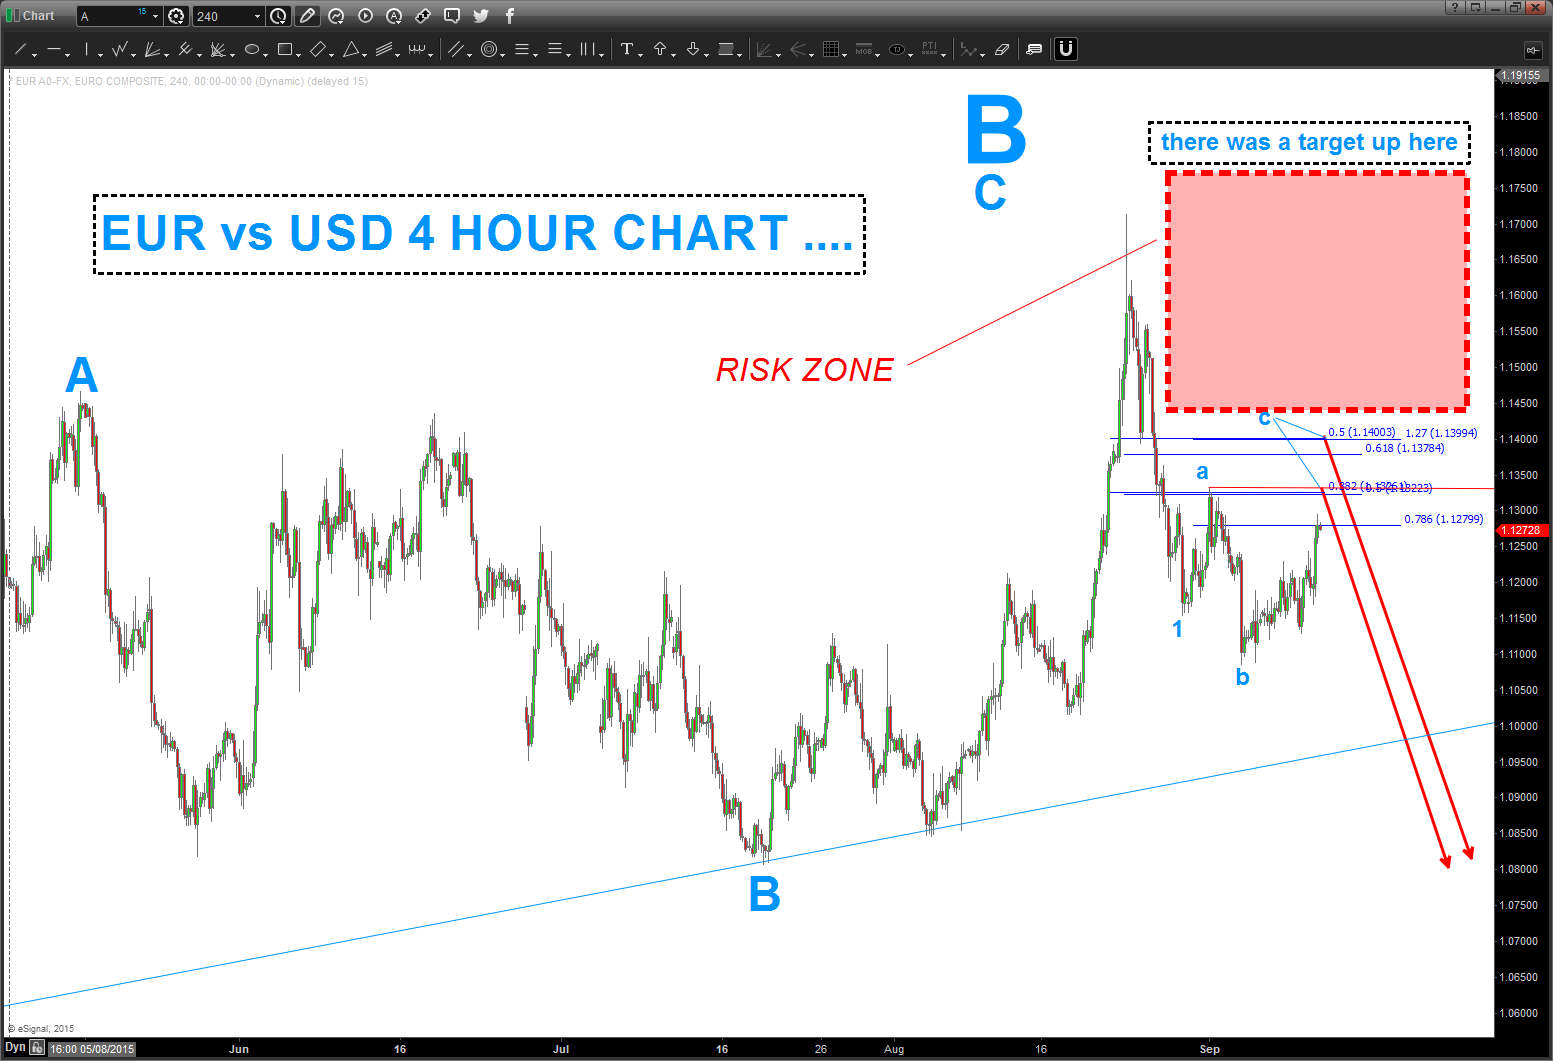
if we go down to a 4 hour chart we’ll see that after we completed a A-B-C correction from April the market moved down w/ 5 waves. W/ that in mind – note there was a higher target around 50 pips away … bummer, as I was waiting on that one. so, note a little more push higher and then it’s time to make the decision to deploy capital.
THE ONLY THING I KNOW IS MY RISK .. and that is the shaded red area. THAT IS ALL I CAN CONTROL ….
Cheers and thanks for reading …
B
Aussie vs USD updated
Posted on September 8, 2015 Leave a Comment
09/08/2015 – my target area/zone got crunched pretty bad, and my count is wrong. all that being said, I didn’t take into account the measured move from 89-01. quite frankly, w/ all that ‘stuff’ coming into the areas as shown below I didn’t think it could. So the age old adage of “thinking” versus “seeing” left my target thumped. W/ so much thrust and momentum going I did not take the long trade but have been waiting …
but, as of last night it has give us a DAILY SRC and when I went back and erased everything I saw a monster cycle coming in and the measured move hit perfectly …hmmm.
how to play ? WAIT for a PATTERN to appear on perhaps a 60 minute chart .. watch gasoline futures and crude and the All Ordinaries for a sign of life and also the Chinese market …
here’s the updated chart:
will update (real time) the play here and the risk and the real time move of a dude in his home juggling dynamite w/ gorilla’s in a cage .. cool hugh?
Bart
Folks, back in October the post below the two dash lines was searching for a low to be in place on the AUD. The form and proportion were just about right. However, w/ the big move in crude, the interest rate extravaganza and the a whole host of other fundamental reasons the real issue is the PATTERN level didn’t work … it went approximately 300 pips below. HOWEVER, the overall thesis that the Aussie is bottoming versus the dollar still holds true. It’s showing some nice strength tonight …would love to get a very nice pullback to go long in/around these levels.
Updated charts below:
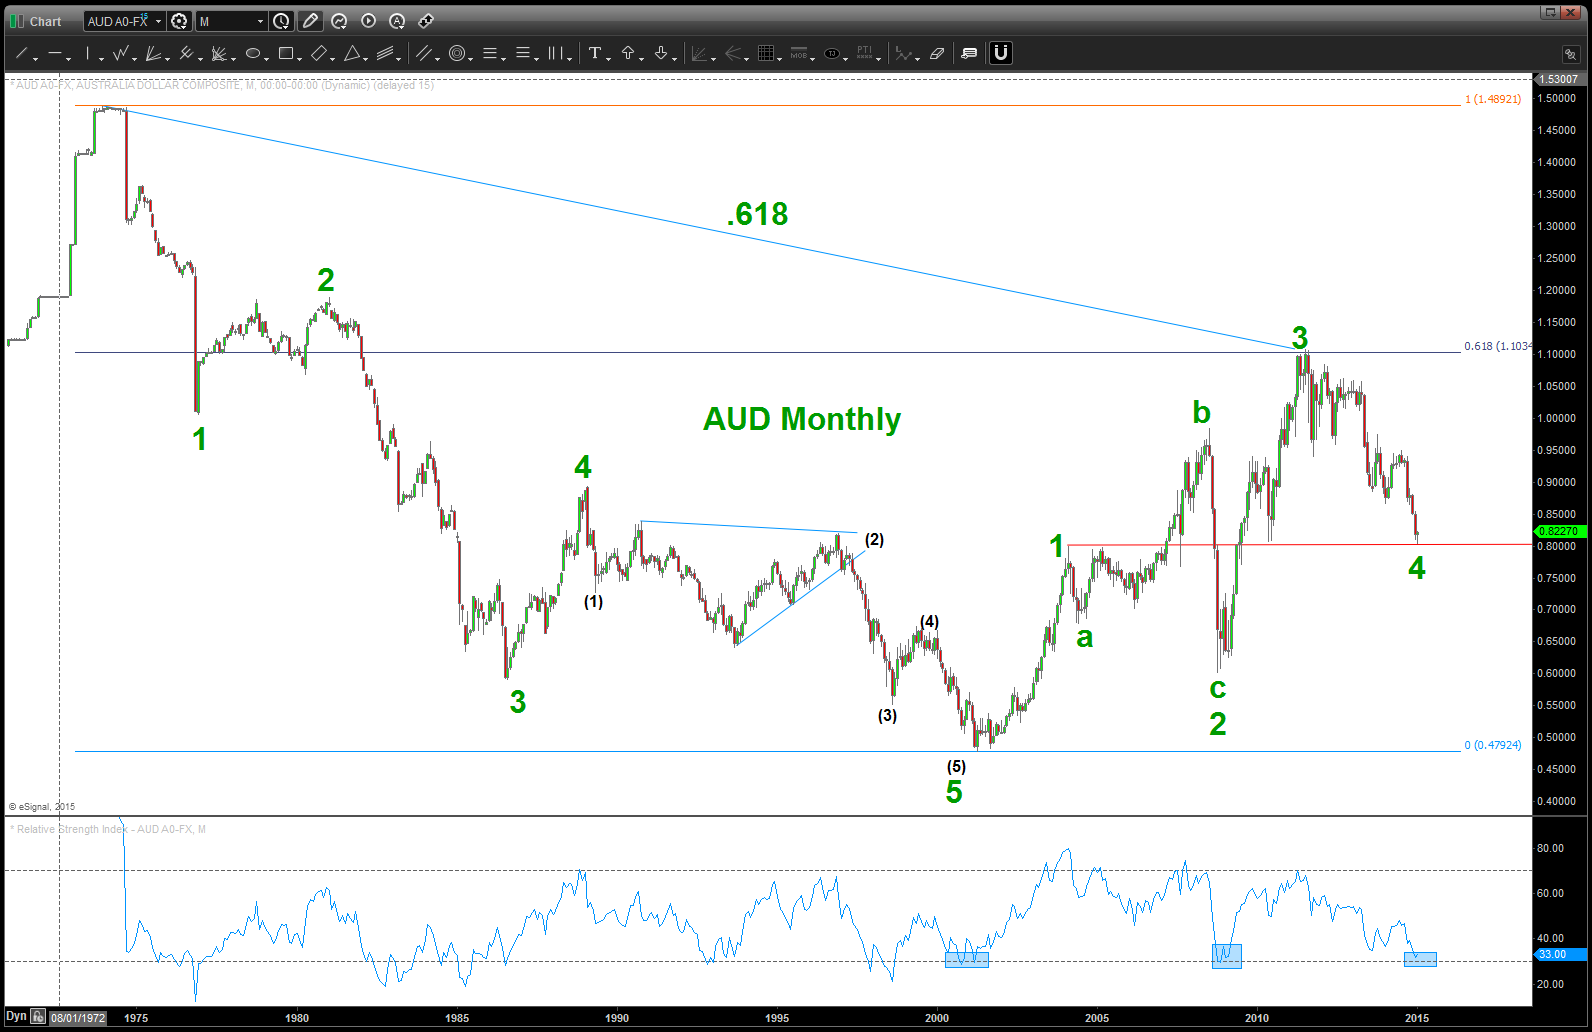
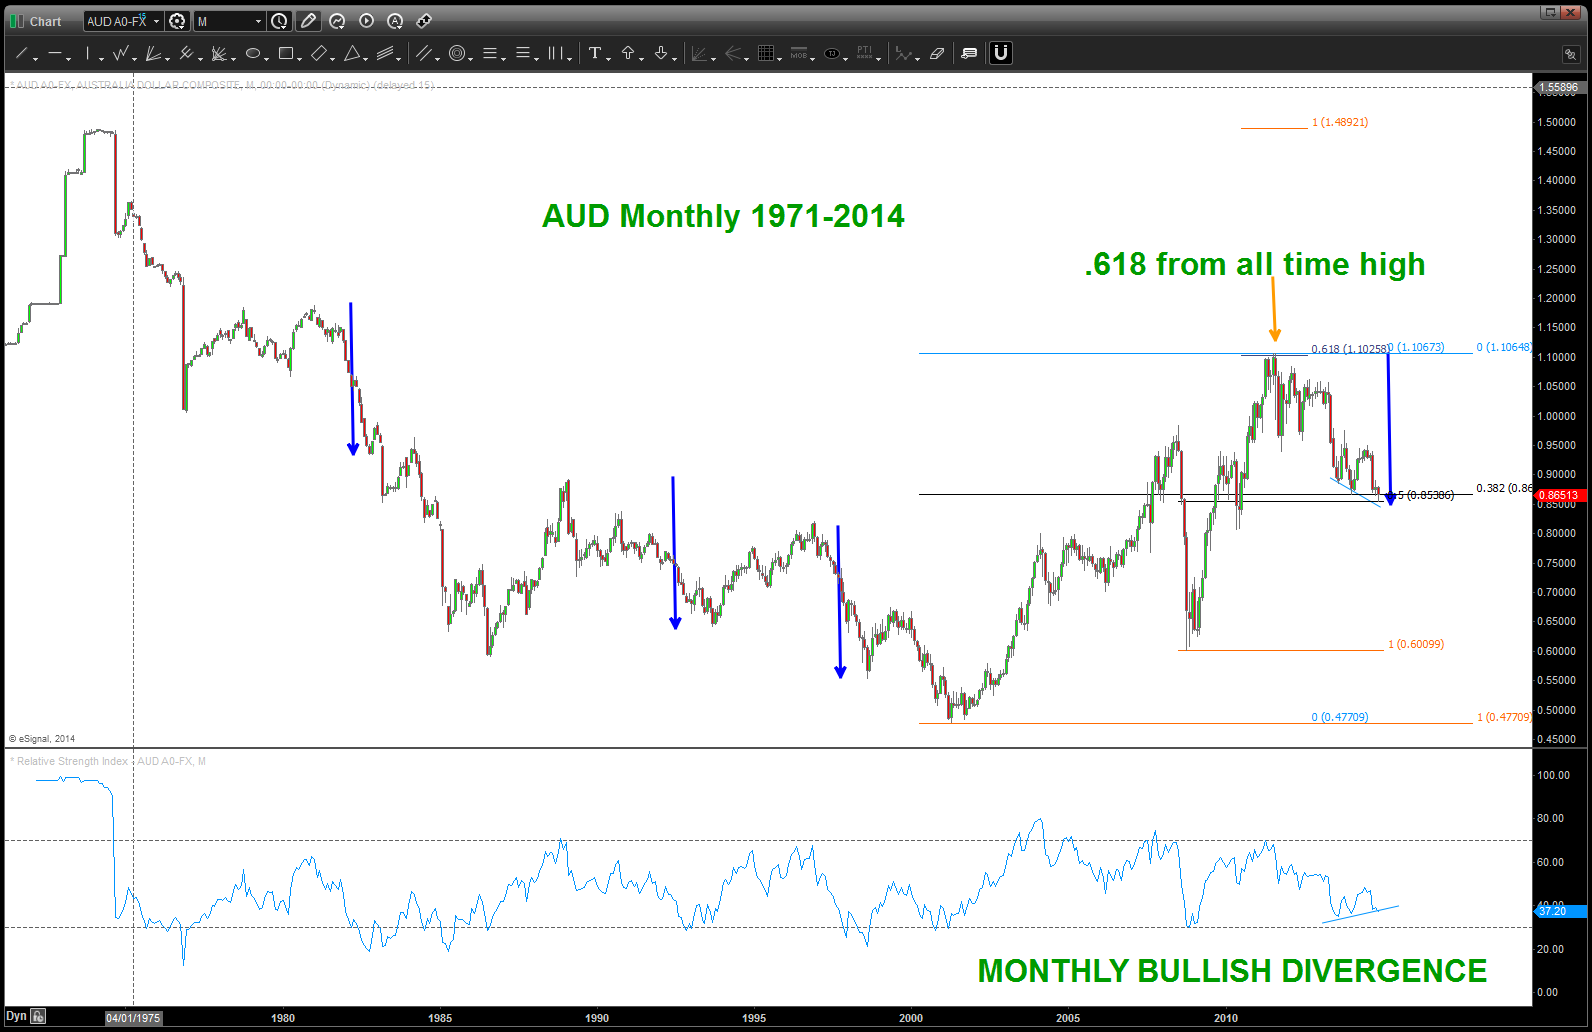
Note the monthly RSI levels … the BIG MOVES UP occurred right where we are sitting. Also, a case can be made that 4 is complete and we are going to new highs …
last time I checked the Aussie wasn’t part of the US Dollar index … so, watch this one closely. At a minimum we are completing/completed an A and a nice B wave up is to occur.
let’s just get on the right side of the trade and right now that looks like bullish entry for the AUD vs USD.
The Aussie has been correcting for a while and, folks, the move down from 1.100 ish certainly appears to be corrective. What does that mean? We are “at” or “near the beginning of a multi year advance that will take out the high July 2011. Here’s the monthly picture …
TILT … everyone is talking about US Dollar strength – yes, but they are talking about the dollar index which the Aussie isn’t even a part of it. Or if it is the weight is negligible so in this case we have to take this pair as a single entity – not a weighted index.
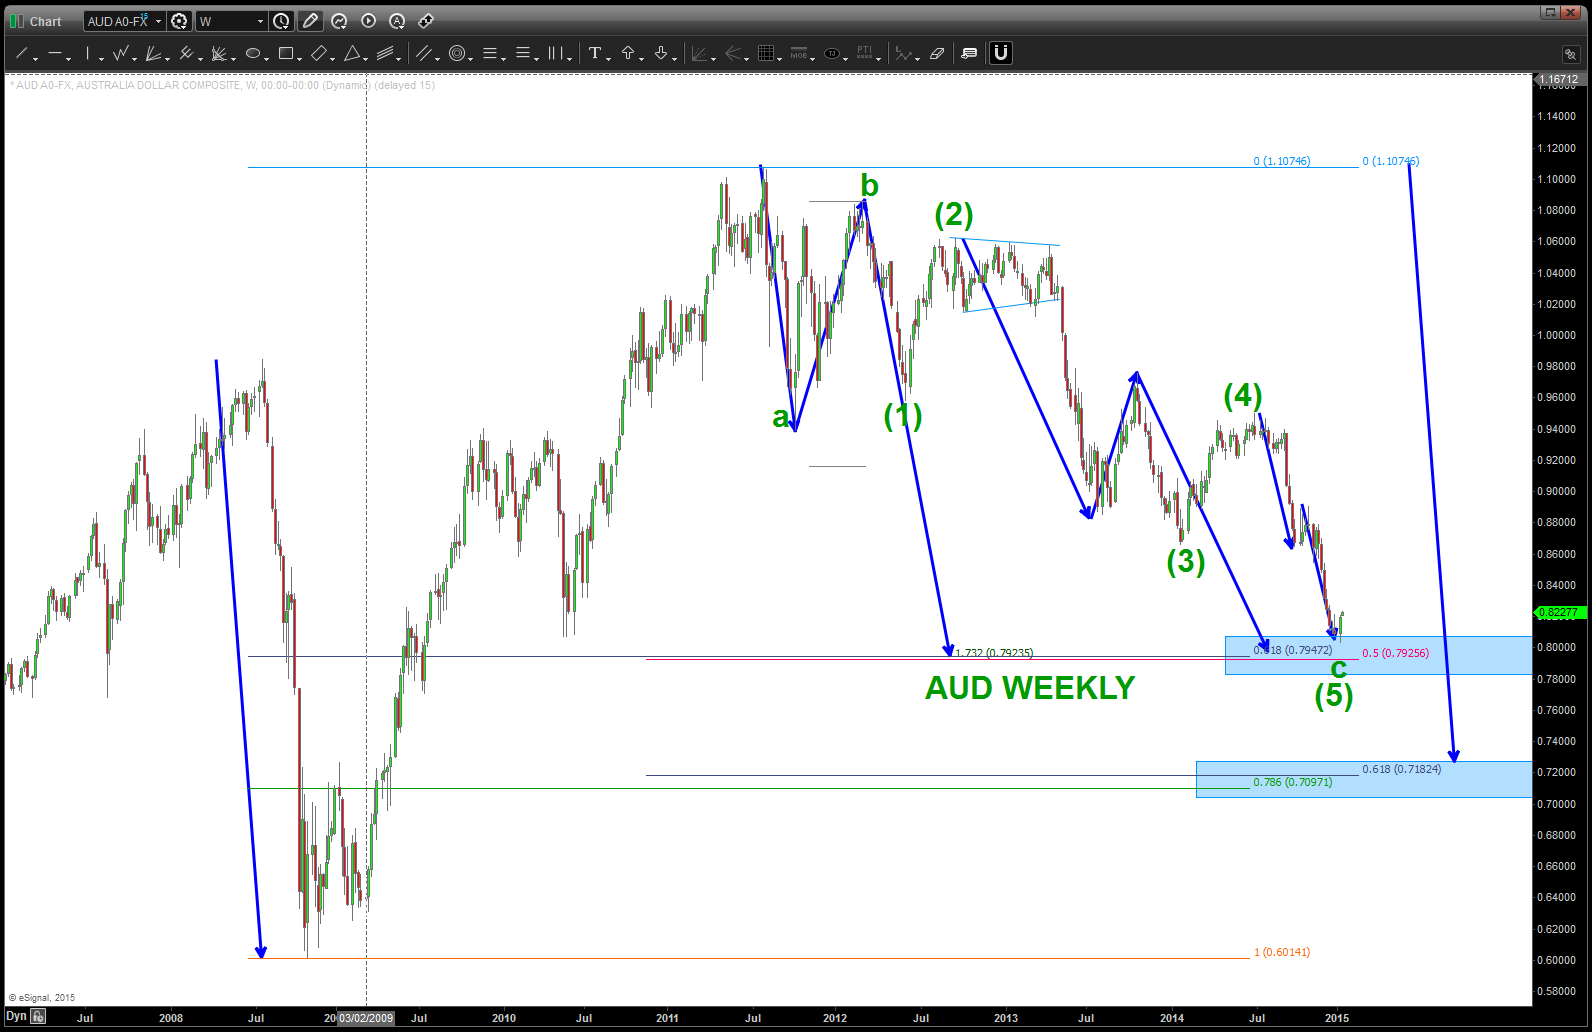
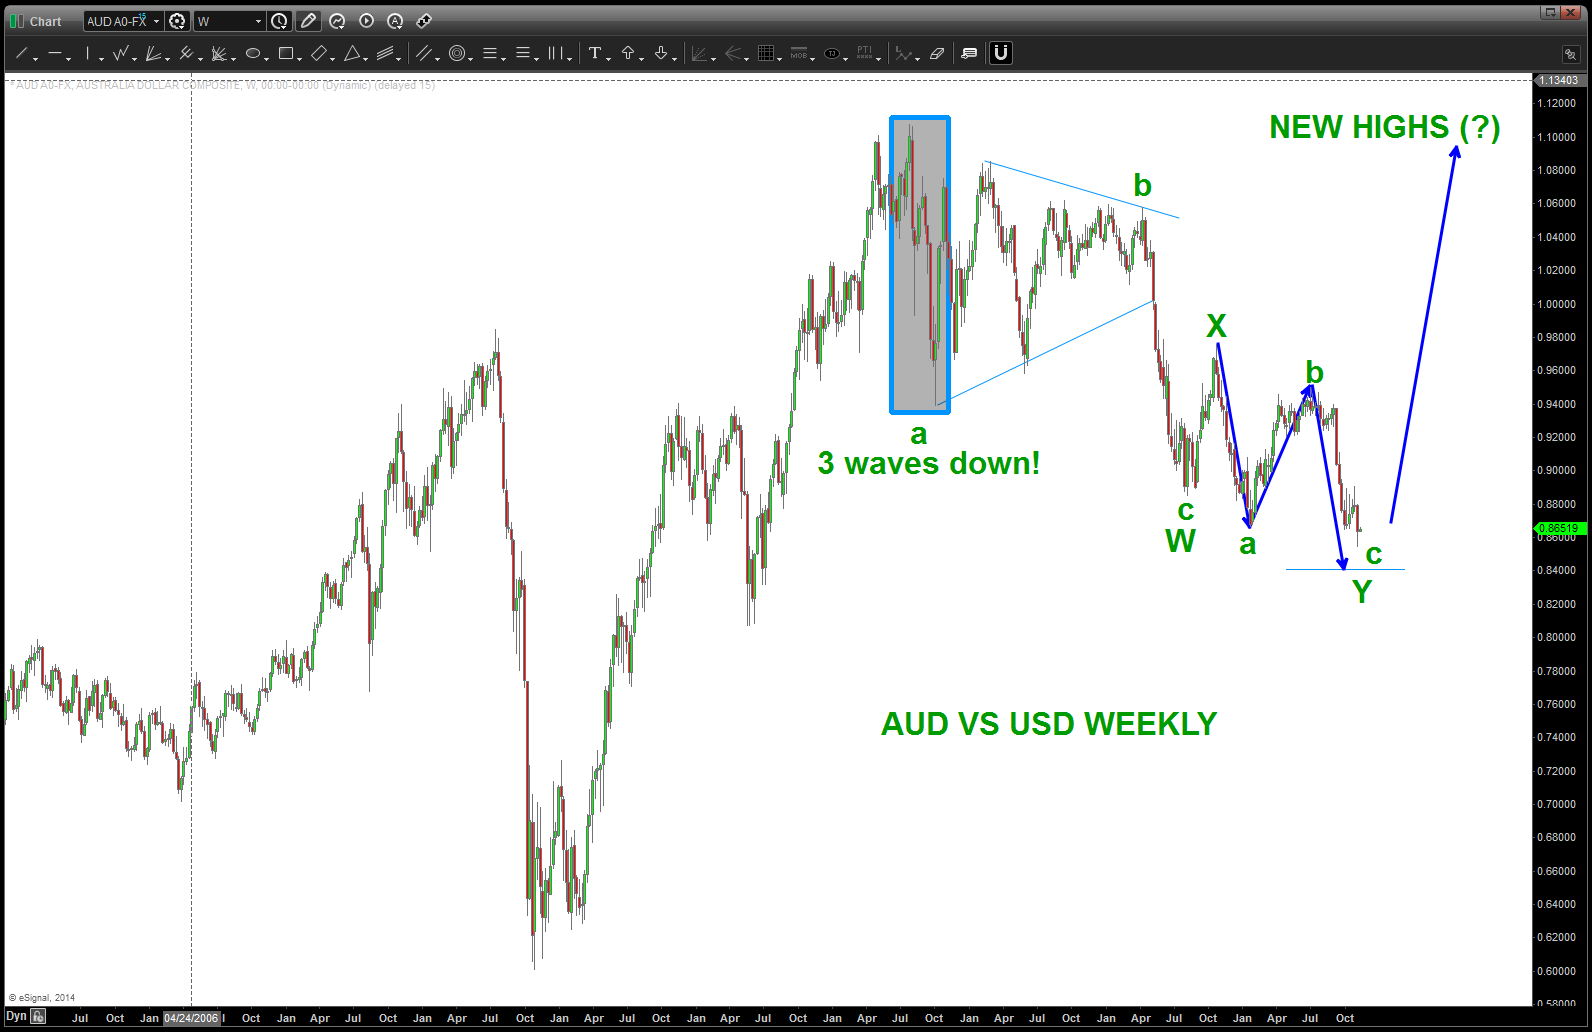
here’s the weekly:
note the 3 waves down … that is the key. it was not a 5 wave movement. has this correction been complex – yes. But it’s falling right in line w/ a double three labeled w,x,y.
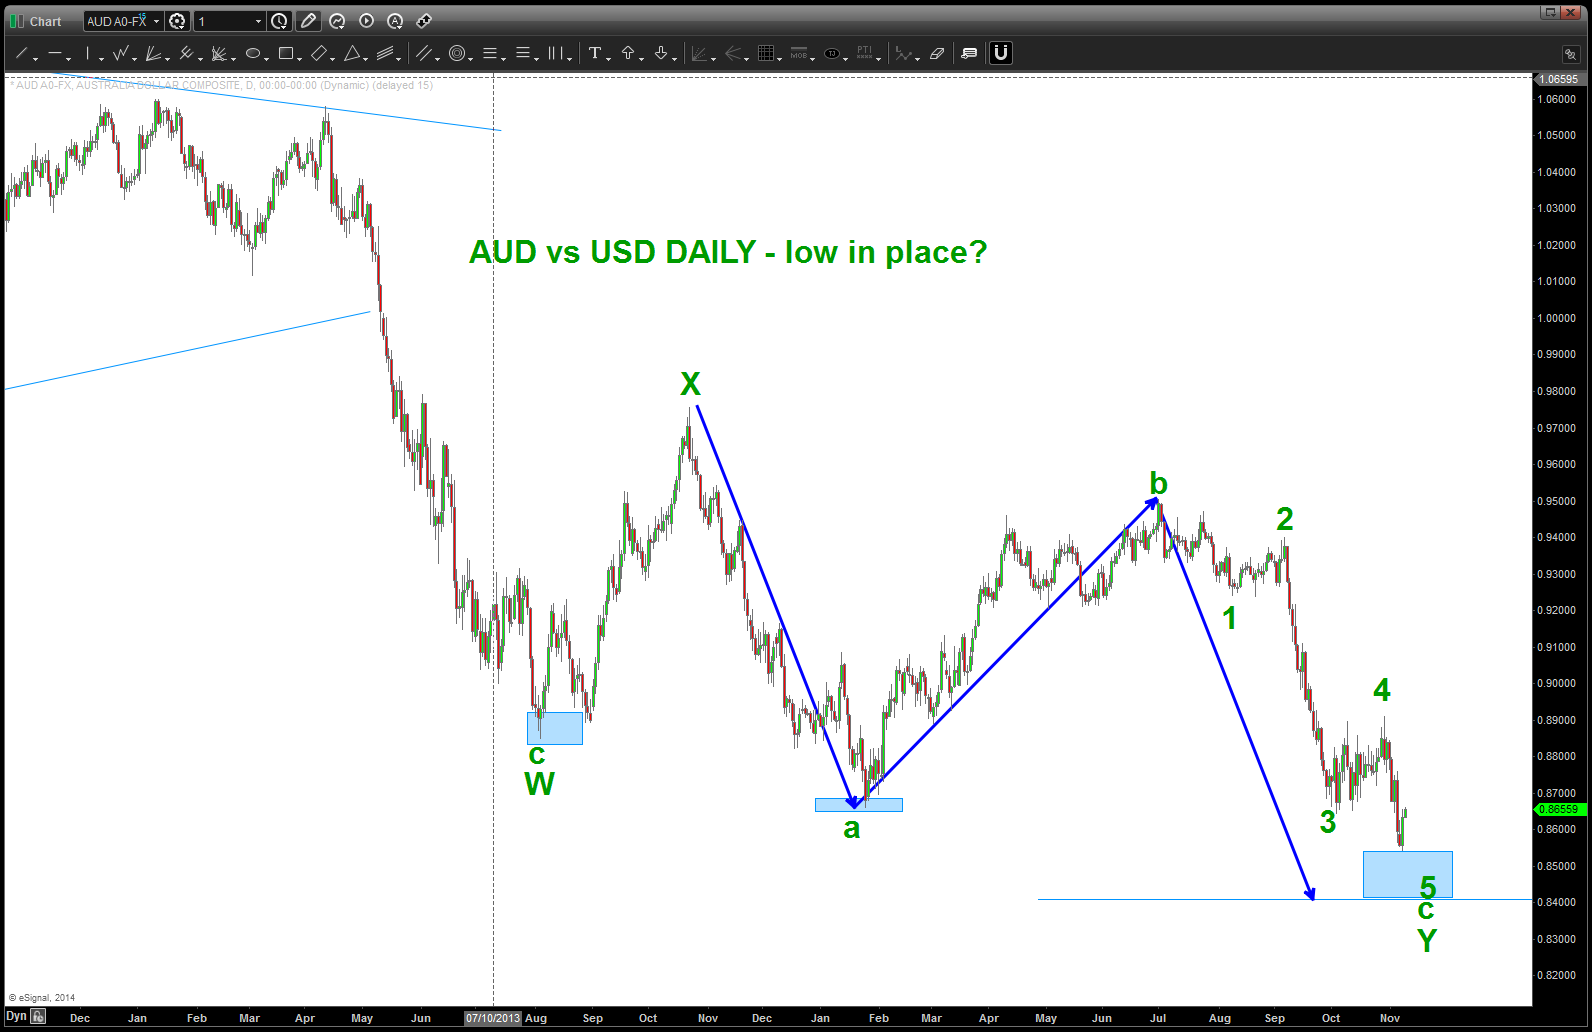
and, the daily, shown below, just completed 5 waves down. While it would be perfect symmetrical three drives to a bottom is we go down and attack 8400 – there is a good case to be made that a low is in place. we’ll have to wait for an intraday pattern to appear …
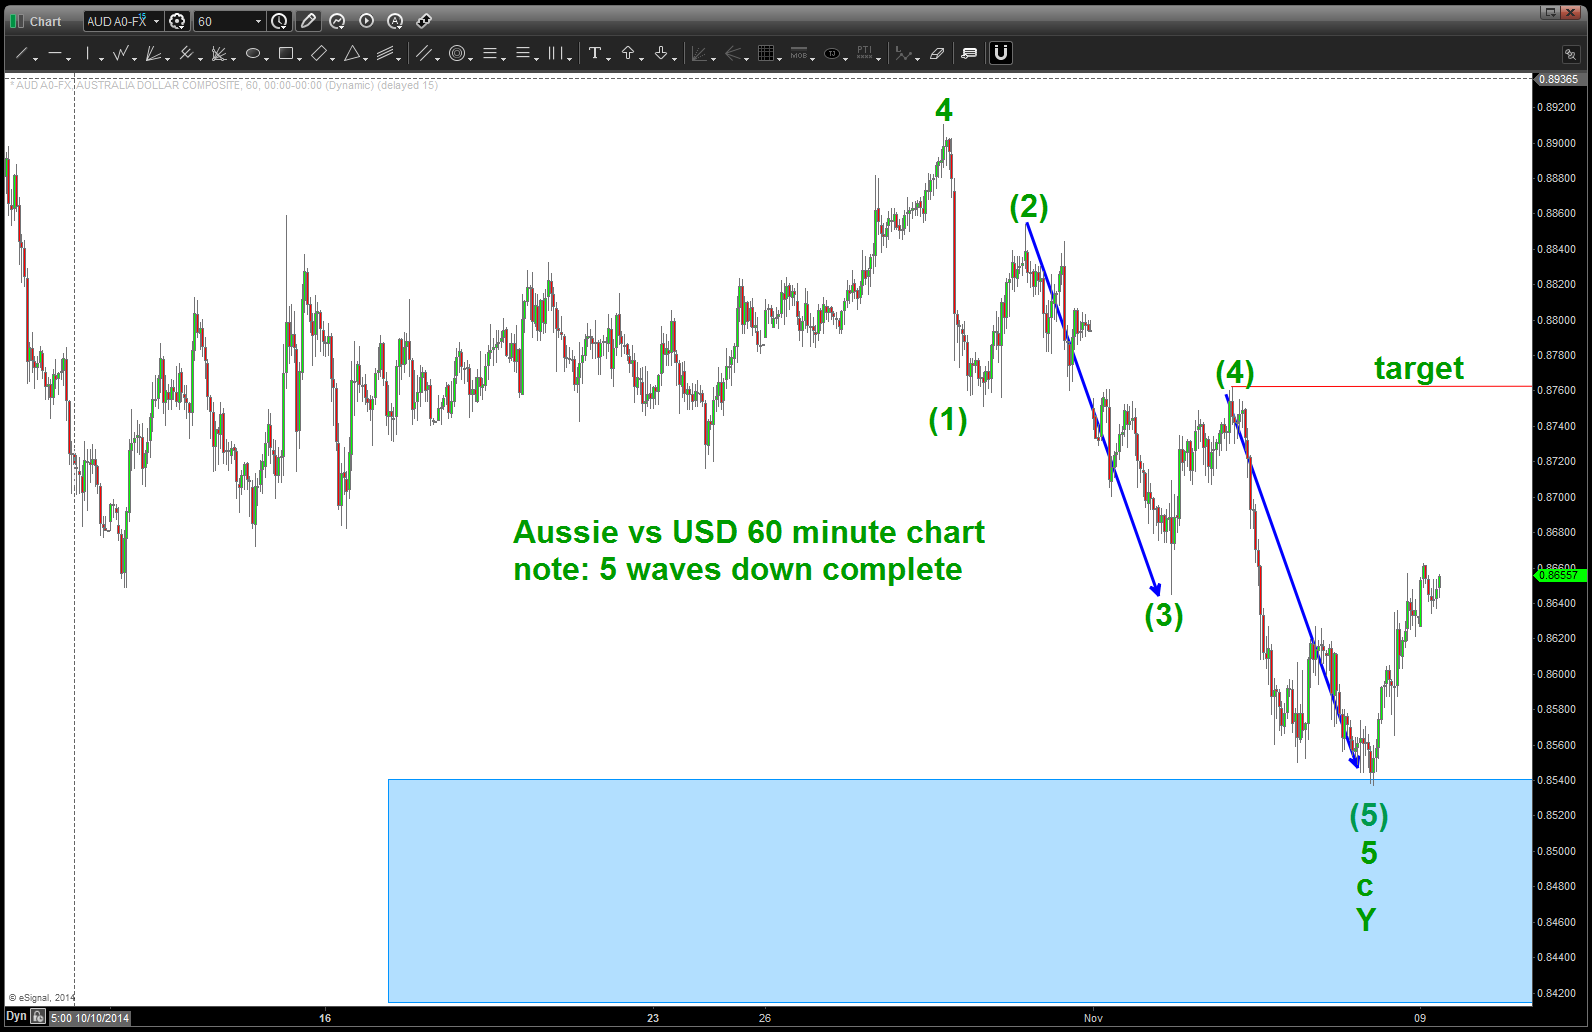
and finally, we’ll see the move down on a 60 minute chart is a clearly defined 5 waves.
so … there ya have it.
what to do? Well, our thesis is we are beginning a multi year move to take out the old highs from 2011. IF THAT IS CORRECT THEN WE ARE IN the first stages of the advance. the first move up (wave 1) will complete and then wave 2 will come and, more than likely, w/ a vengeance because everyone thinks the “old trend” is in play. That’s the BUYING OPPORTUNITY and price should never go below the low that was formed last week.
stay tuned …get ready to rumble.
Bart
EURCHF – heads up …
Posted on September 8, 2015 Leave a Comment
that was quite the DUMP when they moved the peg back on January 15 2015 … folks, the puppy dropped over a 1000 pips in one day.
now, it’s come up to a measured move and .618 of that move ….
not saying were going to dump 1000 points but this is the first risk defined area to give it a shot …
or just watch – I don’t like juggling dynamite w/ gorilla’s much ..
here’s the chart:

EURCHF moving up into a pattern
