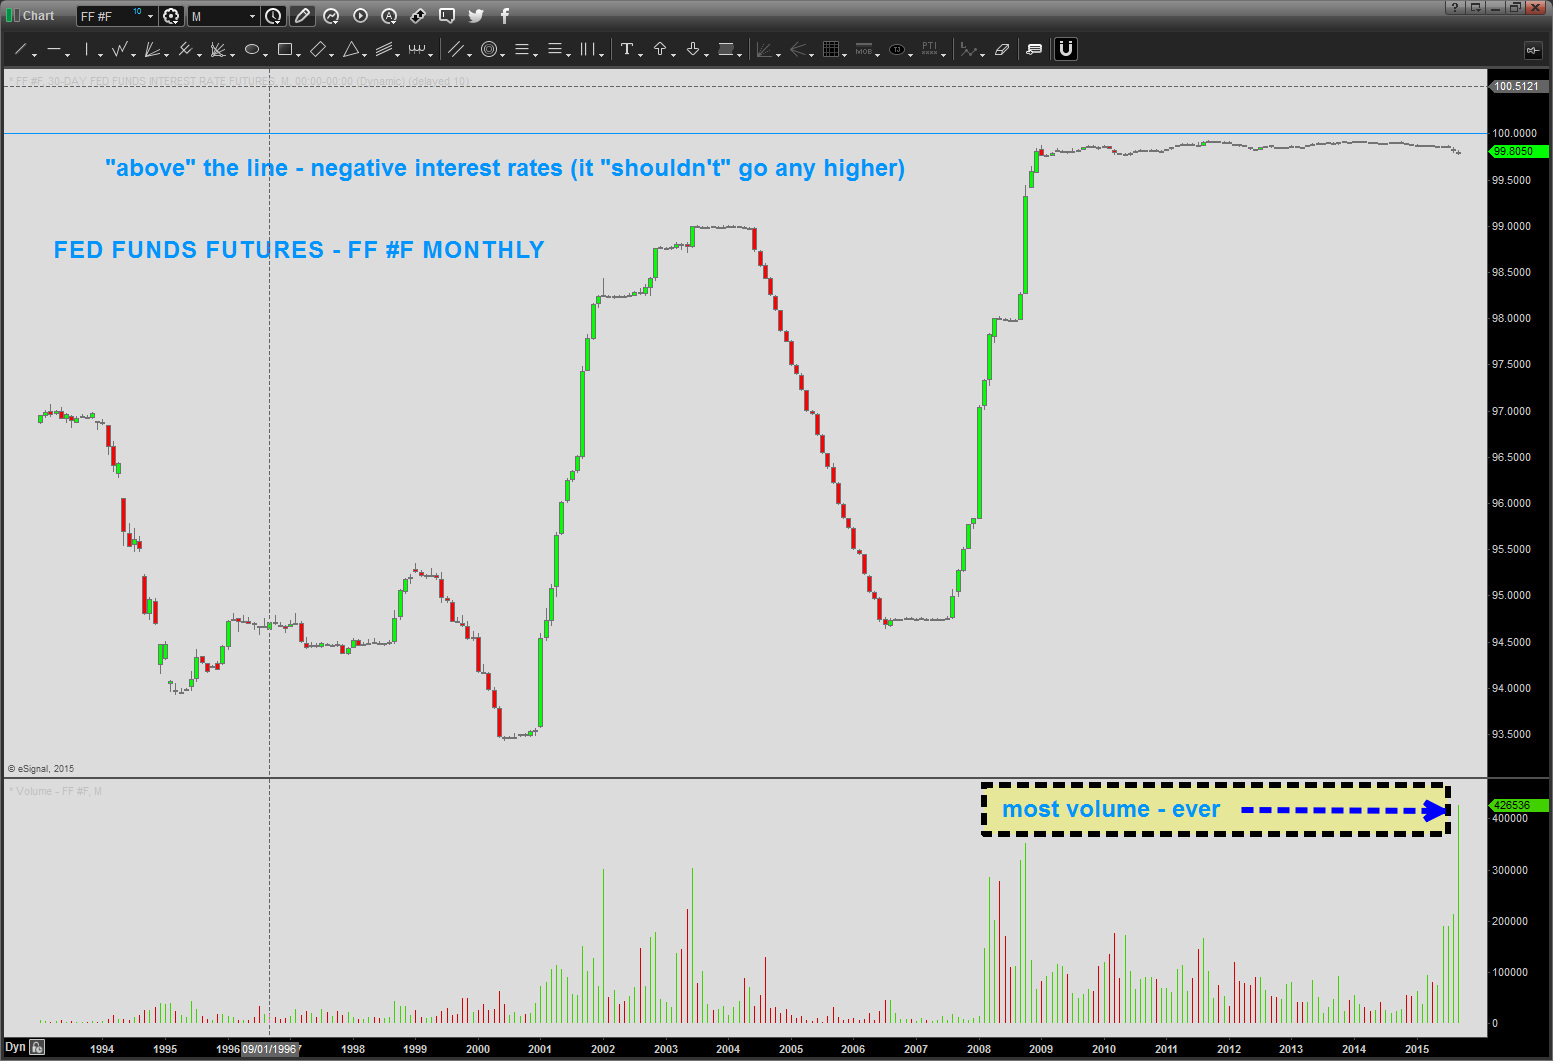
most volume, ever. is something a foot at the Circle K?
Folks, no clue which way interest rates are going w/ the FED.
do know their is 1.4 quadrillion outstanding derivatives, 100 fold increase in the money supply and – of course – 5000 year low in interest rates. so, in the big picture does what happens on Thursday really matter? Um, no … unchartered waters folks.
teach yourself how to look for supply and demand points – resistance and support on a chart and go for it …
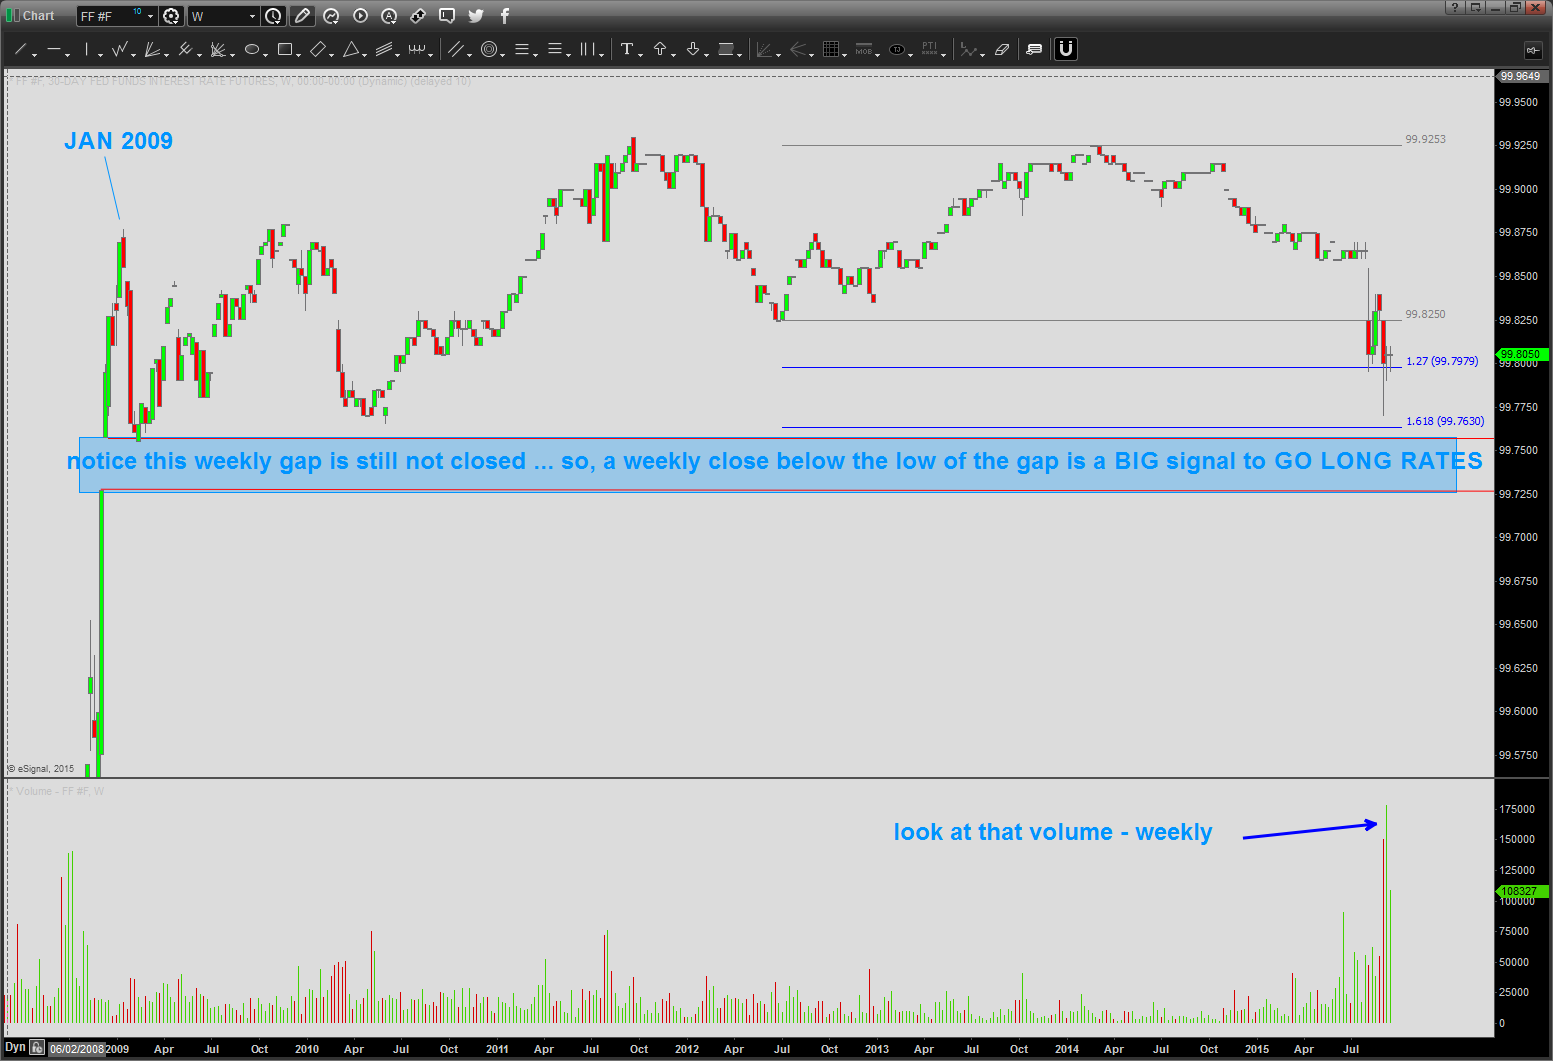
that being said, note we have the most volume ever showing up on the Fed Futures Monthly chart … we have a bottom that has been “chilling” out for 6 years so – again – if we get a weekly close below the daily gap (shown on the second chart below) rates are going higher … no matter what the Fed does.