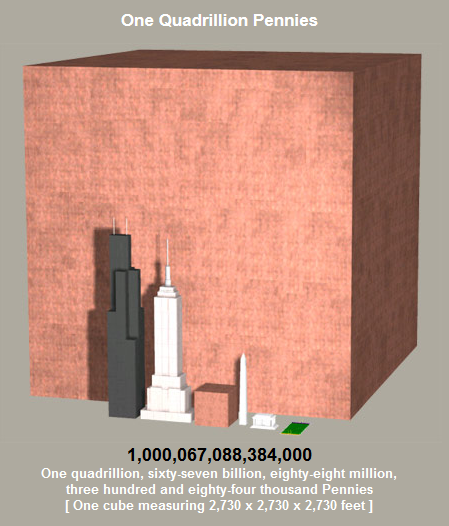
This is what a quadrillion looks like …
Posted on September 7, 2015 Leave a Comment
after looking at this chart … ask yourself, what is the counterparty risk of 1.4 Quadrillion Derivatives outstanding ….?
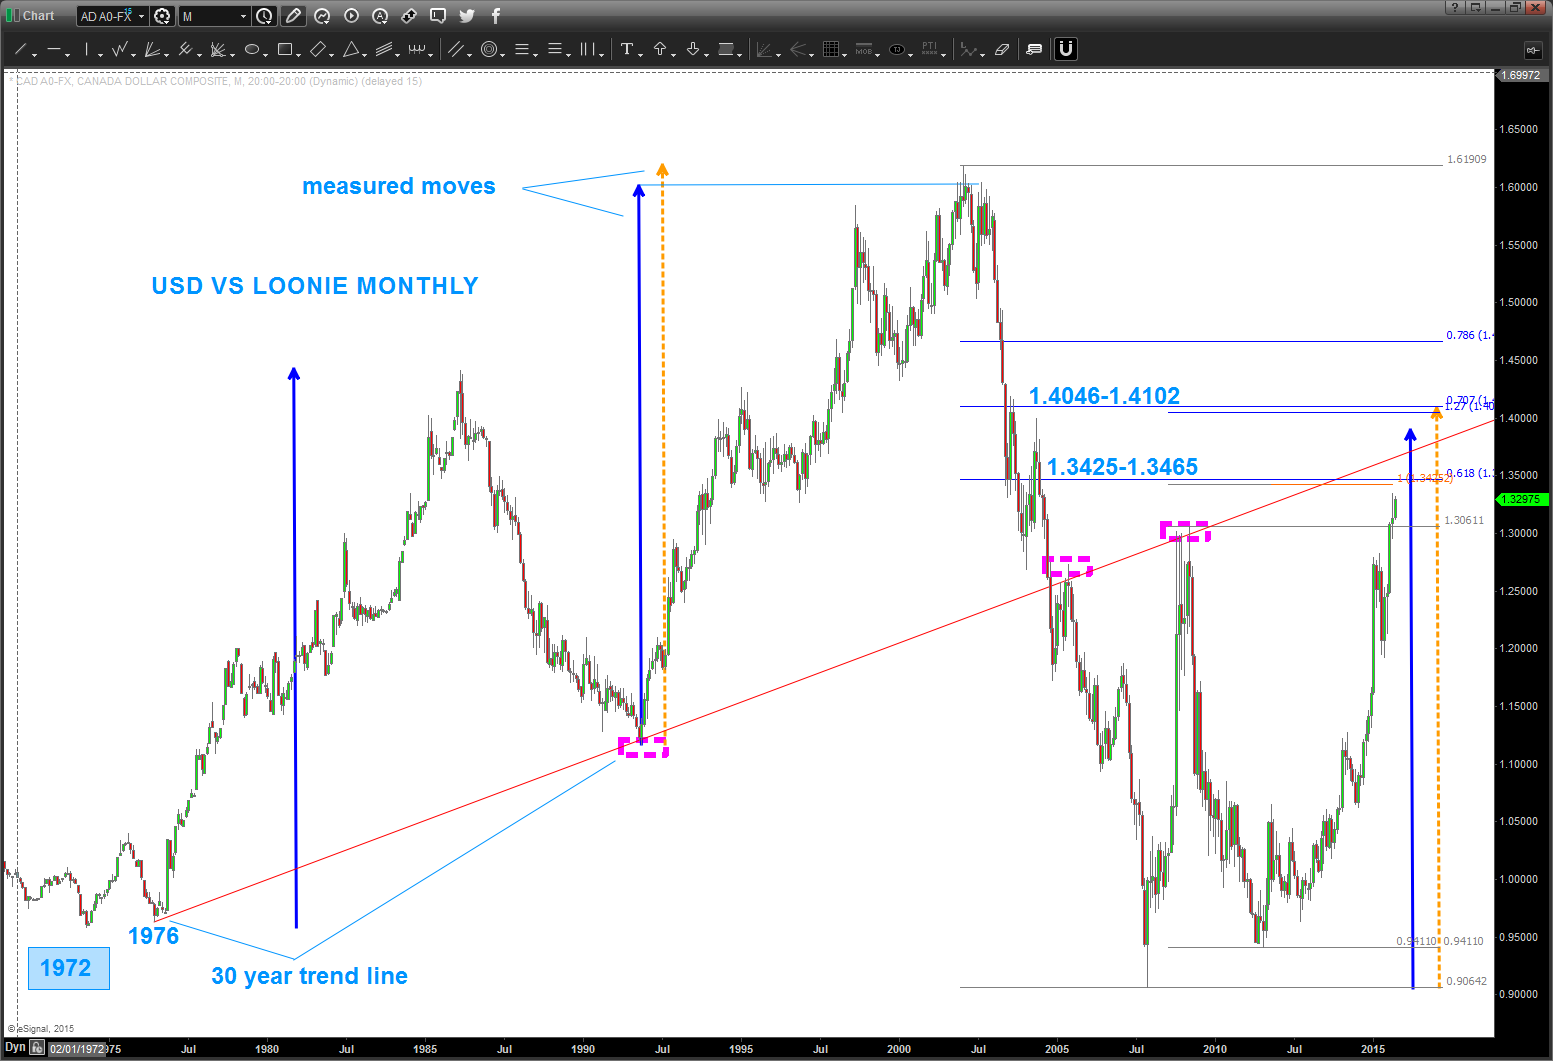
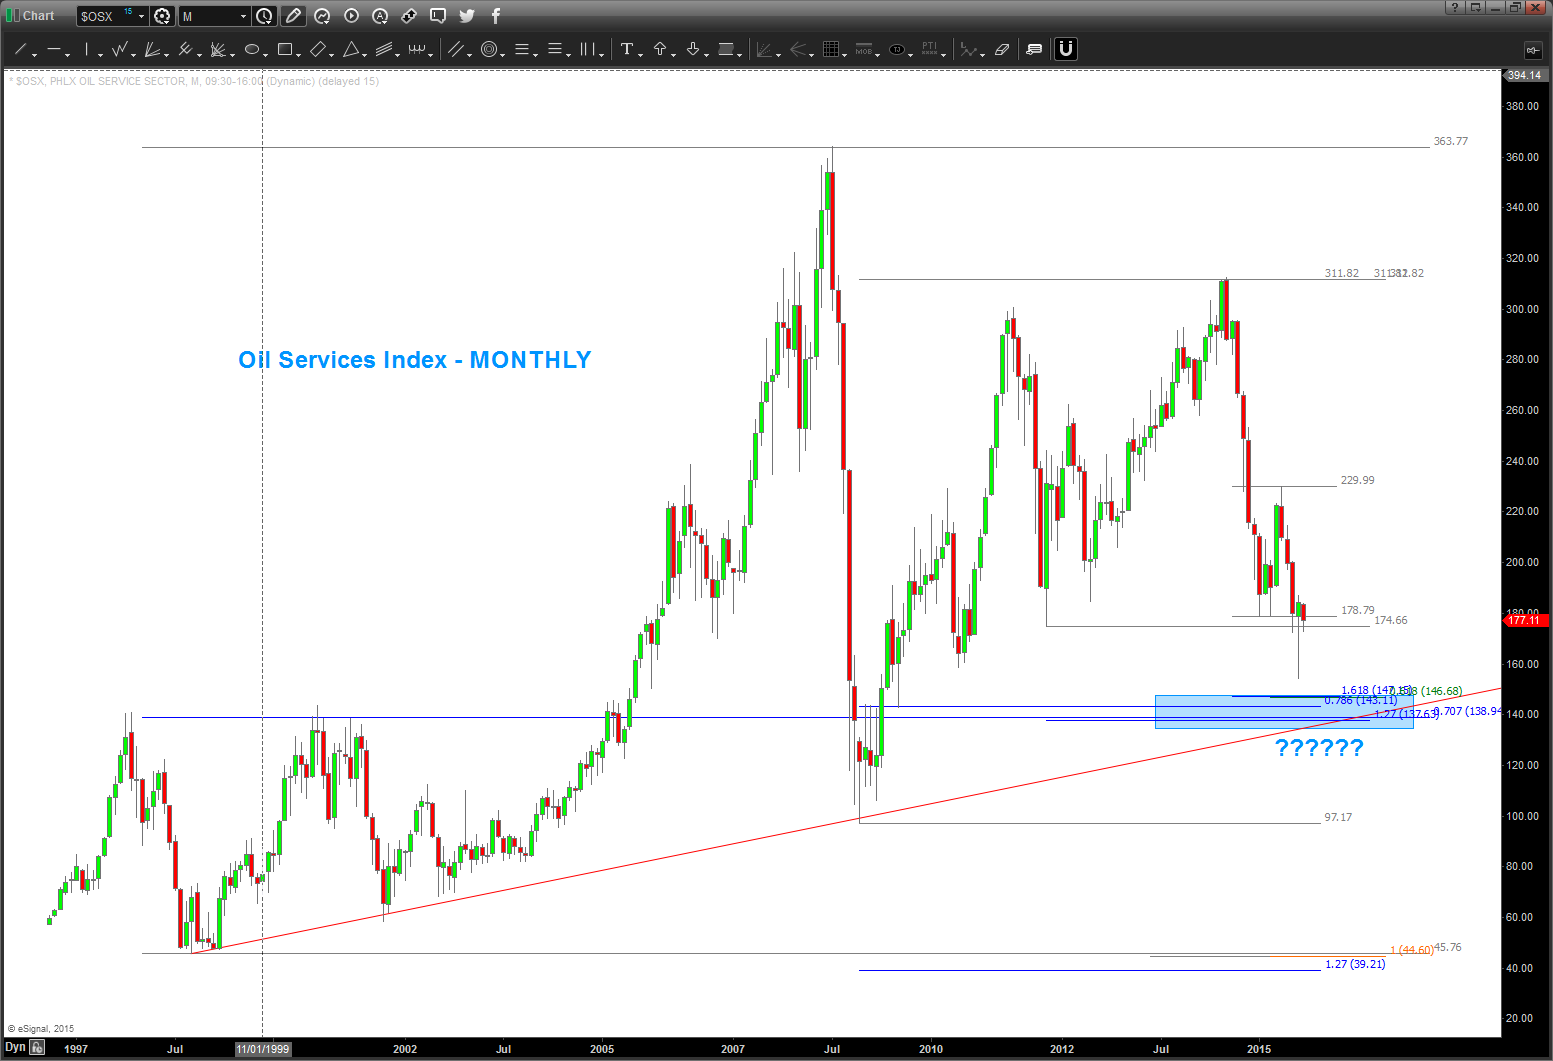
Loonie approaching crucial first target … watch Oil’s reaction to gauge
Posted on September 7, 2015 Leave a Comment
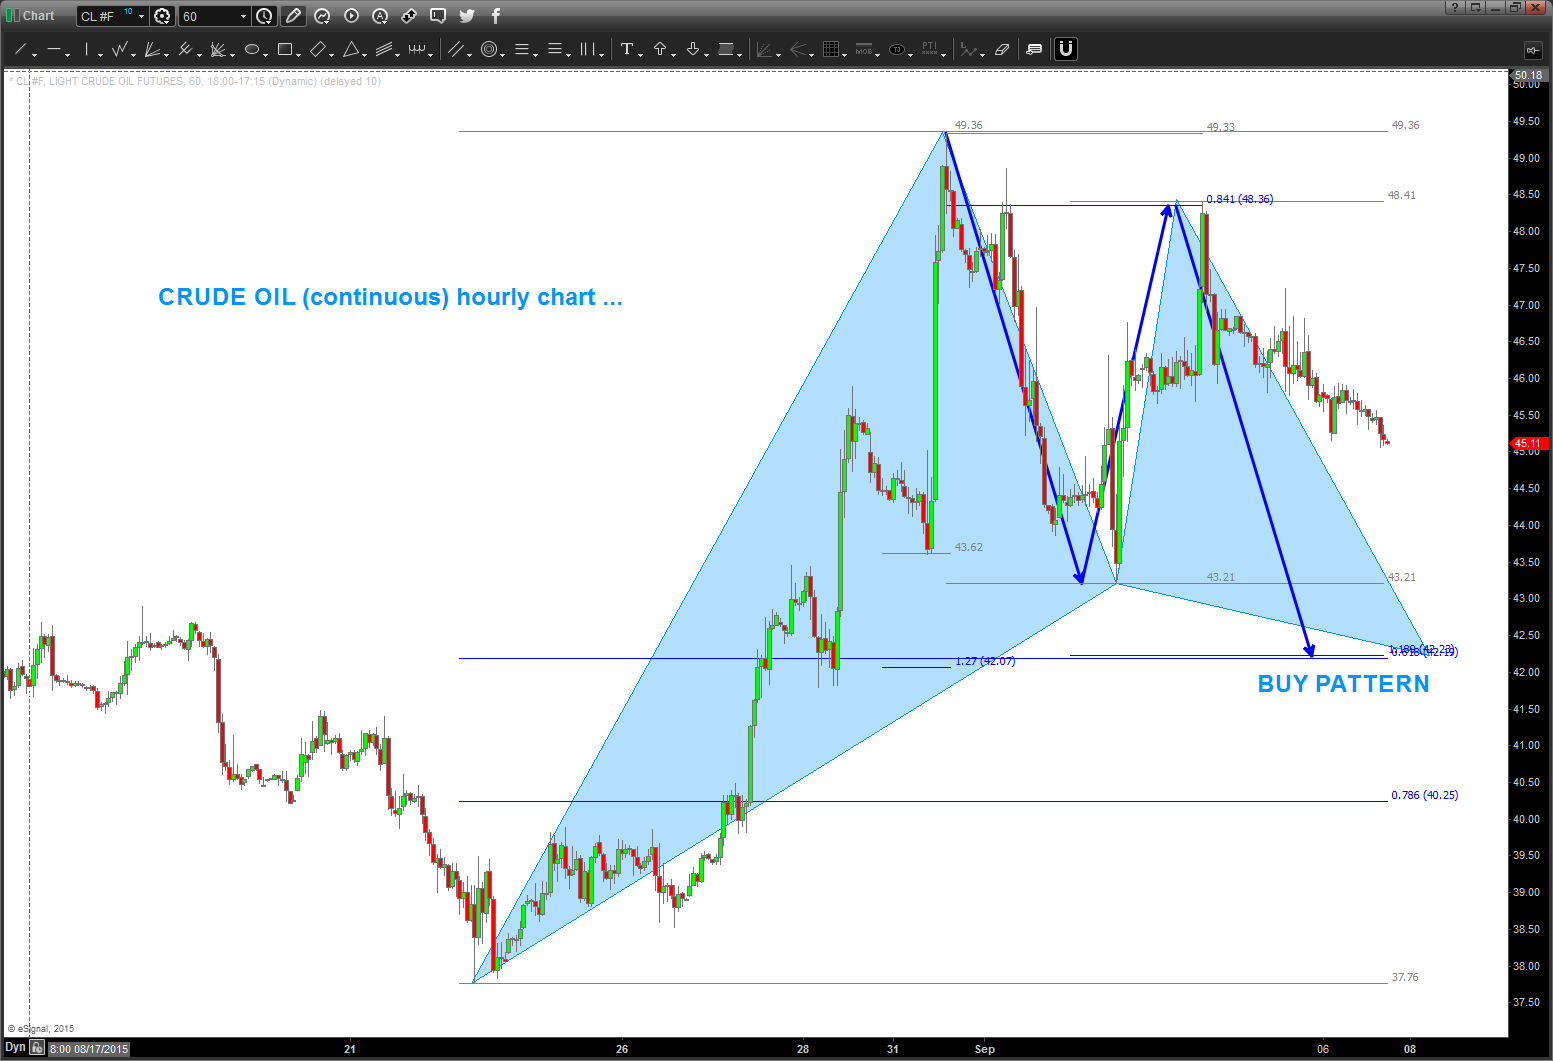
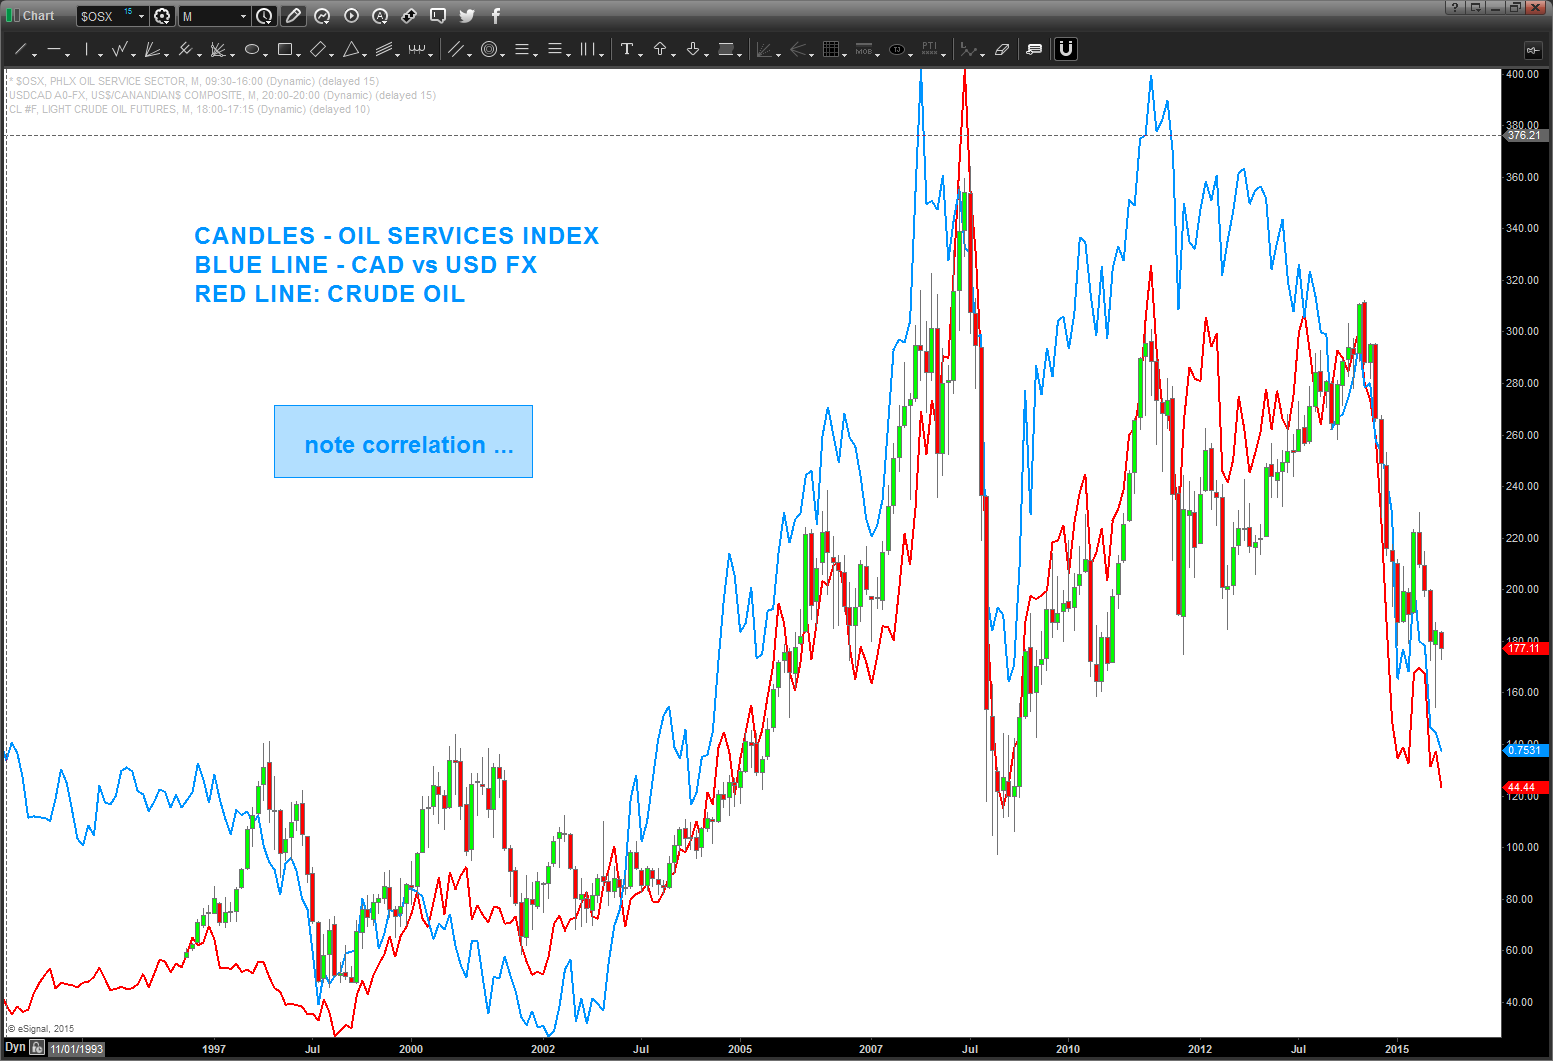
Crude Oil and the Loonie are pretty correlated …
Crude put in some strong thrust up but the Loonie keeps going lower against the dollar … so, let’s play the “if – then” game ..
IF Crude has put in a tradable bottom THEN the Loonie should not be far behind.
Below is a long term chart of the Loonie since it started the float against the USD since 1972.
- note the long term trend line that has rejected price action via the polarity principle. (purple dashed squares)
- note the long term measured move targets. (blue and orange dashed lines)
- note the PATTERN completing a little higher at 1.3425-1.3465.
- that’s the first major target on the Loonie vs USD.
- Over the coming days – WATCH CRUDE and particularly the intraday pattern shown below the Long Term Loonie chart ..
as a Spot FX trader, I’m not going to touch the Loonie Long until crude has proven to me it’s put in a bottom ..additionally, let’s keep an eye on the Oil Services Index.
continuing to follow the USD vs JPY YEN …
Posted on September 7, 2015 Leave a Comment
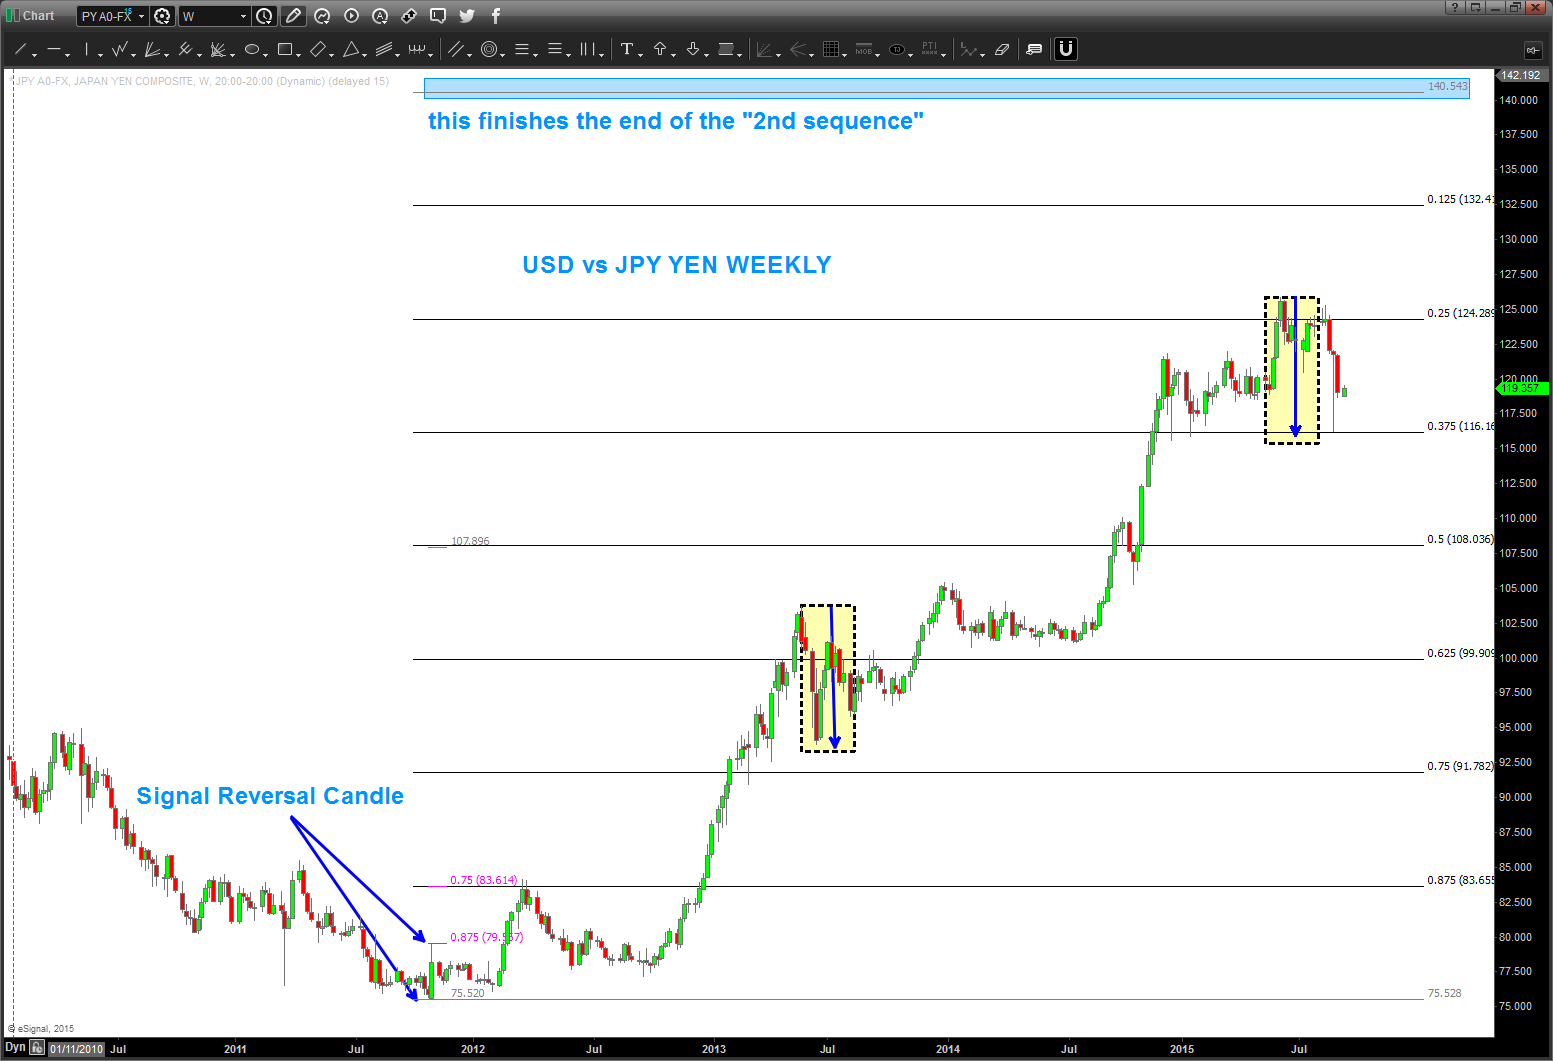
here’s the longer term look at the USD vs JPY.
note – we missed, by a few pips, the largest corrective move since the bull market began in 2012.
also, you’ll see the 1/8th projection method taught to me by my friend and mentor, Mike Jenkins.
this most recent correction has been bumping all over the .375 (3/8th) projection …
not much movement overnight in the Asian Session and little in Europe … US closed so we’ll see what’s going on tomorrow AM.
any wonder why the DJIA futures are up? Yen has weakened vs the US Dollar … watch this correlation.
B
the YEN, the S&P 500 and the world of ‘if – then’
Posted on September 5, 2015 3 Comments
my friend and fellow chartist and trader did an awesome post on the JPY and the US Equities: http://allstarcharts.com/its-the-yen-stupid/
below is a chart (intraday) showing the strong correlation …
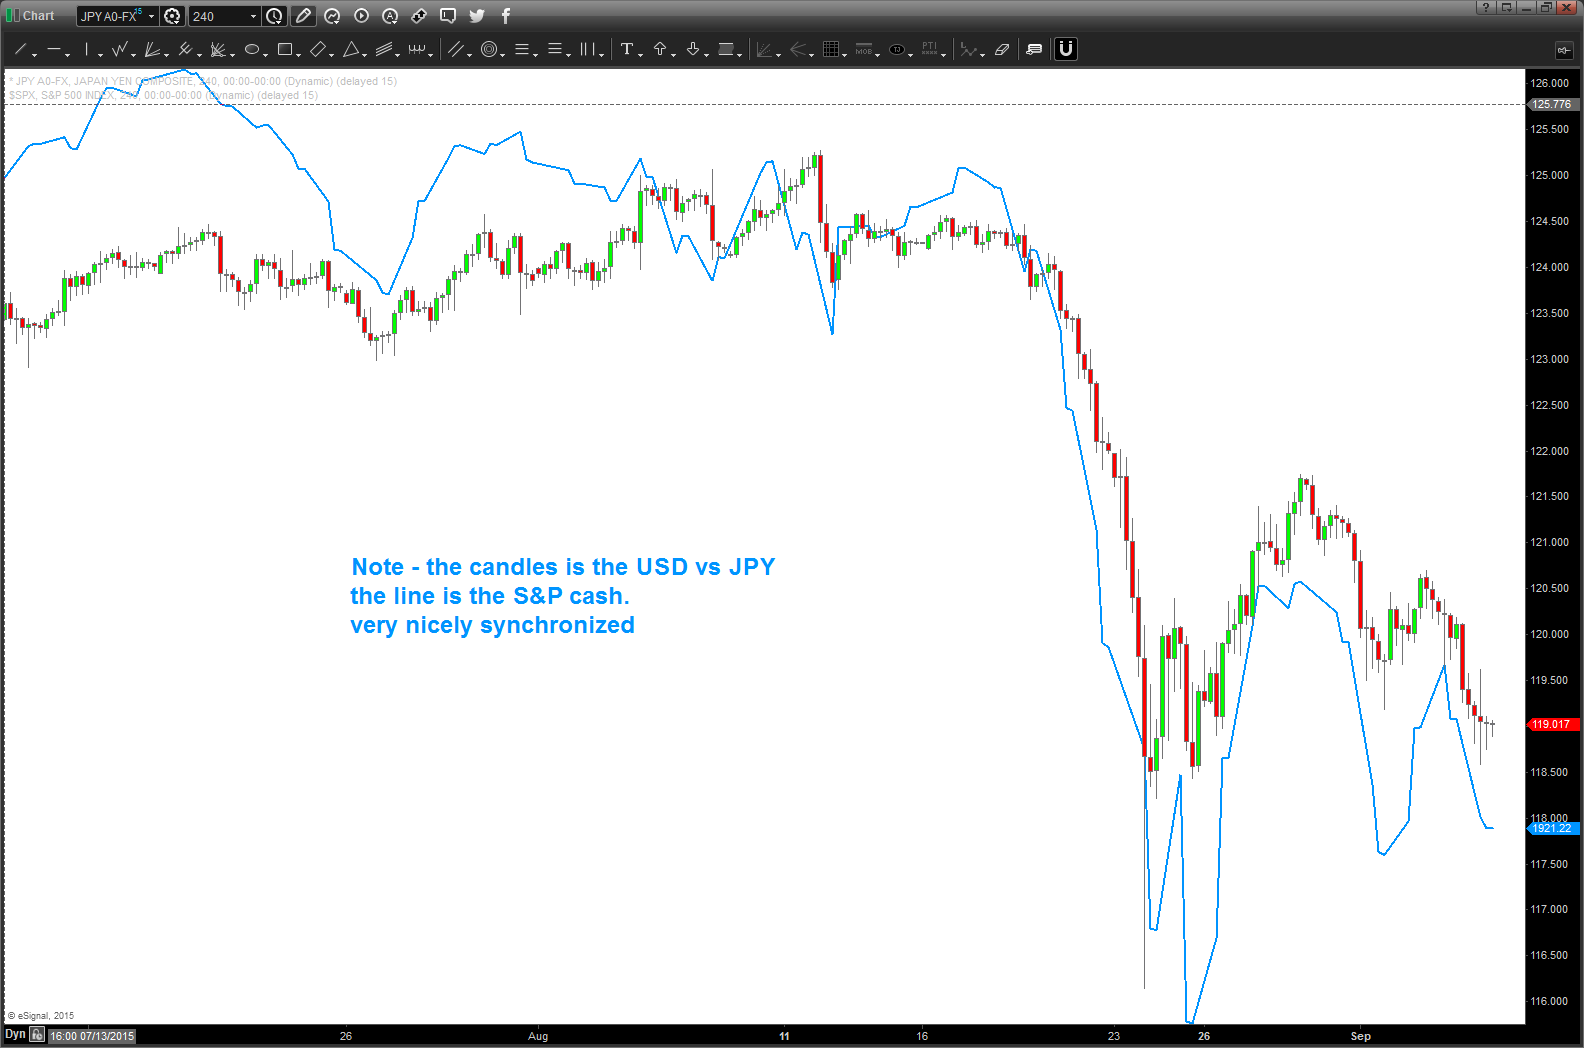
note the correlation of the USD vs YEN and the S&P 500
so …IF THEN ..
IF the correlation remains intact – probability is it does but you never know THEN a BUY pattern appearing for the USD vs the JPY would signify SUPPORT for the US Equities complex.
so, here’s the BUY PATTERN I’m going to try and play on Sunday night …
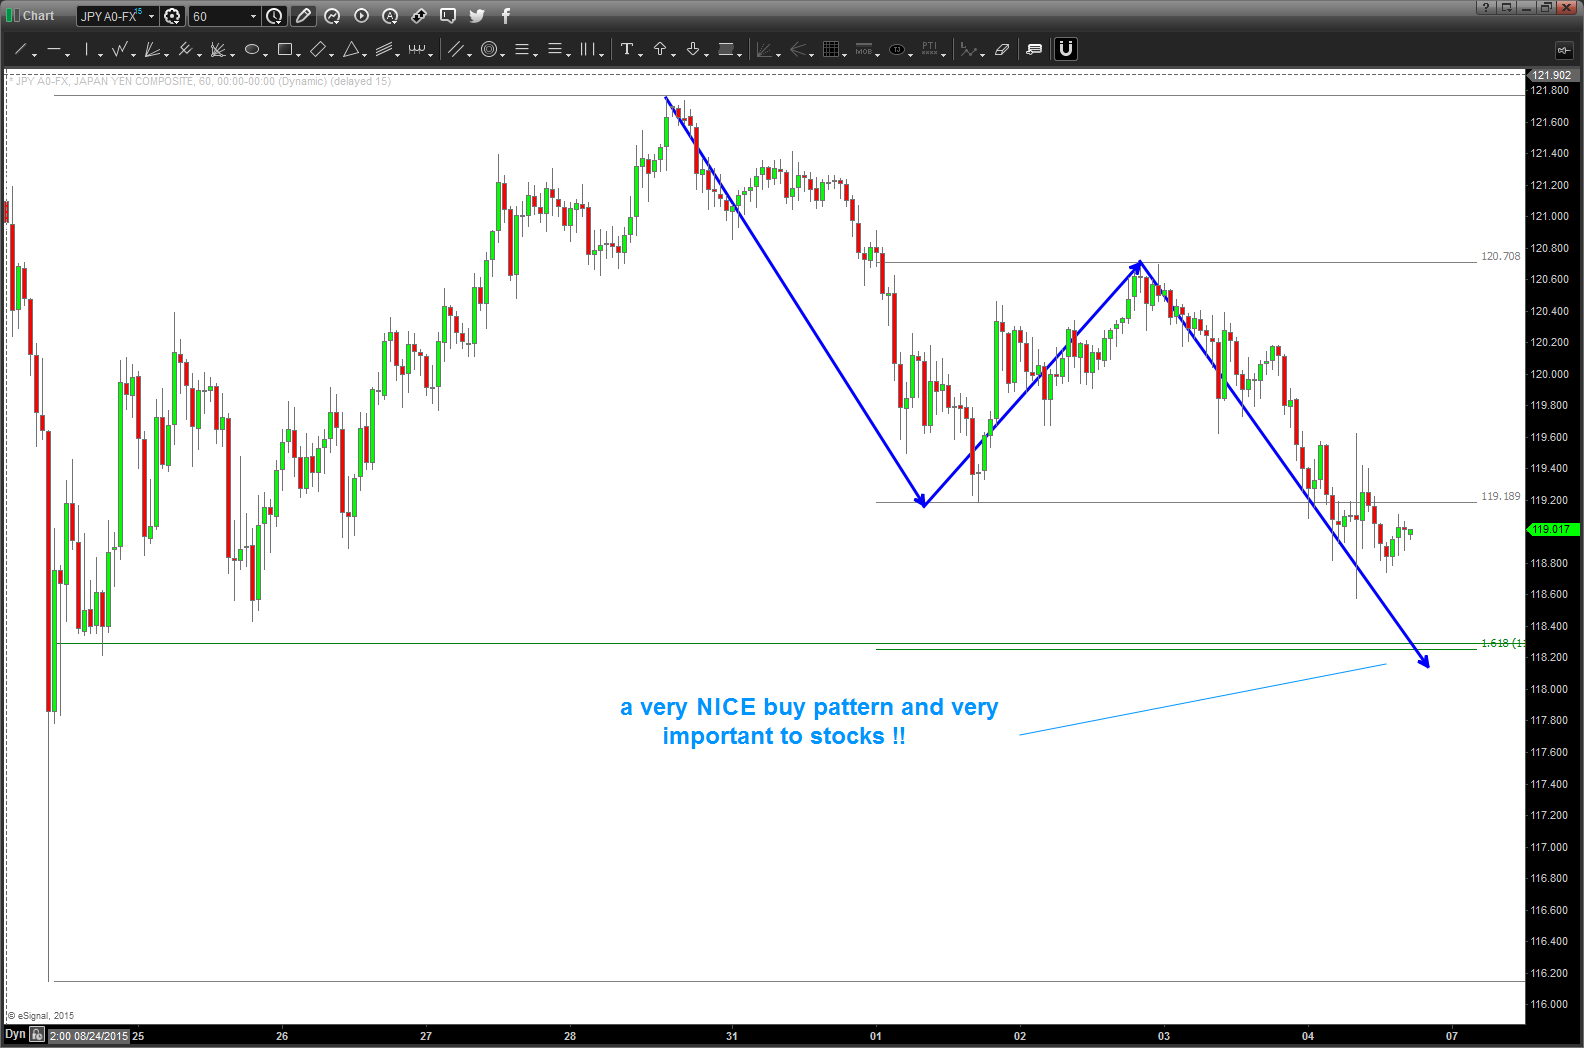
BUY pattern for USD/JPY. IF it works then “support” for US Equities?
pay attention to the world of FX …and, particularly, this BUY pattern.
IF it works THEN equities SHOULD find support.
IF it FAILS then … failed patterns aren’t a pretty sight and I’ll leave it at that …
118.20 on the USD vs YEN gonna be key.
Bart
rates ..
Posted on September 5, 2015 1 Comment
watch for a WEEKLY closing below to signify the 5000 year low in interest rates is over.
key folks …make it easy and don’t listen to all the talking pundits.

Fed Fund Futures
WMT set up …slow down and digest the logic… this is important, I think
Posted on September 1, 2015 Leave a Comment
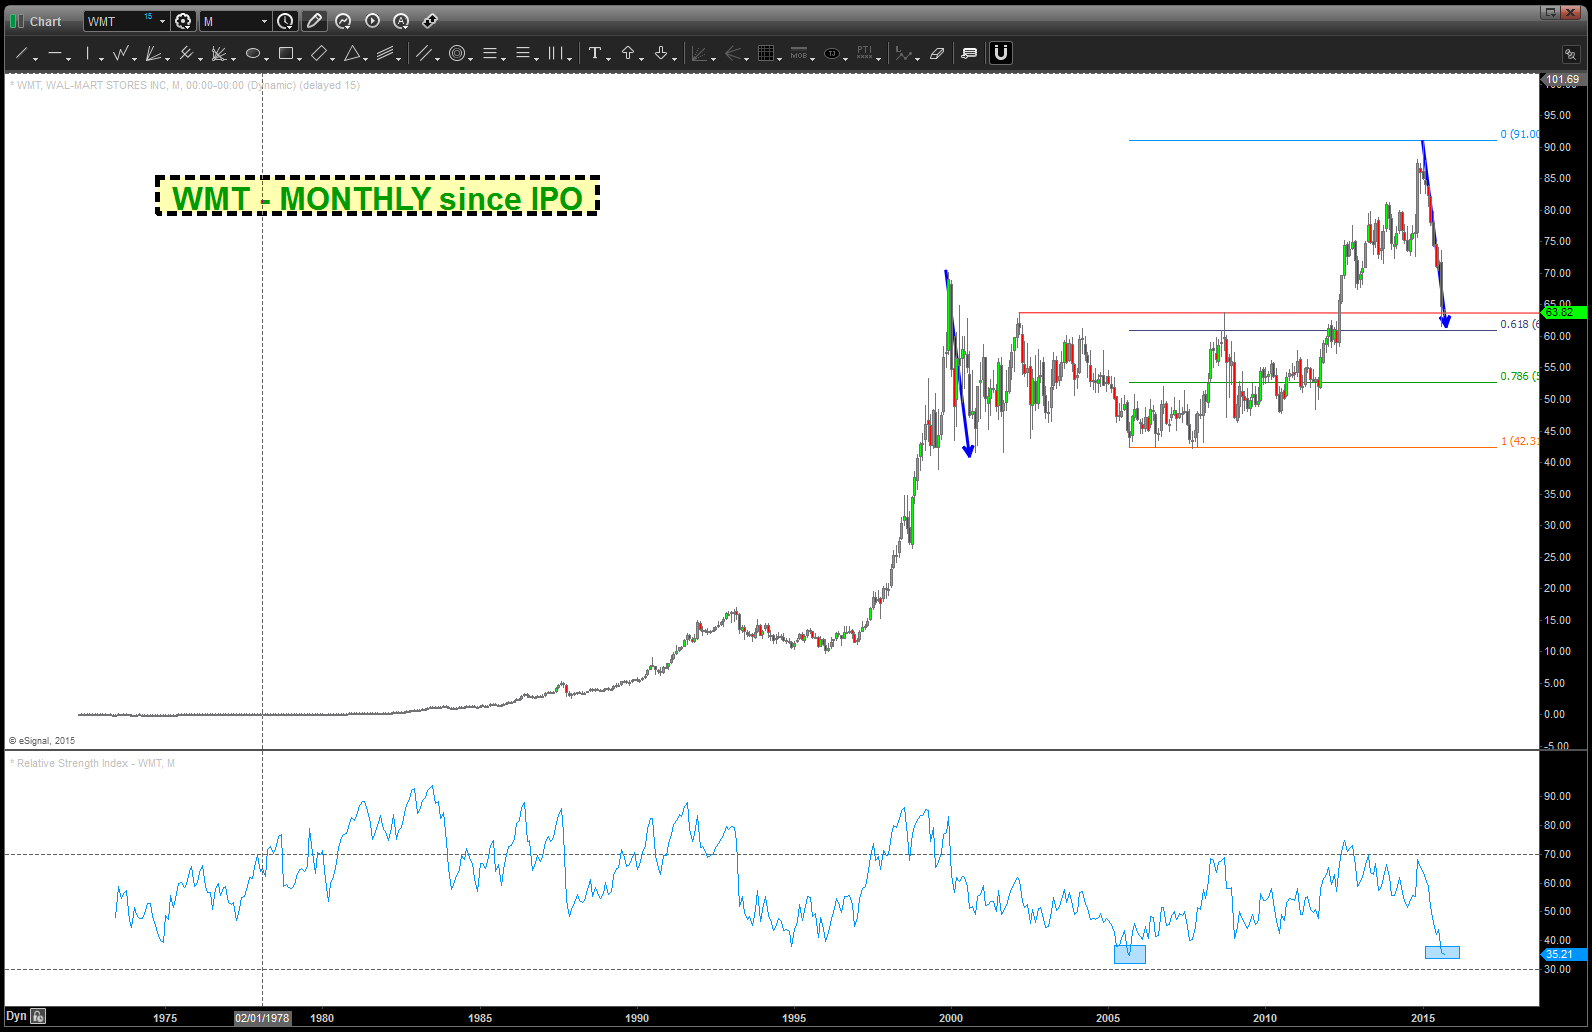
BUY WMT (?)
- note – measured move ( in price and time), polarity and an extension target ….
- needs to stop here and start back up, IMHO.
- we are also sitting on a former resistance zone of 15 years folks .. if break down from here – we’ll call that a “what’s the fighter thinking” moment …
- here’s the charts:
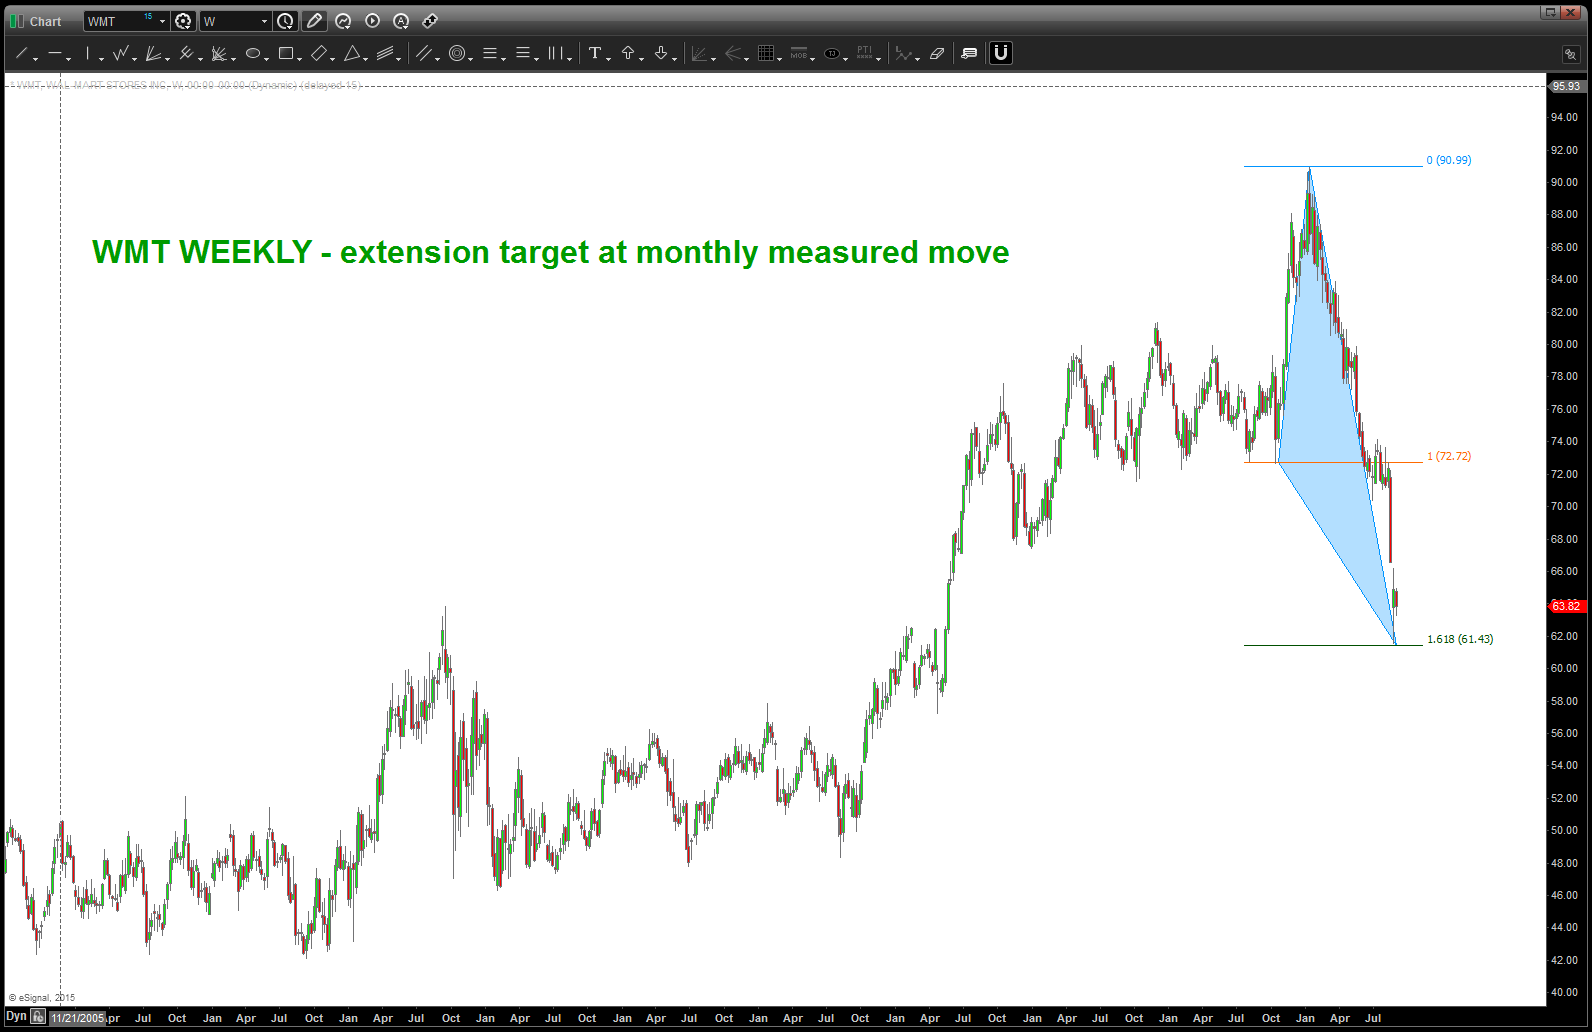
with the above being posted I’m going to try and present the plausible IF-THEN scenario using PATTERNS and ratio analysis
- Ratio Analysis is VERY powerful and when coupled w/ PATTERNS it really gives you a flavor for institutional positioning and money flow.
- Certain stocks “own” the world of safety, risk-off, “if the word ends tomorrow I buy xxx”, etc.
- $WMT is one of those names. A lot of the public shops at $WMT.
- So IF WMT is strengthening from a relative strength perspective then institutions are taking risk off … if it’s losing strength then risk is on …
- How do we know when to “wax on” or “wax off?” (Pardon the Karate Kid pun)
- HINT: PATTERNS.
- Here’s the text books SELL PATTERN on the SPY/WMT ratio
- What’s this mean?
- IF the PATTERN works then WMT is going to be a “risk off” asset and the SPY will lose relative strength to WMT.
- What’s this mean?
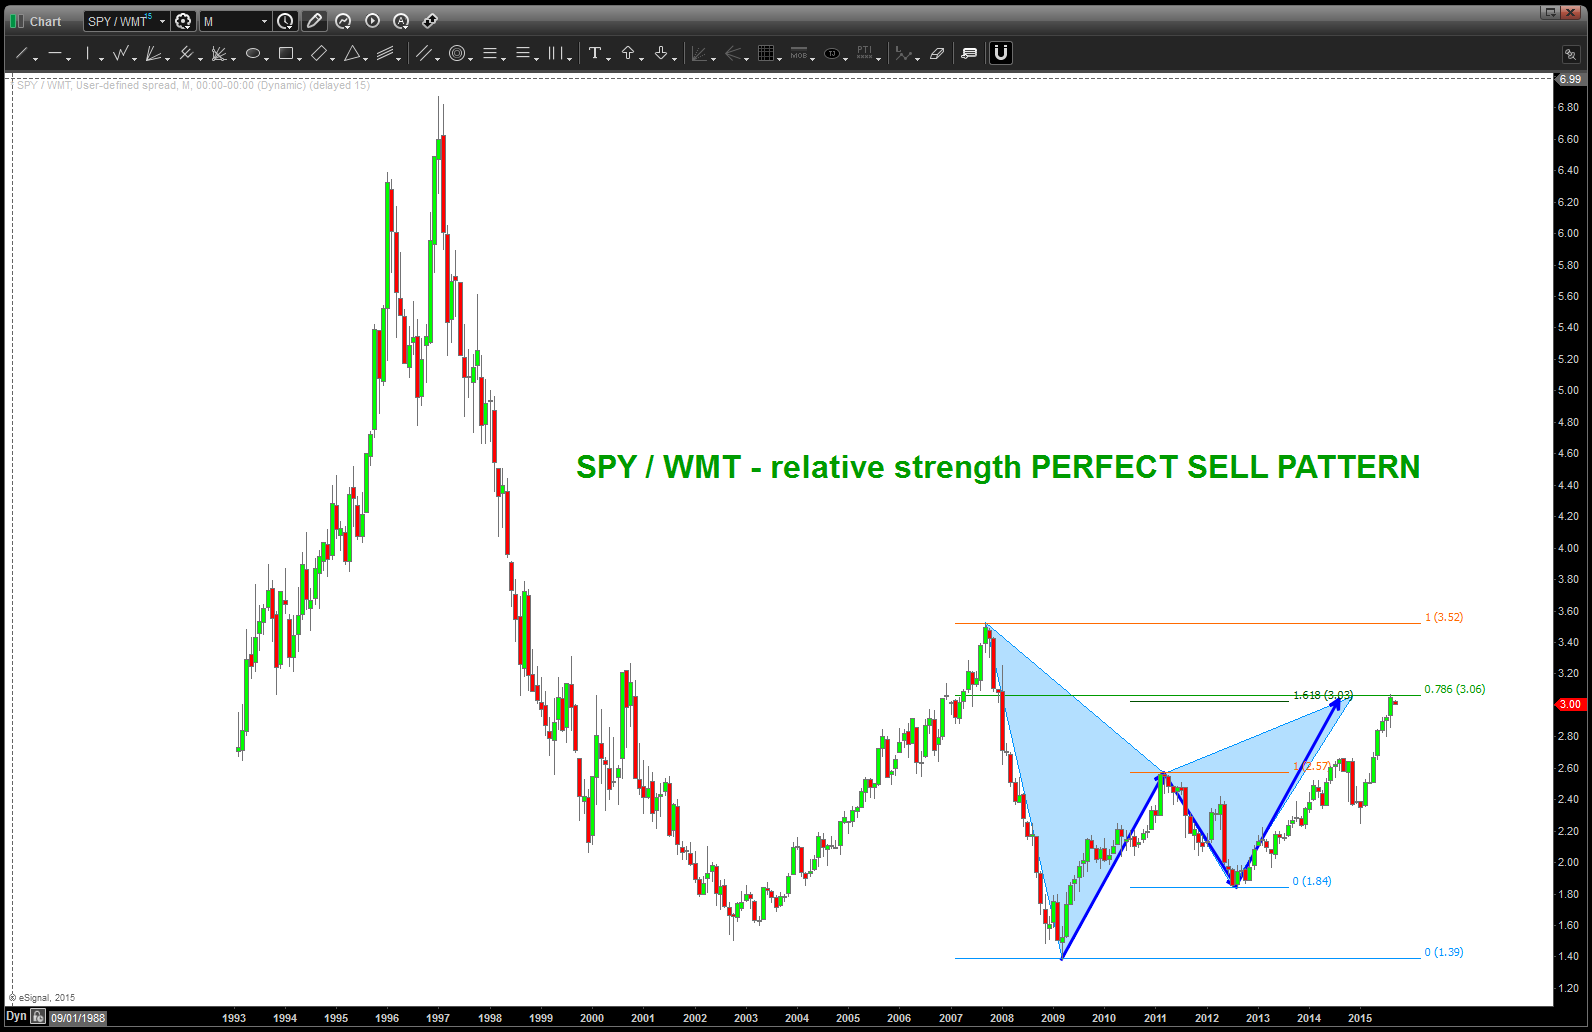
CLIFF NOTES: why is this important? See chart below … EVERY TIME since 2000 that the ratio inflected the SPY did at the EXACT TIME.
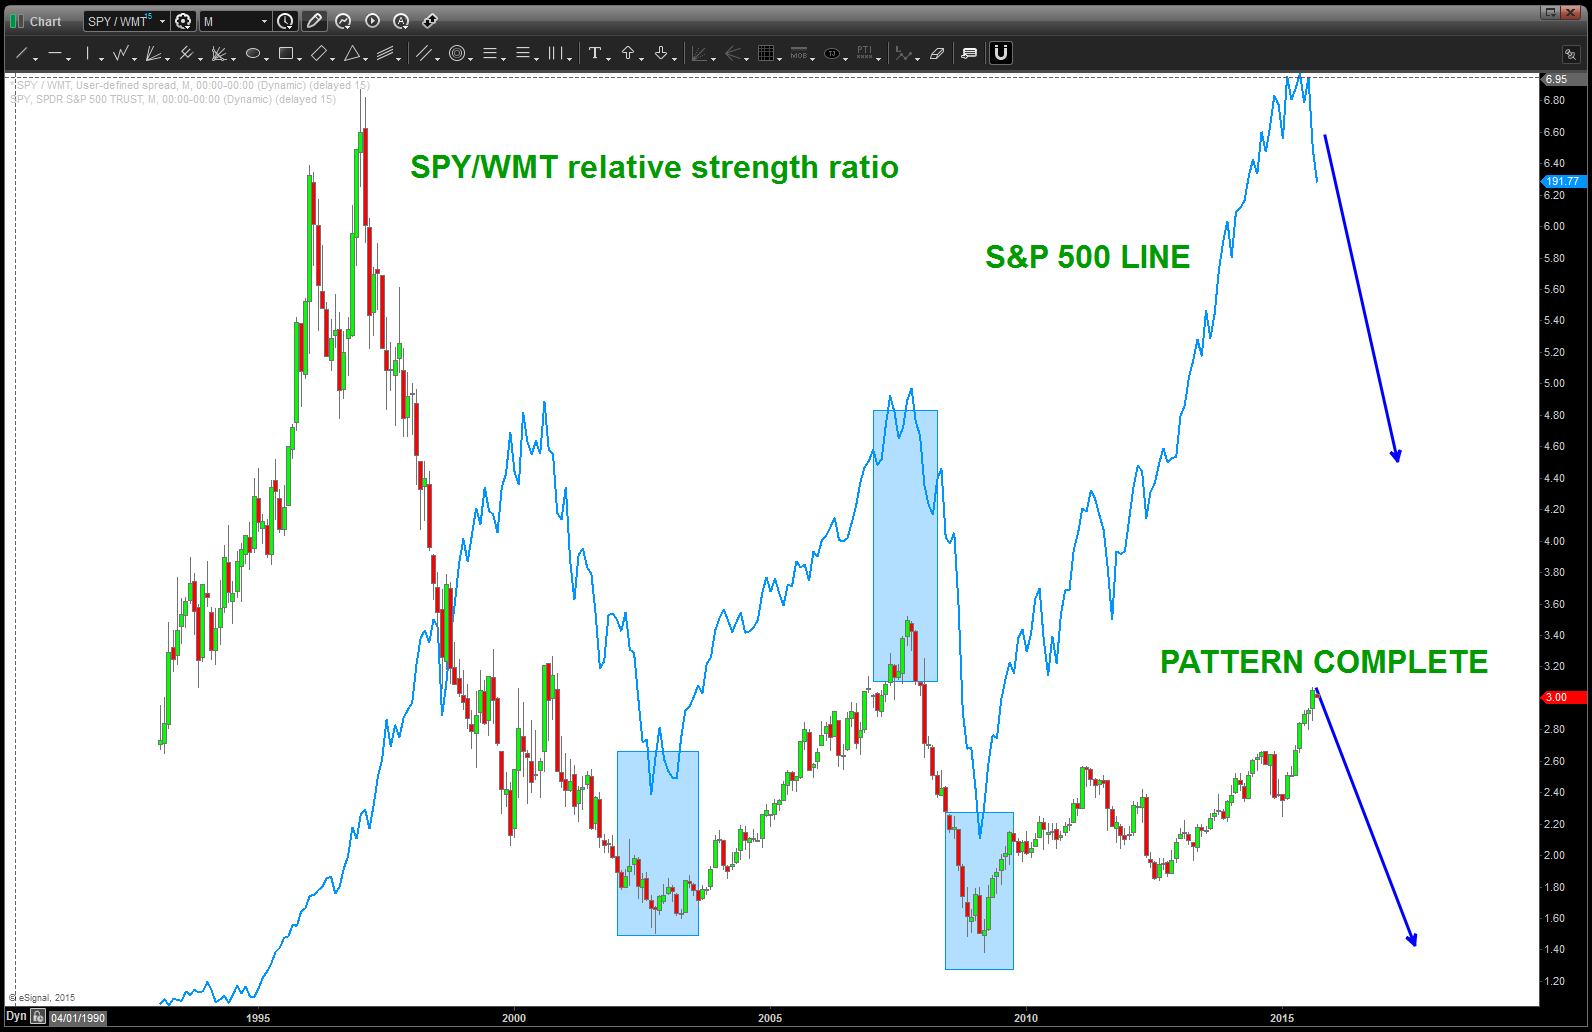
SPY/WMT ratio w/ SPY overlaid (blue line)
SO – “if then” w/ me …
IF this pattern holds then the US Equity market is in on the magical mystery tour … step right up, come this way.
IF it fails (the ratio goes higher) then this correction “should” end soon and game on ….
HINT HINT: watch monitor this ratio, closely.
THIS IS WHAT I SEE AND NOT WHAT I BELIEVE ….
Cheers and rock on, ok?
Bart
grab a ticket .. having fun w/ the gang @seeitmarket
Posted on September 1, 2015 Leave a Comment
MR TOADS WILD RIDE … the magical mystery tour!
http://www.seeitmarket.com/are-the-financial-markets-turning-into-mr-toads-wild-ride-14713/
man, can you imagine be SHORT the VIX? Ouch ..
Posted on August 29, 2015 Leave a Comment
SVXY is a short the VIX ETF.
it has crashed. ouch.
anyway, wanted to show you a VERY powerful and simple PROJECTION technique. On a “MONTHLY” chart use the first Signal Reversal Candle (the high of the low bar is taken out on close for UP and vice versa) and subdivide it by 1/8ths. My mentor Mike Jenkins showed it to me .. .www.stockcyclesforecast.com
enjoy the chart …
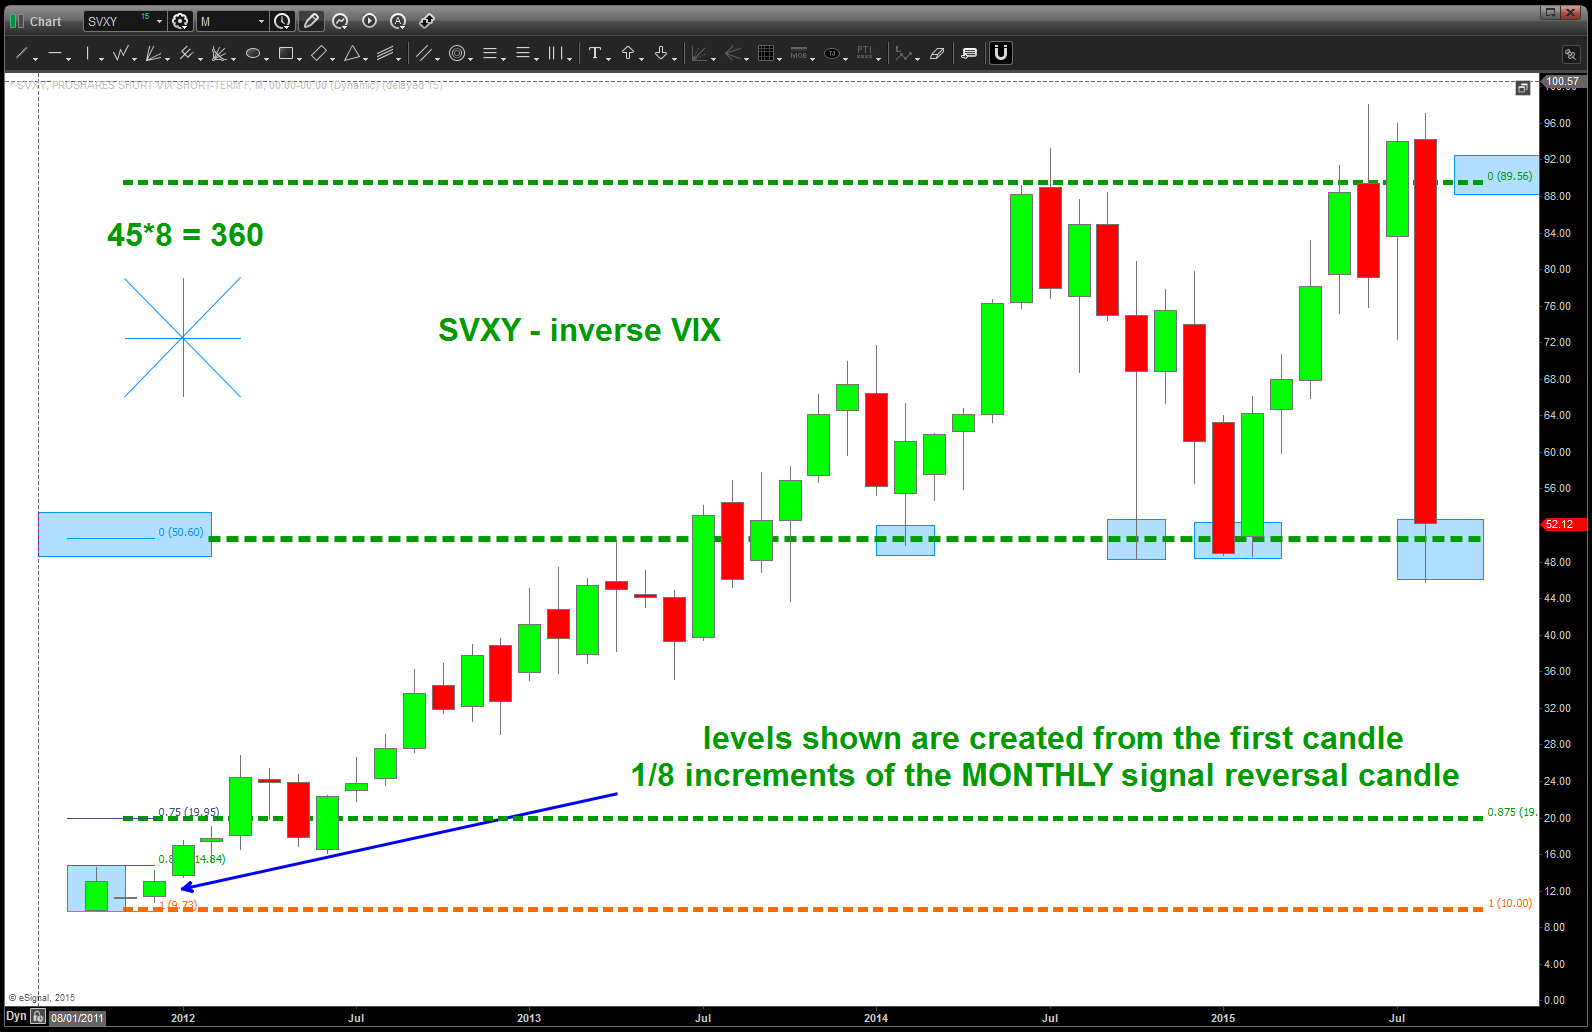
SVXY w/ 1/8 signal reversal candle projection technique
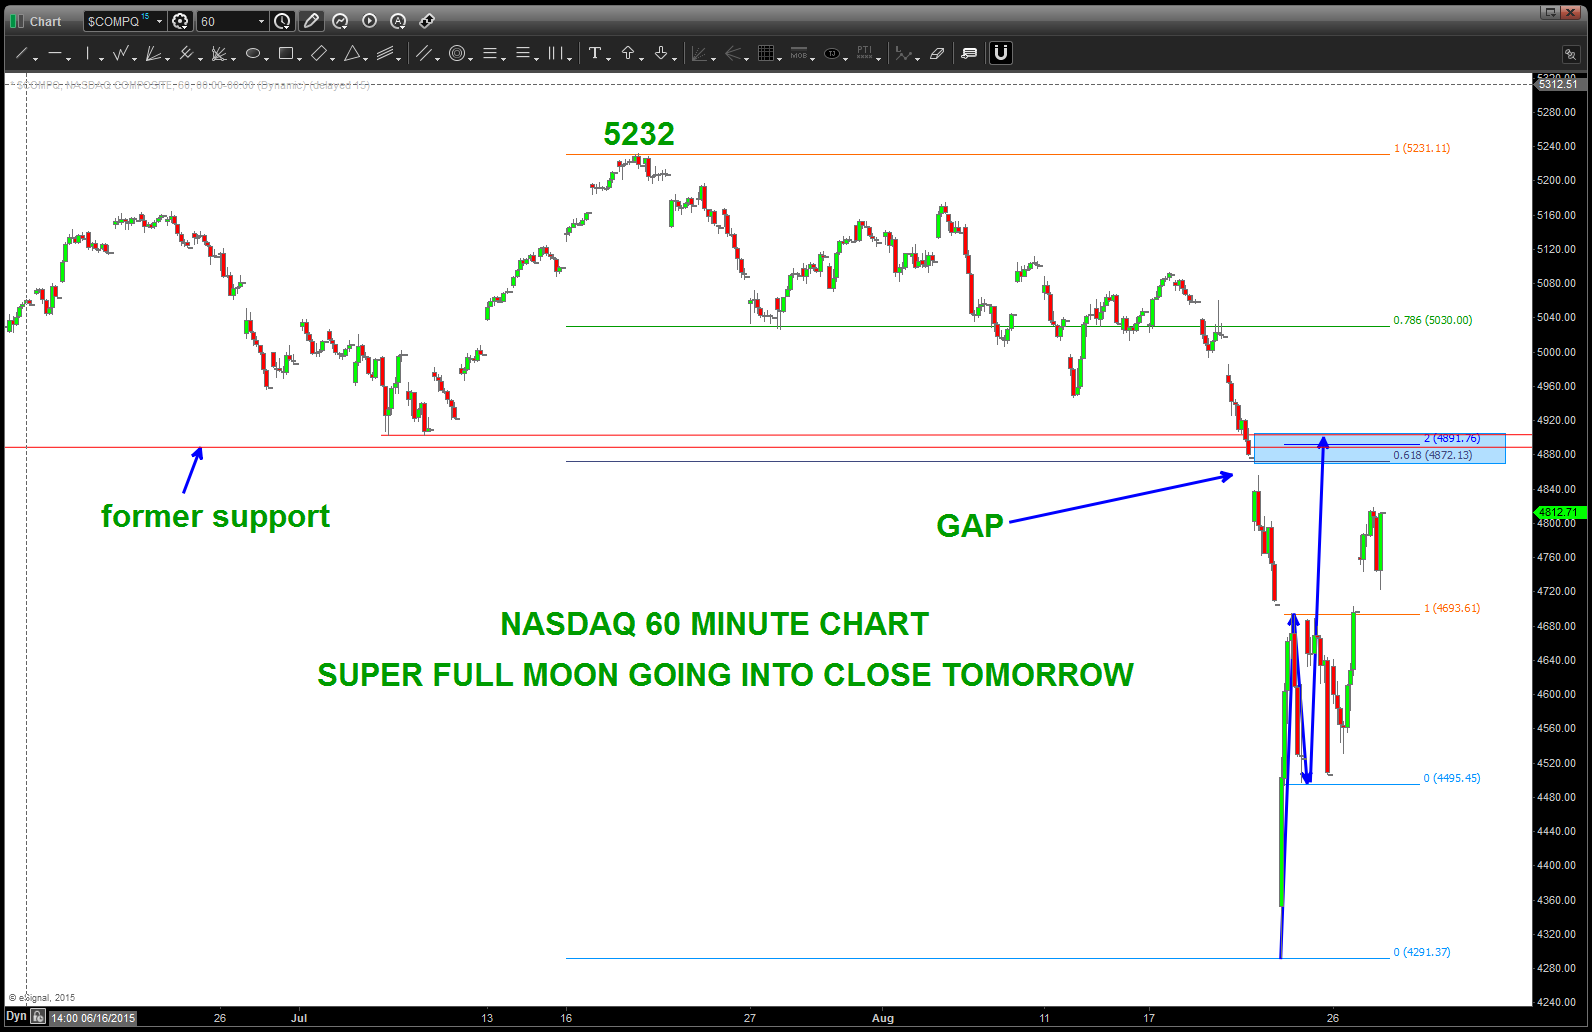
Super Full Moon Going into Close tomorrow
Posted on August 27, 2015 Leave a Comment

Super Full Moon going into the close tomorrow … the only thing I’ll point out is 1) it’s going to be volatile (up or down) and we have a sell pattern on the NASDAQ shown below. What does this mean? Simple folks…it means I know exactly where I’m wrong.
If PATTERN works then NASDAQ should start to sell off …
If PATTERN fails then we go higher …
Simple?
B