Dow Jones Industrial Average – SELL pattern complete
Posted on August 27, 2015 4 Comments

the markets reaction in/around this level will give us a heads up for the next directional opinion (IMHO)
When PATTERNS fail, they almost always come back to touch it and then CONTINUE (UPDATE)
Posted on August 27, 2015 Leave a Comment
UPDATE: is “I’m not sure, but suspect” good enough? We went thru the level and closed below it BUT the next day moved strongly higher. A weekly close above the old pattern is good but my perspective is these old patterns work – pretty exactly.
plus, it looks like we aren’t complete from a wave count.
going to play it safe and look for further downside.
guess we’ll see ….
we now have a GREAT opportunity to see if the 10000 level holds on the German Dax. I blogged about it here: https://bartscharts.com/2014/12/14/german-dax-voo-doo-is-a-wonder-to-behold/ and at the time it was finishing a MONUMENTAL pattern from the all time low 30+years ago. Guess you could say it “worked” because it held the market at that level for over a year and then it exploded higher earlier this year.
now, one of the “axioms” of PATTERN recognition is when a PATTERN fails (which it ultimately did a year later) the market will, invariably come back to touch it and then continue in the direction of the break.
yes, I know, sounds CRAZY but as a PATTERN dude, you HAVE to TRADE WHAT YOU SEE not WHAT YOU BELIEVE .. what do we have?
A PERFECT pattern on top of a former long term pattern …this is what we SEE:
- .618/.786 overlap retracements
- 1.618 extension
- projection into the area
- measured moves w/ the projection (note the blue arrows)
- ALL ON TOP OF A FORMER PATTERN
so, time for the IF then …
- IF this pattern holds then the German Dax should move higher …. perhaps even taking out the old high. I know that belief is crazy .. but it’s what I see.
- IF THIS PATTERN FAILS – it ranks up there as a “big deal” and is VERY VERY significant? Why?
- In a very strong UP trend PATTERN dudes ALWAYS trade the first pattern int he direction of the trend.
- In a directional change – that first pattern will usually fail and then, well, it’s not good so to speak and the correction will go much deeper than “they” expect.
- In a very strong UP trend PATTERN dudes ALWAYS trade the first pattern int he direction of the trend.
So, knowing that, yes, the global market is connected believe this is a VERY good proxy to see if the support holds … if it does, then believe we’ll carve out a support zone in the US markets and others ….
Stay tuned and let me know if you have any questions.
B
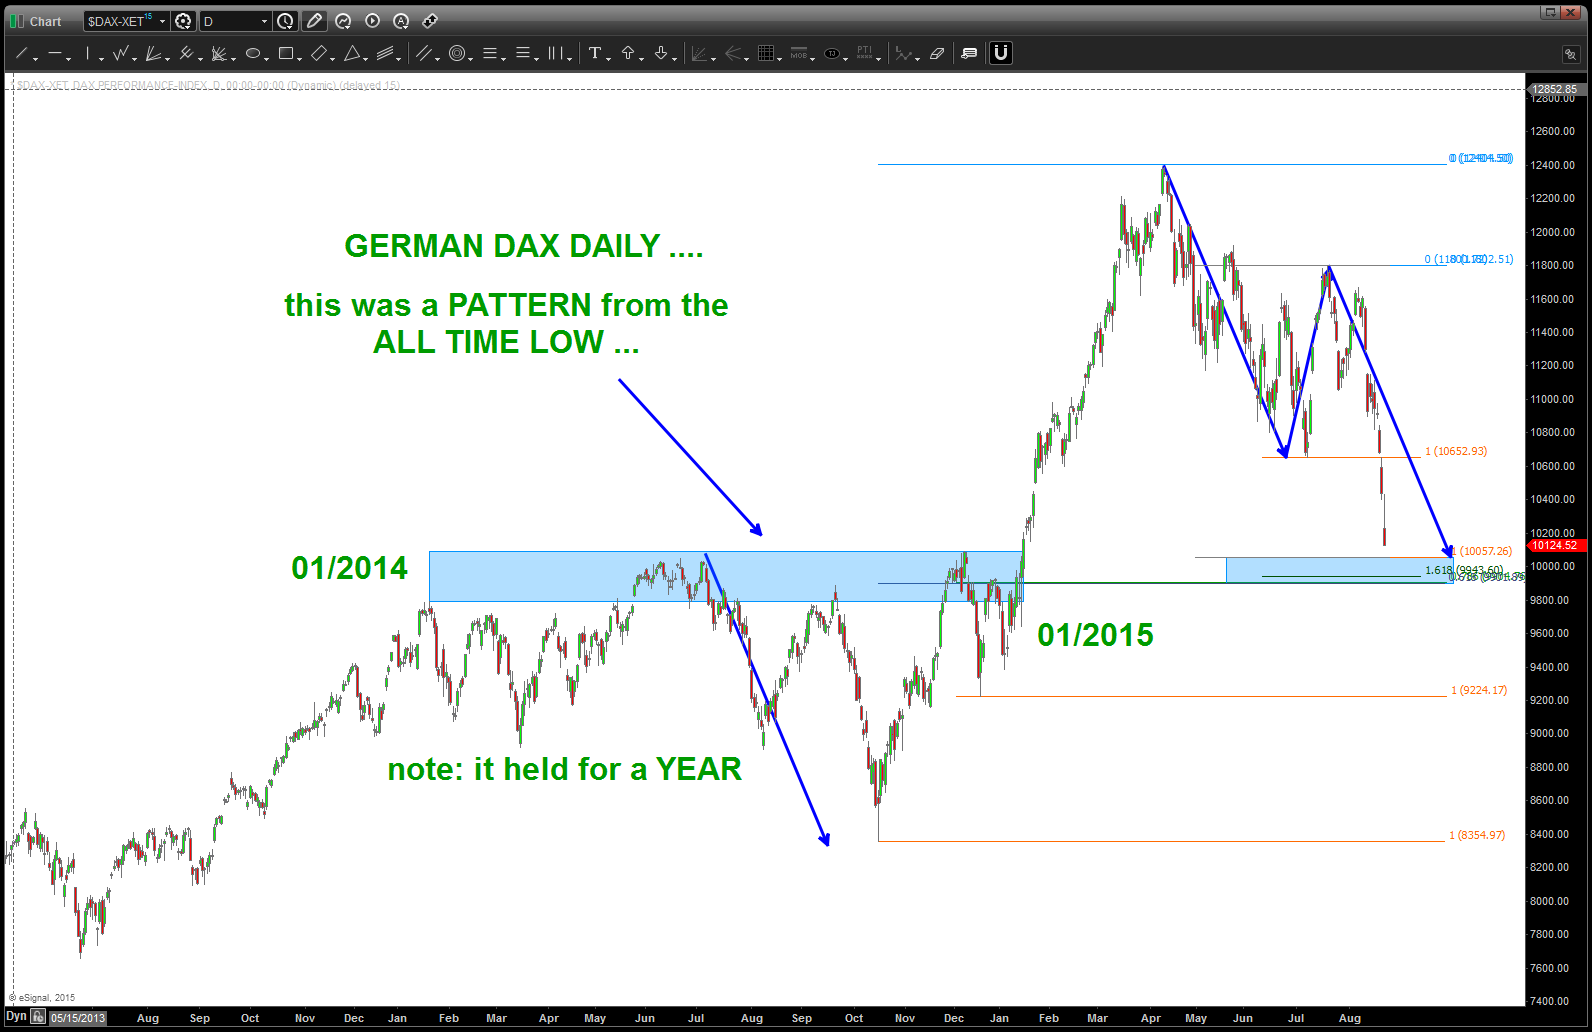
German DAX coming back to the old failed pattern level … “big deal”
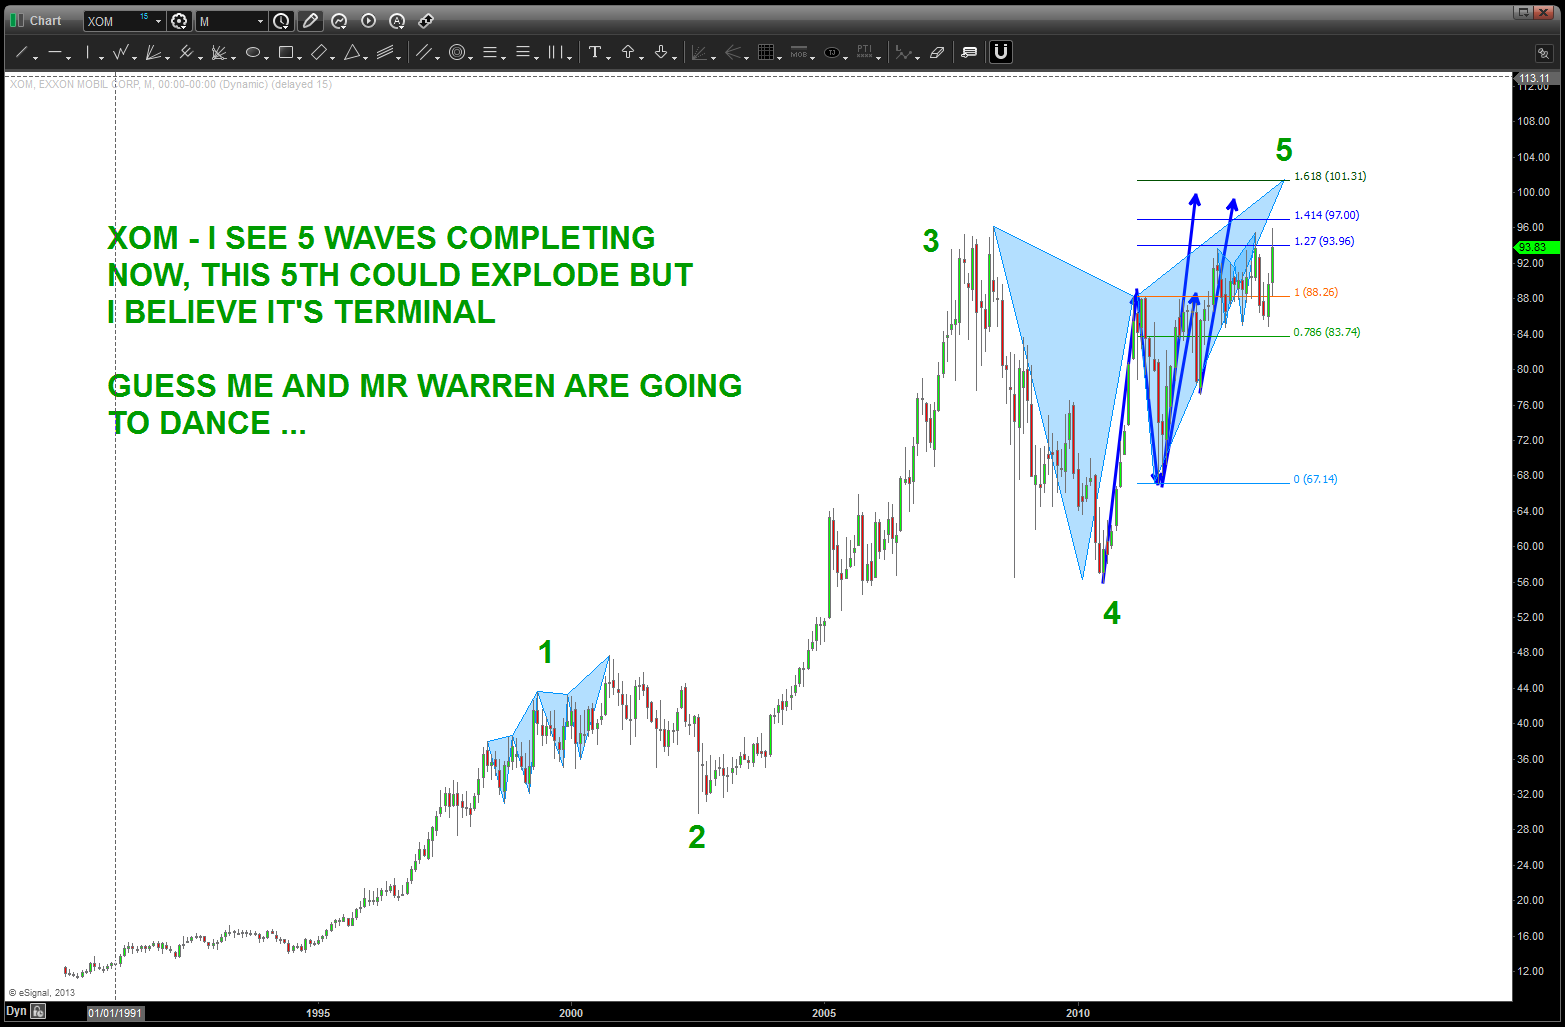
Lions and Tigers and Bears Oh My – XOM Monthly
Posted on August 27, 2015 Leave a Comment
folks – I am sorry that I didn’t post this earlier as this ranks up there as a “no brainer” in my simple mind …
- the ENTIRE KEY is the square root target
- IF square root targets lie on top of 3 Fibonacci retracements and a measured move then Lions (square root target), Tigers (measured move) and Bears (pardon the pun – retracement levels) it is “usually” market magic.
also, the pattern from November 2013 is included. was looking for 101-102. shoot me …
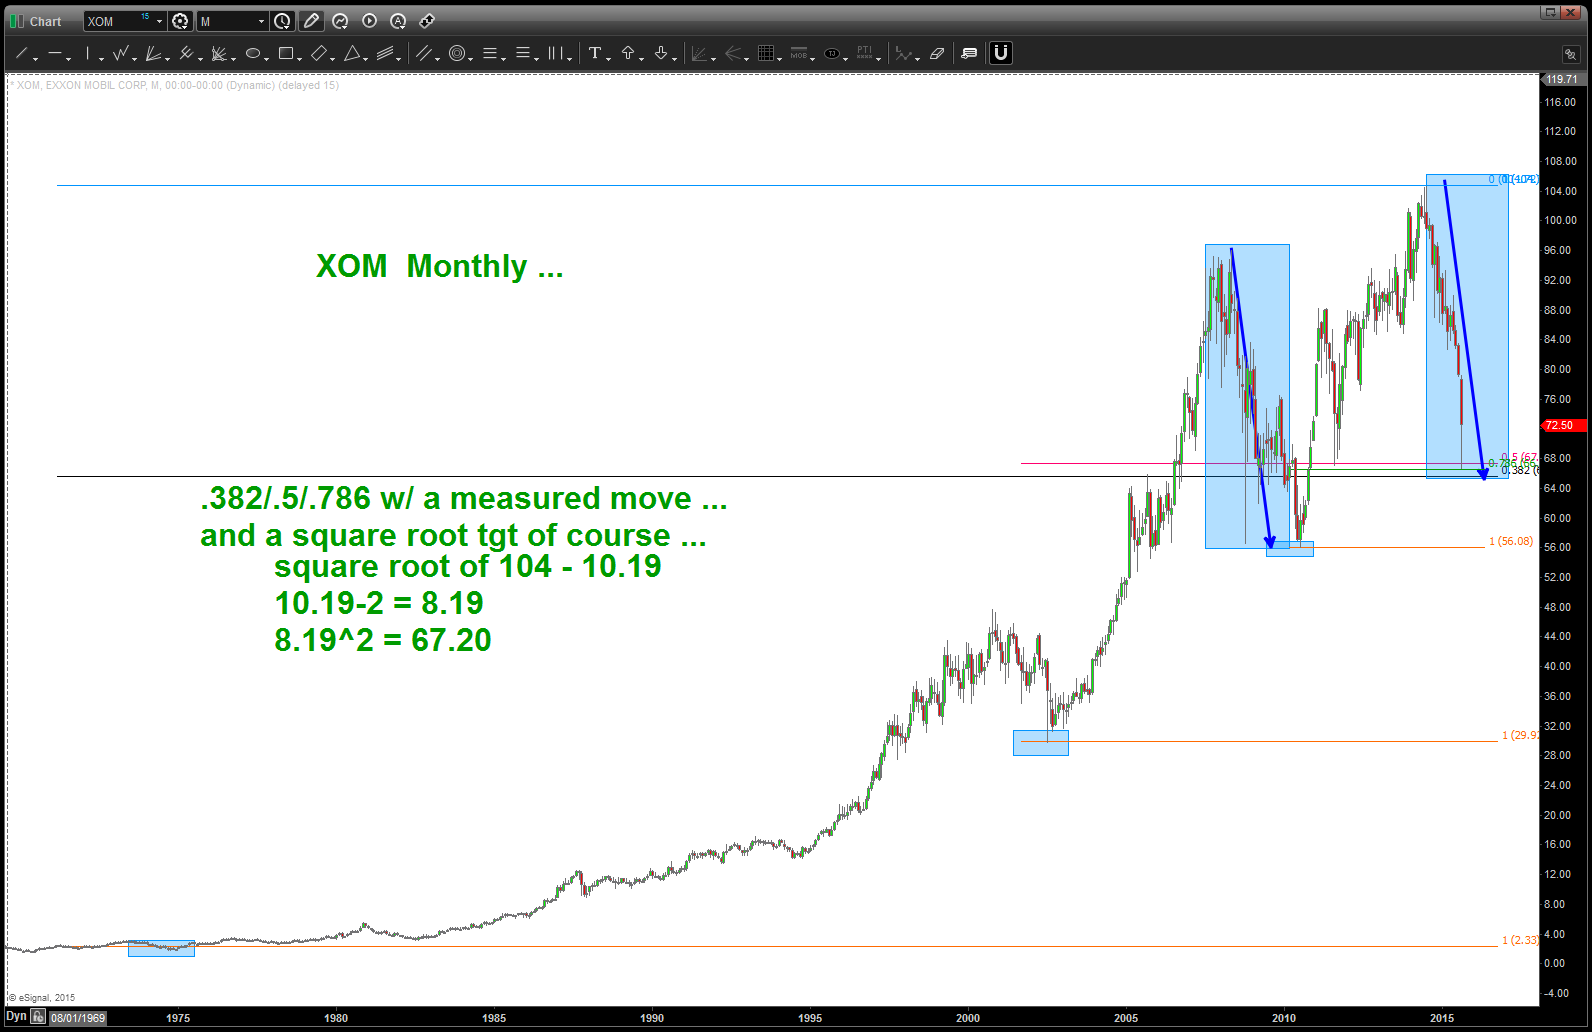
strategy is key here .. as you can see we do have a target a little lower also BUT that daily candle is impressive, wouldn’t you say?
form, proportion and harmony
Posted on August 27, 2015 Leave a Comment
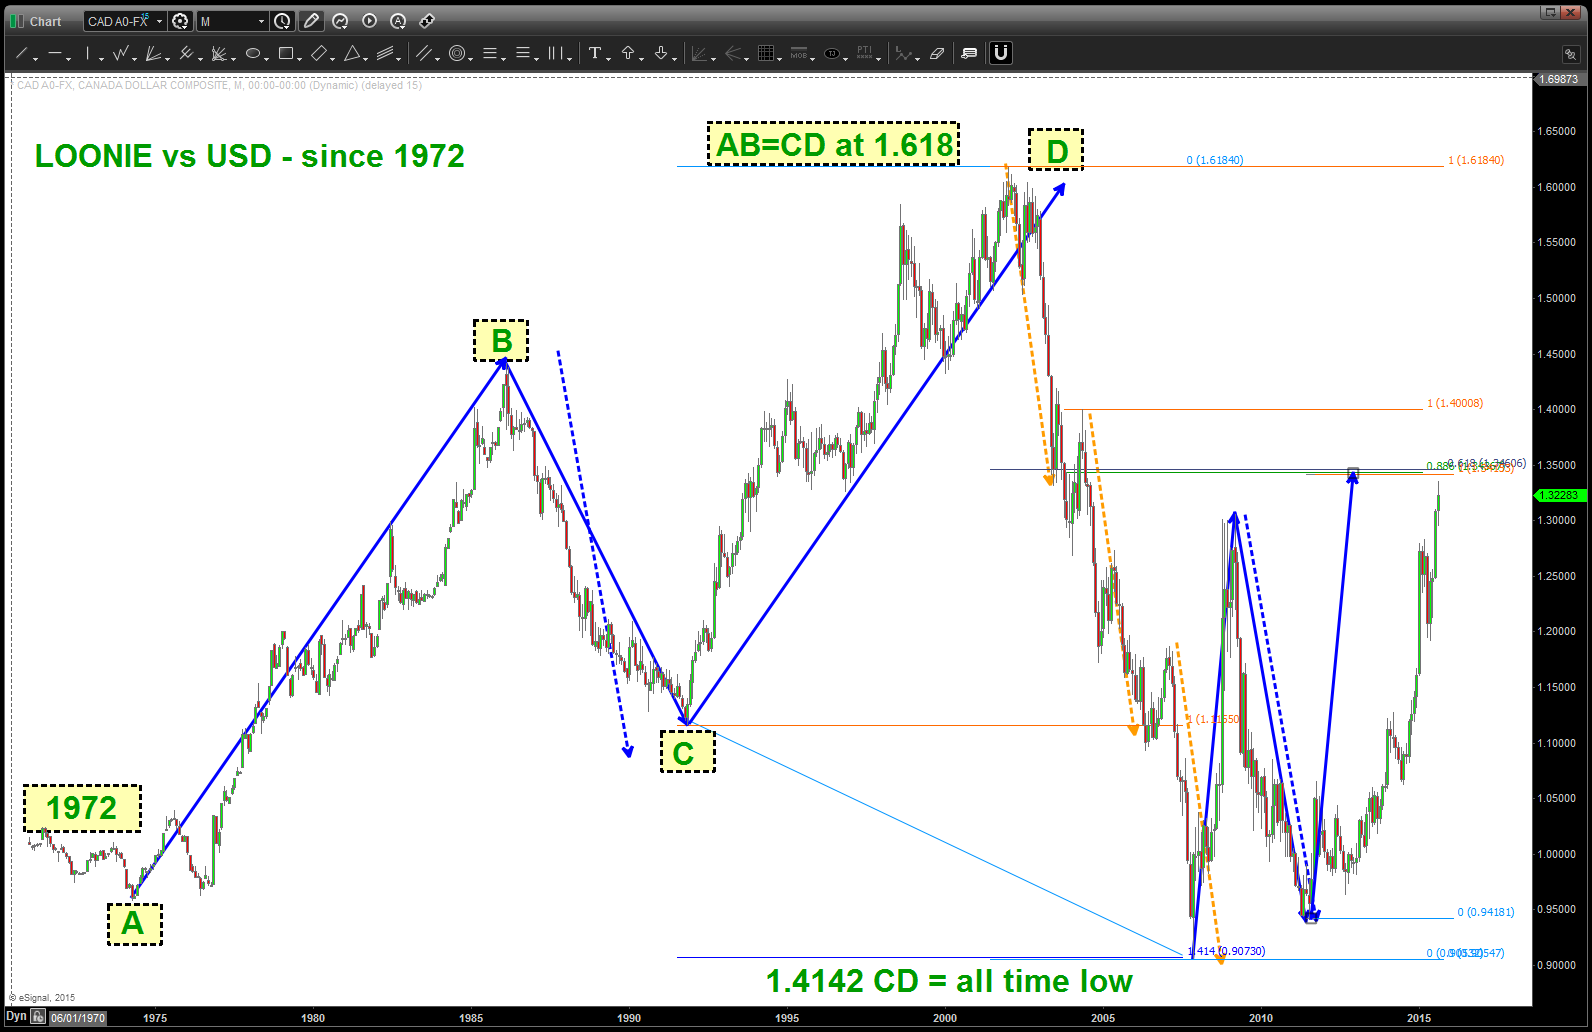
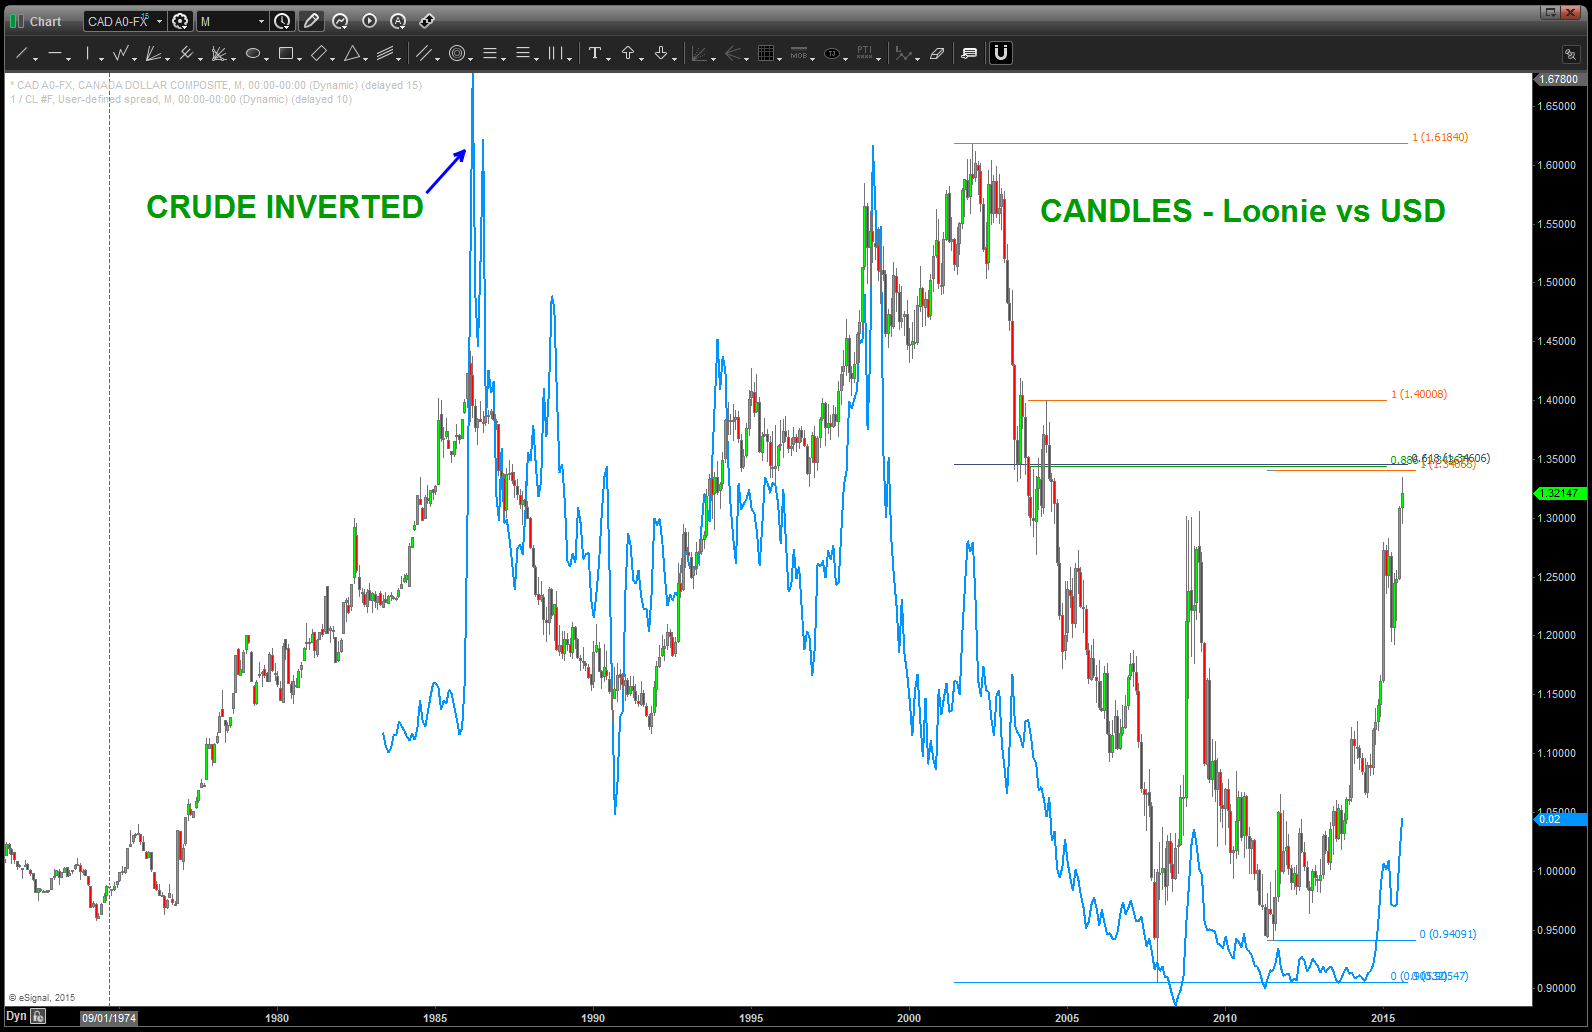
take a look at this FX chart of the Loonie (Canadian) vs the USD …in my mind, it’s a wonder to behold.
- anyone notice the all time high was 1.618?
- start from 1972 and you see the AB=CD …
- note the correction at BC (blue dashed line) and it’s the same correction that occurred in 2009-2011
- on the way down from 1.618 note the orange dashed lines .. same measured move
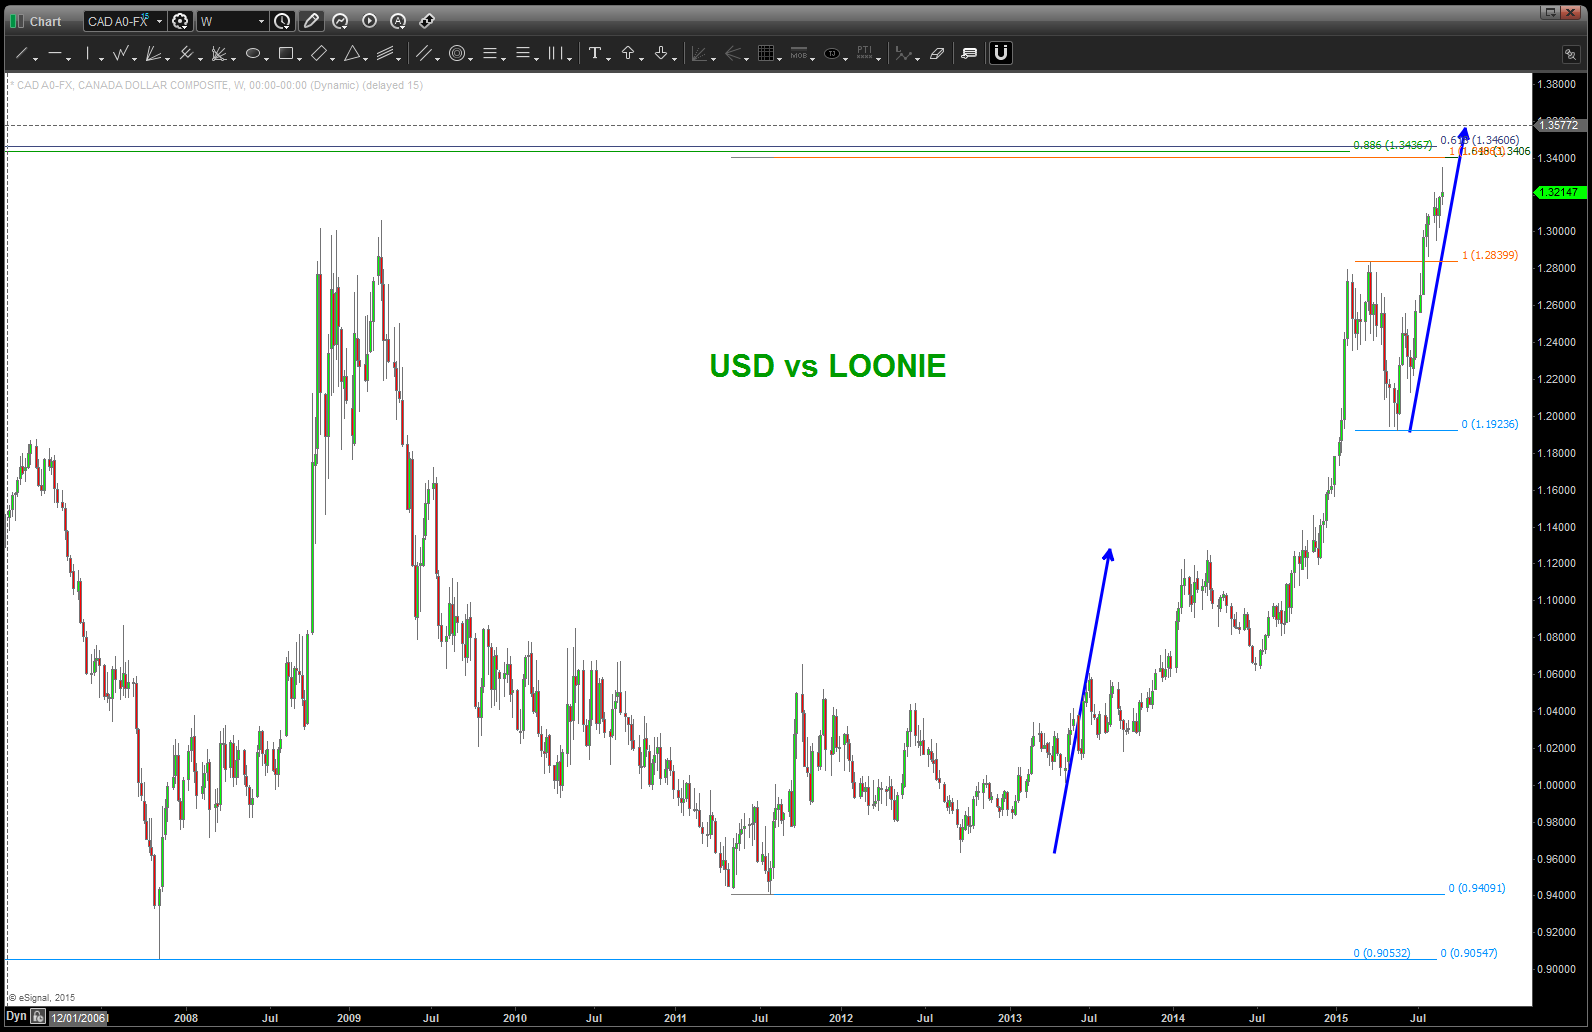
now we are close, but not quite there, to ANOTHER PATTERN completing … it’s still got 100 pips or so to go. this ranks up there as a “big deal” as you know we’ve been watching for the commodity currencies to bottom and this 1.3400 handle will tell us a lot.
OBTW – when you see the Loonie, think crude …
- IF LOONIE BOTTOM then OIL BOUNCE .. or it continues to get smashed
Cheers ….B
Editors Note: just noticed I messed up on the labeling – these charts are the USD vs LOONIE. Apologize for any confusion.
Ratio Analysis …powerful tool
Posted on August 26, 2015 Leave a Comment
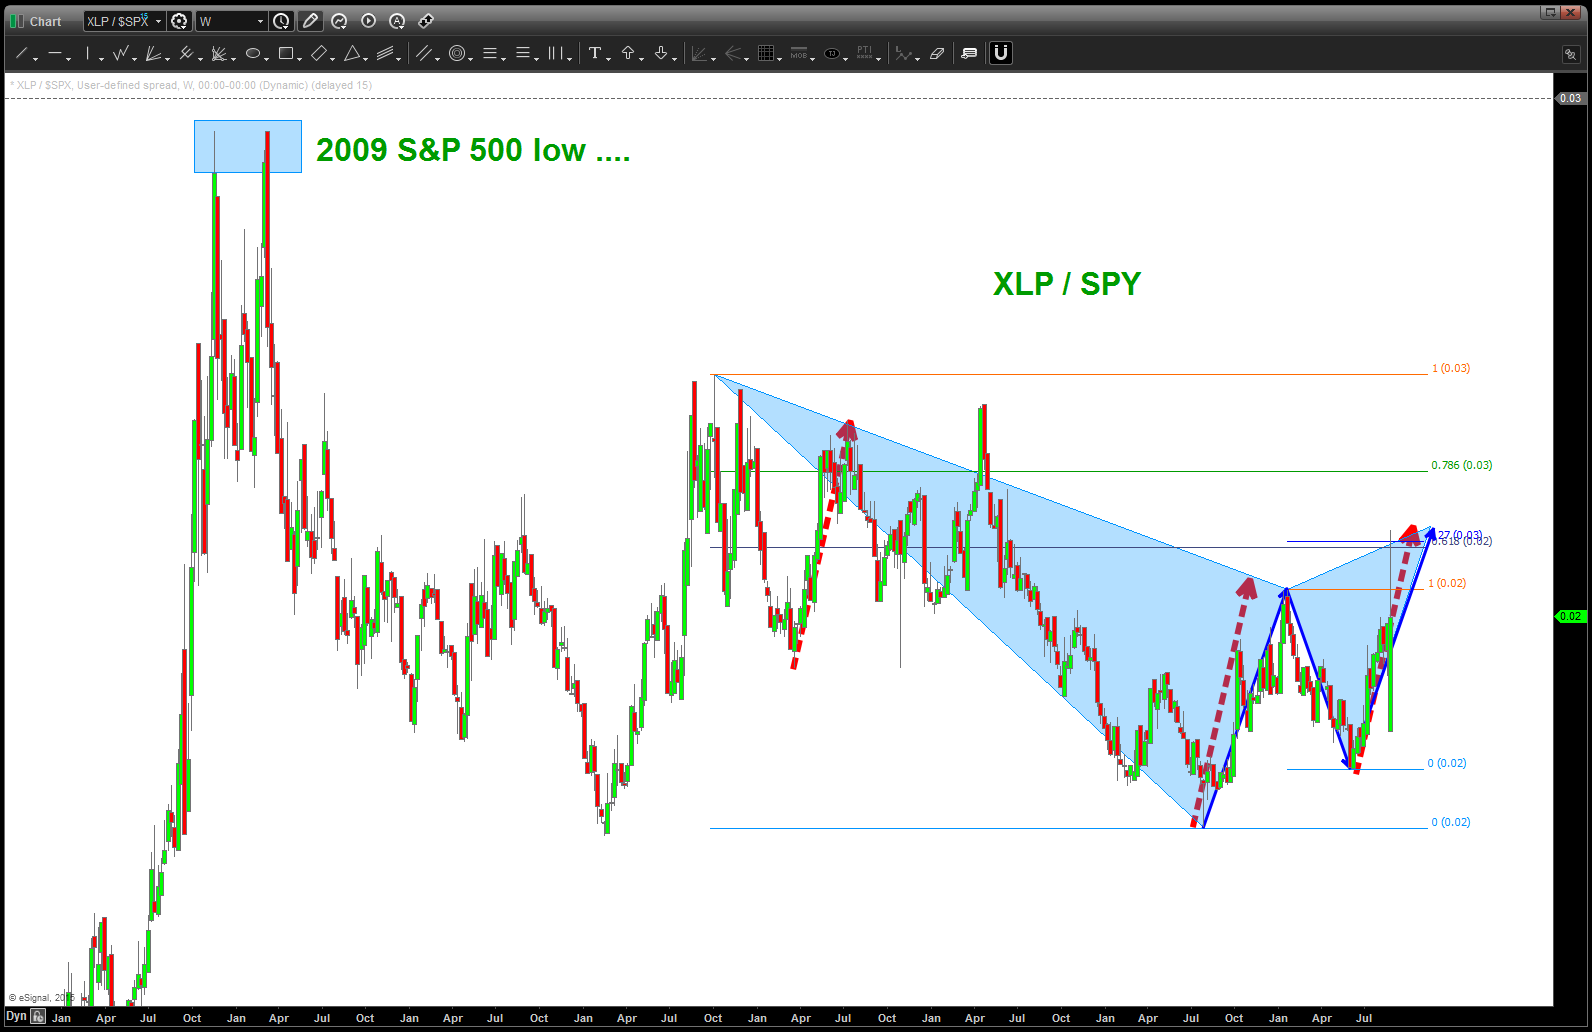
if you want, search the site for ratio analysis .. it works and the key is it really gives you a feeling for how the big boys are moving the money around … this move isn’t about “Mom and Pops” folks, it’s about institutional money flow …
we’ve done this before but here it is again:
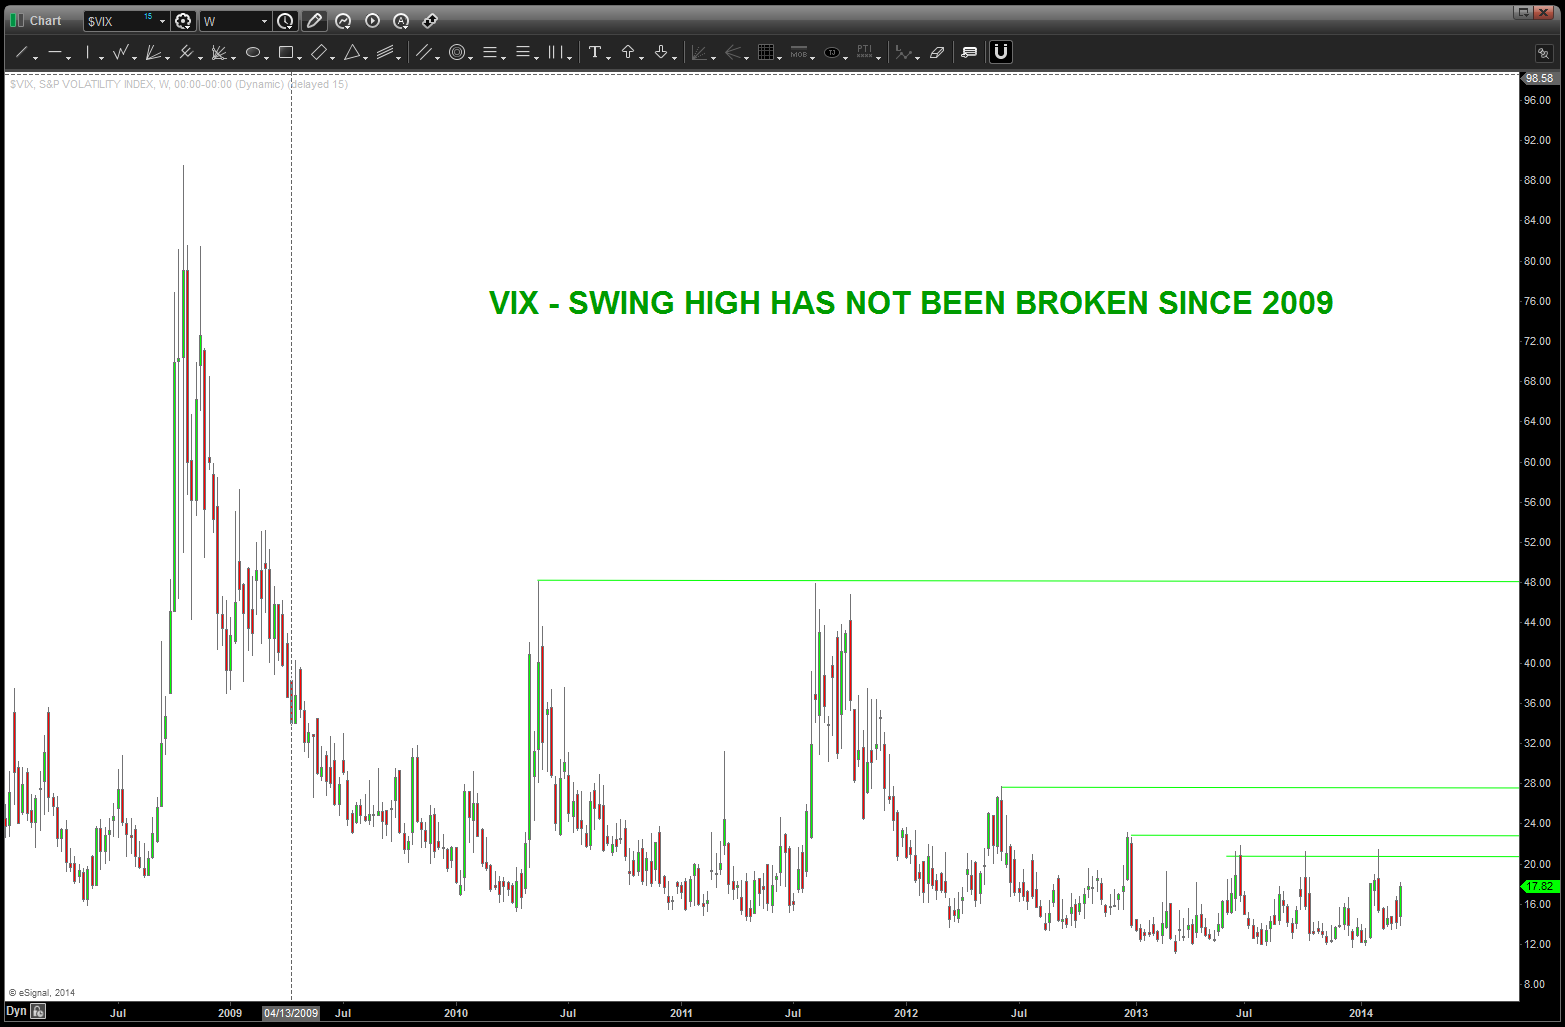
- if volatility rises XLP (staples) outperforms the overall market
- when volatility goes away rotation out of XLP occurs.
today’s move to be expected … a monster SELL of the XLP/SPX ratio occurred.
now, the key will be this level and what happens in around it in the next few days.
B
Measured Moves are KEY in markets like this …here’s $APPL
Posted on August 26, 2015 Leave a Comment
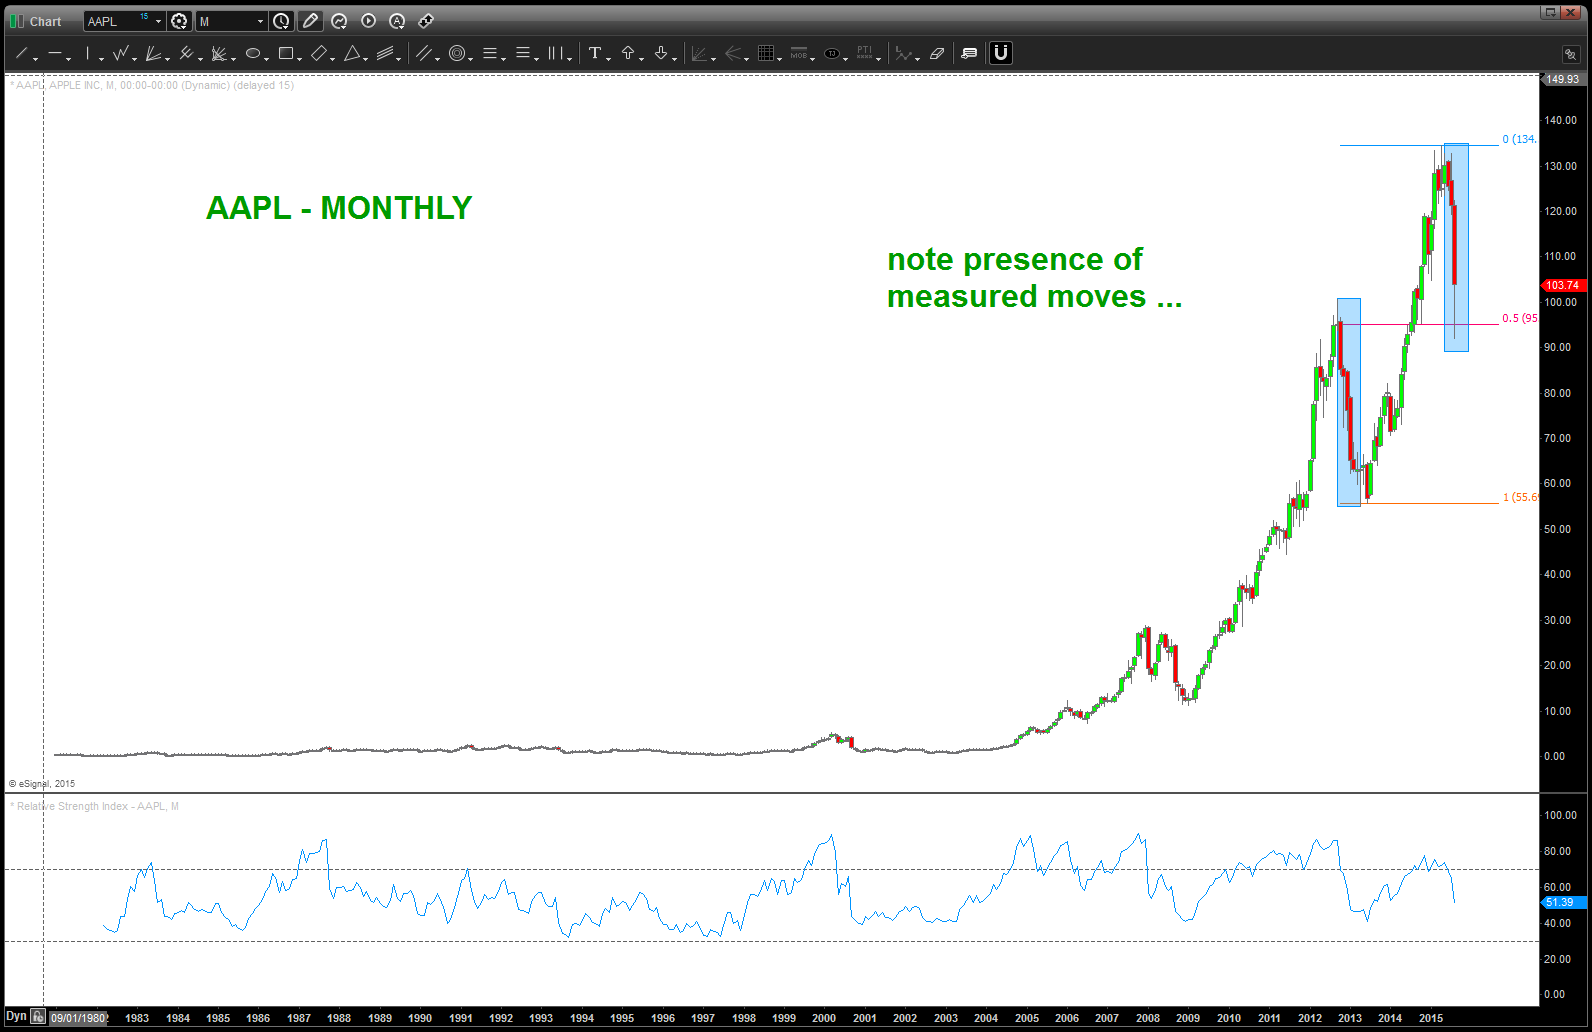
$AAPL measured moves …
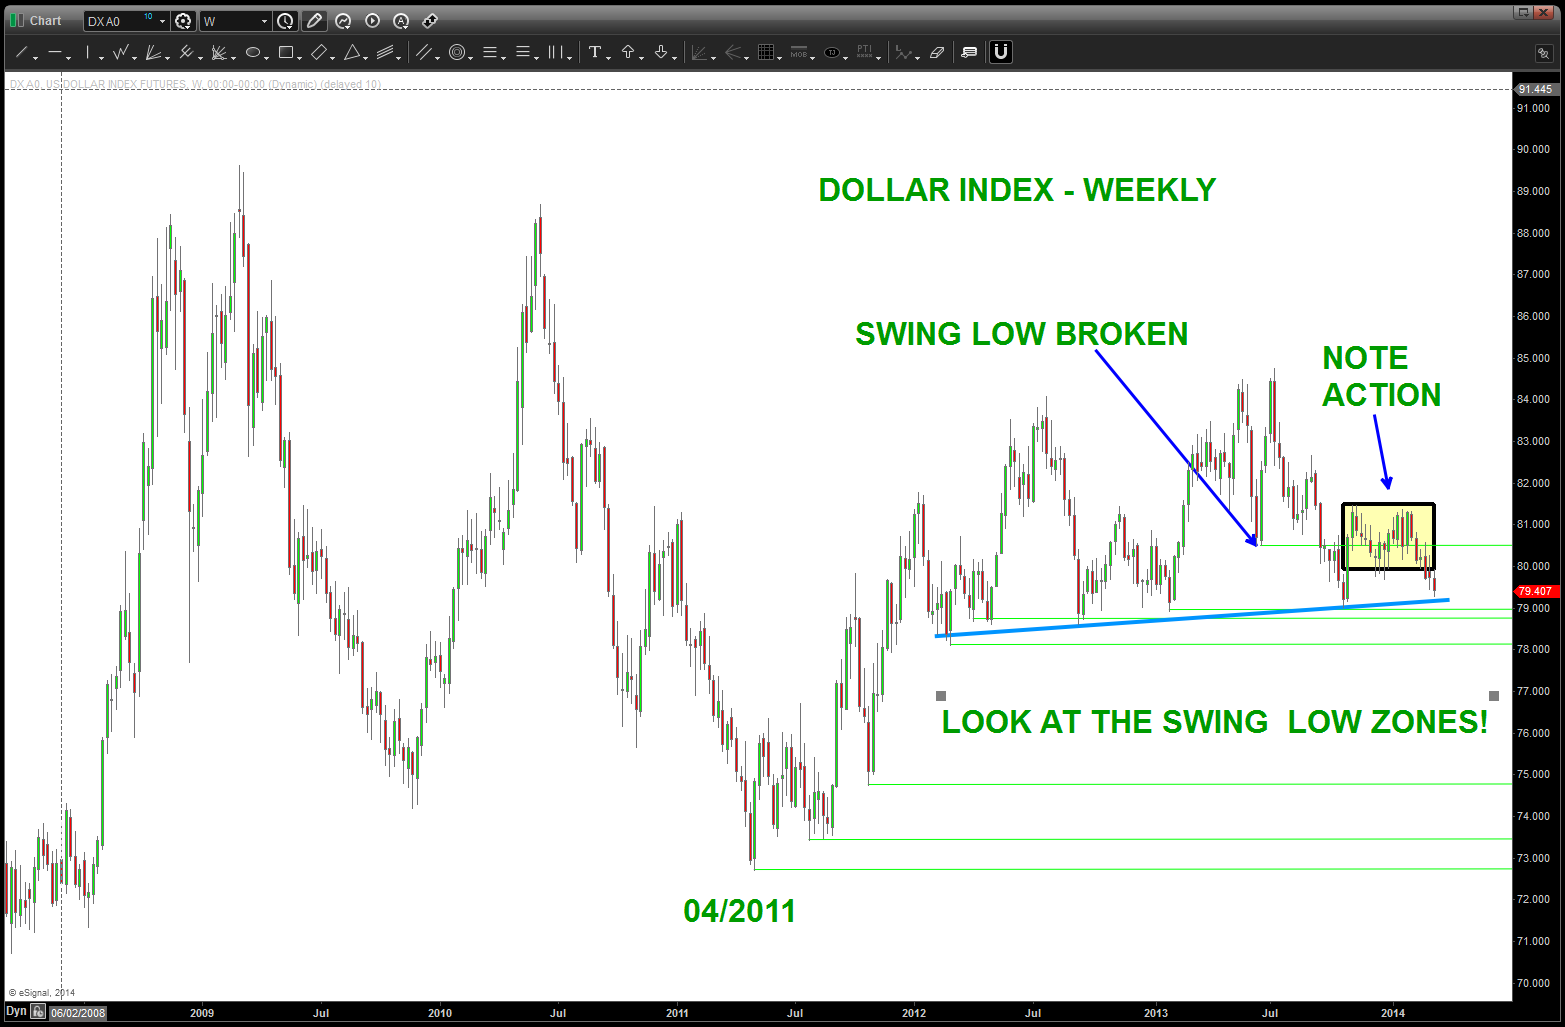
USD Index on the “watch list” for completing the “correction”
Posted on August 25, 2015 Leave a Comment
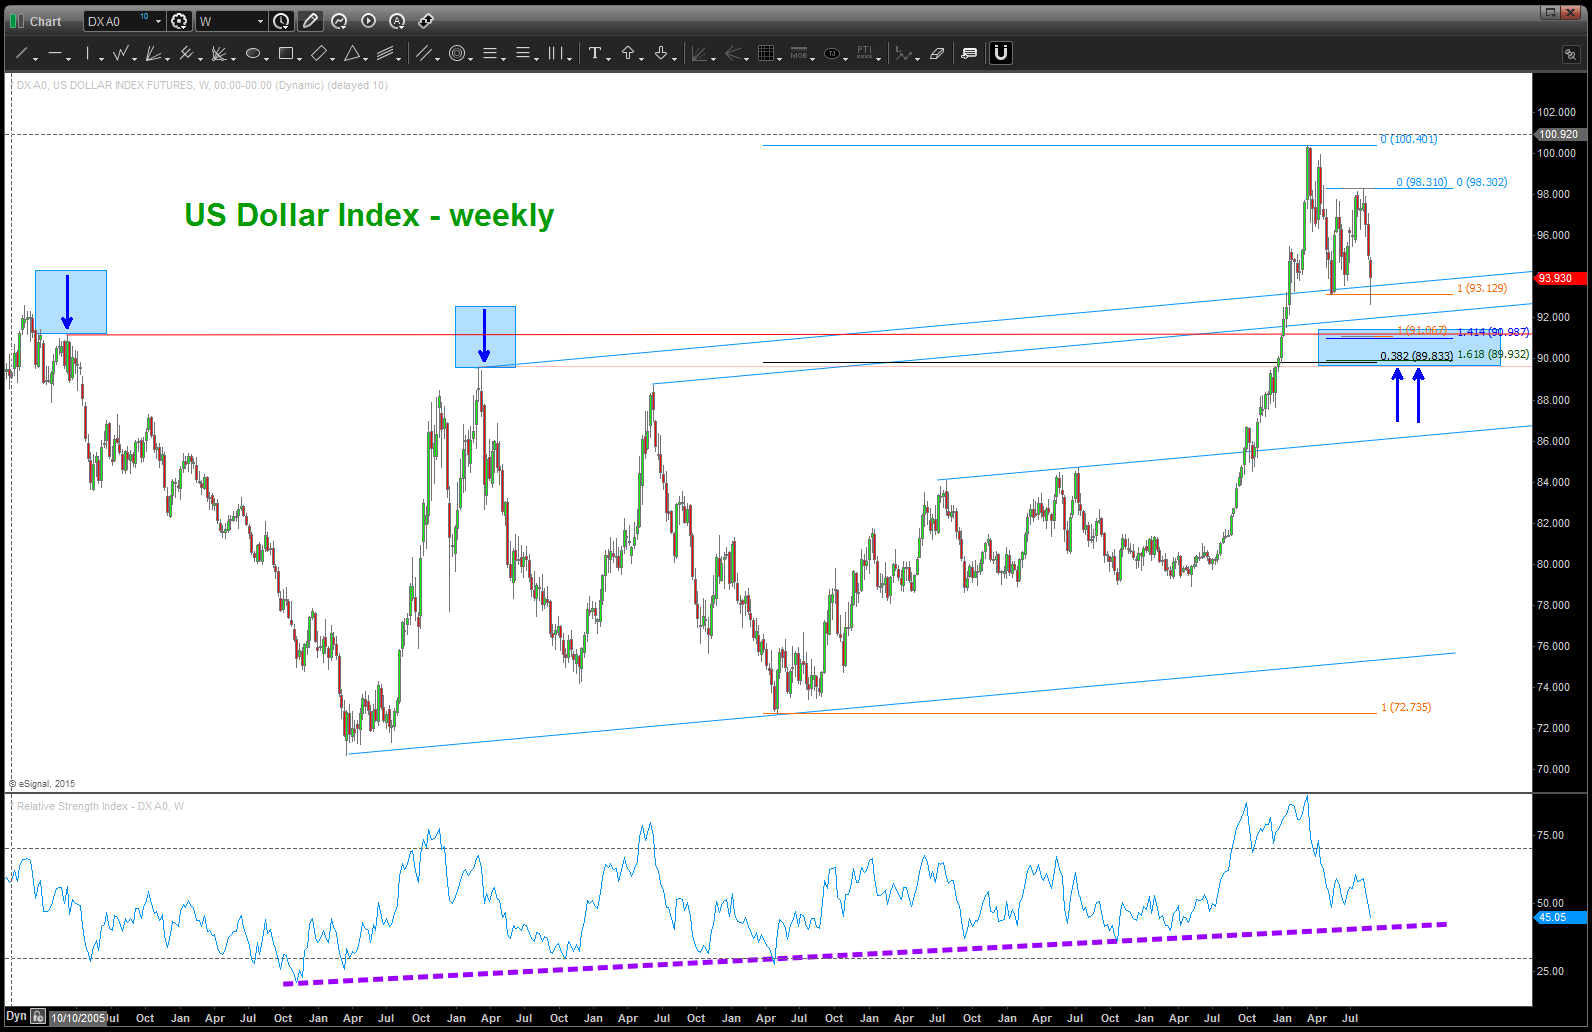
US Dollar Index
When PATTERNS fail, the almost always come back to touch it and then CONTINUE
Posted on August 22, 2015 Leave a Comment
we now have a GREAT opportunity to see if the 10000 level holds on the German Dax. I blogged about it here: https://bartscharts.com/2014/12/14/german-dax-voo-doo-is-a-wonder-to-behold/ and at the time it was finishing a MONUMENTAL pattern from the all time low 30+years ago. Guess you could say it “worked” because it held the market at that level for over a year and then it exploded higher earlier this year.
now, one of the “axioms” of PATTERN recognition is when a PATTERN fails (which it ultimately did a year later) the market will, invariably come back to touch it and then continue in the direction of the break.
yes, I know, sounds CRAZY but as a PATTERN dude, you HAVE to TRADE WHAT YOU SEE not WHAT YOU BELIEVE .. what do we have?
A PERFECT pattern on top of a former long term pattern …this is what we SEE:
- .618/.786 overlap retracements
- 1.618 extension
- projection into the area
- measured moves w/ the projection (note the blue arrows)
- ALL ON TOP OF A FORMER PATTERN
so, time for the IF then …
- IF this pattern holds then the German Dax should move higher …. perhaps even taking out the old high. I know that belief is crazy .. but it’s what I see.
- IF THIS PATTERN FAILS – it ranks up there as a “big deal” and is VERY VERY significant? Why?
- In a very strong UP trend PATTERN dudes ALWAYS trade the first pattern int he direction of the trend.
- In a directional change – that first pattern will usually fail and then, well, it’s not good so to speak and the correction will go much deeper than “they” expect.
- In a very strong UP trend PATTERN dudes ALWAYS trade the first pattern int he direction of the trend.
So, knowing that, yes, the global market is connected believe this is a VERY good proxy to see if the support holds … if it does, then believe we’ll carve out a support zone in the US markets and others ….
Stay tuned and let me know if you have any questions.
B
German DAX coming back to the old failed pattern level … “big deal”
1856 ….
Posted on August 21, 2015 Leave a Comment
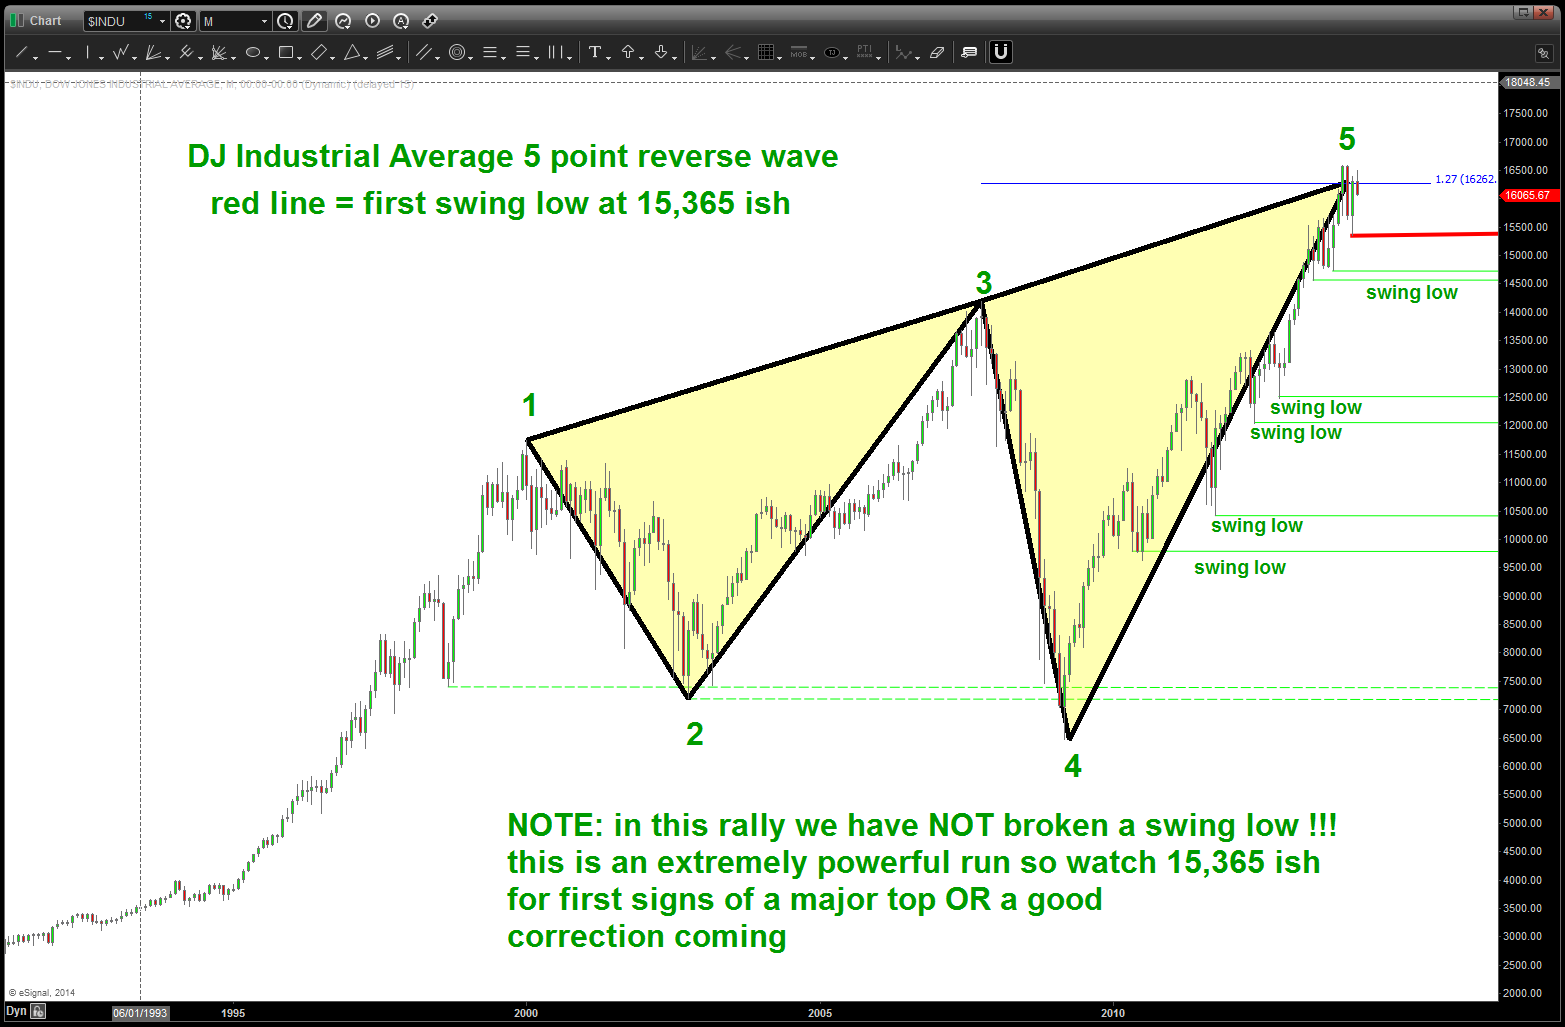
if you read my last post (here: https://bartscharts.com/2015/08/20/i-think-this-is-a-song-of-hope-robert-plant-live-stairway-to-heaven/ ) you’ll understand the importance of a “swing low.”
I’m watching 1941 – blue arrow measured move that has happened before but, more importantly, 1856. 1856 represents the largest correction down since 2009 BUT MORE IMPORTANTLY is a KEY swing low area … if we take out 1818 then this puppy could really breathe.
also, note how 1970 (close today) calendar days ago we did a plunging low in October 2010, rallied for a bit and then another climatic plunging low.
PRICE will ALWAYS equal TIME.
One last … don’t go long the equity market till the EURO starts back down …once dollar goes back UP then believe this cleanse could be complete.
Have a great weekend .. enjoy the ride.
STUDY the CHARTS and turn the TV pundit dorks off …

S&P 500 weekly
“I think this is a song of hope …” Robert Plant Live Stairway to Heaven
Posted on August 20, 2015 1 Comment
The S&P 500 has been climbing a stairway to Heaven ..

folks coming into 2015 we had some pretty strong patterns appearing. some worked and some didn’t – isn’t that what we expect? that being said, it was prudent to be cautious due to their presence.
here’s what I posted around a year ago:
“Let’s don’t jump up and down and scream the BEAR MARKET is here till this chariot of the bulls breaks a swing low.”
so, while we’ve sold off for the past couple days let’s not go crazy. we have broken ONE swing low and that’s it, and it’s ONLY a weekly. WE HAVE NOT BROKEN A MONTHLY SWING LOW.
so, keep it ALL context of the big picture. We break a swing low on a MONTHLY and then a second then we have “issues.”
but for now, EVERYONE knows this puppy was on steroids and need some shaking out so let’s look for a pattern to BUY on a weekly (hint hint – it needs to breathe a bit) and if a bear I would still be very cautious.
what do we know and see … ?
- we know a weekly swing low is about to be taken out and we’ll know that ONLY WITH THE CLOSE TOMORROW … we also know this has NEVER happened since March 2009 bull market began.
so, here’s the logic:
- if weekly close below a swing low … get defensive.
- if not, then keep in mind, we have pressure on the downside and it probably needs to breathe down so just chill …
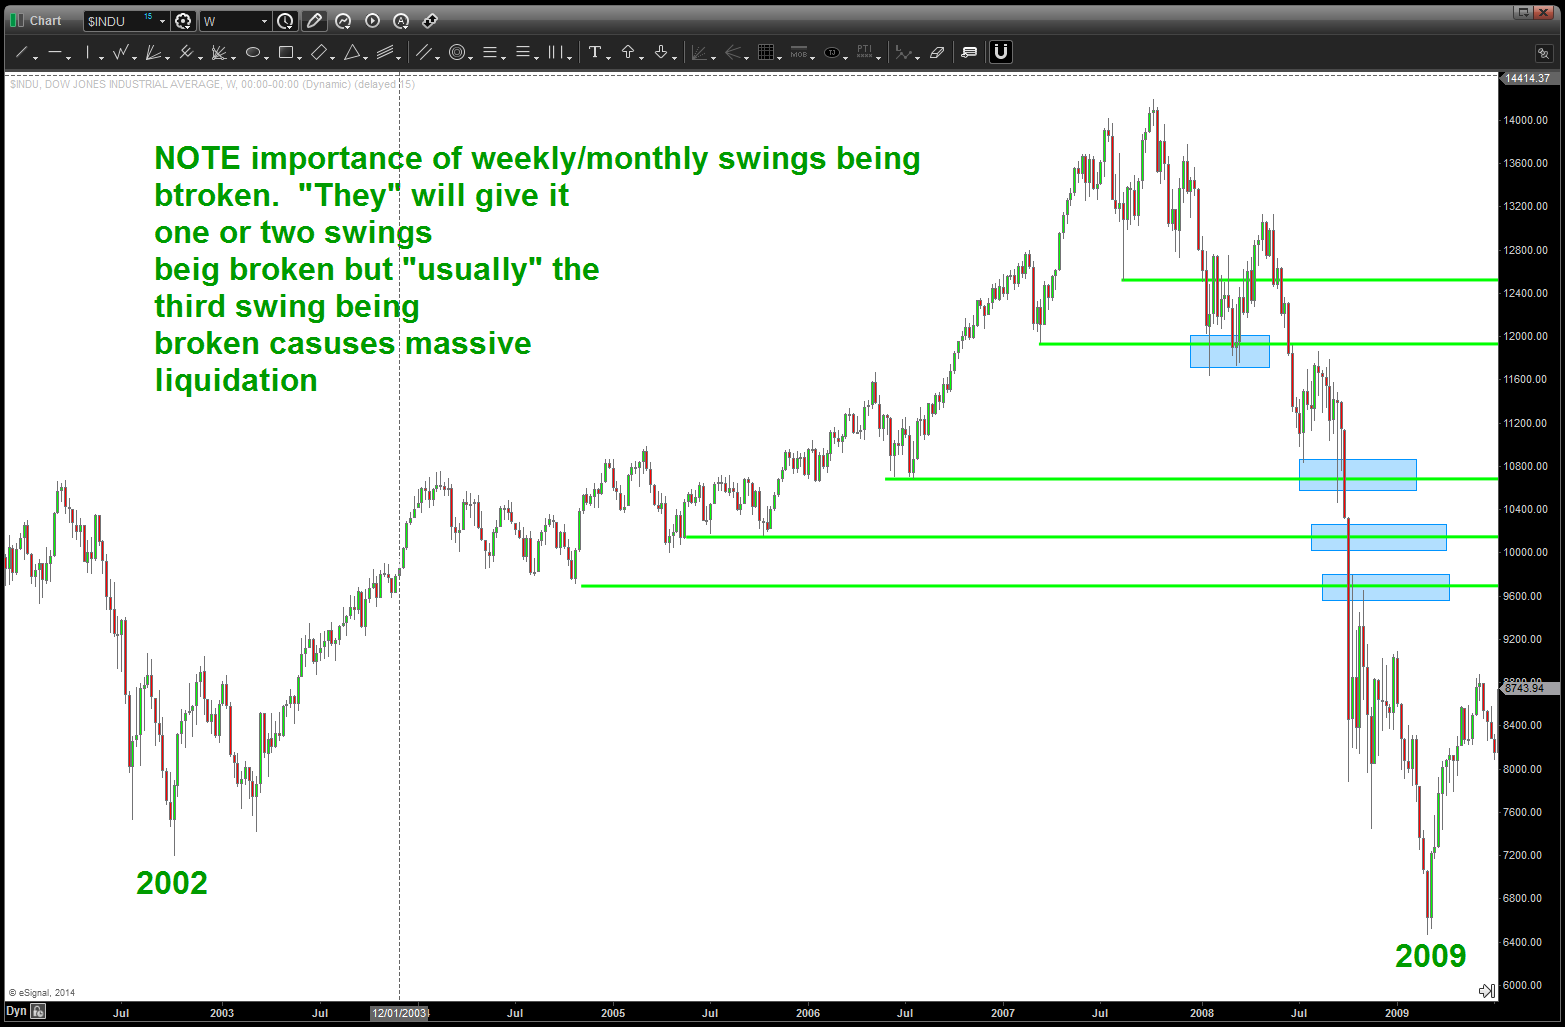
enjoy the post below .. you’ll see some of the patterns were early, some were spot on. that’s not the point .. the entire post below is around the market action around a SWING LOW or SWING HI and to respect them — very very strongly.
let me know if you have any questions.
chart below is the ES .. note the red horizontal swing lows. those have never been broken on close. it might happen tomorrow …
Bart
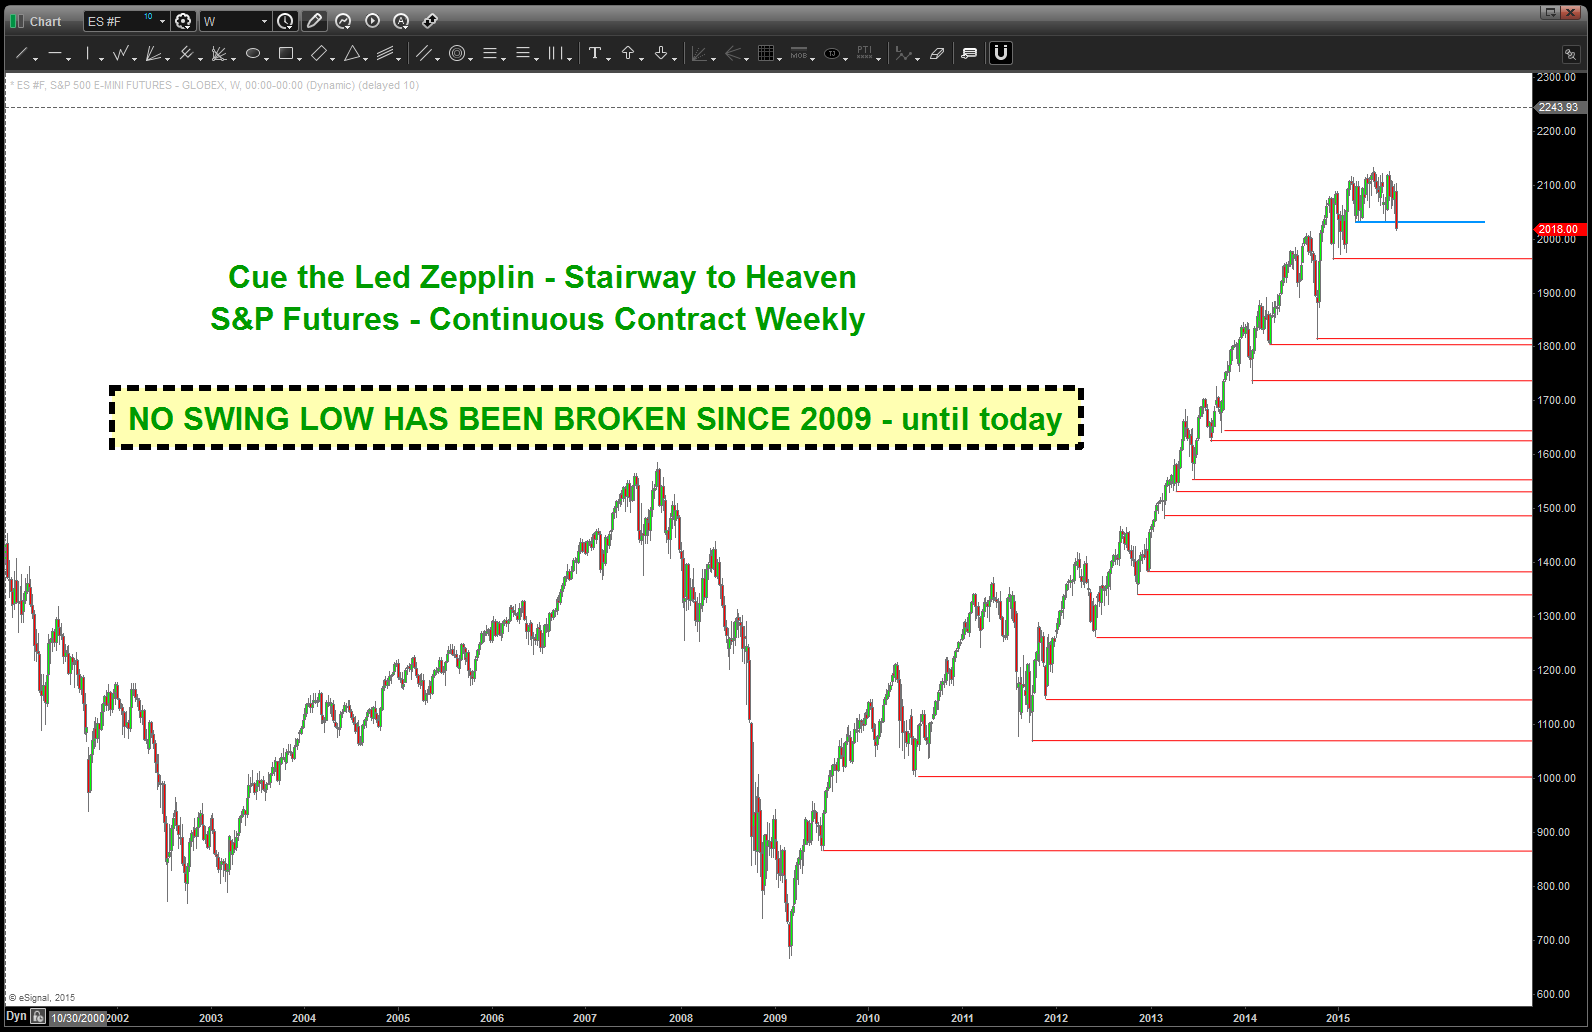
S&P Futures Swing Lows since 2009
As we have discussed multiple times in this venue, the move since 2009 has been one heck of a ride. This chariot of stock market emotion is, literally, off the charts. It is at an extreme that has surpassed 1929, 2000 and 2007. For the past 6 months it has defied the powerful cycles and patterns we follow. However, we are at another “potential” inflection point and based on this weeks price action the chariot appears to be running out of gas. So, objectively, the cycles and patterns we follow appear to be working. Let’s don’t jump up and down and scream the BEAR MARKET is here till this chariot of the bulls breaks a swing low.