form, proportion and harmony
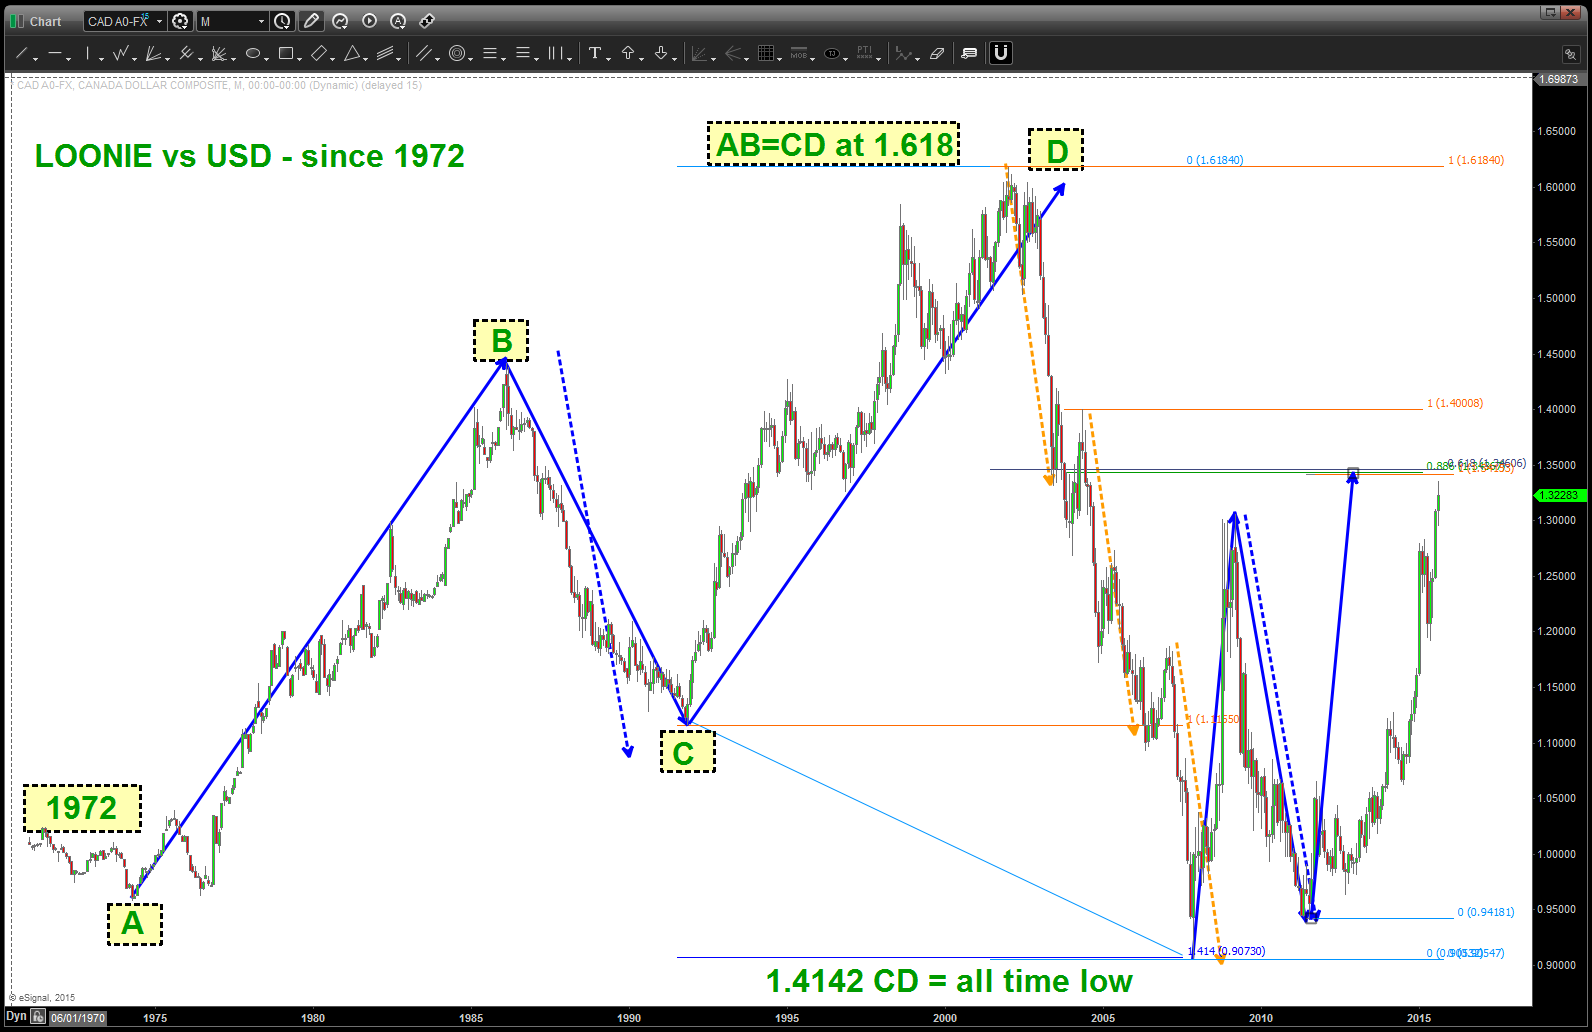
take a look at this FX chart of the Loonie (Canadian) vs the USD …in my mind, it’s a wonder to behold.
- anyone notice the all time high was 1.618?
- start from 1972 and you see the AB=CD …
- note the correction at BC (blue dashed line) and it’s the same correction that occurred in 2009-2011
- on the way down from 1.618 note the orange dashed lines .. same measured move
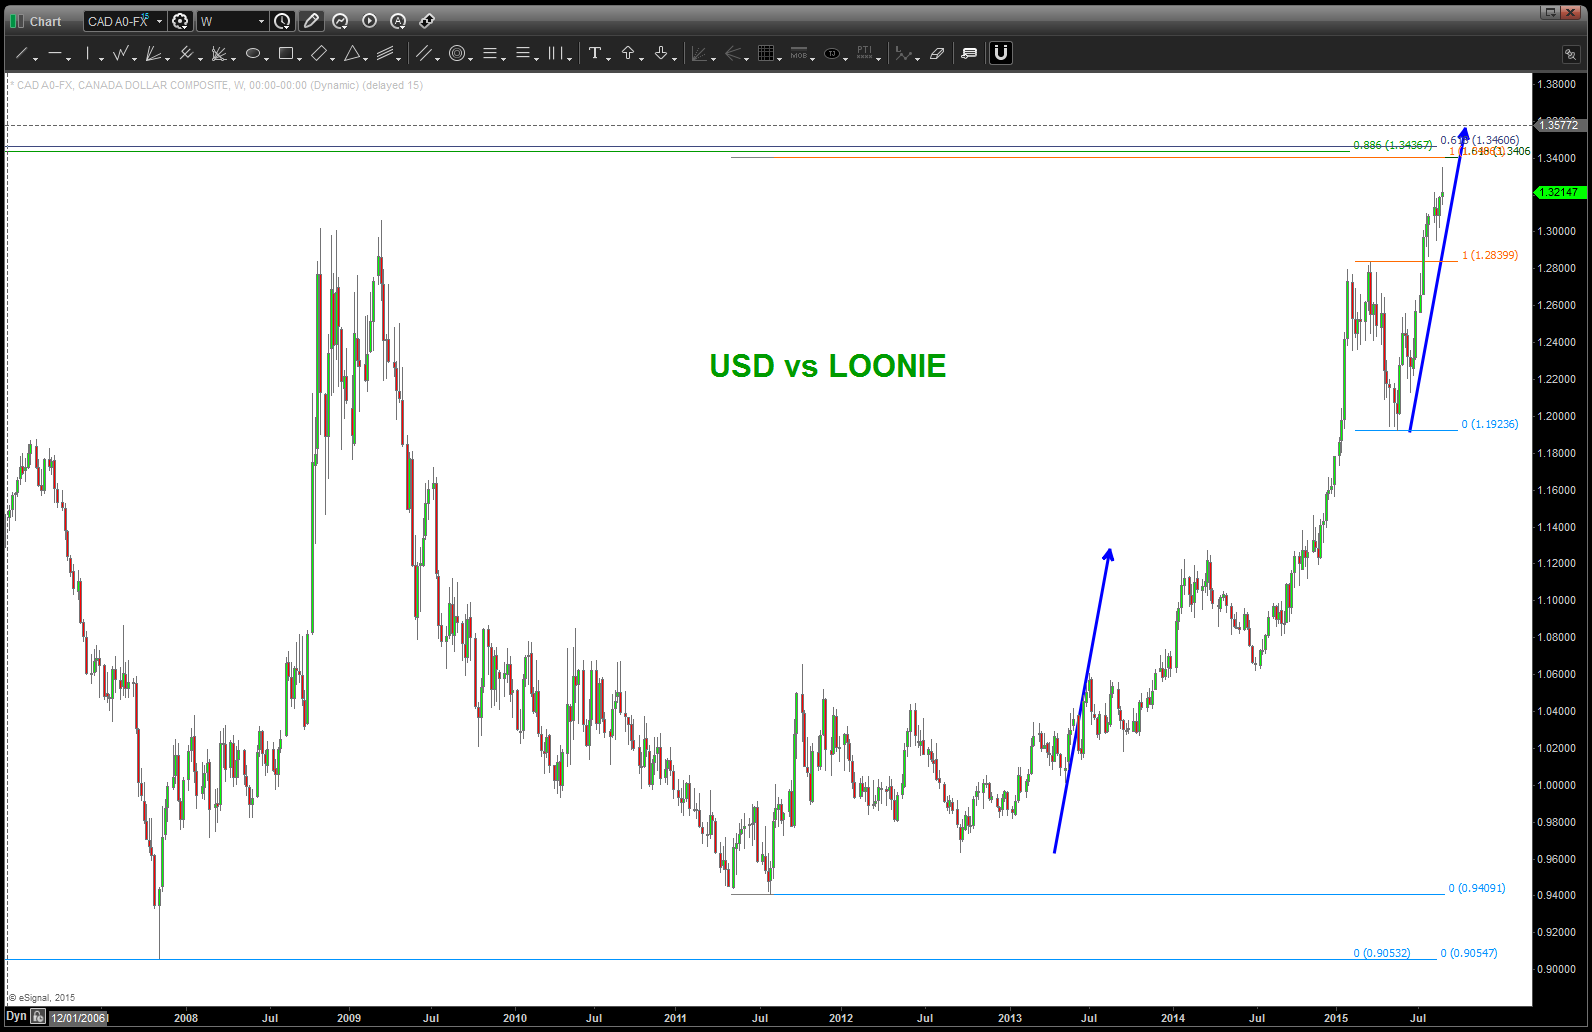
now we are close, but not quite there, to ANOTHER PATTERN completing … it’s still got 100 pips or so to go. this ranks up there as a “big deal” as you know we’ve been watching for the commodity currencies to bottom and this 1.3400 handle will tell us a lot.
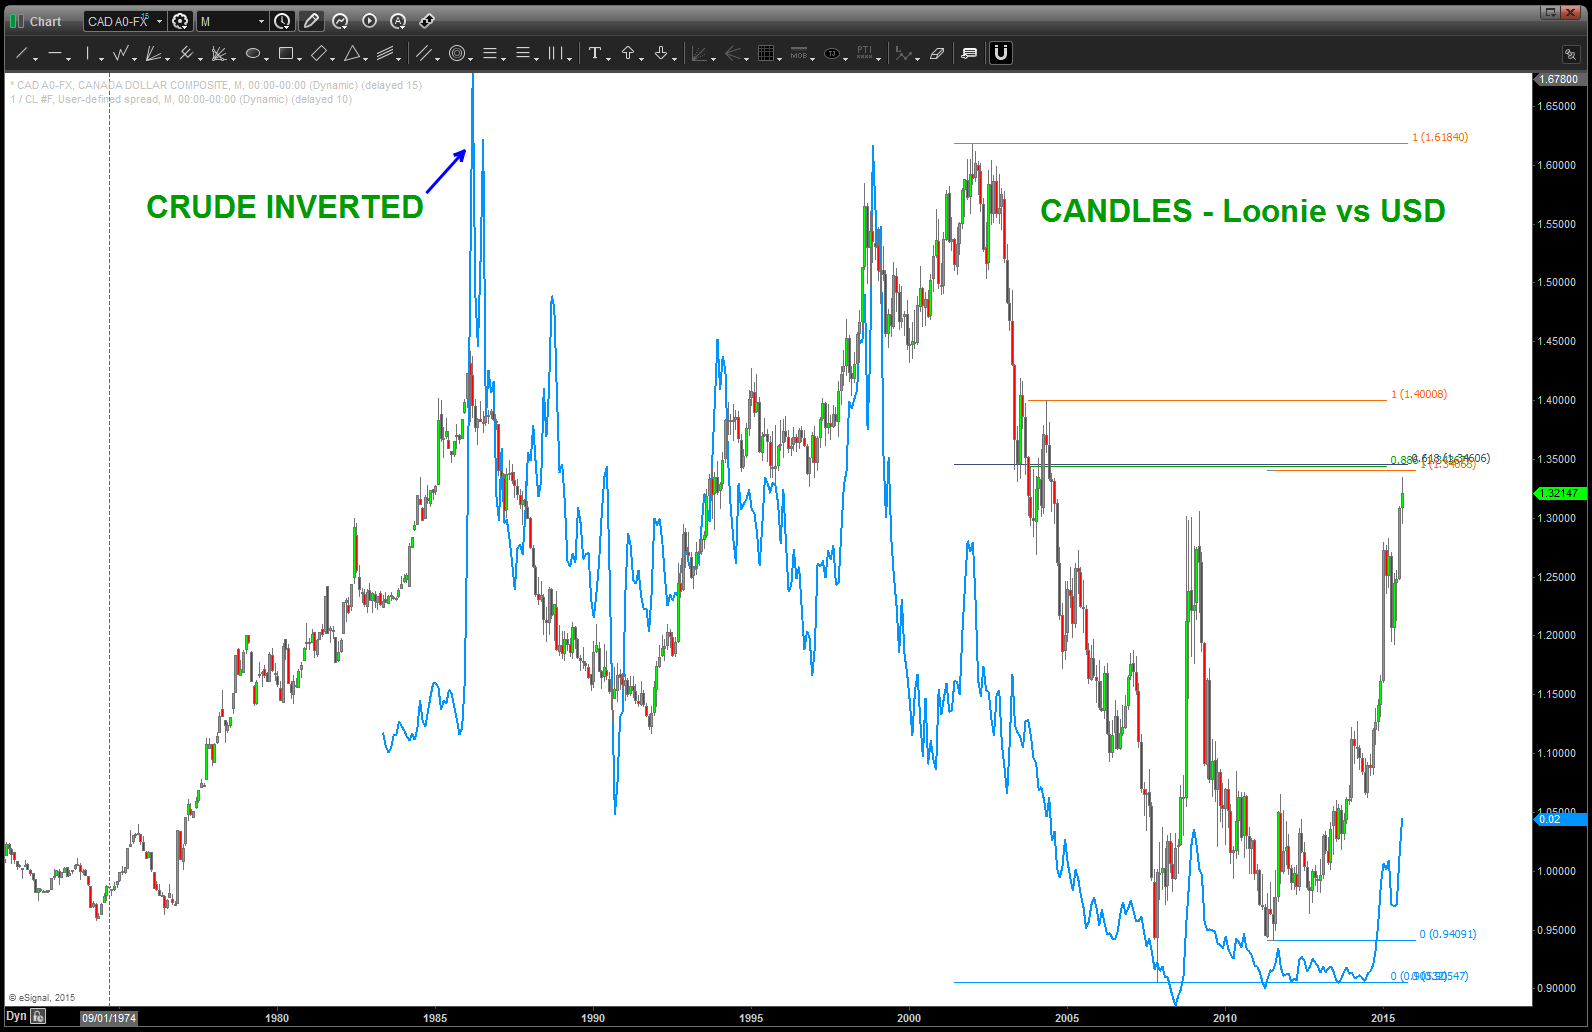
OBTW – when you see the Loonie, think crude …
- IF LOONIE BOTTOM then OIL BOUNCE .. or it continues to get smashed
Cheers ….B
Editors Note: just noticed I messed up on the labeling – these charts are the USD vs LOONIE. Apologize for any confusion.