Ford – revisited
Posted on June 30, 2019 Leave a Comment
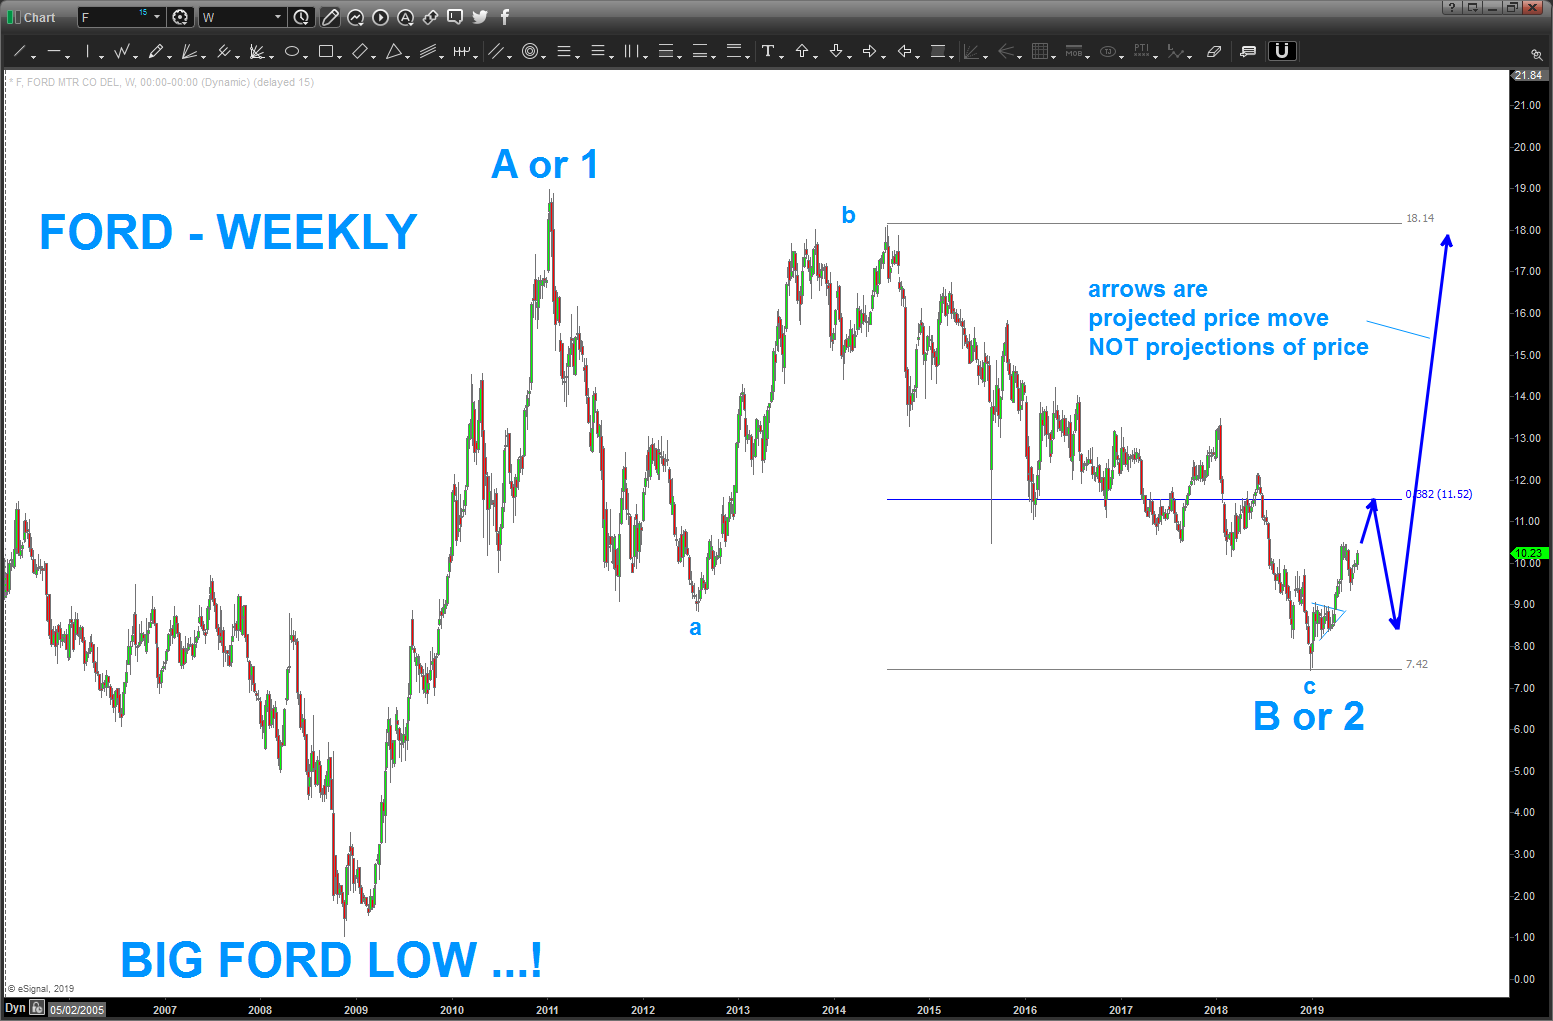
have been watching Ford (F) for a while and here’s the work that went into looking for the mid – 7’s to 8’s to hold: https://bartscharts.wordpress.com/2018/09/09/f-ford-set-up/
from that level, you can see we have had a very nice and orderly advance and, for now, it appears to be in 5 waves.
IF this analysis is correct, we are setting the stage for a multi-month/week advance in ford that ‘should’ take out the 19ish high, at a minimum, and advance well beyond that in the coming months/years.
Basically, this run is just getting started. Look for the 5 waves to finish in around 10-11 and then a pull back – we should buy that.
feel this pattern fails below 7.42.
risk reward = nice.
Ford – look to buy.
Bart
Silver redux
Posted on June 17, 2019 1 Comment
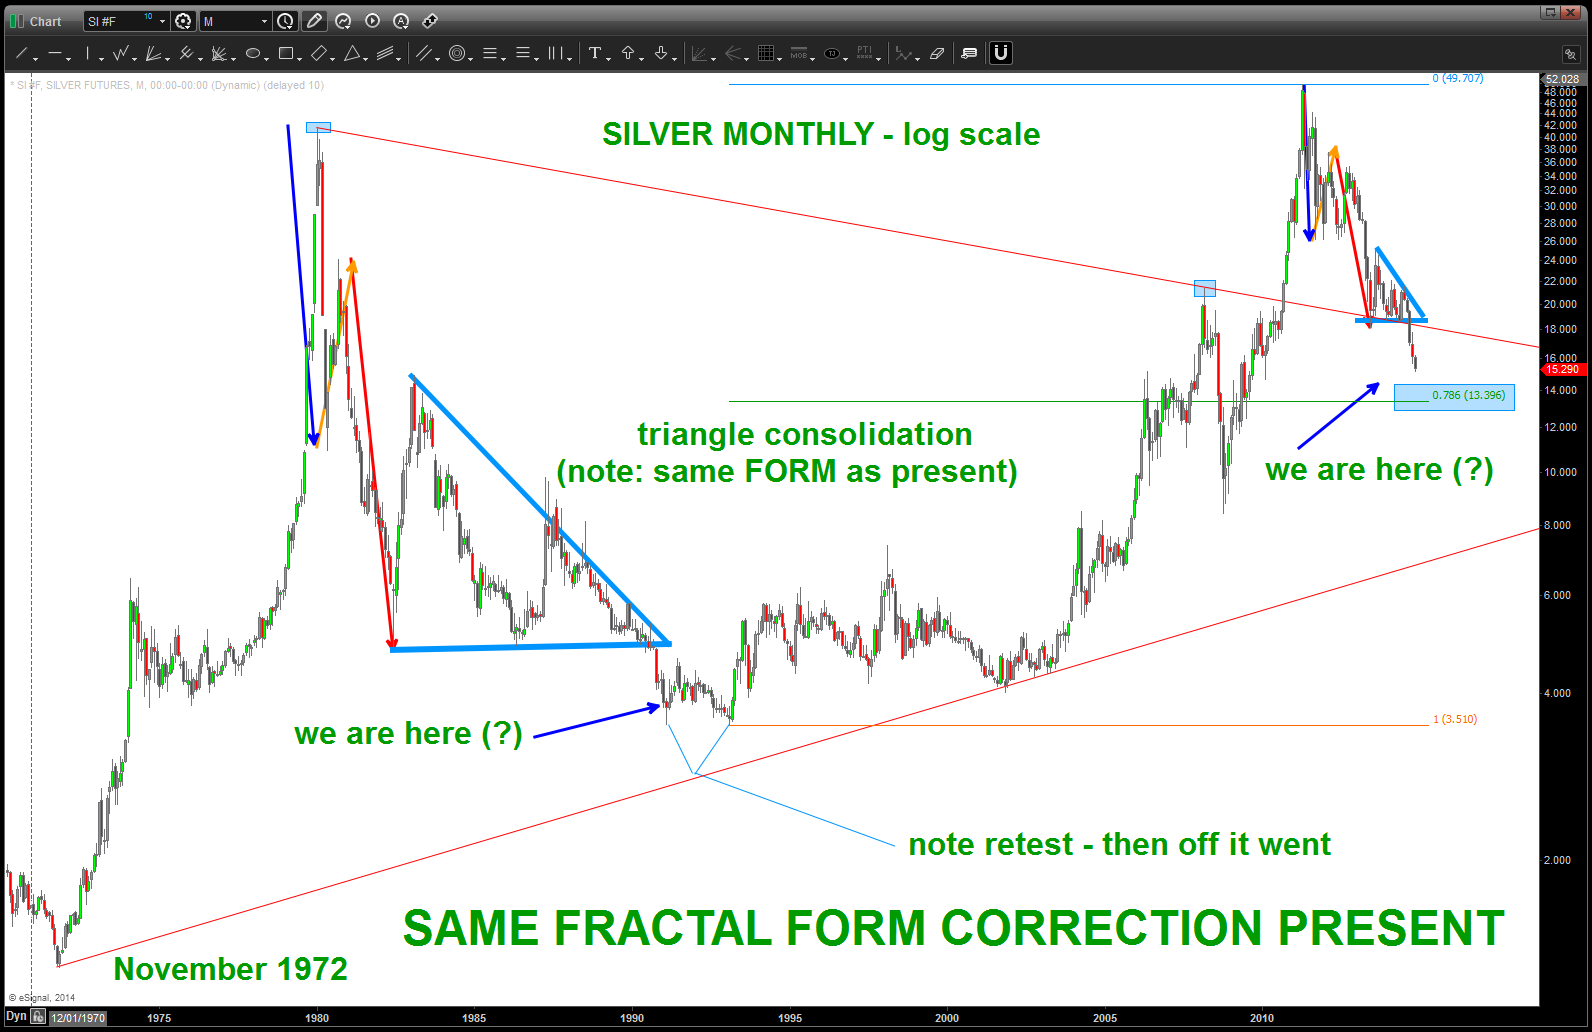
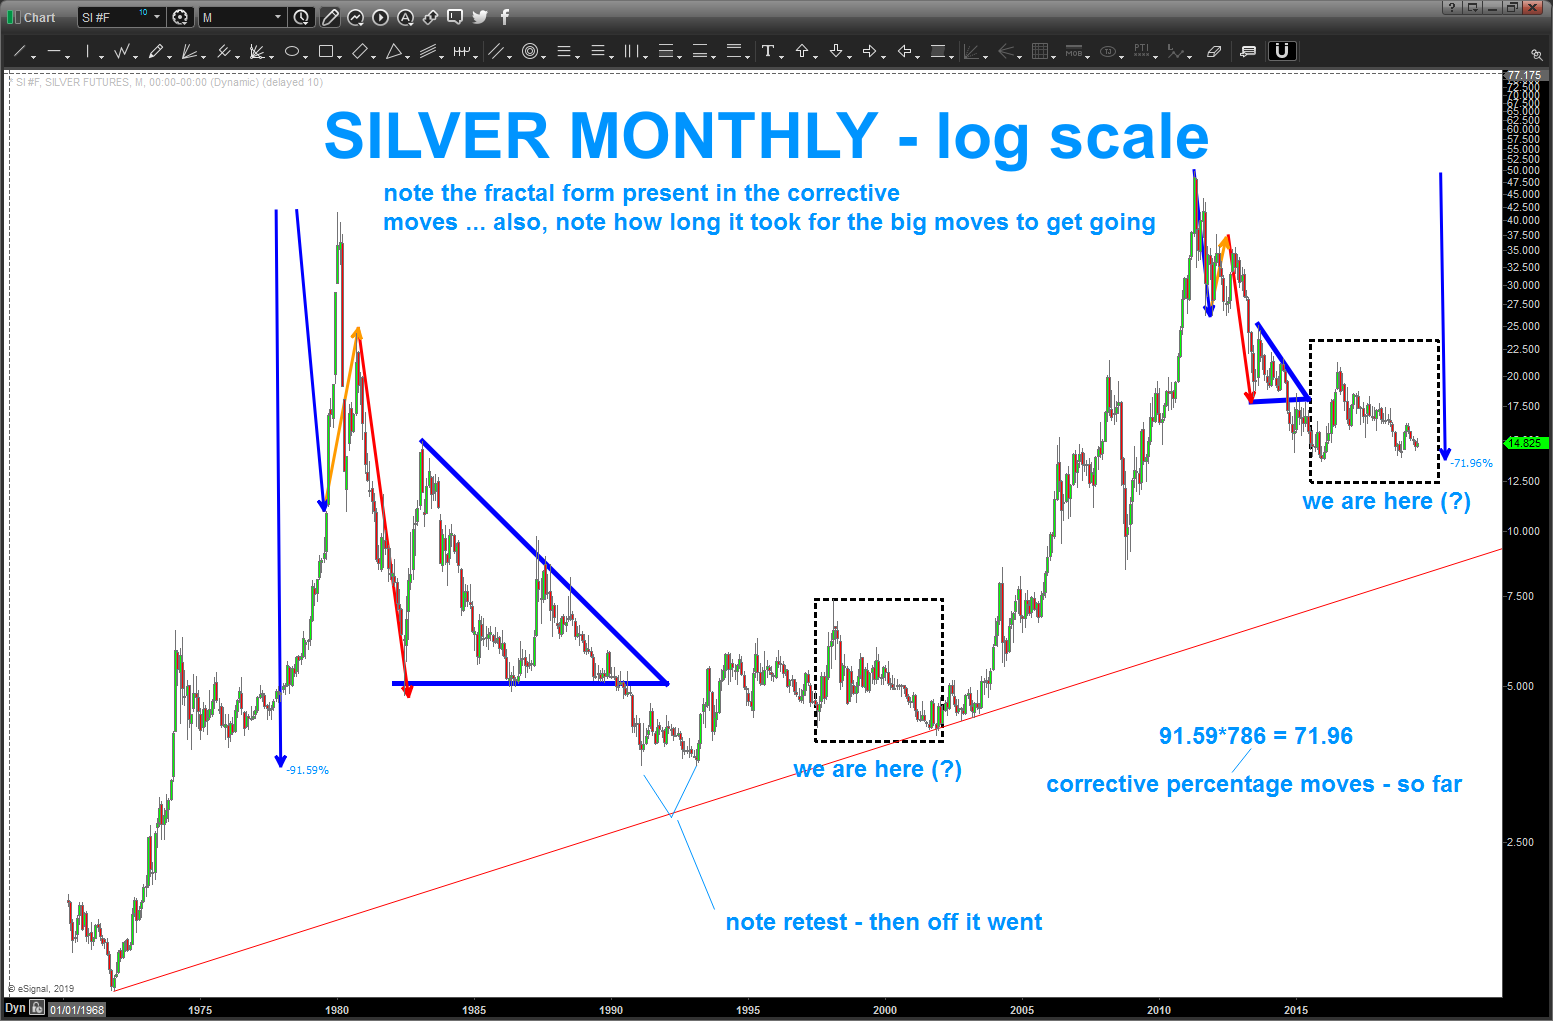
almost 4 years ago I blogged about the Silver Fractal that was present in the LONG TERM (going back to 1972) Silver futures (continuous contract) chart. here’s the link to the blog: https://bartscharts.wordpress.com/2014/11/06/the-silver-fractal-you-want-to-study-this-chart/
so where are we now. Pay attention to the bottom formed in the 1990-2000 – it took a decade to consolidate. have not idea if that will occur again but am looking for silver to hold say 12-14 and once Gold finishes the last leg (e) of the a-b-c-d-e triangle then we might get a very nice run in Silver.
I’ve dashed the black box that is ‘looks’ and ‘feels’ like the same fractal that is present right now …note it does squeak out a new low before it rocks and rolls higher. not sure we have anything to do now, but perhaps sometime in June / July the puppy will start to run w/ the bulls.
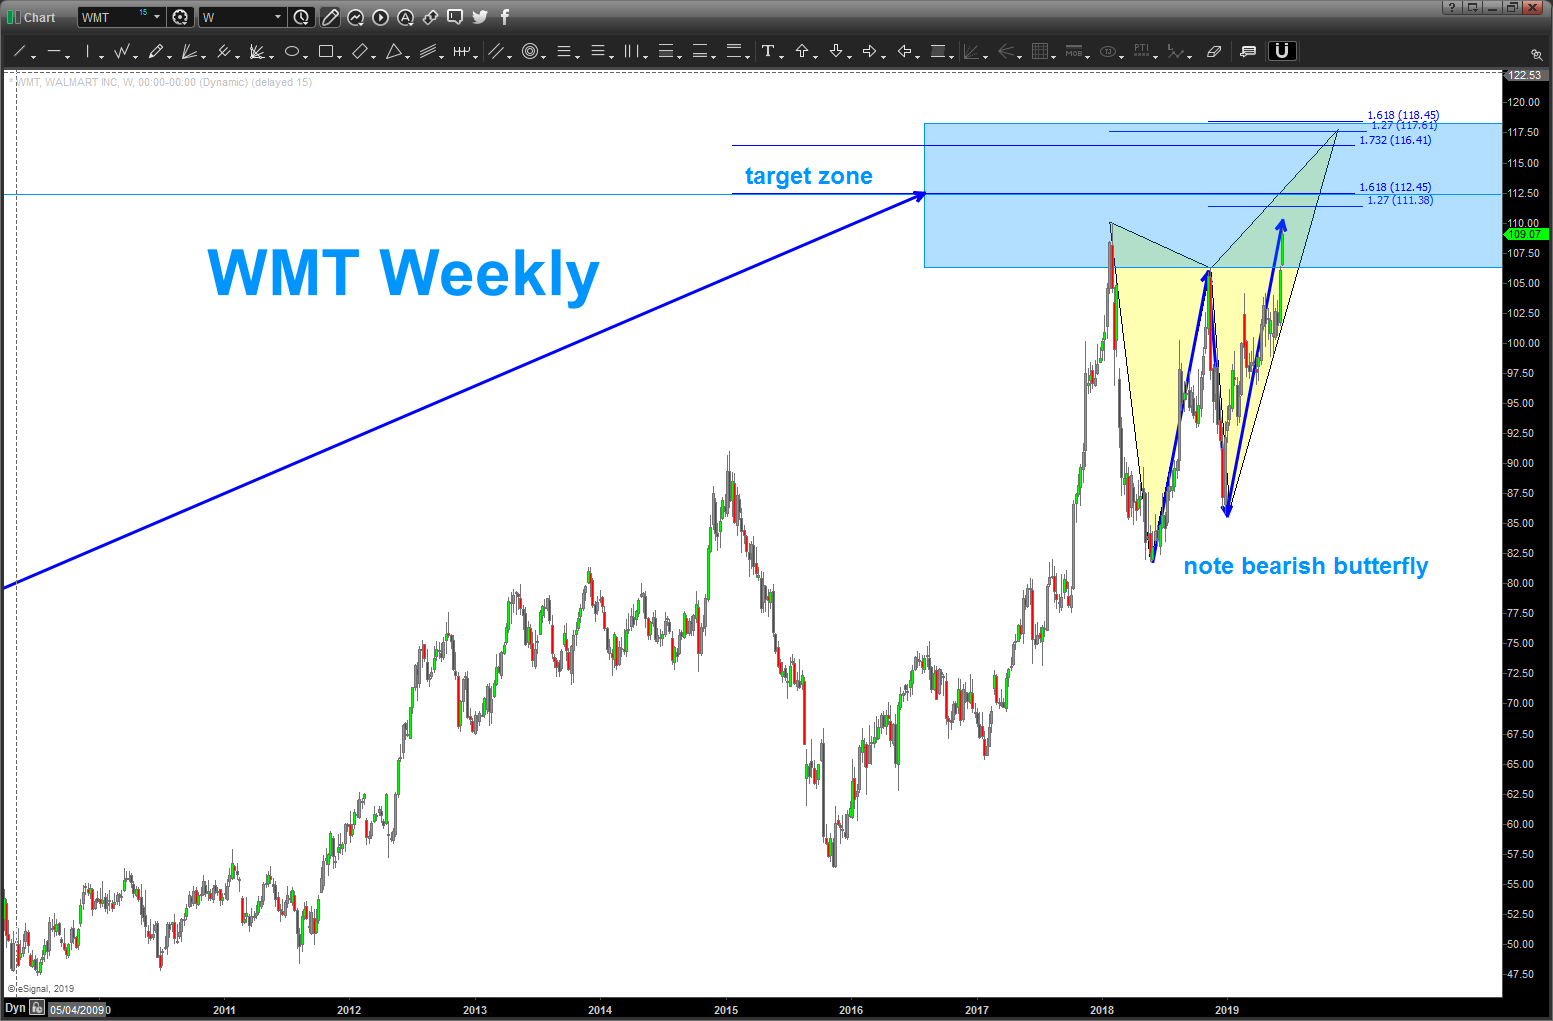
Walmart WMT
Posted on June 16, 2019 1 Comment
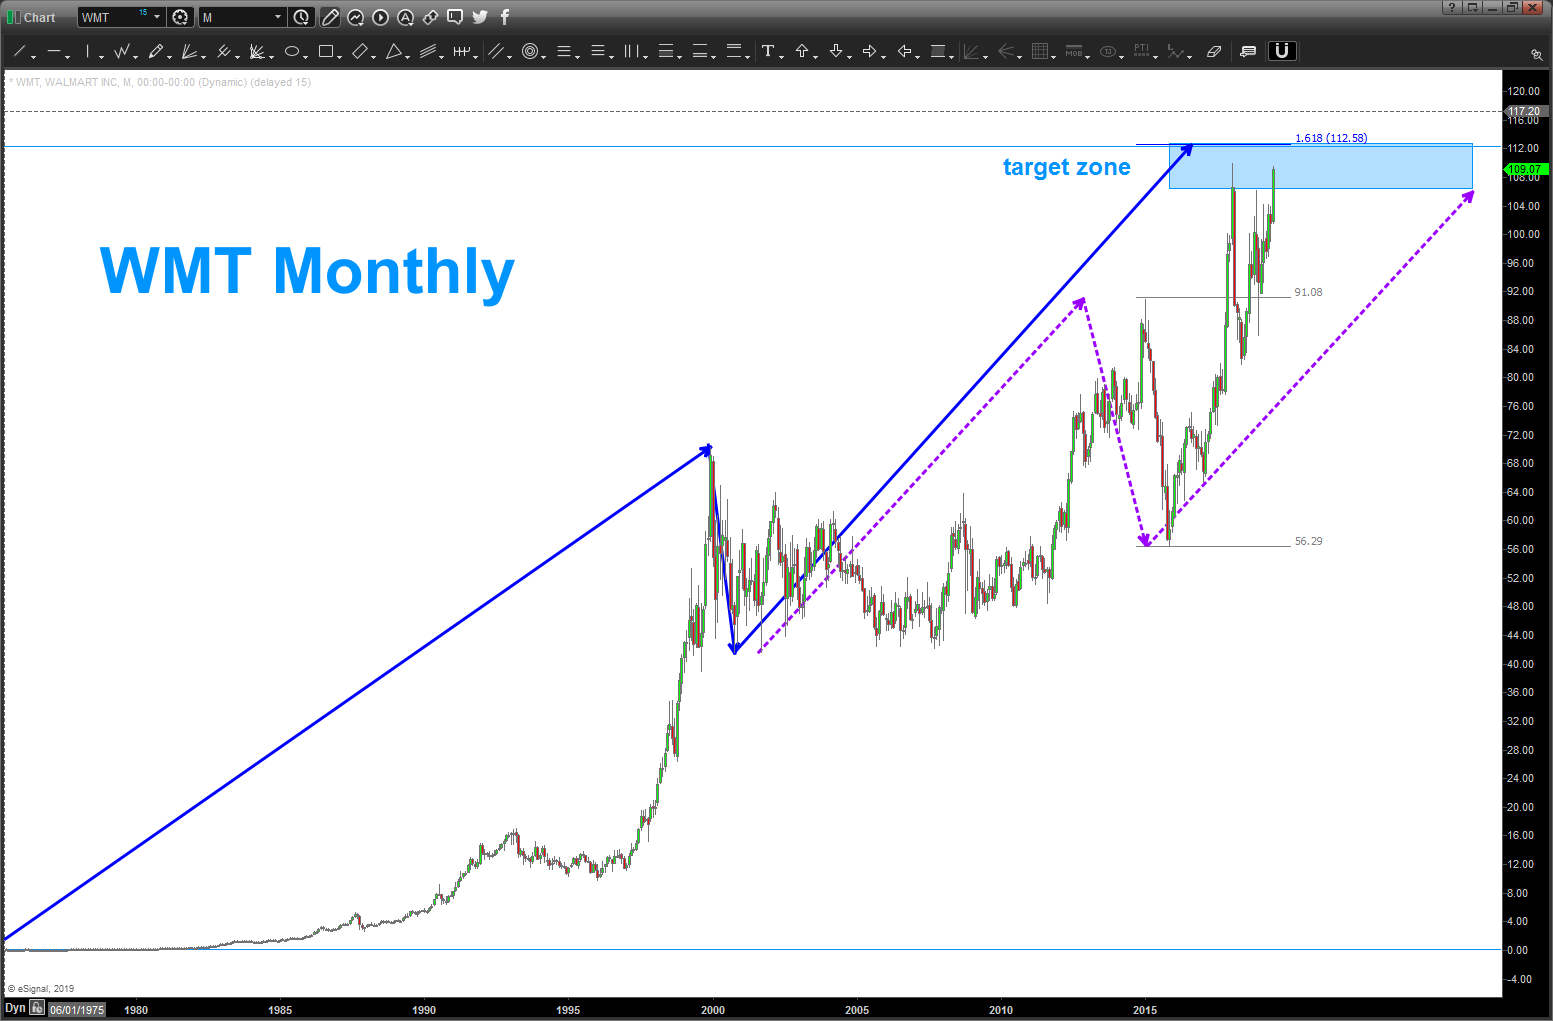
have blogged about WMT here: https://atomic-temporary-44460632.wpcomstaging.com/2016/01/30/wmt-into-the-high-60s-2/
a ‘bearish’ butterfly pattern is forming along w/ a projection from the all time low. Expect 110-120 to be formidable resistance in coming days weeks.
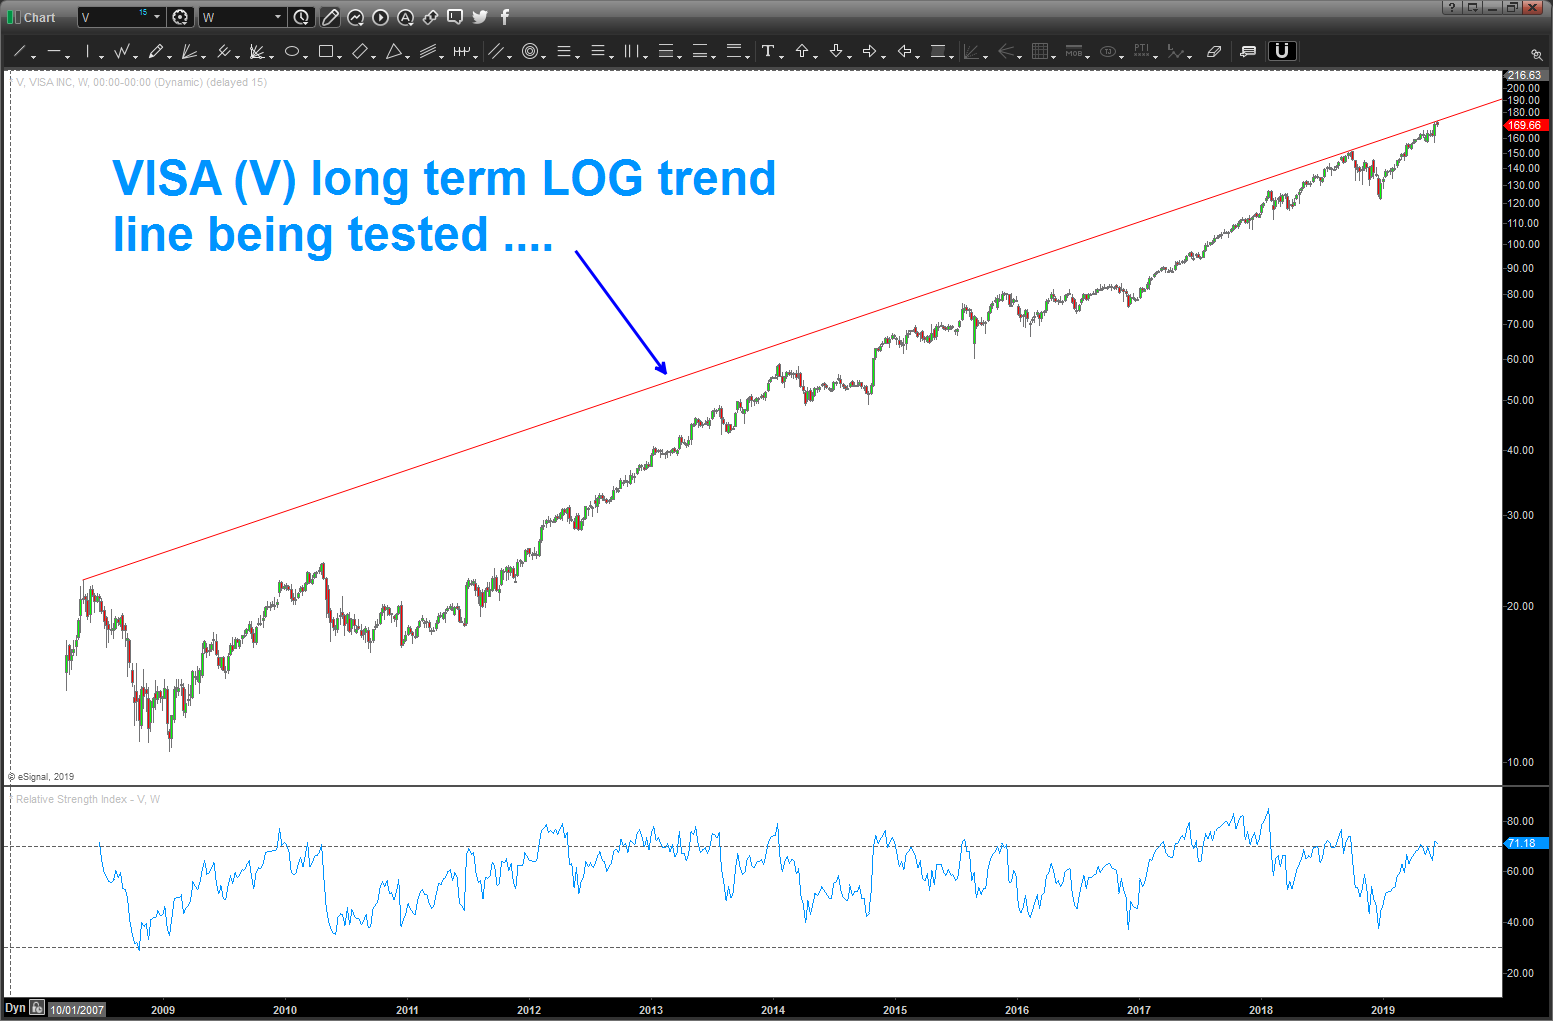
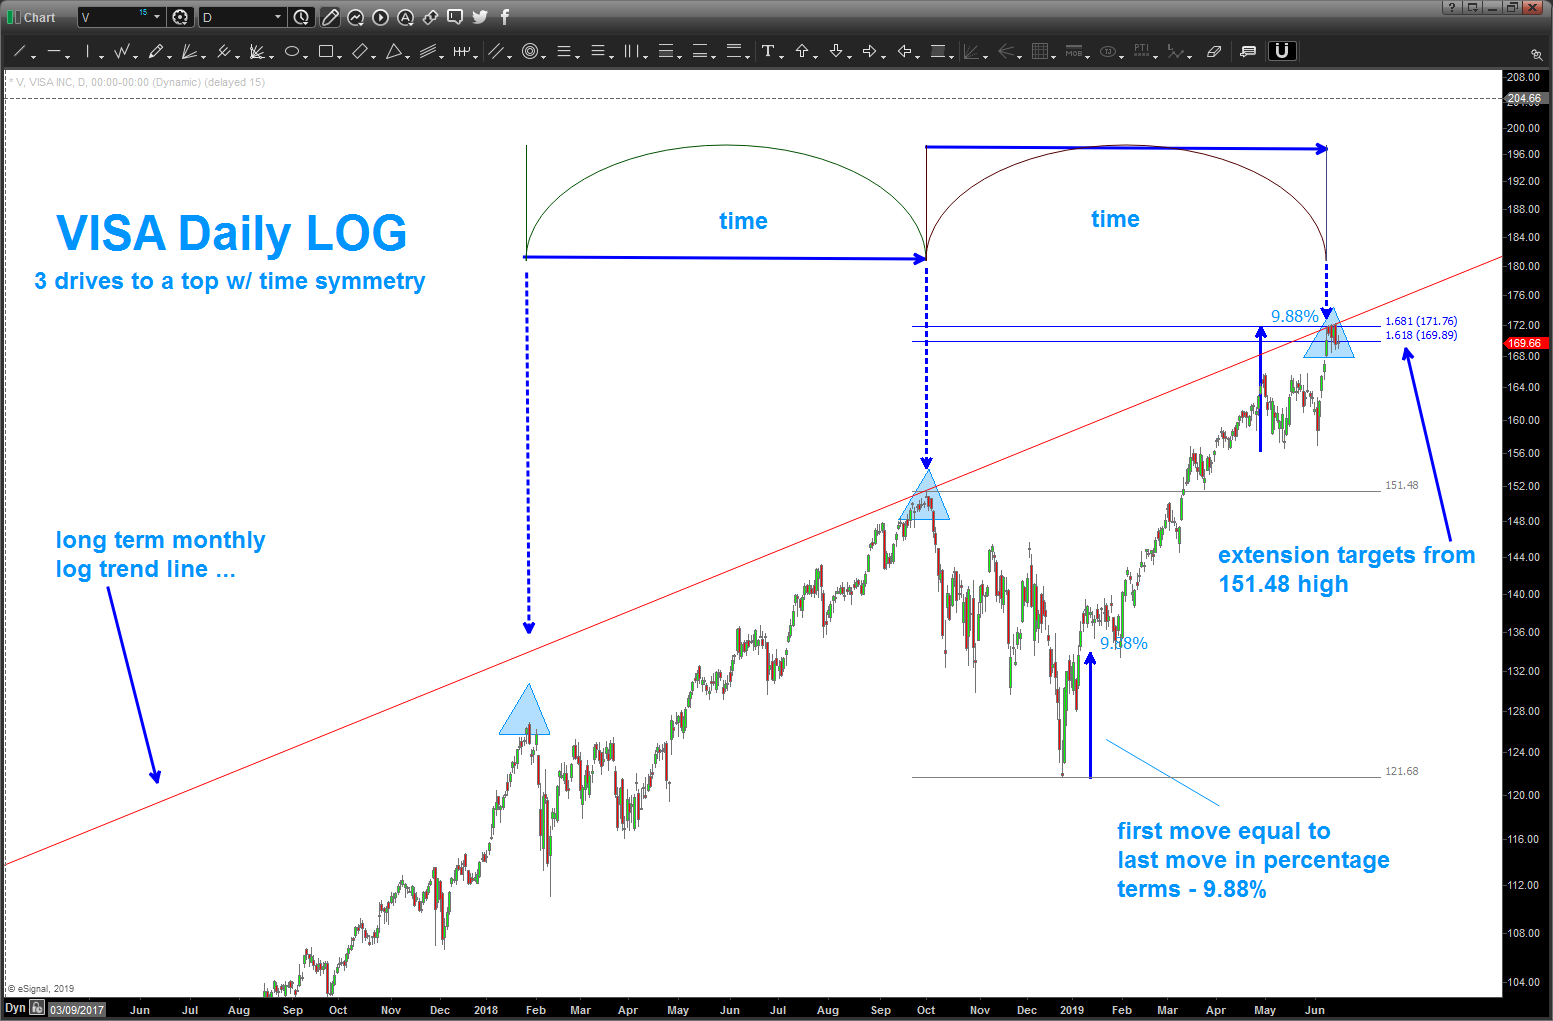
Visa
Posted on June 16, 2019 Leave a Comment
been on quite the tear. expect some near term resistance for now …found it interesting that the all time low + 161.8 exactly equals the high, for now.
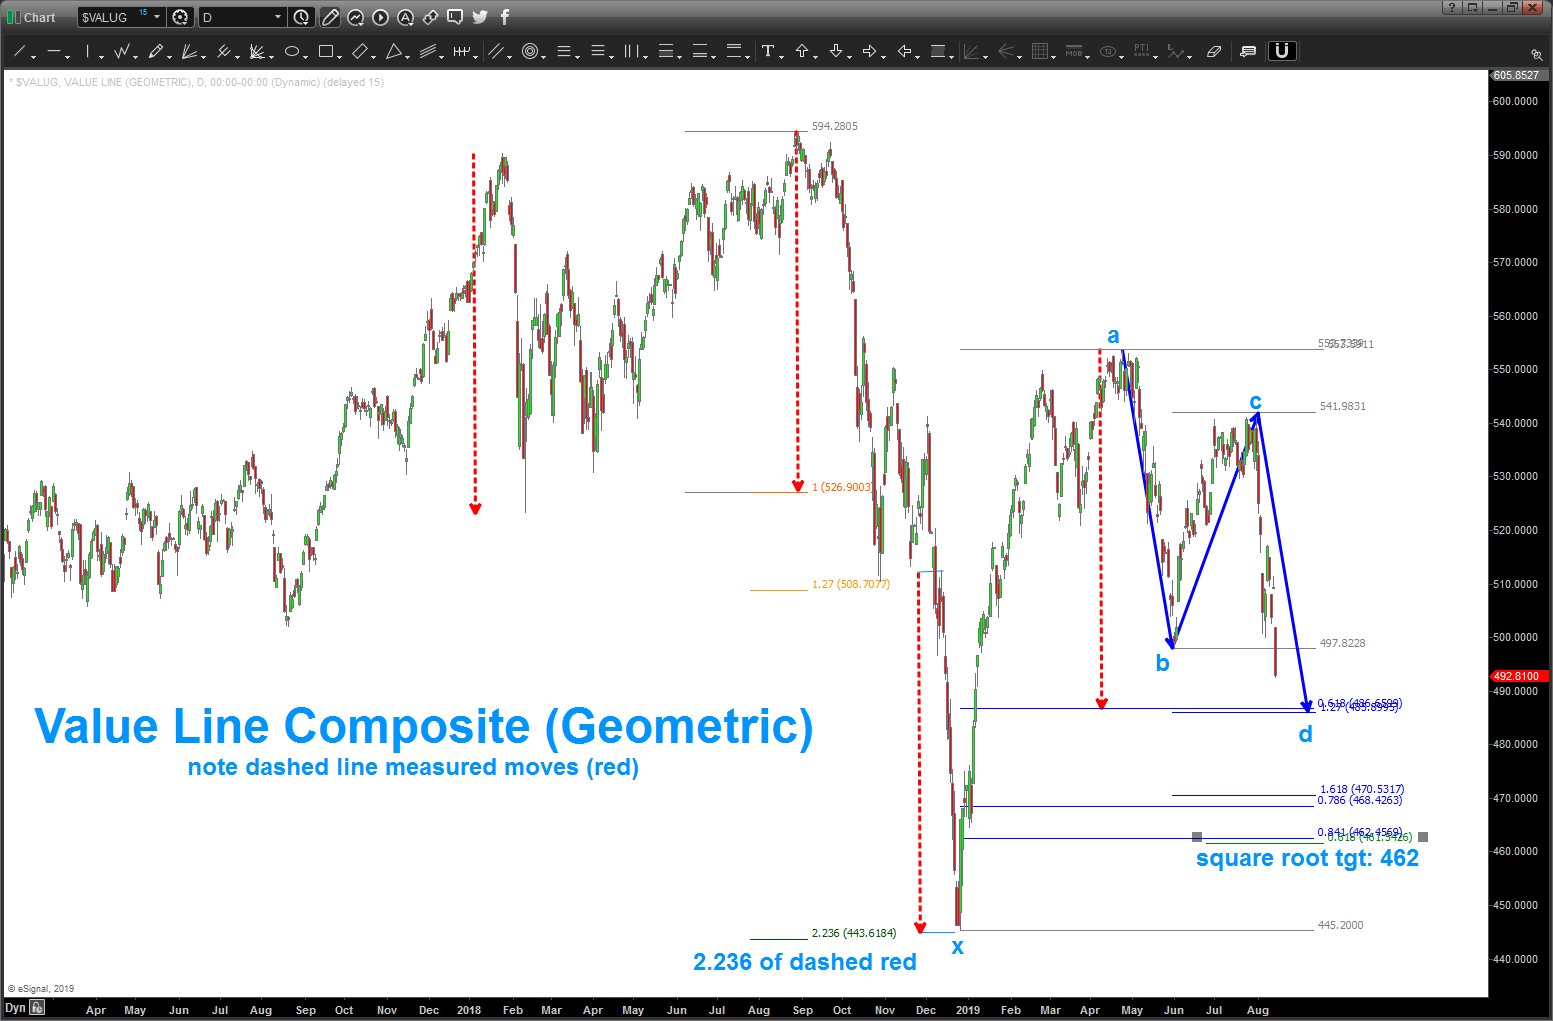
Value Line Geometric – updated 08/14/2019
Posted on June 11, 2019 Leave a Comment
08/14/2019 – a very important BUY PATTERN is appearing on the Value Line Composite (Geometric). Again, it’s all PATTERNS and we don’t know which ones work or which ones will fail … but we can do IF and THEN statements to get an idea of the trend and where are …
in this case we have a PERFECT BUY pattern.
B = .5 XA and C= .786 AB.
D = AB=CD, .618 XA and 1.27 BD
folks, look how the numbers are ALL on top of each other ….also, take a look at the dashed red line which shows pretty much all of the corrections (measured moves) since early 2018. the entire big correction was 2.236*dashed red (square root of 5) and note the dashed red line hits EXACTLY at our PATTERN BUY level of 486-487.
IF we lose this level then the next logical stopping point is 468-470 and/or 461-462. this level represents .618 projection of the big correction, a .841 retracement (musical note) and also the square root target from the 553 high.
What is a reason to be cautious? THRUST .. that’s ugly looking bearish candles of late coming into our pattern level so make the market prove it to you by looking for a signal reversal candle UP …
Expect the market to find support on one of these three levels .. if not, lookout below.
Bart
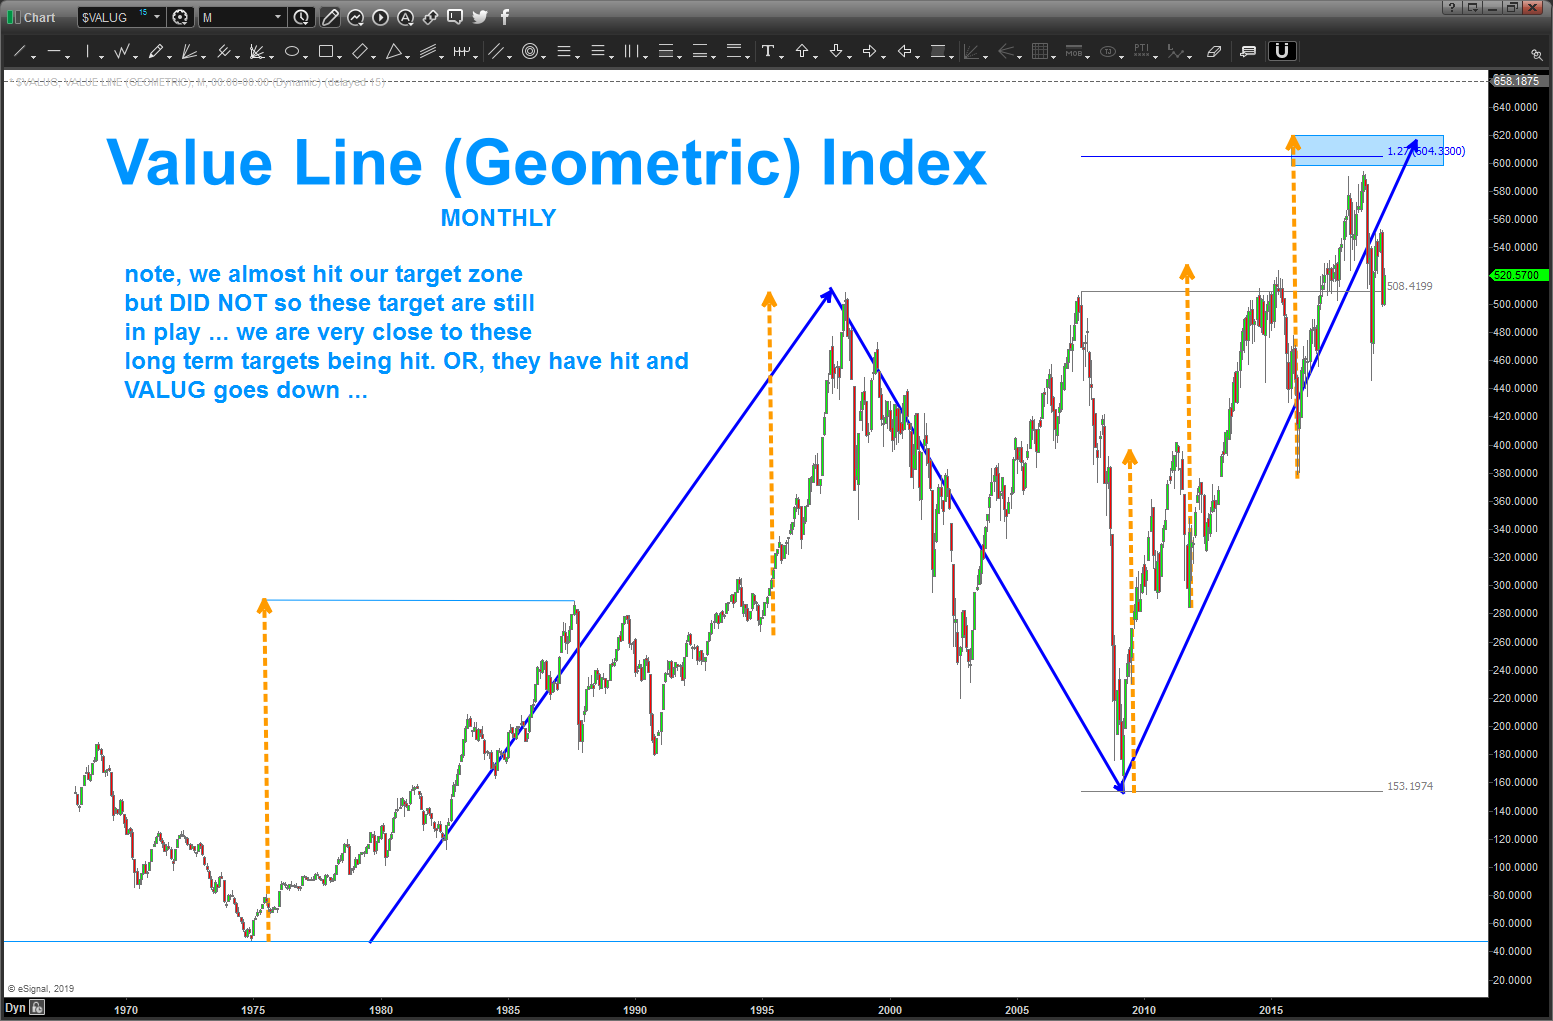
last time I blogged about the Value Line was here: https://atomic-temporary-44460632.wpcomstaging.com/2018/03/04/value-line-geometric-index-another-10-to-go-updated-03-04-2018-2/ note the target zone of late. it STILL hasn’t been tagged so those targets are still out there … I’d put this one on your radar as we got REALLY close to tagging the lower end of the target zone and sold off … any rally above the old all time highs should be met w/ caution due to the presence of the long term targets overhead …
this is a great index to watch for the overall health of the market … In basic terms, the Value Line Geometric Index eliminates an illusion created by cap-weighted index components.
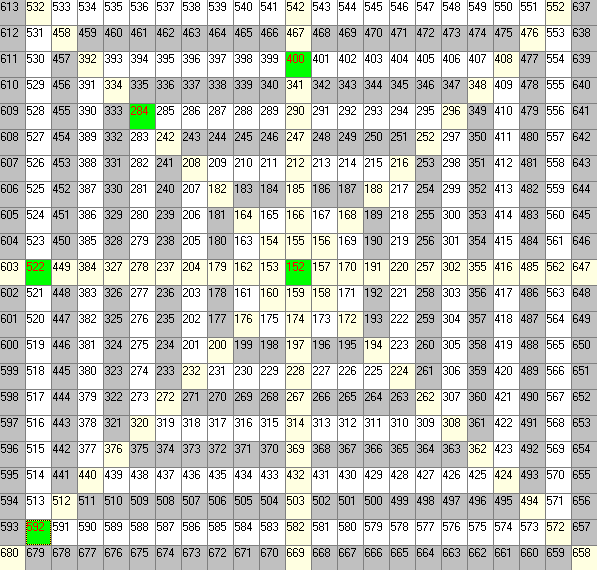
here’s some harmonics using the all time low of 47 and the square of 9
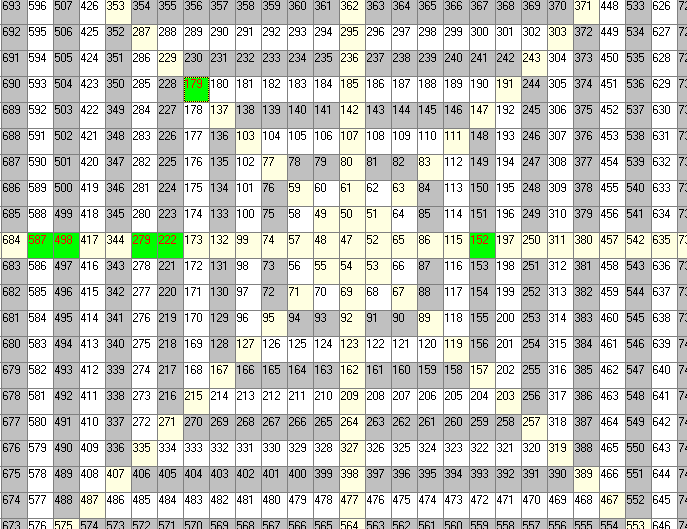
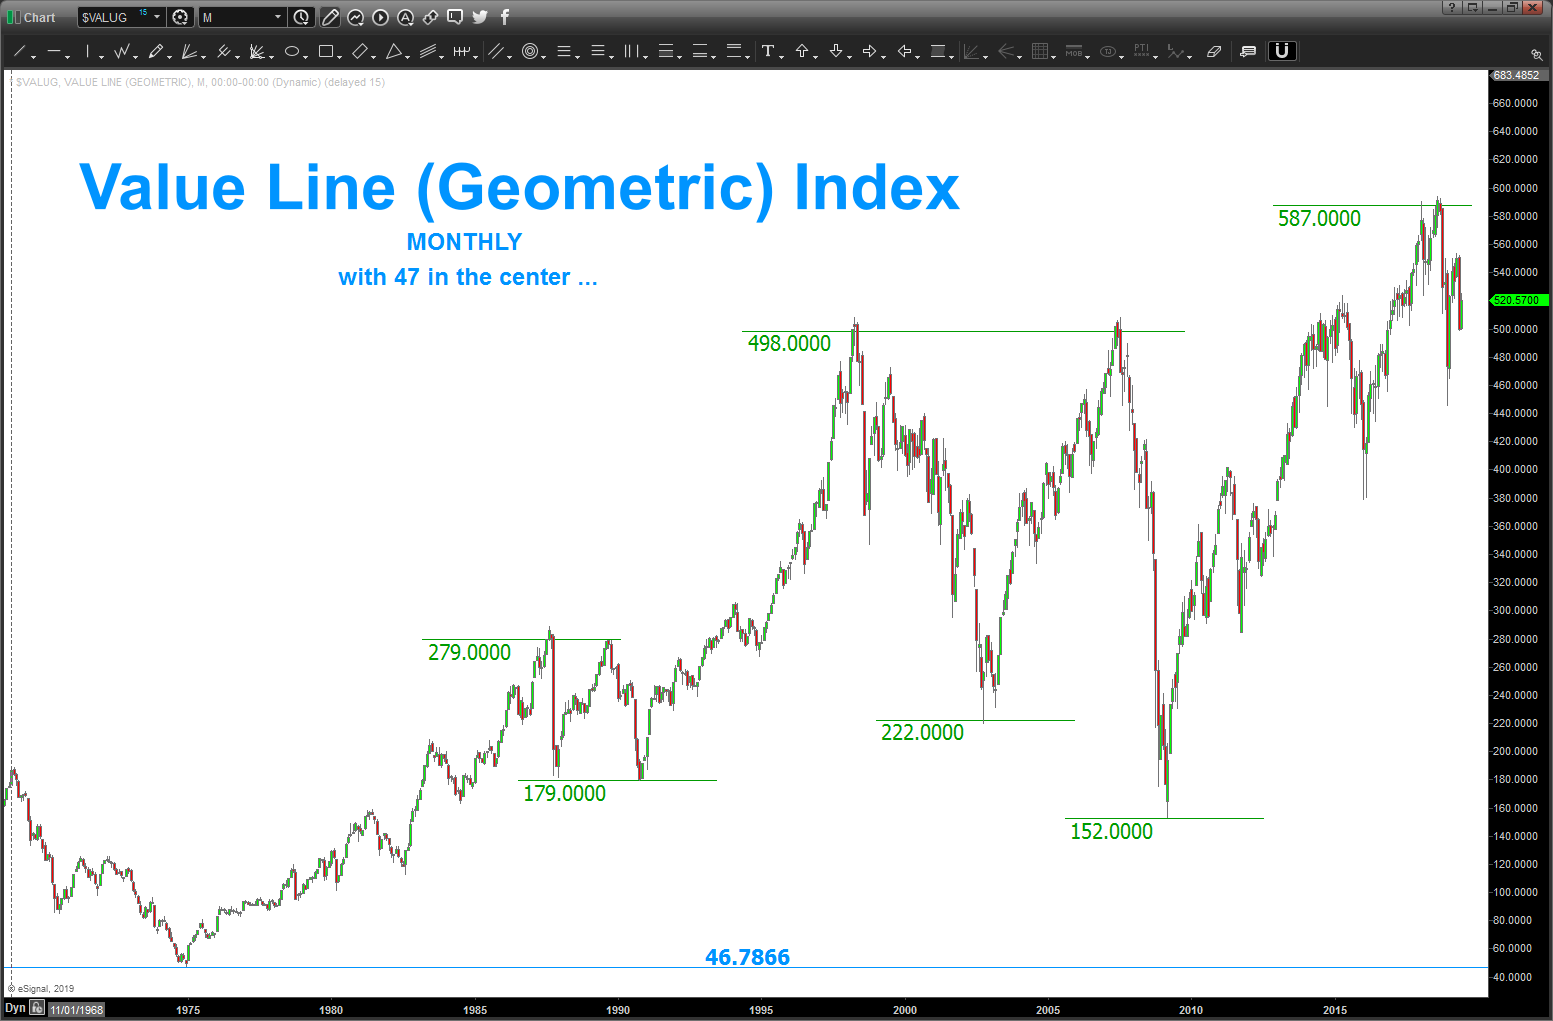
this last leg begins at 152 so I’m going to put that in the center …and I did NOT do this before and then show it .. I’m doing this real time. Just looking to see IF the highs and lows correspond to 45 degree angles on the square of 9 from a PRICE PERSPECTIVE. Since we (at least me) believe that PRICE equals time there is a time component to this puzzle that can also use the square of 9. That’s too much for this blog for now .. but, do yourself a favor and ‘pull’ the middle number UP and then you’ll see a pyramid (yes I’m making reference to the GREAT PYRAMID in a blog about the Value Line) I wonder if the ancient Egyptians tracked planets and seasons and TIME via these same 45 degree increments? Perhaps? Perhaps not …there’s some other neat stuff to do w/ the square of nine based on ‘other’ numbers that are ‘interesting’ or ‘important’ for certain dates or angles. Study ‘cycles’ and you’ll see.
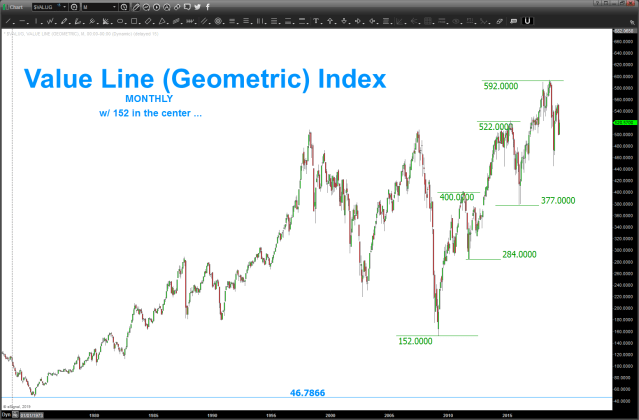
either way, I see some major resistance HERE or a little higher in the Value Line.
Just a pattern dude so don’t try to confuse me w/ all the smart fundamental stuff. It makes my head explode.
GN – Bart
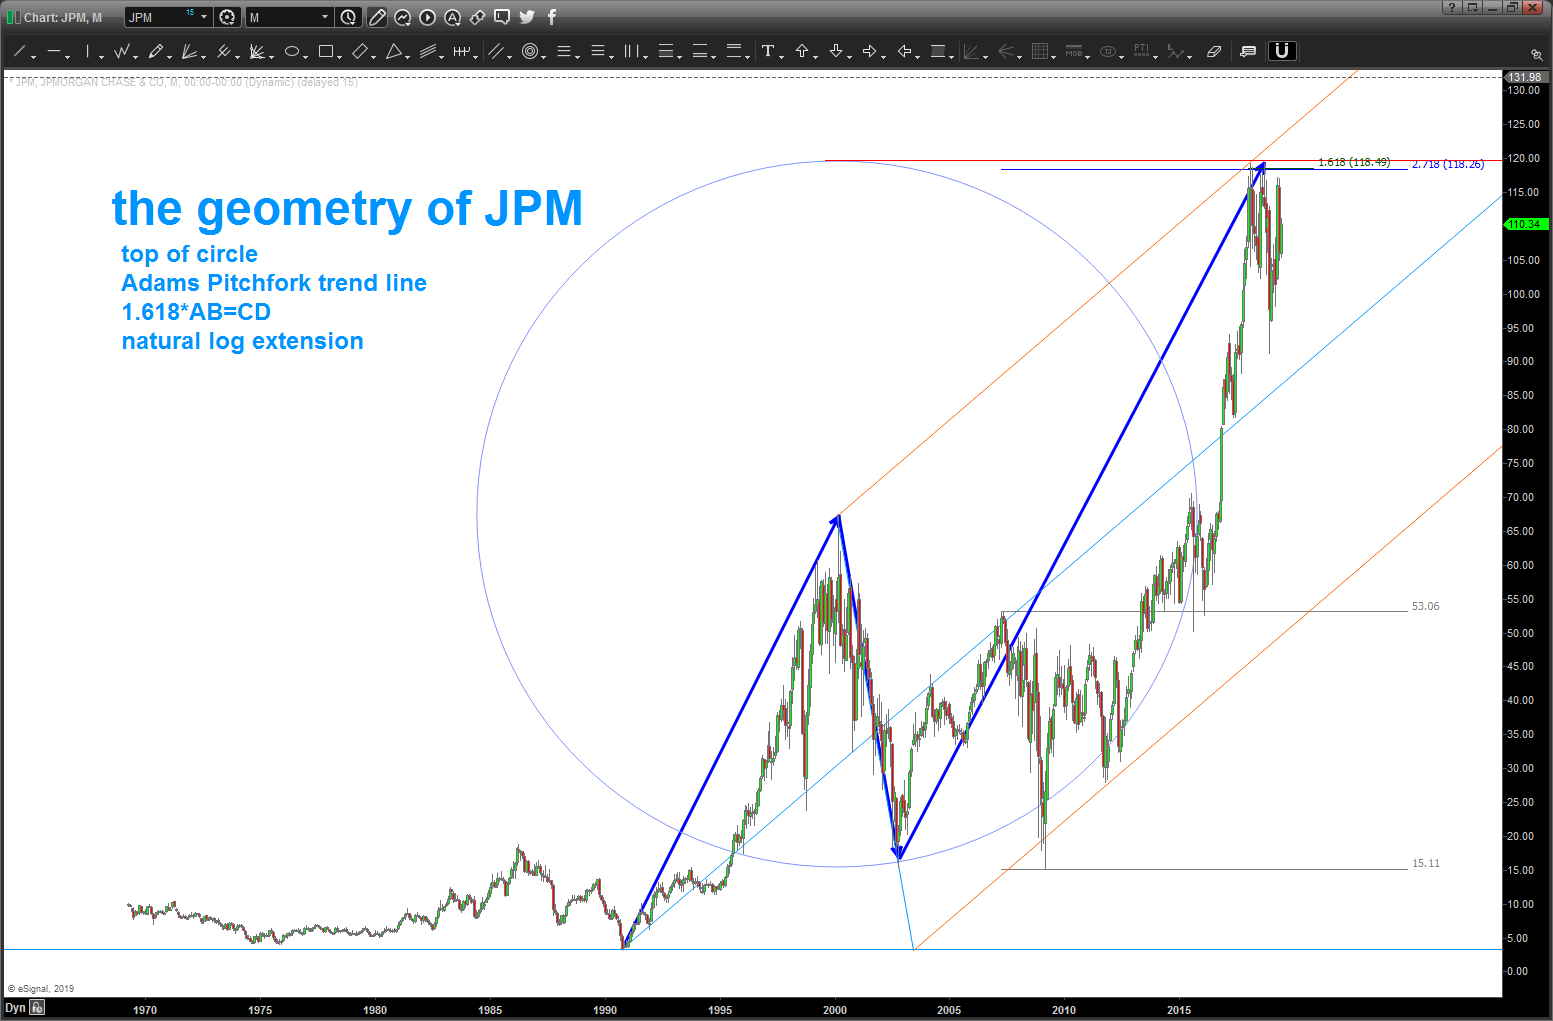
update for the JPM geometry
Posted on June 10, 2019 Leave a Comment
blogged about JPM a while ago: https://bartscharts.wordpress.com/2018/08/30/jpm-and-tops-of-circles/ saw a bunch of geometry coming in around 120 and, thus far the geometry has held for almost 1.5 years .. would stay away until this level is exceed on a monthly close above the 120 level … geometry is holding it …
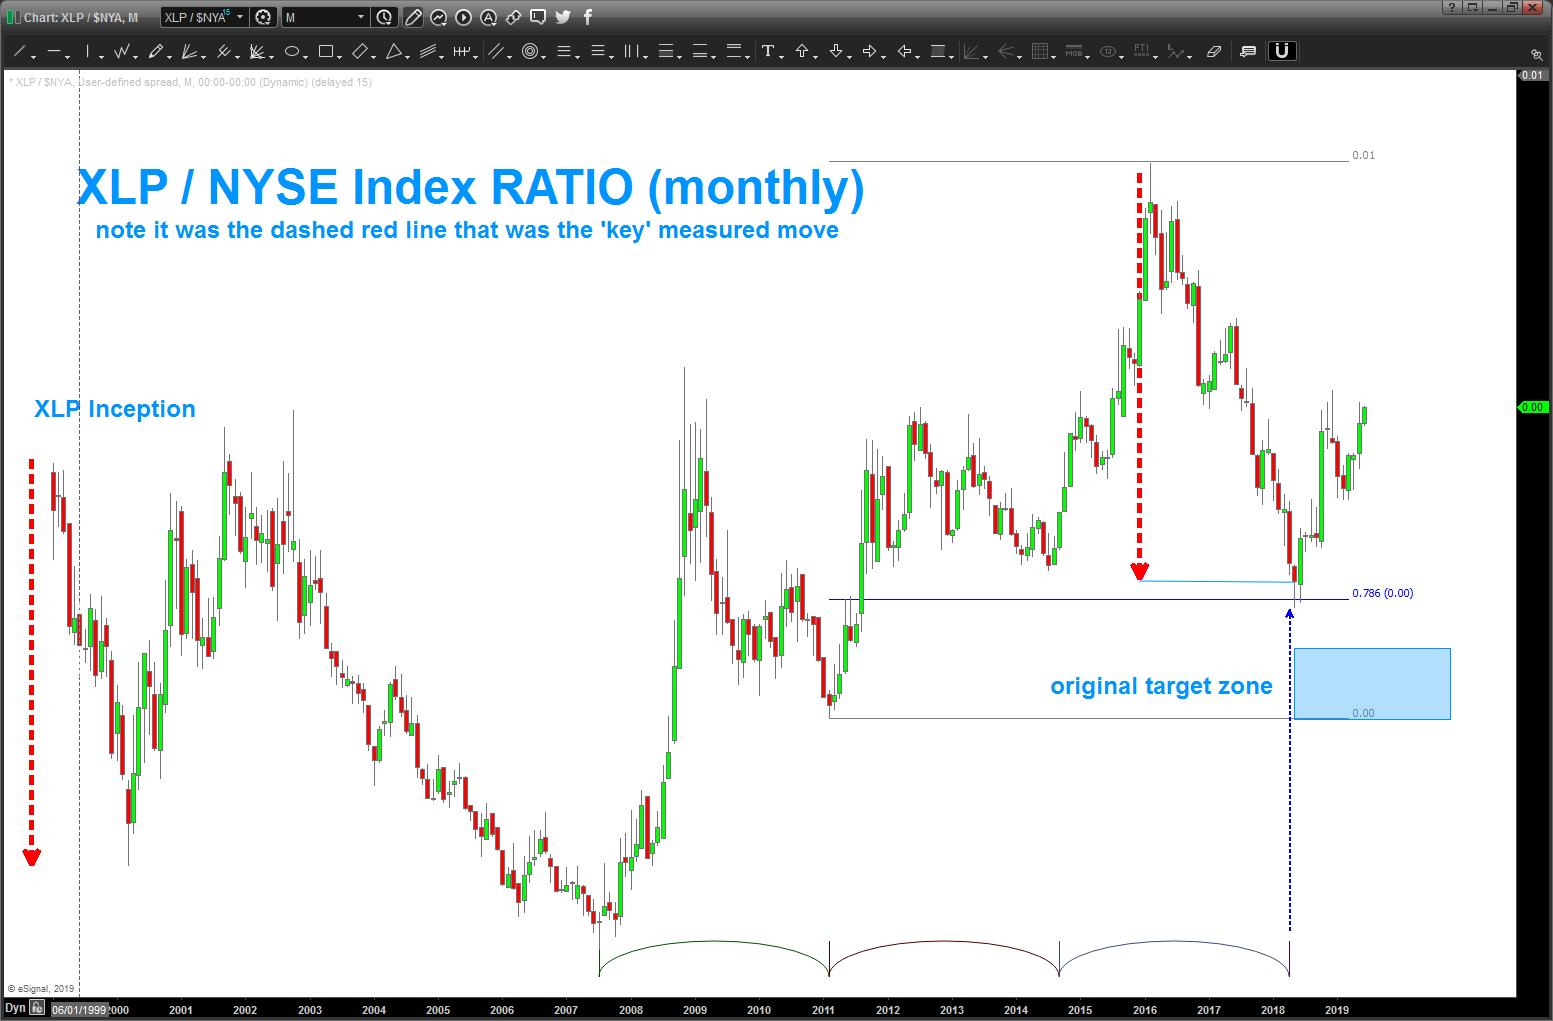
XLP/NYA ratio analysis – an update
Posted on June 9, 2019 1 Comment
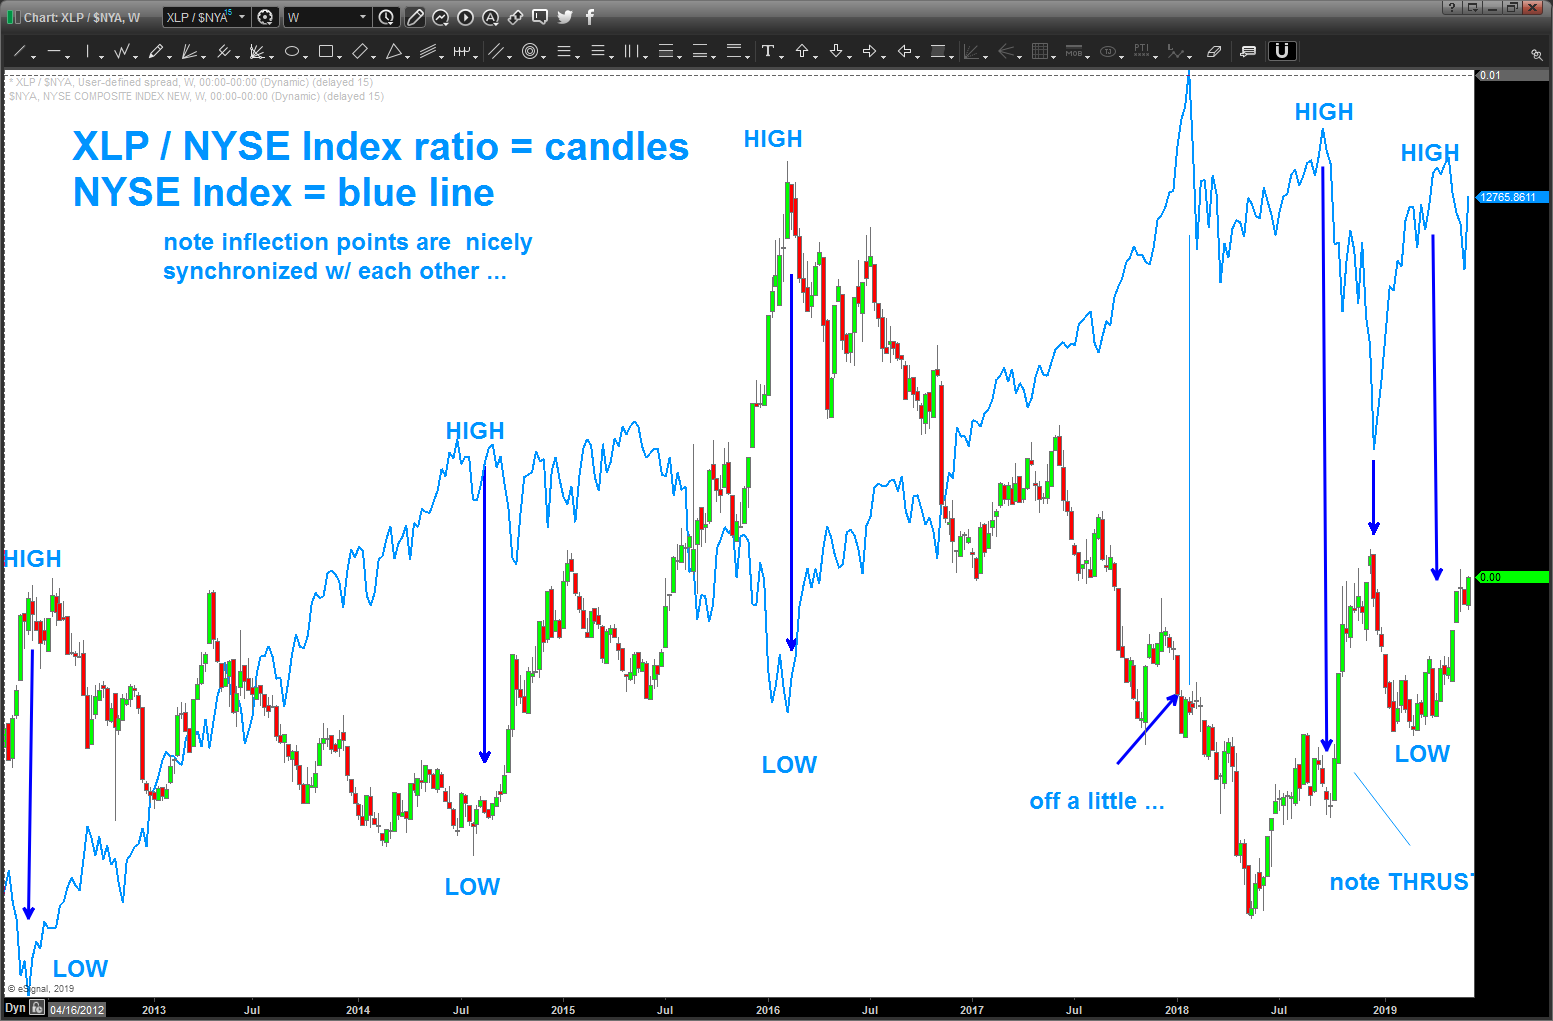
06/09/2019 – back to our old favorite. you know I’ve been watching this one for a while. I was hawking a low in the ratio in mid-2018 but missed it from a time perspective … then, in retrospect, easily saw the measured move and the .786 retrace. I’m human, I missed it. should have been more diligent – especially w/ the time cycles coming in from the 2007 low. the TIME had worked as support before so why not now …? Oh well.
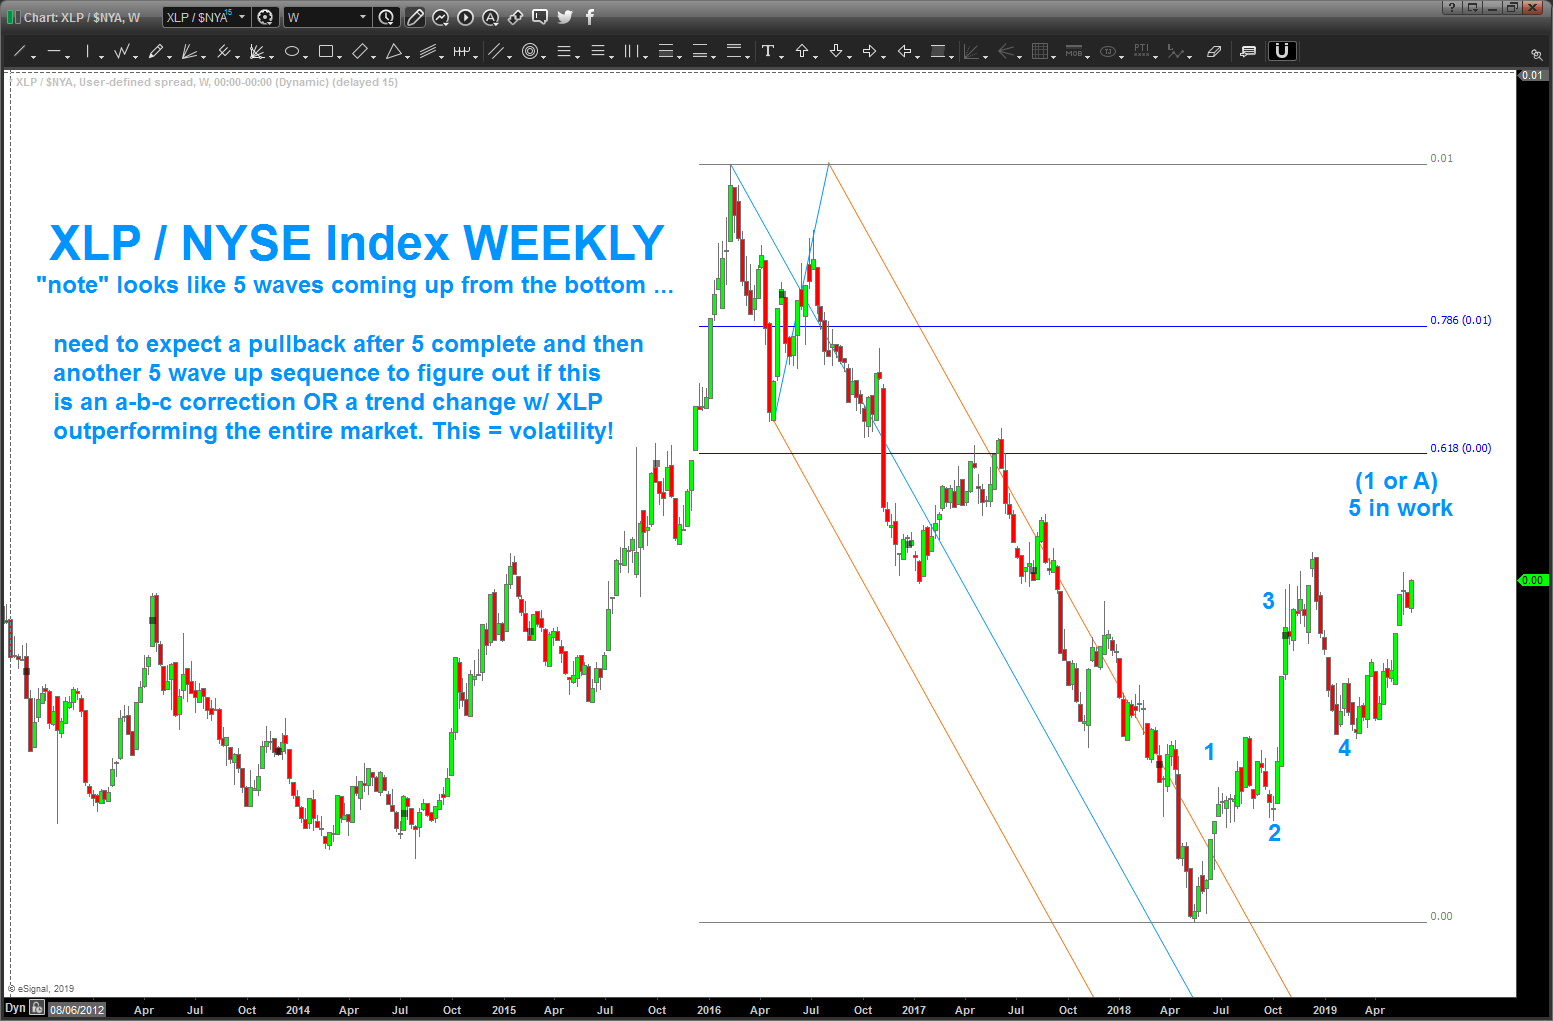
now, we can pretty nicely see 5 waves up and we are in the 5th wave up .. could be a 1 or an A. only TIME will tell. I feel reasonably certain that after a pullback on the ratio (less volatility, higher stocks) there will be another 5 wave move higher if this analysis is correct.
I’ve also included an overlay of the NYSE Index and the XLP/NYA ratio to show the thesis that – by using patterns to ratio analysis we can find potential inflection points. in this case – staples (XLP) represent a risk off mindset (volatility/selling) when they outperform the overall market (the ratio goes up). when the overall market (NYSE Index) outperforms (the ratio goes down) then risk is on and the market volatility should go down and prices go up. Seems to work …
so, 5 waves up from the bottom, 3 wave pullback and 5 waves up … that’s what were looking for, right now. TIME will tell.
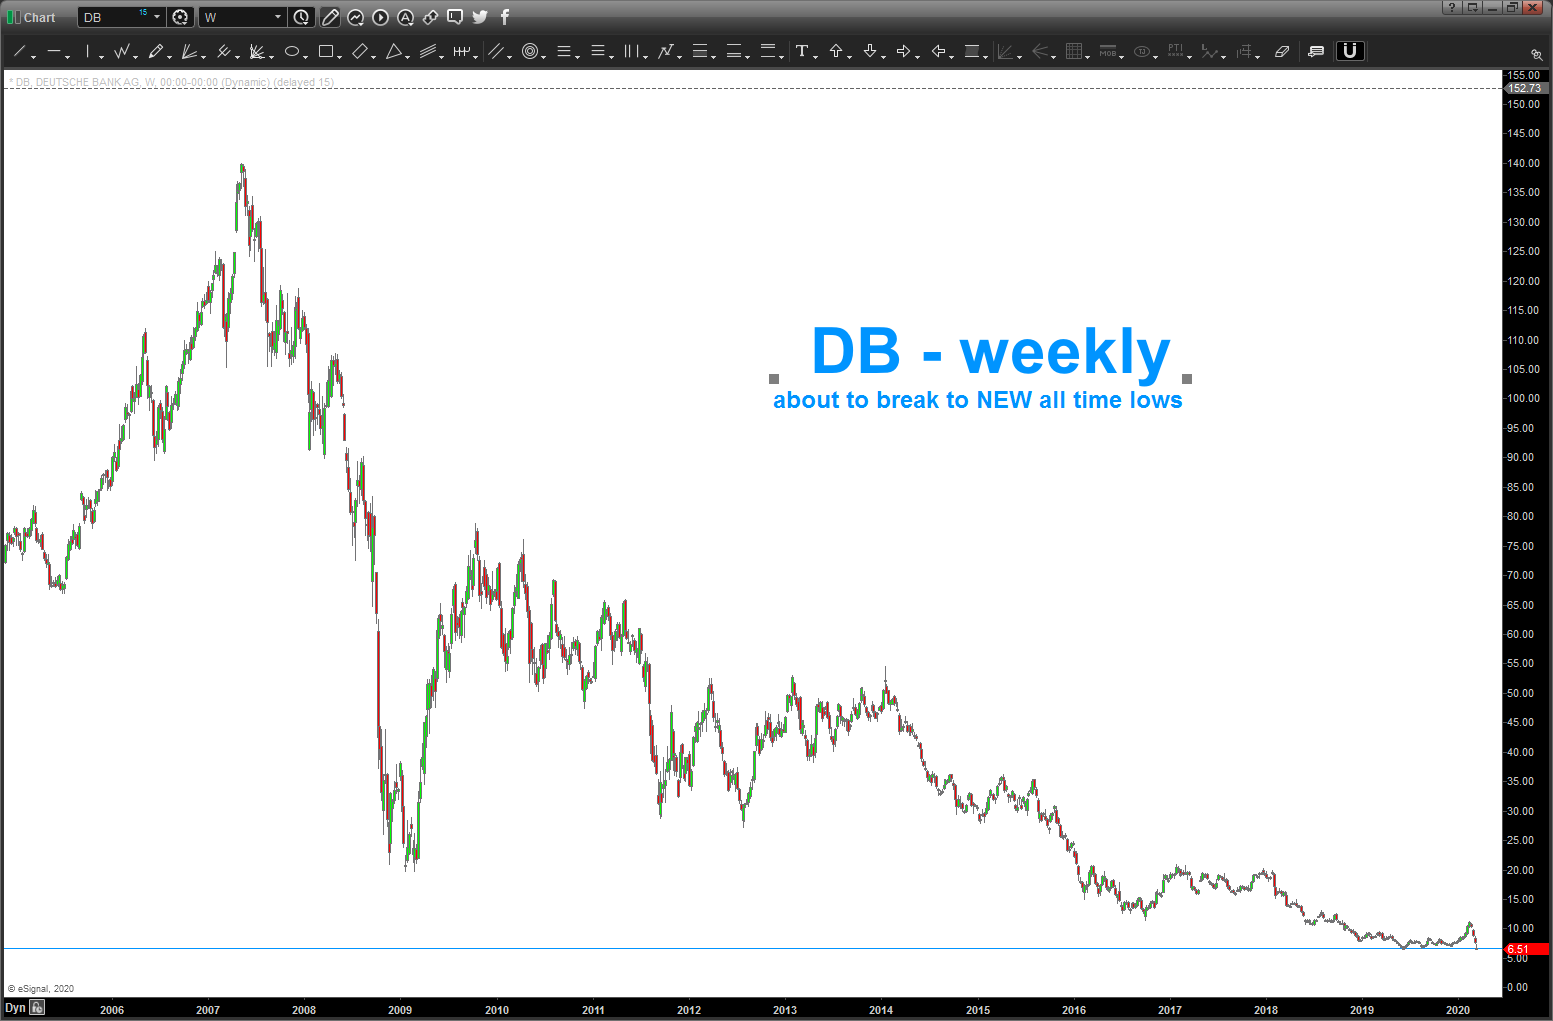
DB Oblivion …redux 03/11/2020
Posted on June 9, 2019 Leave a Comment
03/11/2020
the epicenter of the Corona Virus is China.
the epicenter of the REPO crisis is DB. DB breaking to new lows is NOT A GOOD THING. ding ding … here comes the REPO train and we DO NOT want to be on it …
you can follow the saga of DB here: https://atomic-temporary-44460632.wpcomstaging.com//?s=db
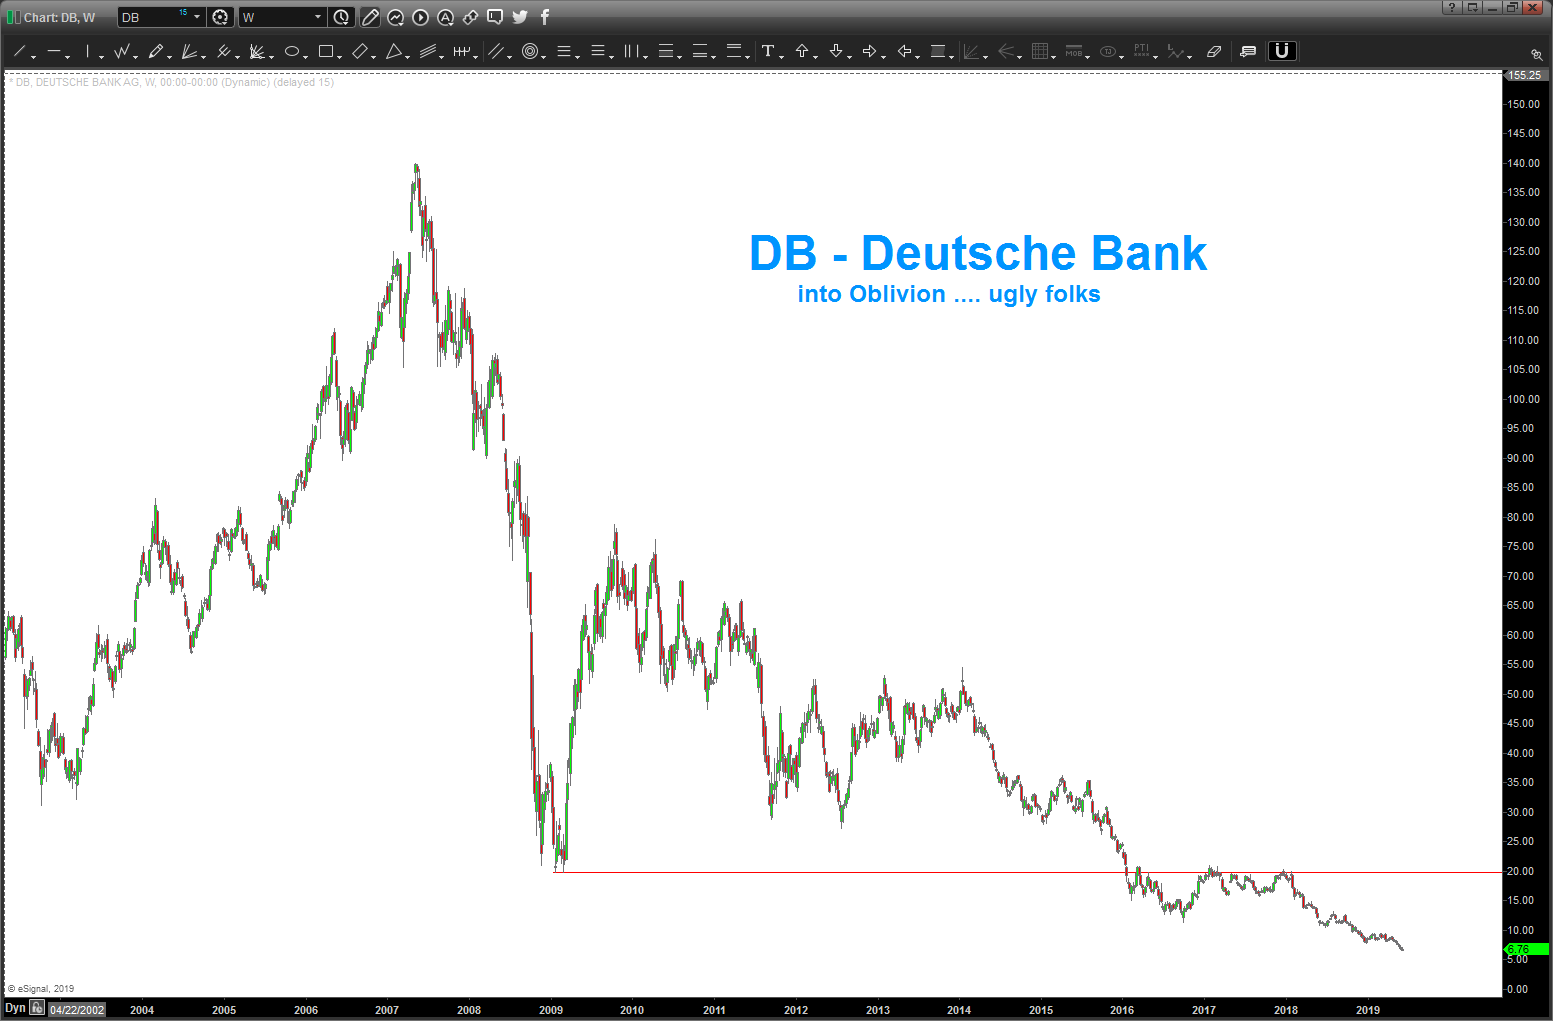
what a mess … reminds me of the title to this movie …

Utilities – again, ugh
Posted on June 8, 2019 1 Comment
If you’ve been following me, I saw a very nice SELL PRICE and TIME PATTERN on the Utilities. It worked for a while and then failed as the Utilities continued to climb. I was stopped out of the TBT long I tried and, while not exactly correlated, you can sometimes look at the Utilities and Rates. Figured w/ the SELL PATTERN coming on the Utilities then the TBT should go up. They failed. Back to the drawing board.
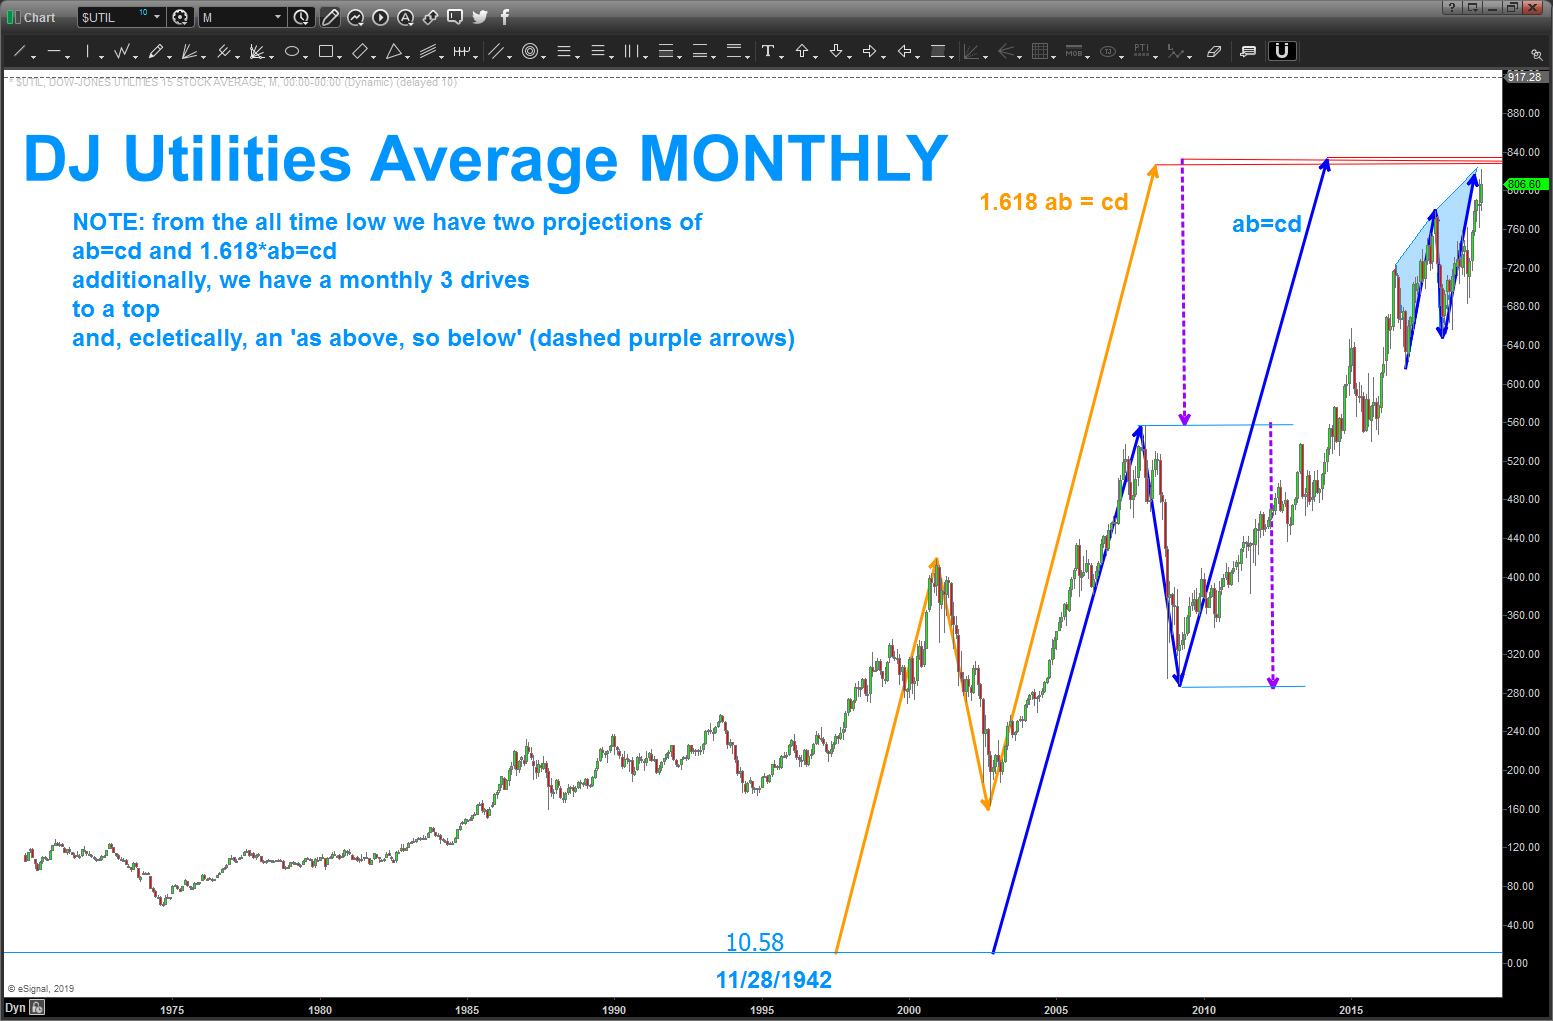
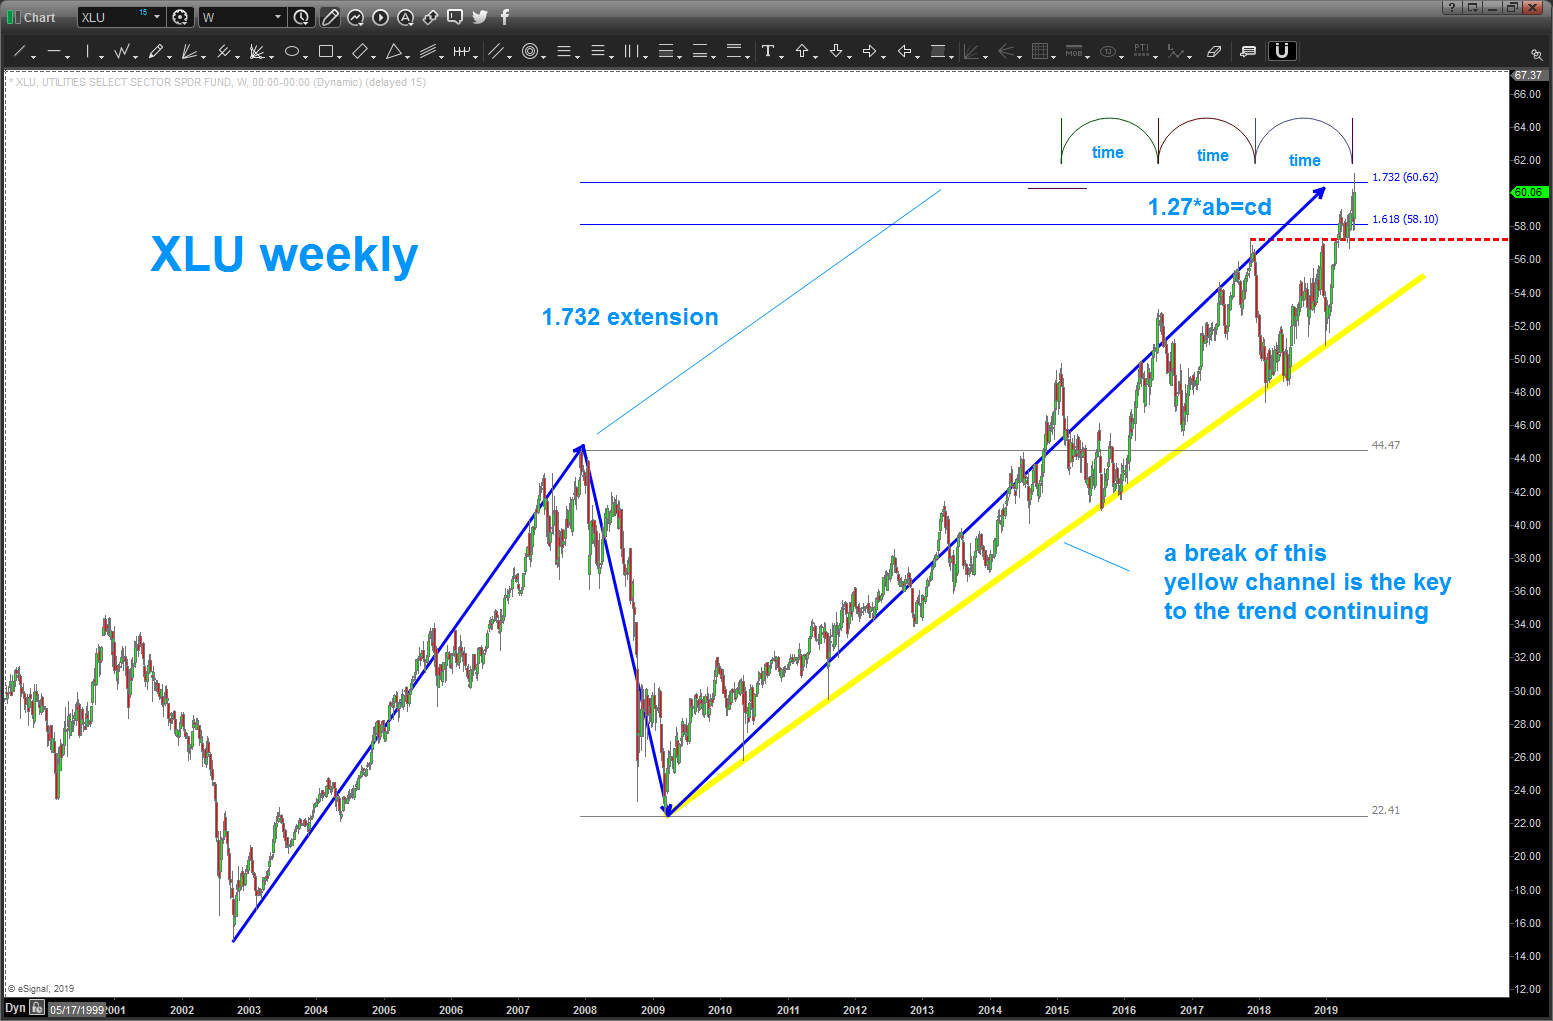
so, with fresh eyes, again, I took a look at the Utilities and – again – I see a long term SELL Utilities hitting right now. So, again, folks I’m a pure play pattern recognition investor. ZERO fundamentals. A lot of times the PATTERNS work and sometimes they don’t … probability is in my favor.
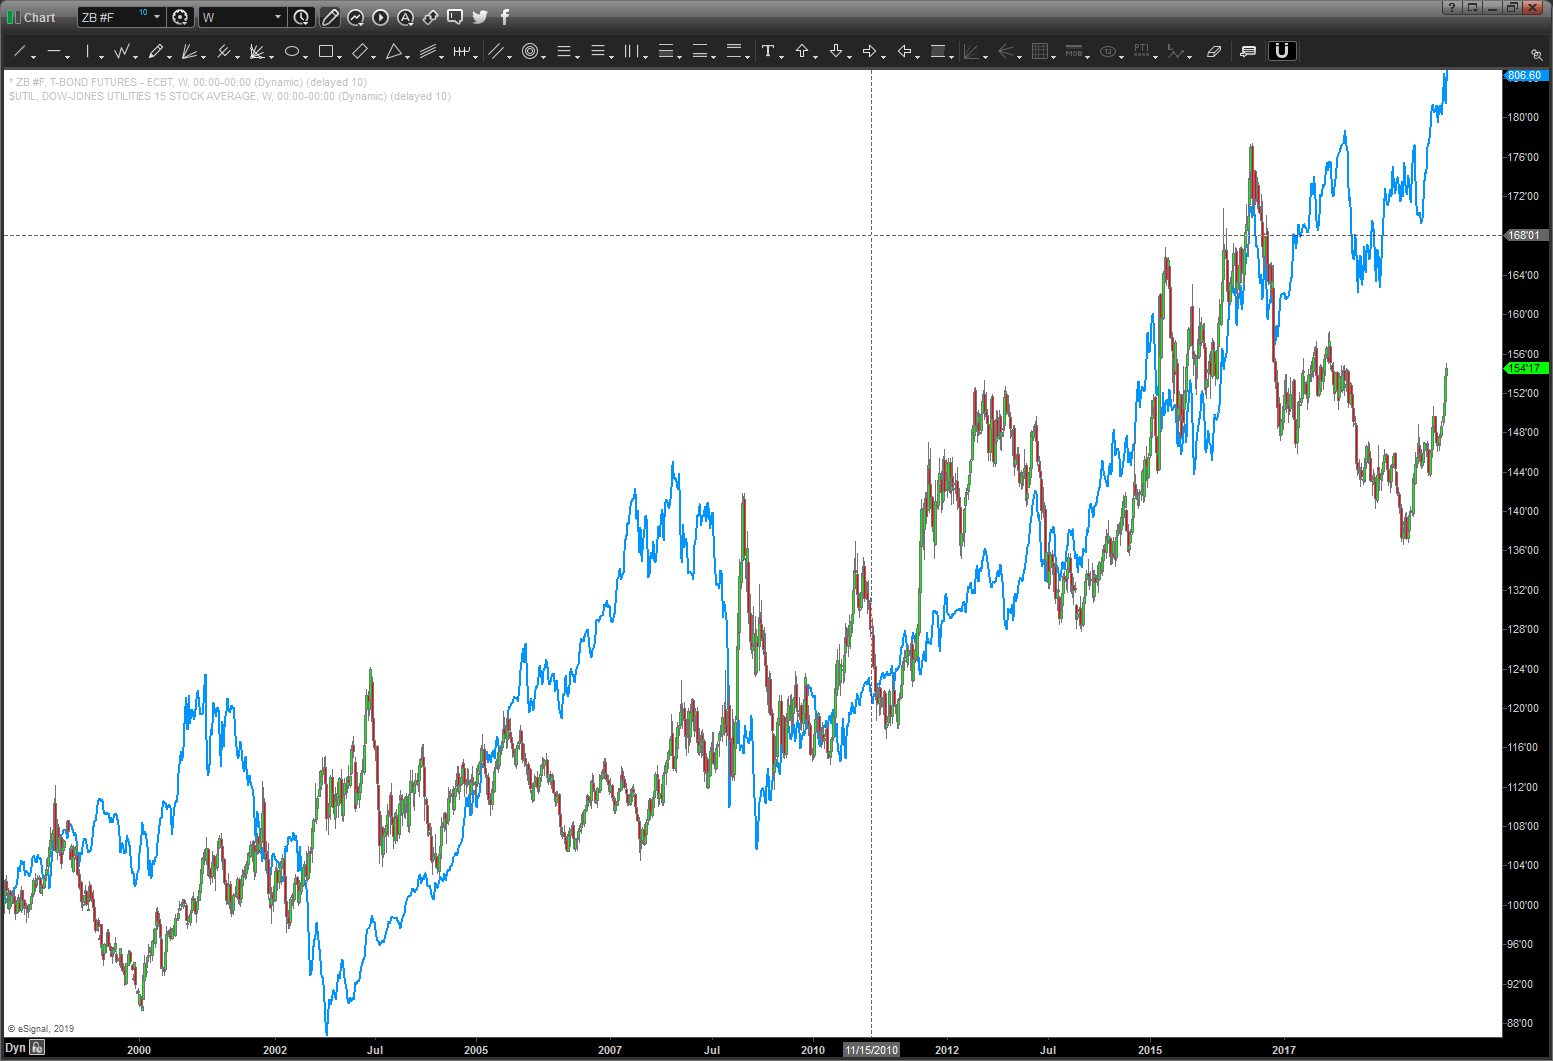
for your purview, the DJ Utilities Index and the XLU. Also, threw in a chart showing the 30 year long bond overlaid on the DJ Utilities for what it’s worth. look at the divergence over the past year or so … hmmmm.