Canopy Growth
Posted on August 25, 2019 1 Comment
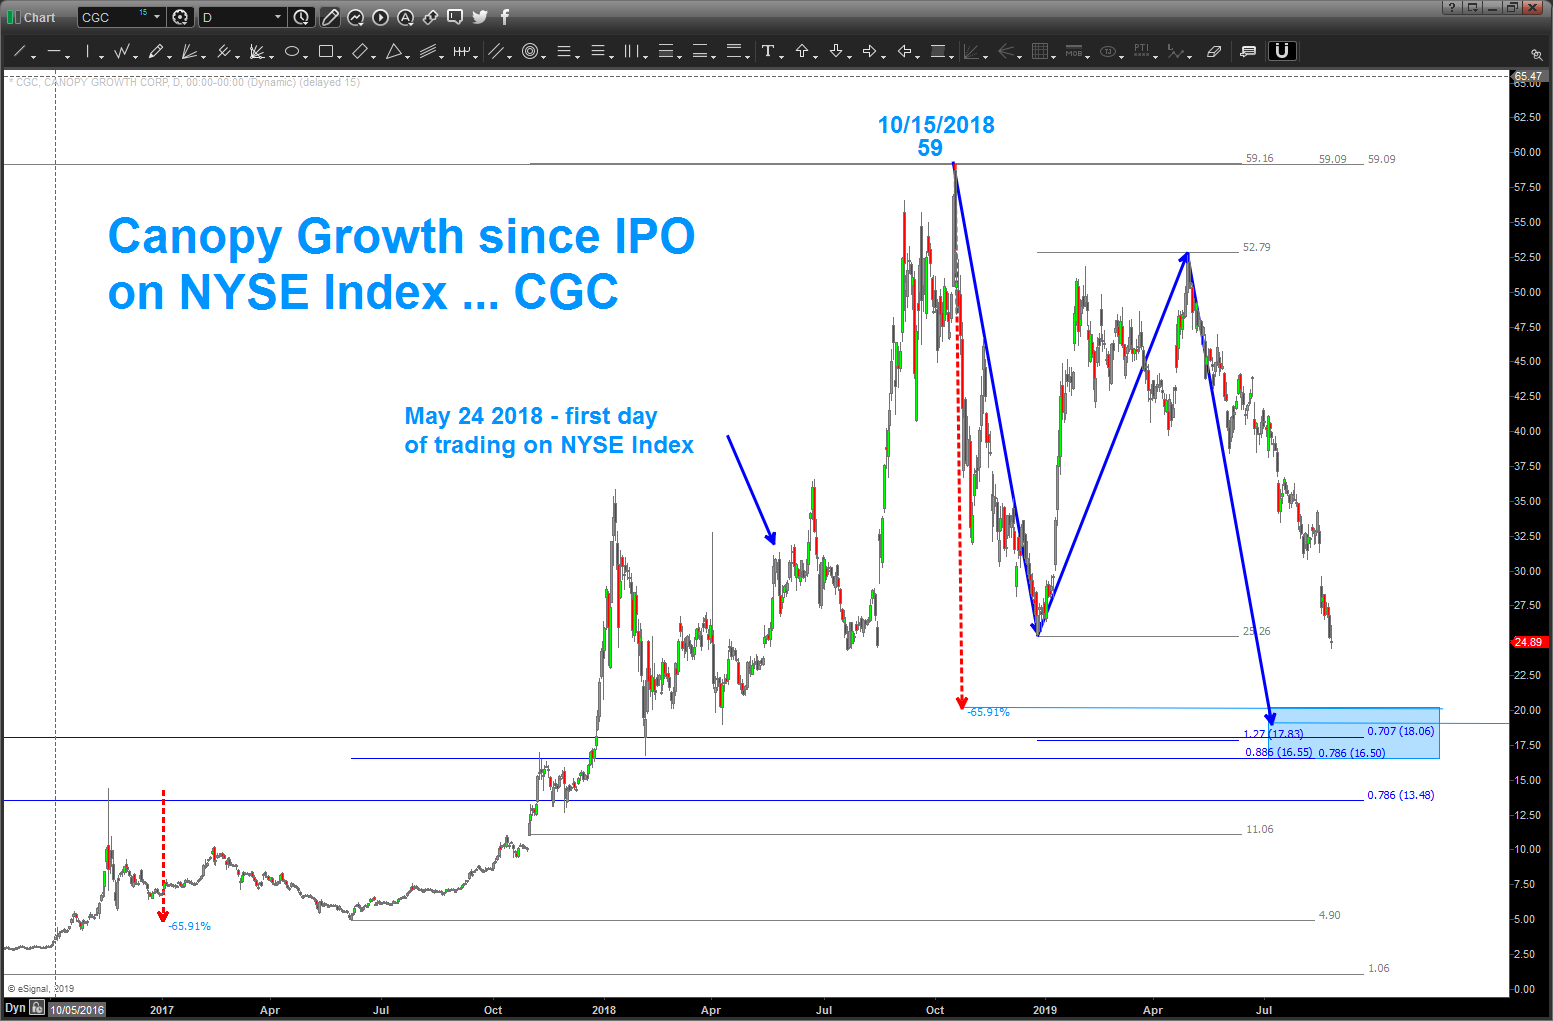
when looking for a pattern (BUY or SELL) we do 3 things .. project, extend, retrace.
in the case of CGC we have a ‘zone’ of support in/around 16.50-20 to look for a buy pattern.
the projection – in this case the simple one is the blue arrow and we have the classic AB=CD or measured moves of equality …
the extension is 1.27 and it lands on the .707
the retracements are drawn from multiple nodes (lows, all time lows, gaps, etc) and they all come in around our zone. the .707 retracement is a by product of the square root of 2 = 1.4142 and it’s inverse 1/1.4142 = .707. Square root of 2 is a big deal w/ regards to numerology.
when we put all this together we get the zone sighted above .. .additionally, note that back in 2017 (when it was only traded on the Canadian Stock Exchange) the largest correction was roughly 65%. if we take a look at the dashed red lines we see that same corrective move – 65% – is present in/around our pattern level.
I’m ‘bullish’ cannabis in general and this appears to be a nice opportunity to get LONG CGC.
hope you had a good weekend.
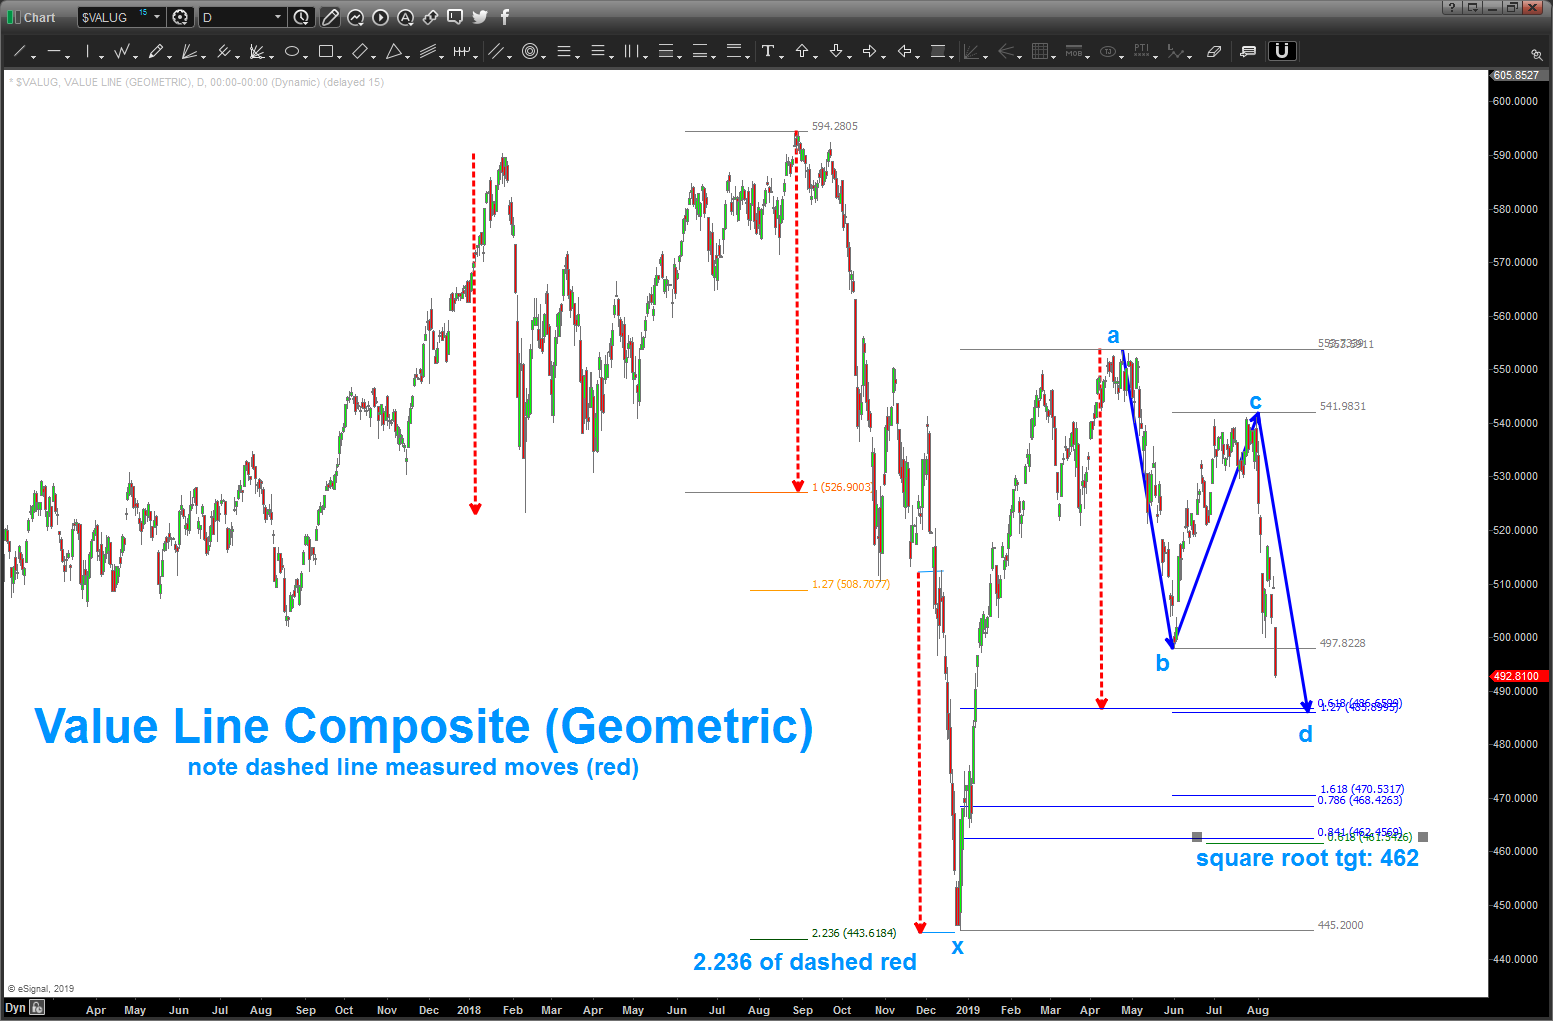
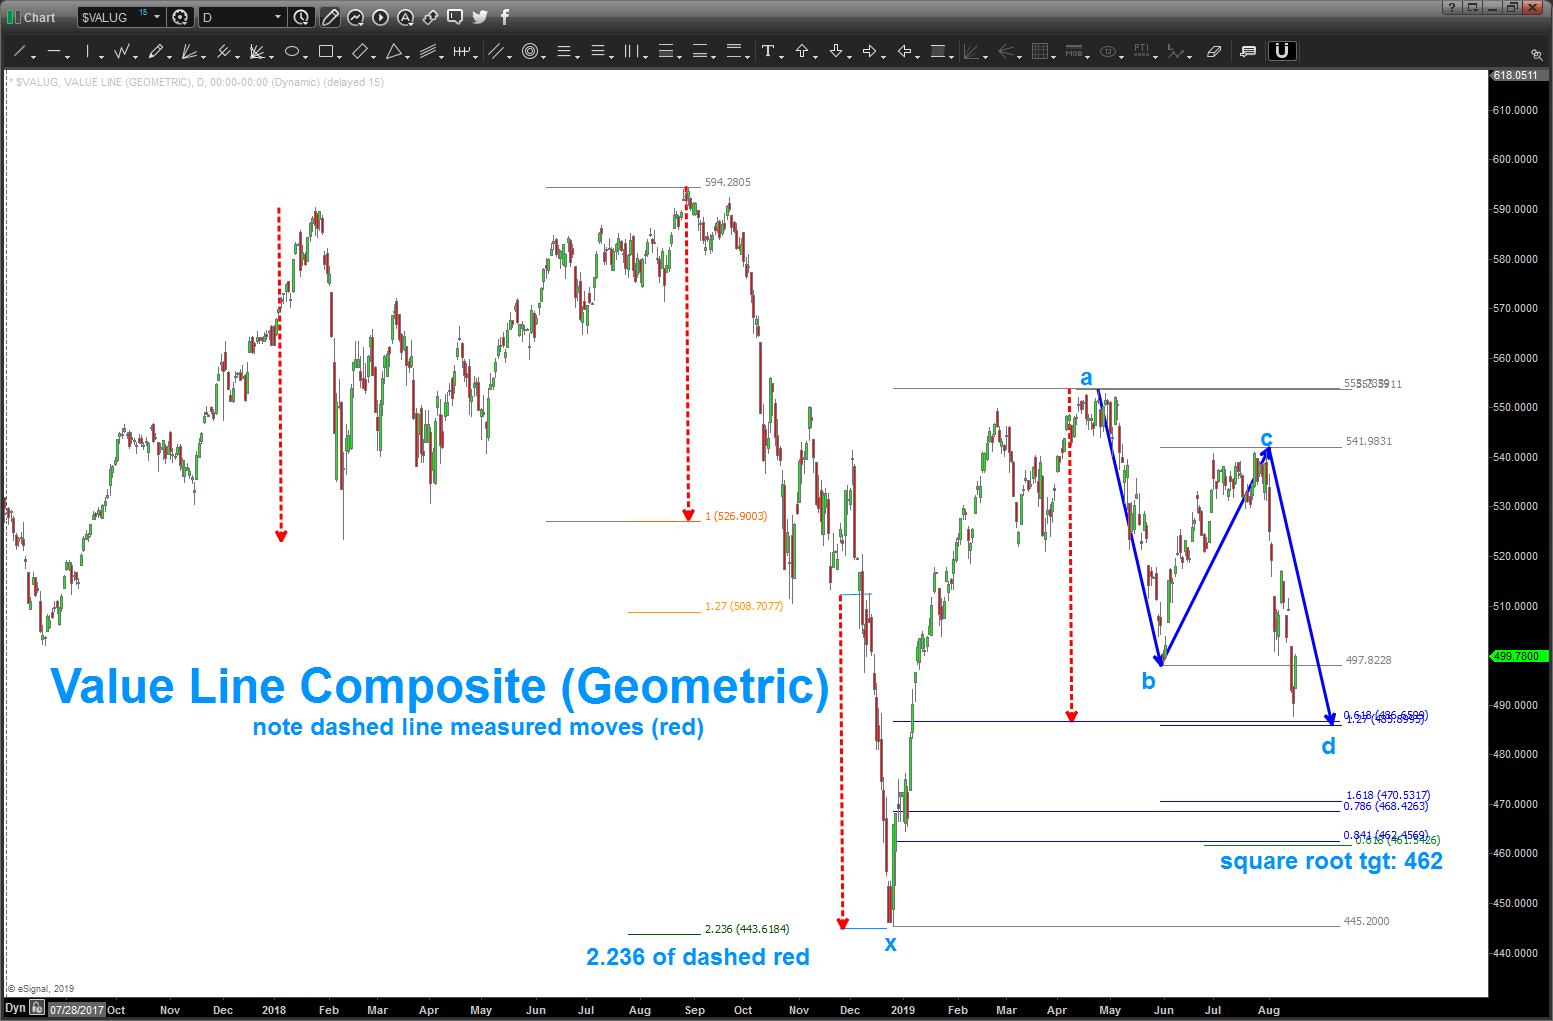
Value Line Update
Posted on August 18, 2019 Leave a Comment
note, nice and PERFECT BUY on the Value Line – hit on Friday.
in order to remain bullish, need this level to hold …
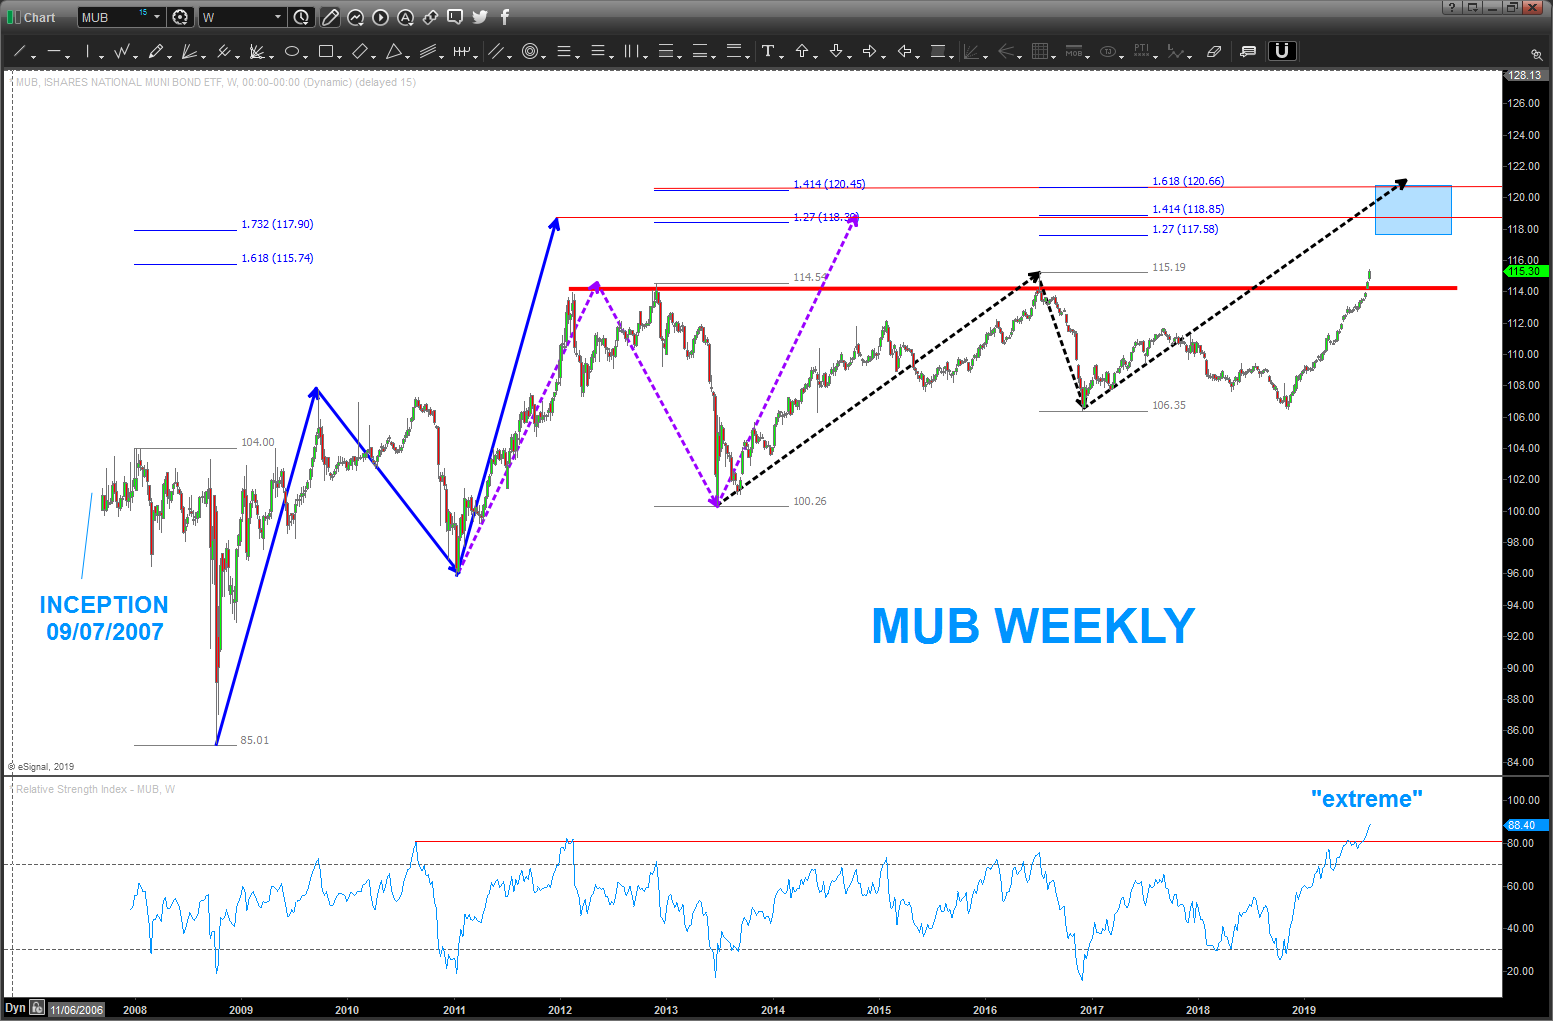
MUB – Muni’s
Posted on August 18, 2019 Leave a Comment
looks like a nice breakout from a 6 year resistance zone … that being said, a LOT of number coming together around 118-121
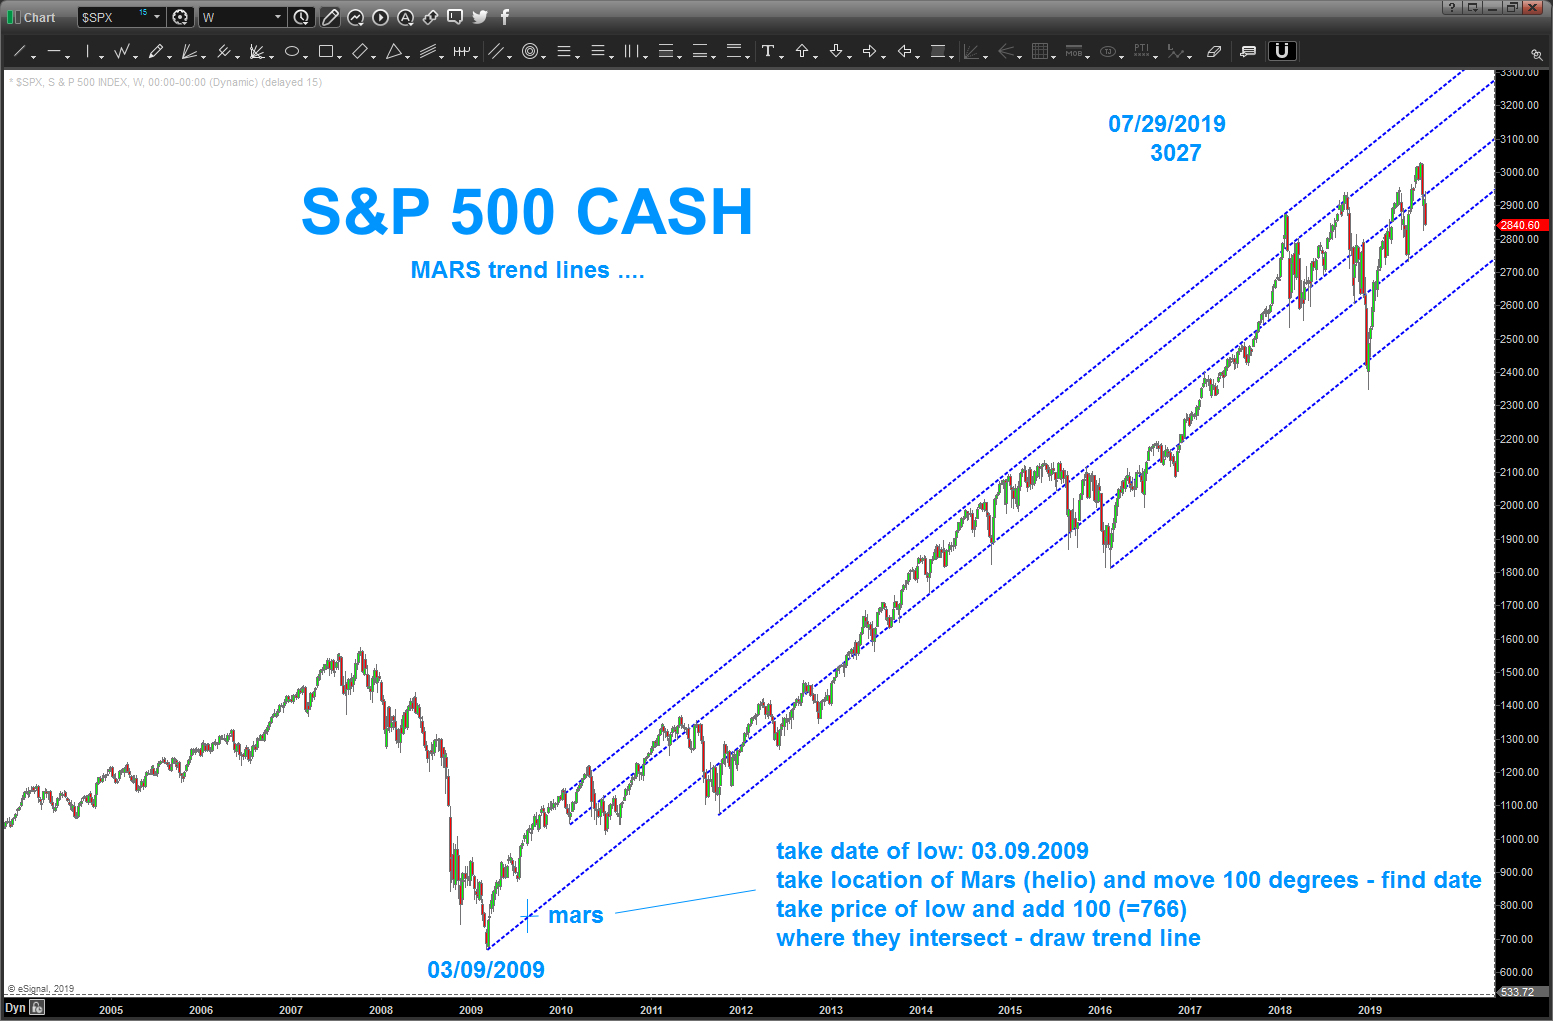
Trendlines
Posted on August 14, 2019 Leave a Comment
nice little trendline ‘creator’ that Michael Jenkins taught me .. when the markets start rocking and rolling I like to find out what the ‘true’ trend lines are telling us …
in this case, certainly can make the case that Mars Helio trend line has been important – just look at the chart below.
let’s face it folks, the planets put out ENERGY and leave footprints … ever listen to an AM radio during lighting (the crackling is electric/vibration interference) planets are doing the SAME thing.
they are PERFECT in their cyclic nature and the math that governs them …so, IF they put out a vibrational signature on the earth (tides, menstrual cycles, the MOONth or SATURNday, etc.) then certainly we can’t fight the fact that the subconscious of the entire world is converting longitudinal movement of our rock and the planets into number … in fact, isn’t even every hair on your head numbered? (luke 12:7)
so, we simply take a VERY important low (in this case 03/09/2009) and we add a factor that is equal in price and time. in this case TIME is longitudinal movement of a planet.
we are adding 100 degrees of heliocentric movement of Mars and 100 points of price (666+100 = 766) and where they intersect (PRICE AND TIME) we draw a trend line ..
note, this GEOMETRY has pretty much governed the entire move up from 2009 which has been 3,794 days (that number is important, but more on that later)
so, as we CORRECT ( and I do think this is a CORRECTION) we will be looking for Mars and, perhaps, other crucial trend lines to do their work …
Bart
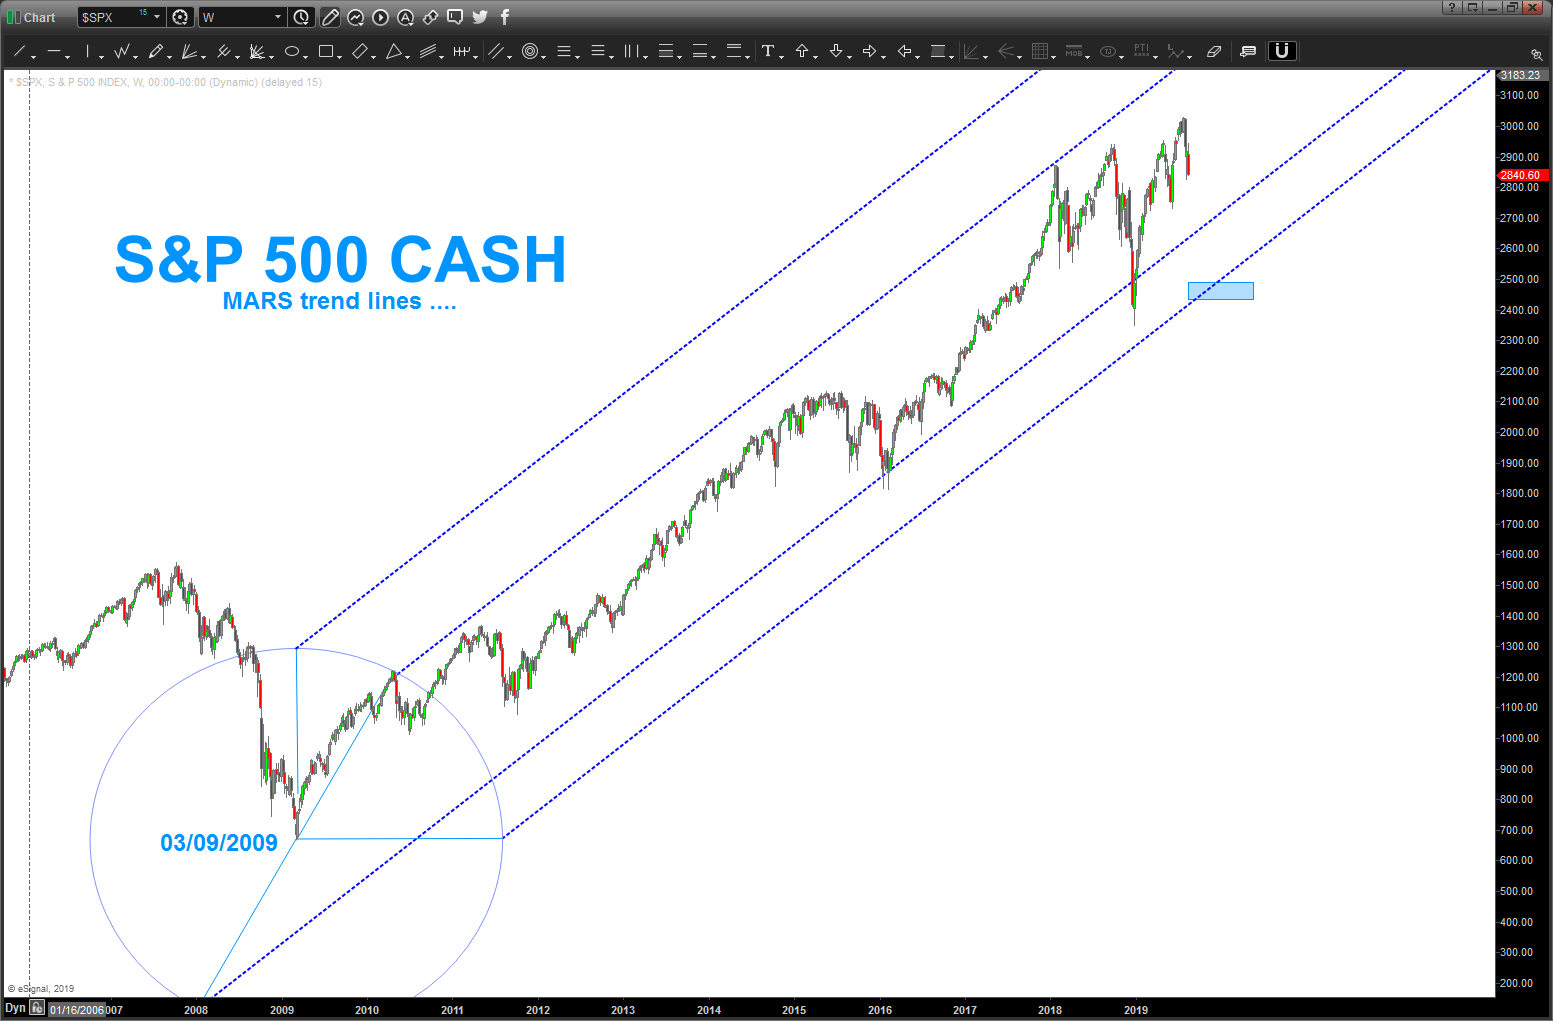
here’s some other geometry to pay attention to … note ‘extending’ the radius arc to the other side of the circle THEN pasting trendline (mars) to it’s location on the circle nabbed the lows … I’ve added the next key trend line to watch for support …
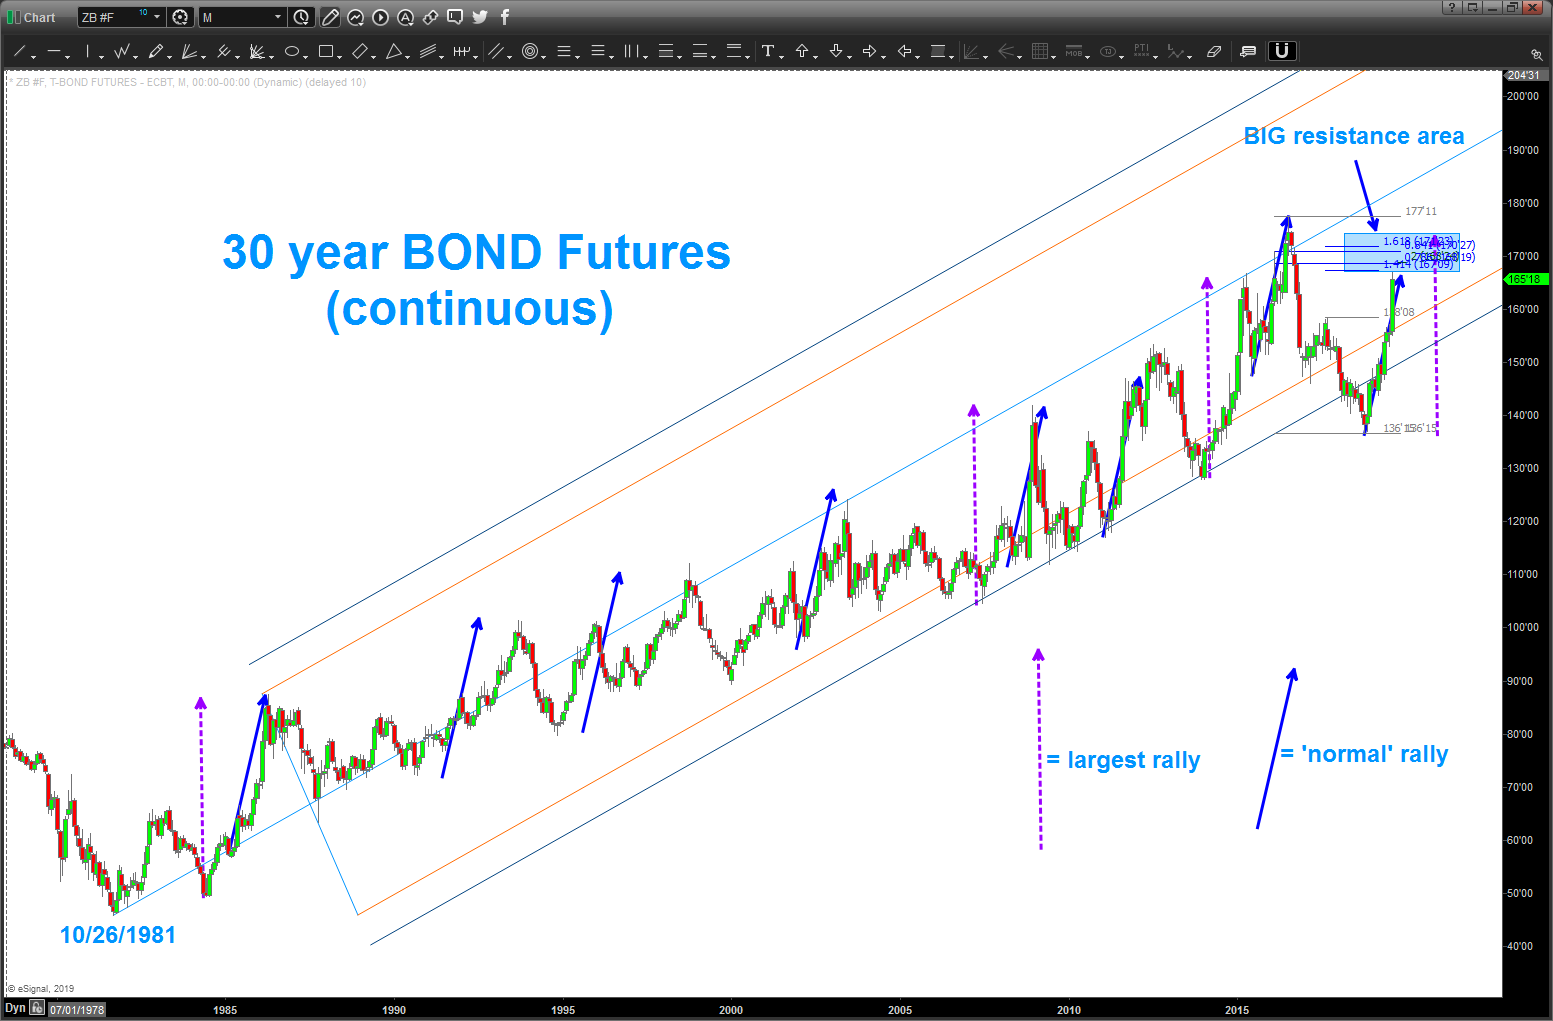
TBT
Posted on August 8, 2019 Leave a Comment
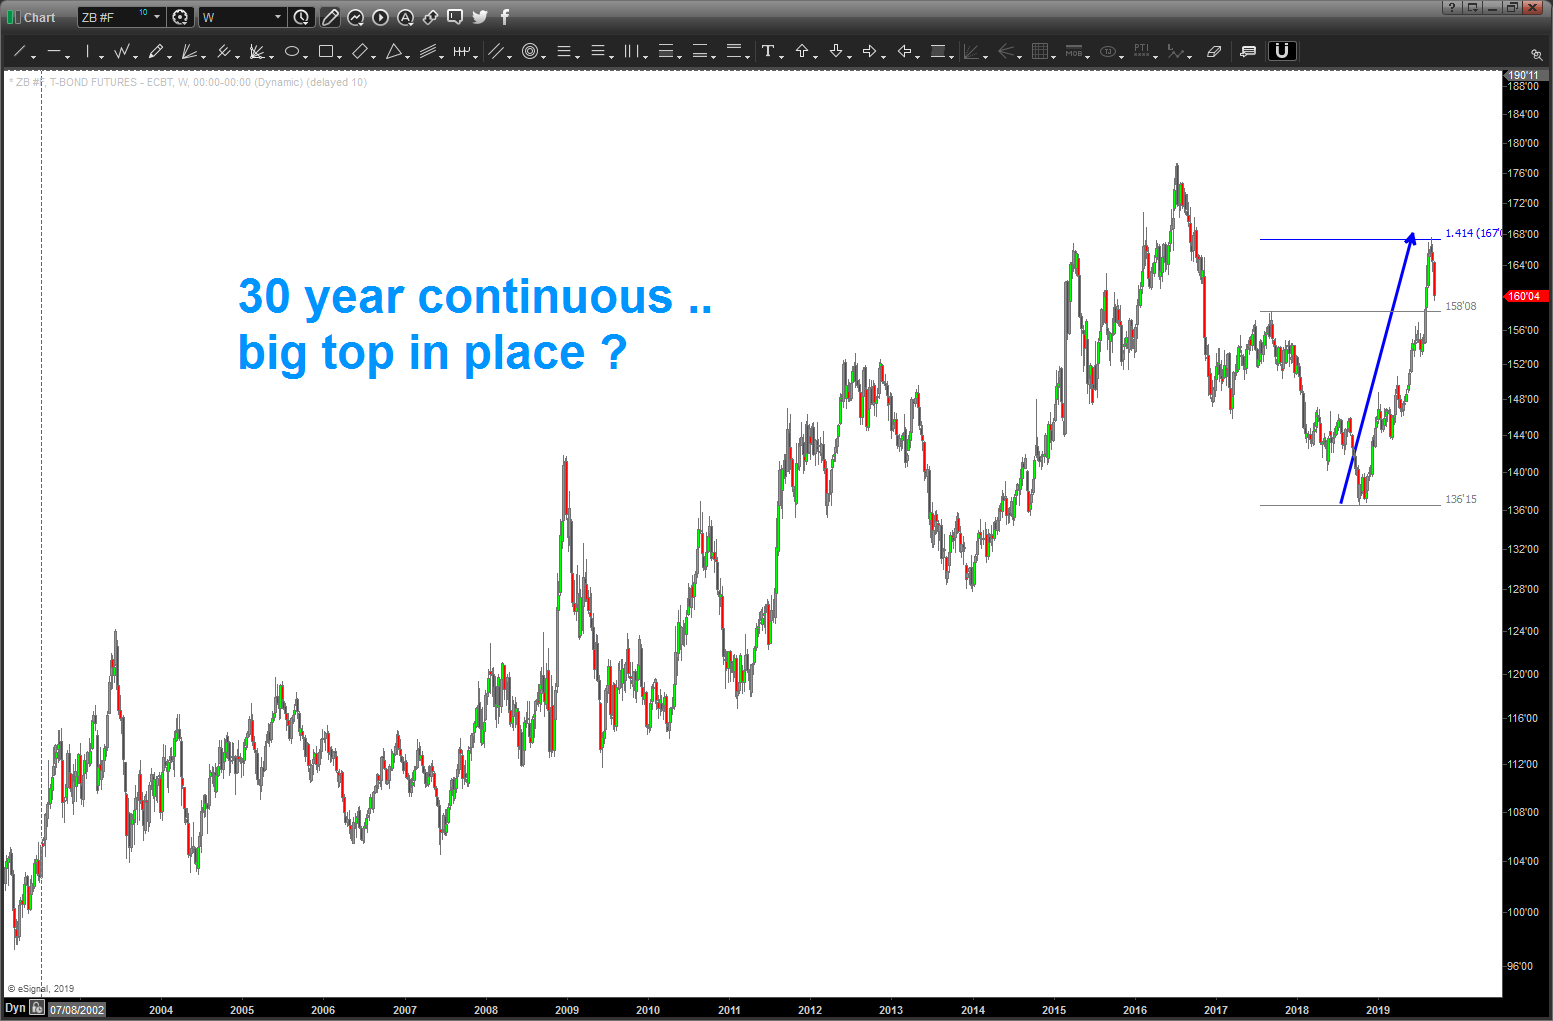
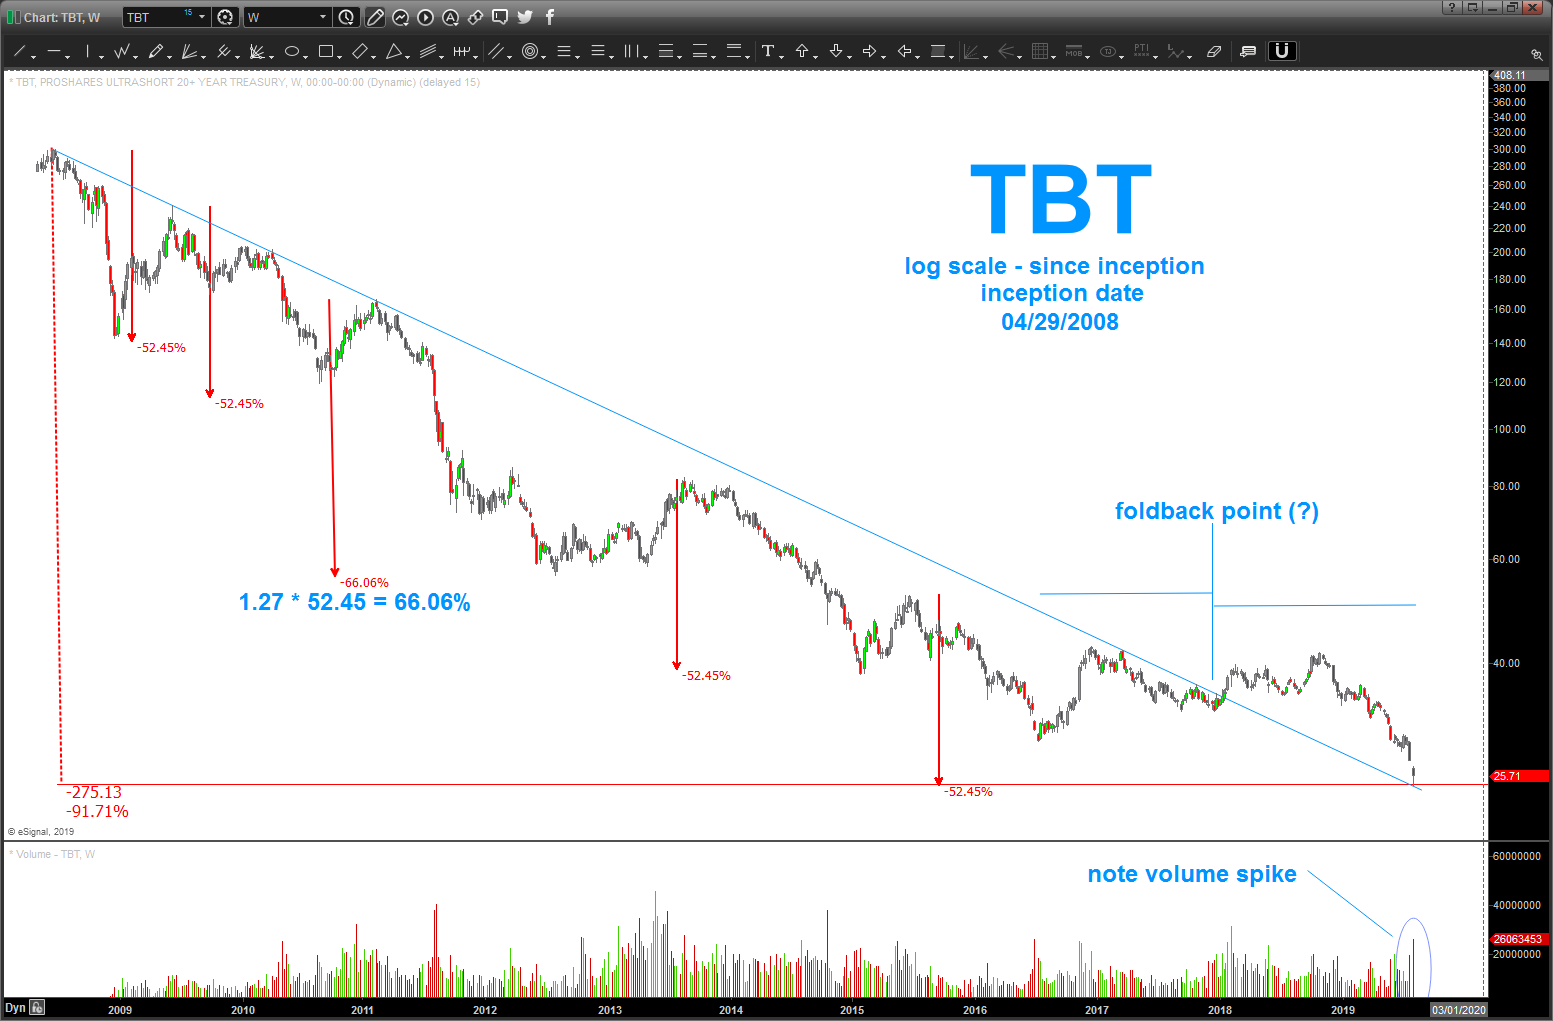
09/12/2019 – as discussed below, took my lumps on trying to go long TBT. so am watching it to try another LONG (yes LONG) TBT. note the volume spike and also the 52 ish percent moves down seem to cause bottoms. also, take a look at the 30 year continuous chart … we very well could have a BIG LOW in rates. crazy, I know …
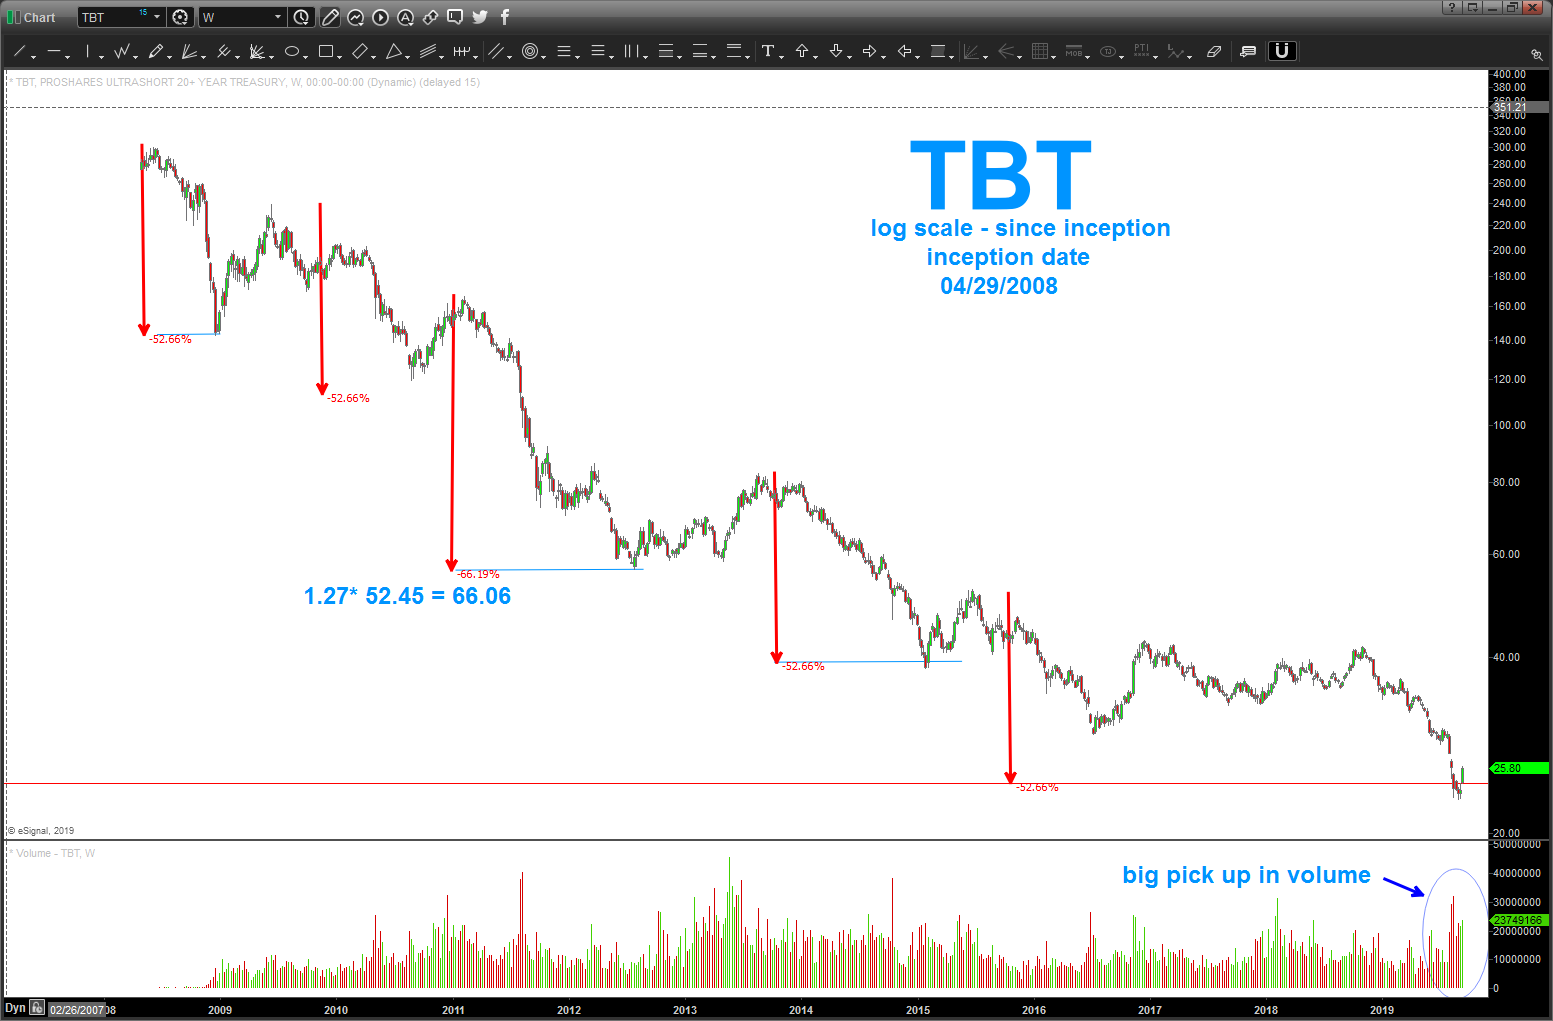
well, got stopped out trying a long TBT a couple weeks ago … the entire world is/was cutting rates and that didn’t work out too well for the home team.
but, you know what, the PATTERNS are suggesting rates are or have bottomed (I know, call me crazy) but w/ (the latest numbers) 13 trillion of bonds out there paying negative yields something will/has to give ..
back to the chart .. note pretty much every decline has been roughly 52% except for one which was 66% (52.45*1.27) and we tagged the polarity of the long term LOG trend line … nice little volume capitulation …hmmm.
also, note the foldback point … if it’s the foldback point then we are at the very beginning of, dare I type this, a big move UP in TBT.
I’m going to be in the prove it to me world and look for 5 waves up on a weekly basis before jumping in again BUT am watching this one closely.
cheers and salute – Bart
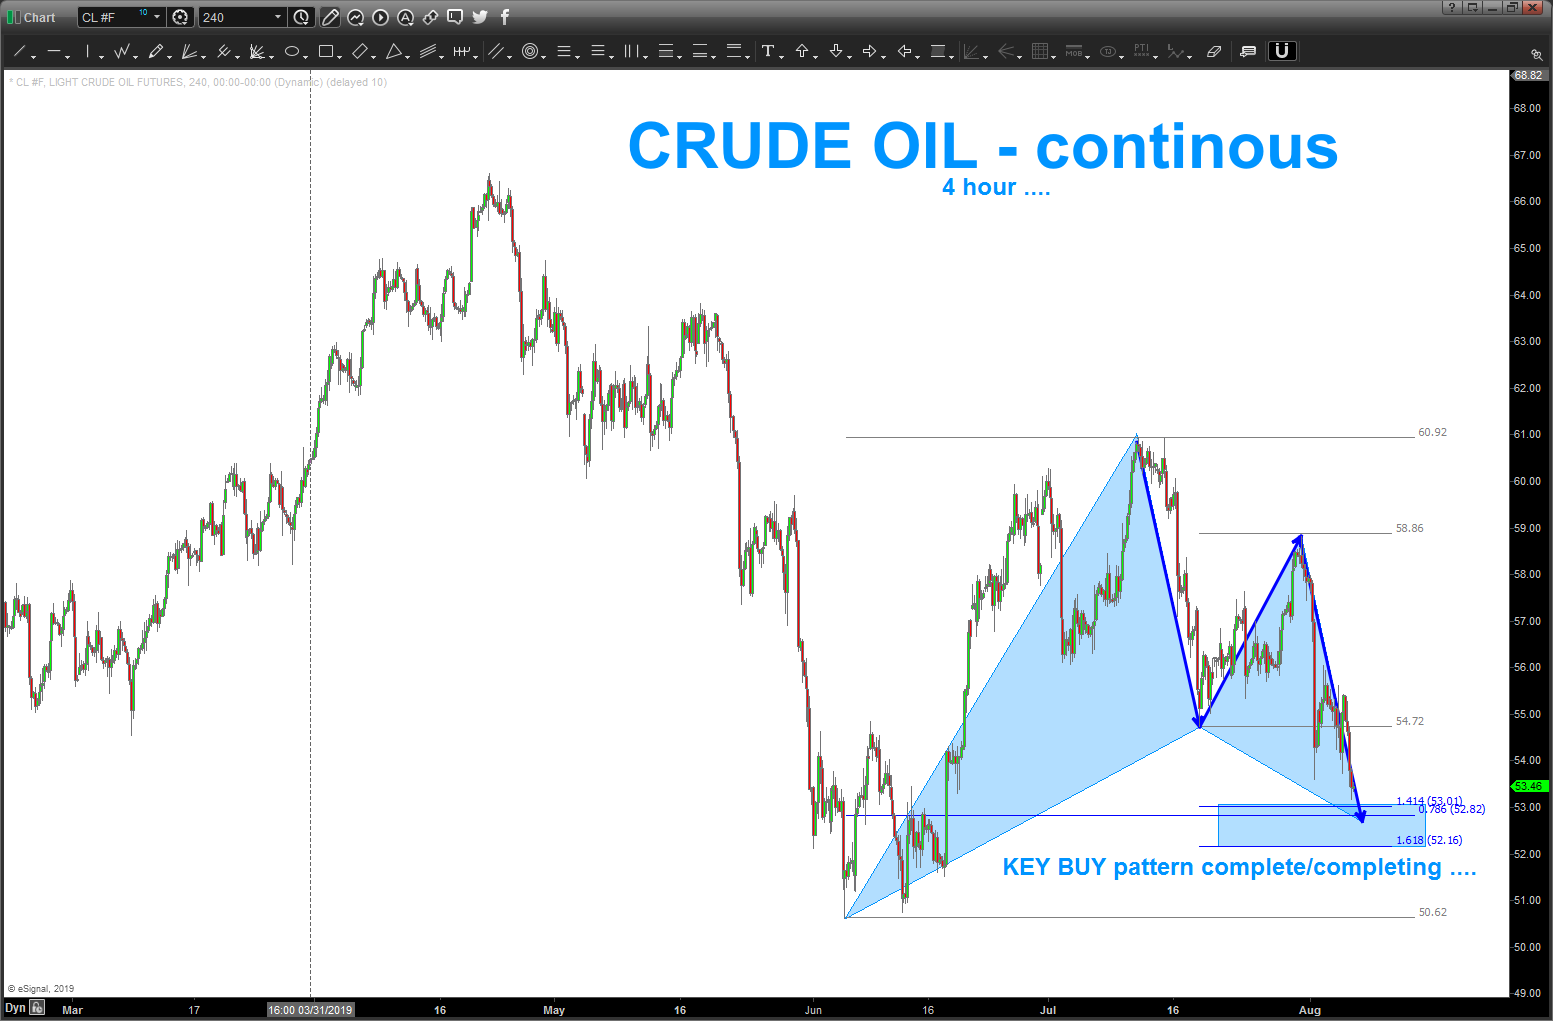
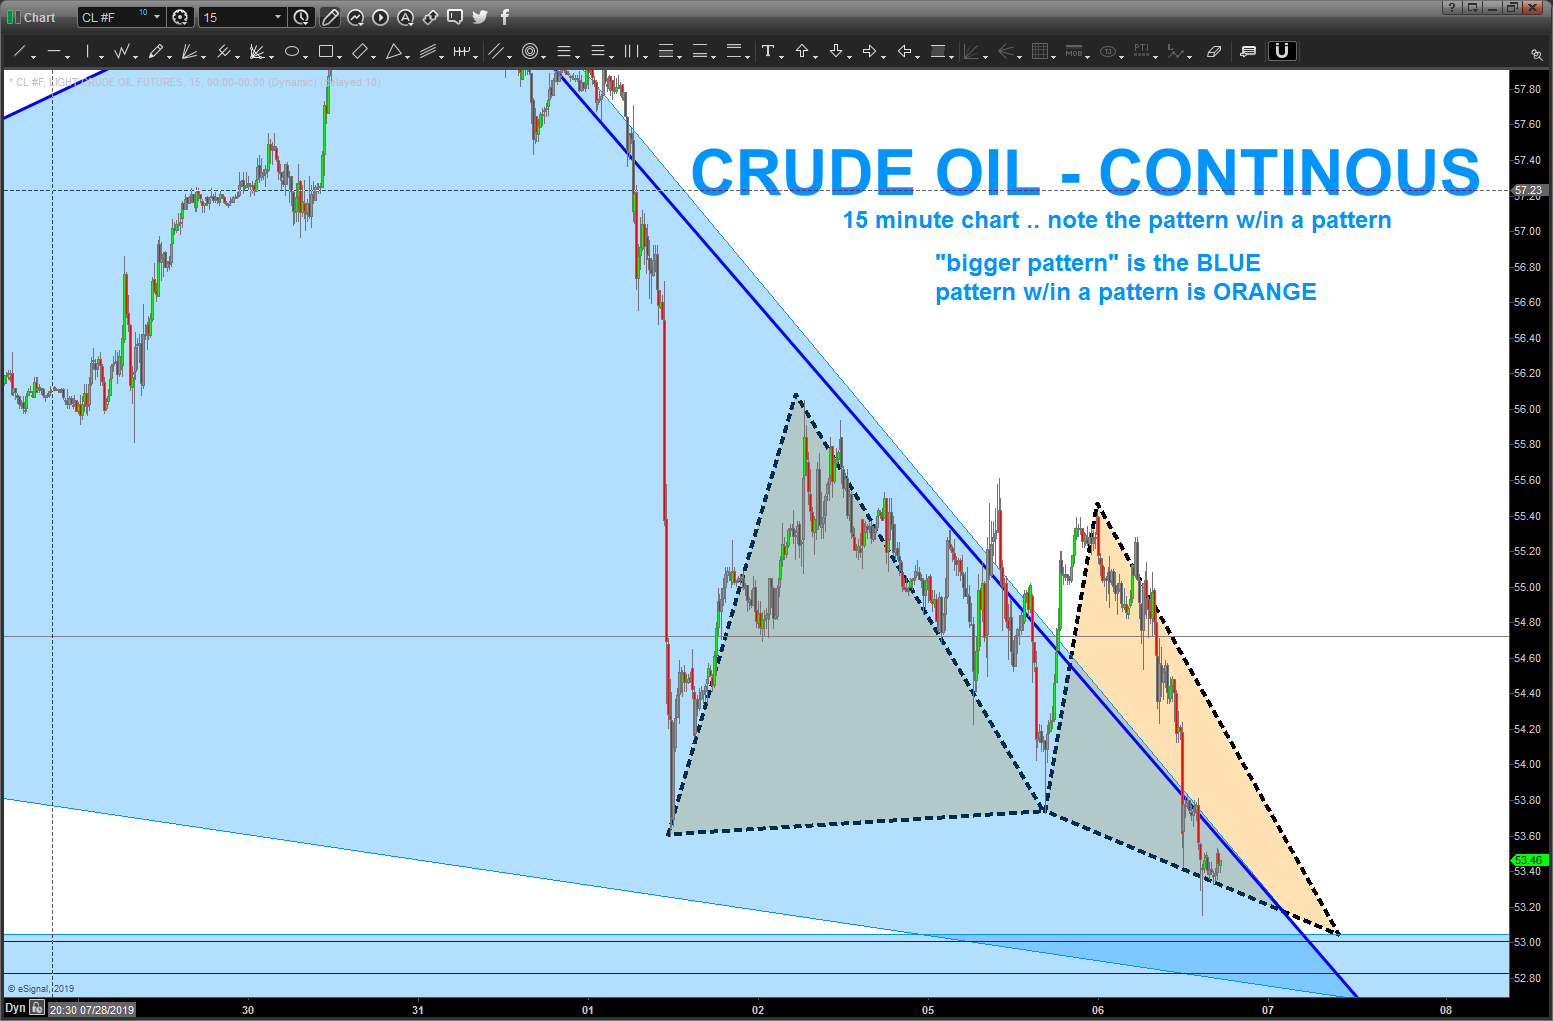
Crude – BUY PATTERN in/around 52-53
Posted on August 6, 2019 Leave a Comment
like the EEM … big support here. if we lose it, look out below …
note, the 15 minute and 240 minute patterns … it shows the fractal nature of the market and, in this case, we have a pattern (15 minute (orange w/ dashed black outline) w/in a BIGGER 4 hour pattern (light blue)
kind of cool, I guess.
B
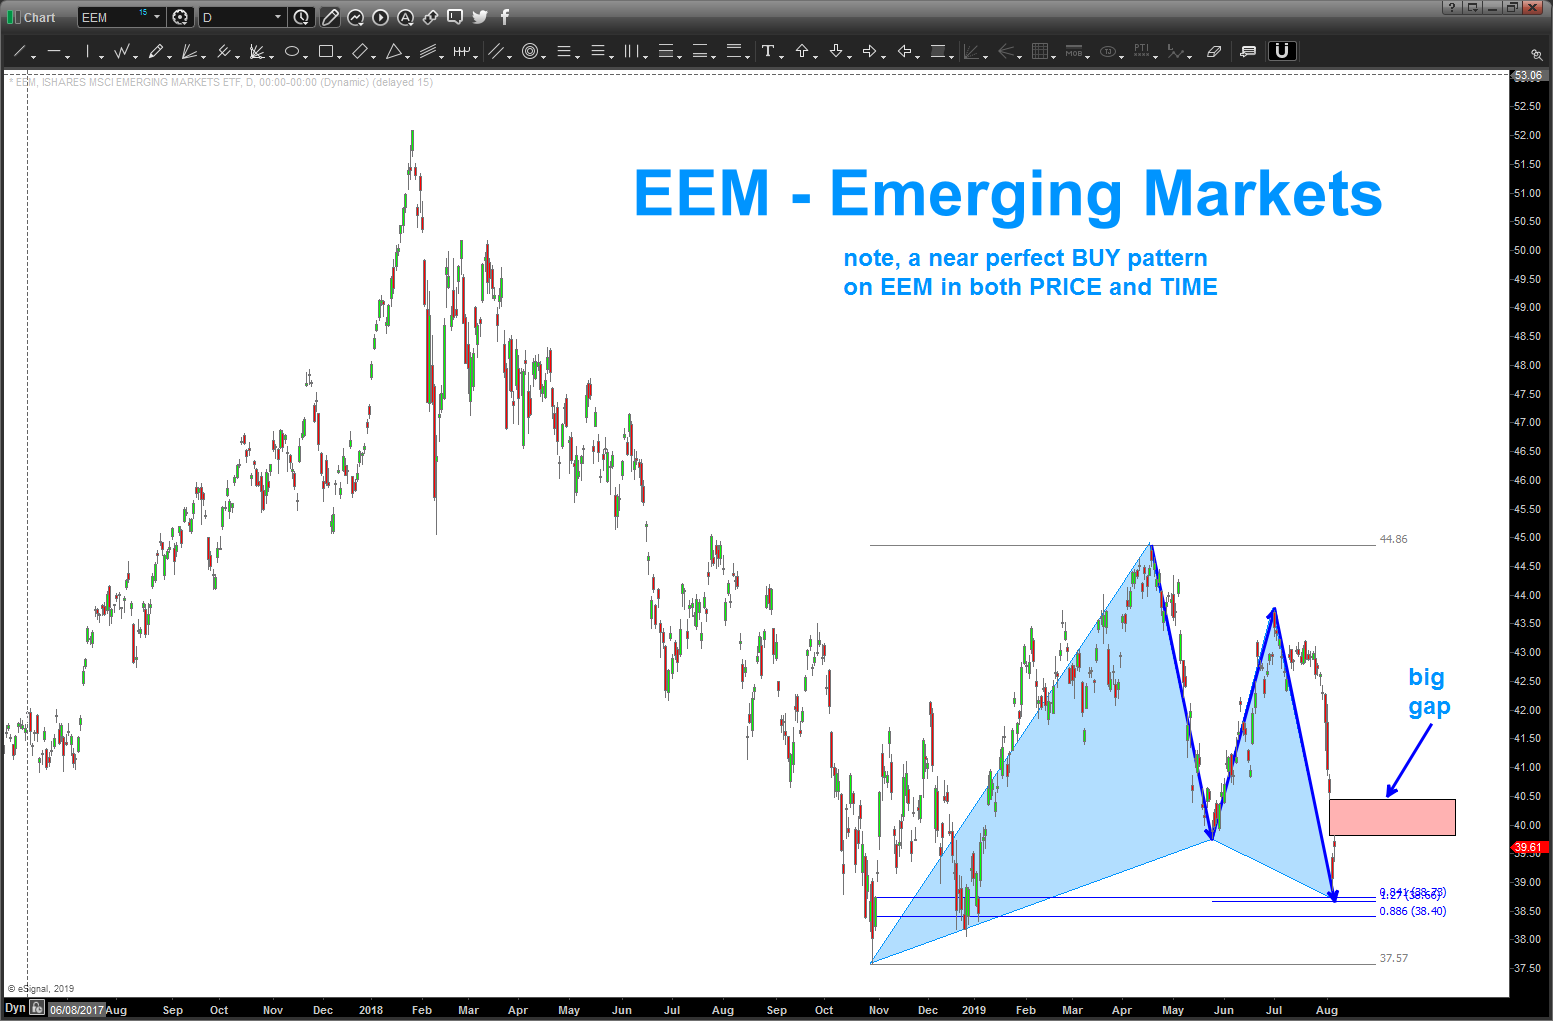
EEM – big BUY pattern
Posted on August 6, 2019 Leave a Comment
note, we finished a very nice BUY pattern on the EEM yesterday. it was nice in both PRICE and TIME.
it ‘held’ in/around 38’s but is plowing into a pretty big daily gap. additionally, the THRUST into this level was pretty significant. any further weakness below the 38’s is significant for EEM.
also, note .841 level is based on the equal octave scale of music. 1/.841 = 1.1892 or D#.
watch this one closely …
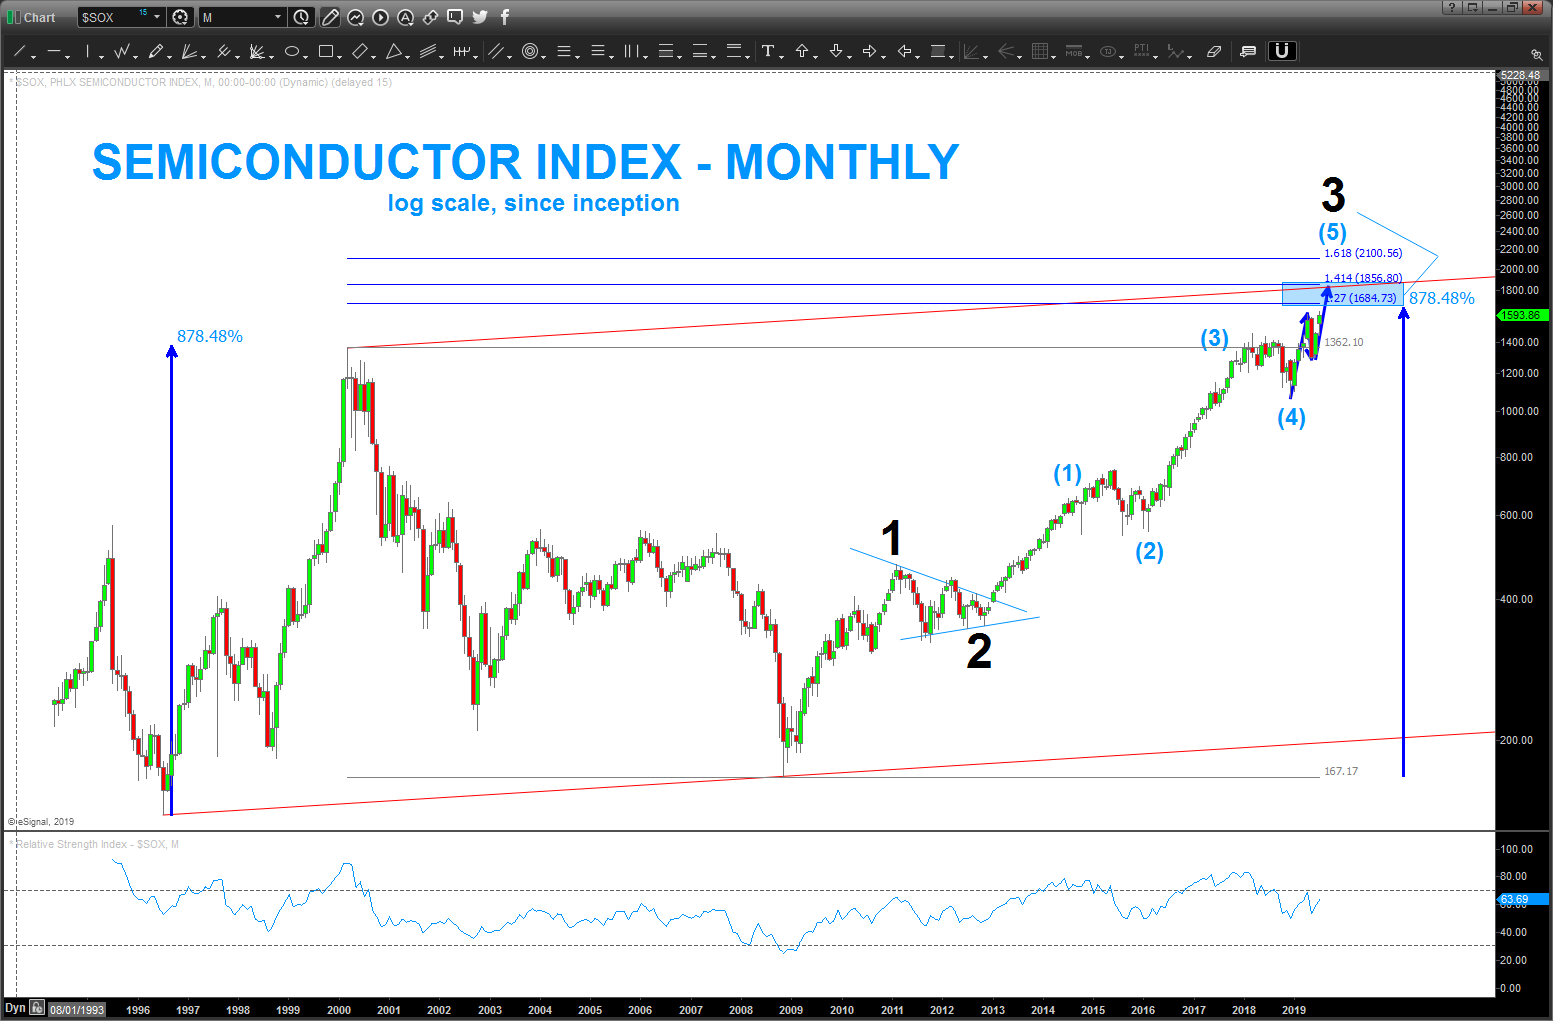
Semiconductors
Posted on July 27, 2019 Leave a Comment
the biggest thing that I’m seeing is we are finishing an AB=CD in percentage terms of around 878.48 percent right at the 1.27 extension from the 03/2000 high. throw in a little bit of bearish divergence on the monthly and I’ll surmise we have some stiff resistance coming in from 1684-1856. Note, if (the big if) my count is correct, this is a larger 3 completing so after a corrective / pausing move we should (again the operative word) continue to advance into new highs.
so, for now, I would watch the 1684-1856 zone for resistance. It’s a stretch for the 1.618 extension to happen up in/around 2100 but that could be another potential target on strength.