ORCL – target(s) hit
Posted on January 26, 2020 Leave a Comment
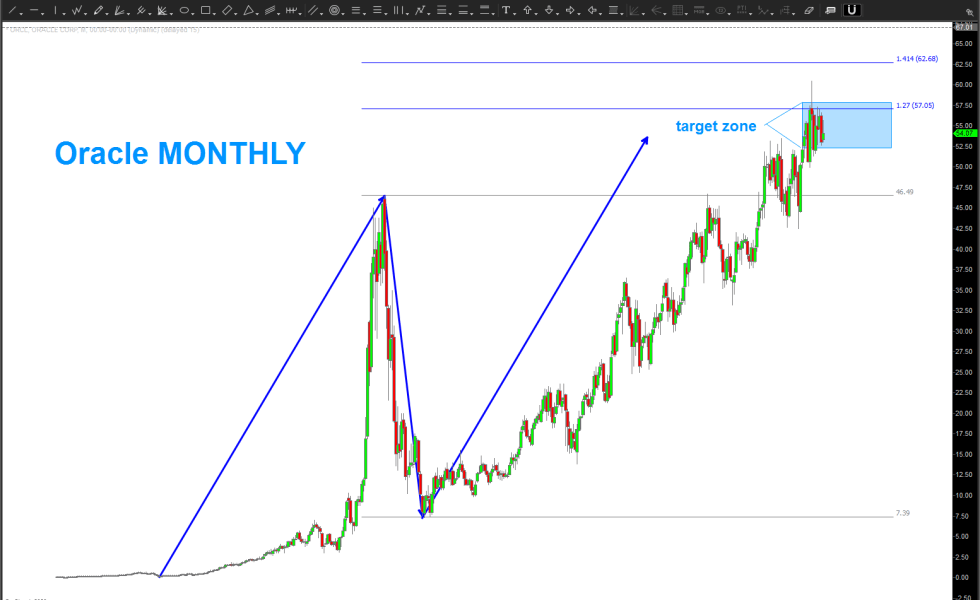
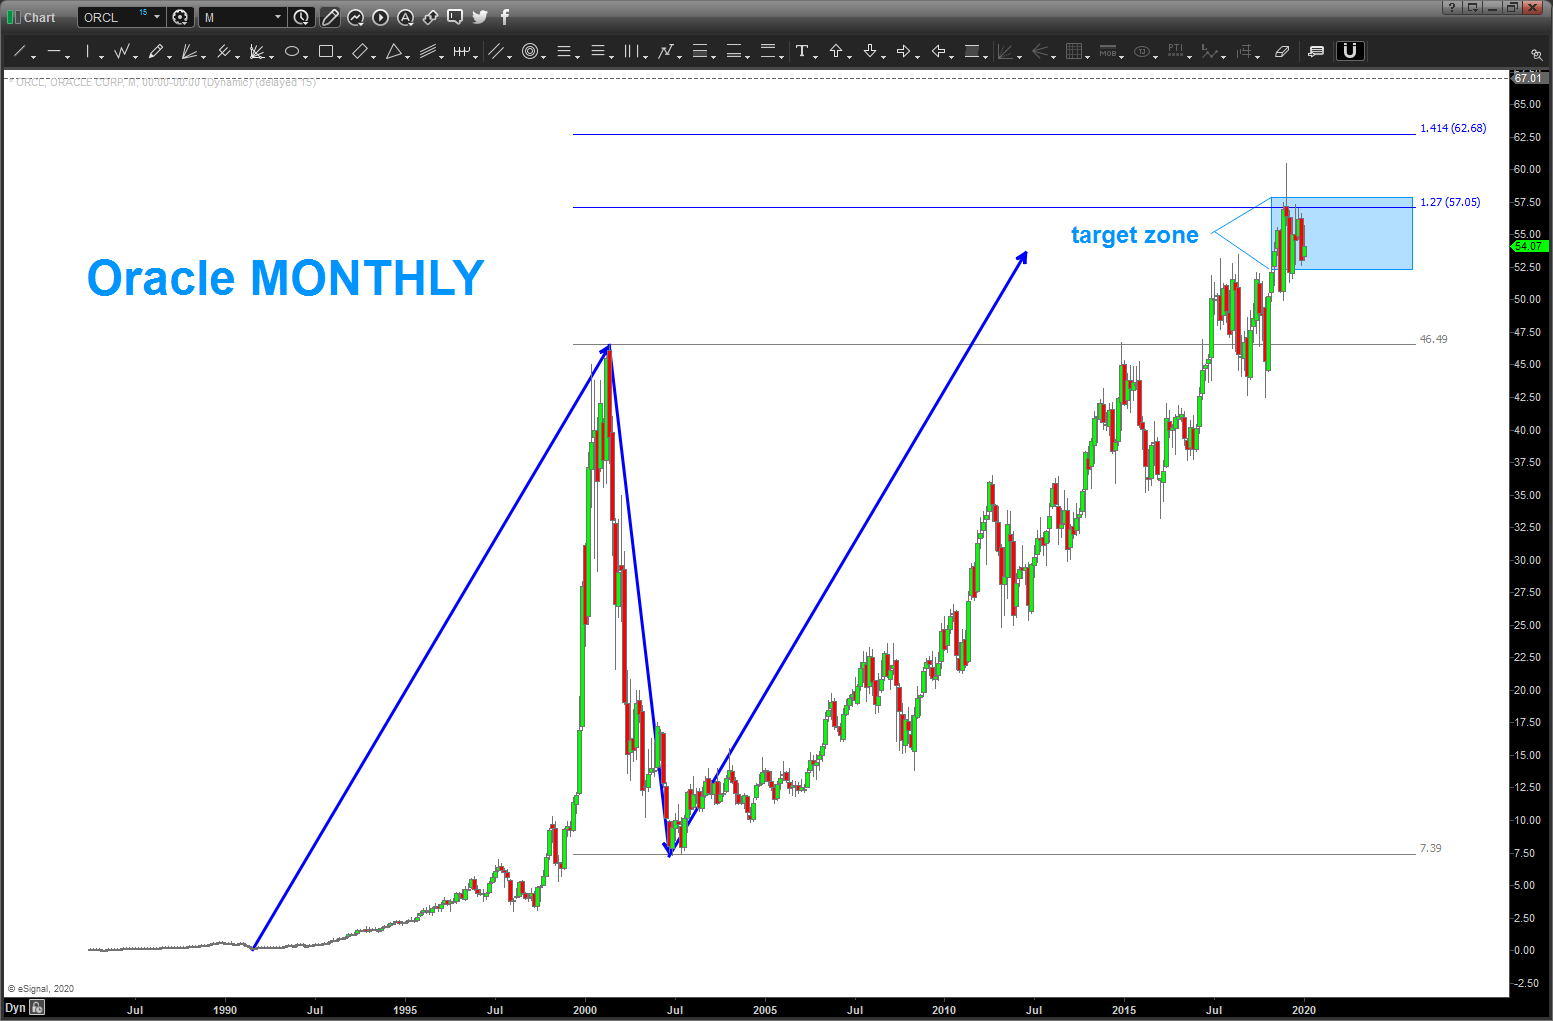
been watching this area on ORCL for a while: https://bartscharts.wordpress.com/?s=orcl it’s a long standing target in this area and we’ve reached it …
EEM – now a SELL pattern complete
Posted on January 26, 2020 Leave a Comment
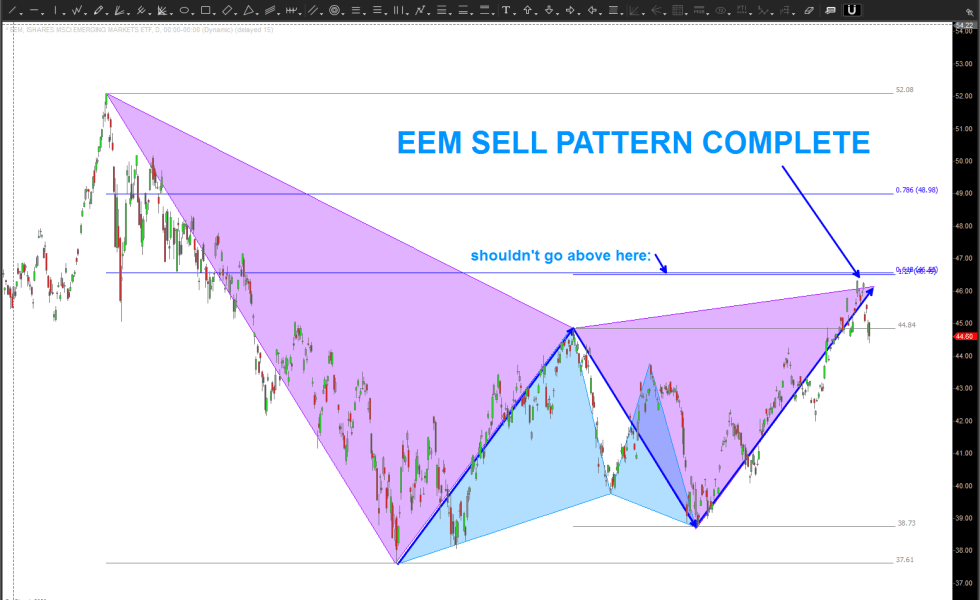
last post on the EEM was a nice BUY PATTERN: https://bartscharts.wordpress.com/2019/08/06/eem-big-buy-pattern/ now, we have a larger (purple shaded regions) SELL PATTERN that hit at the beginning of last week. for now, the EEM should stay below the 46.50 area ….
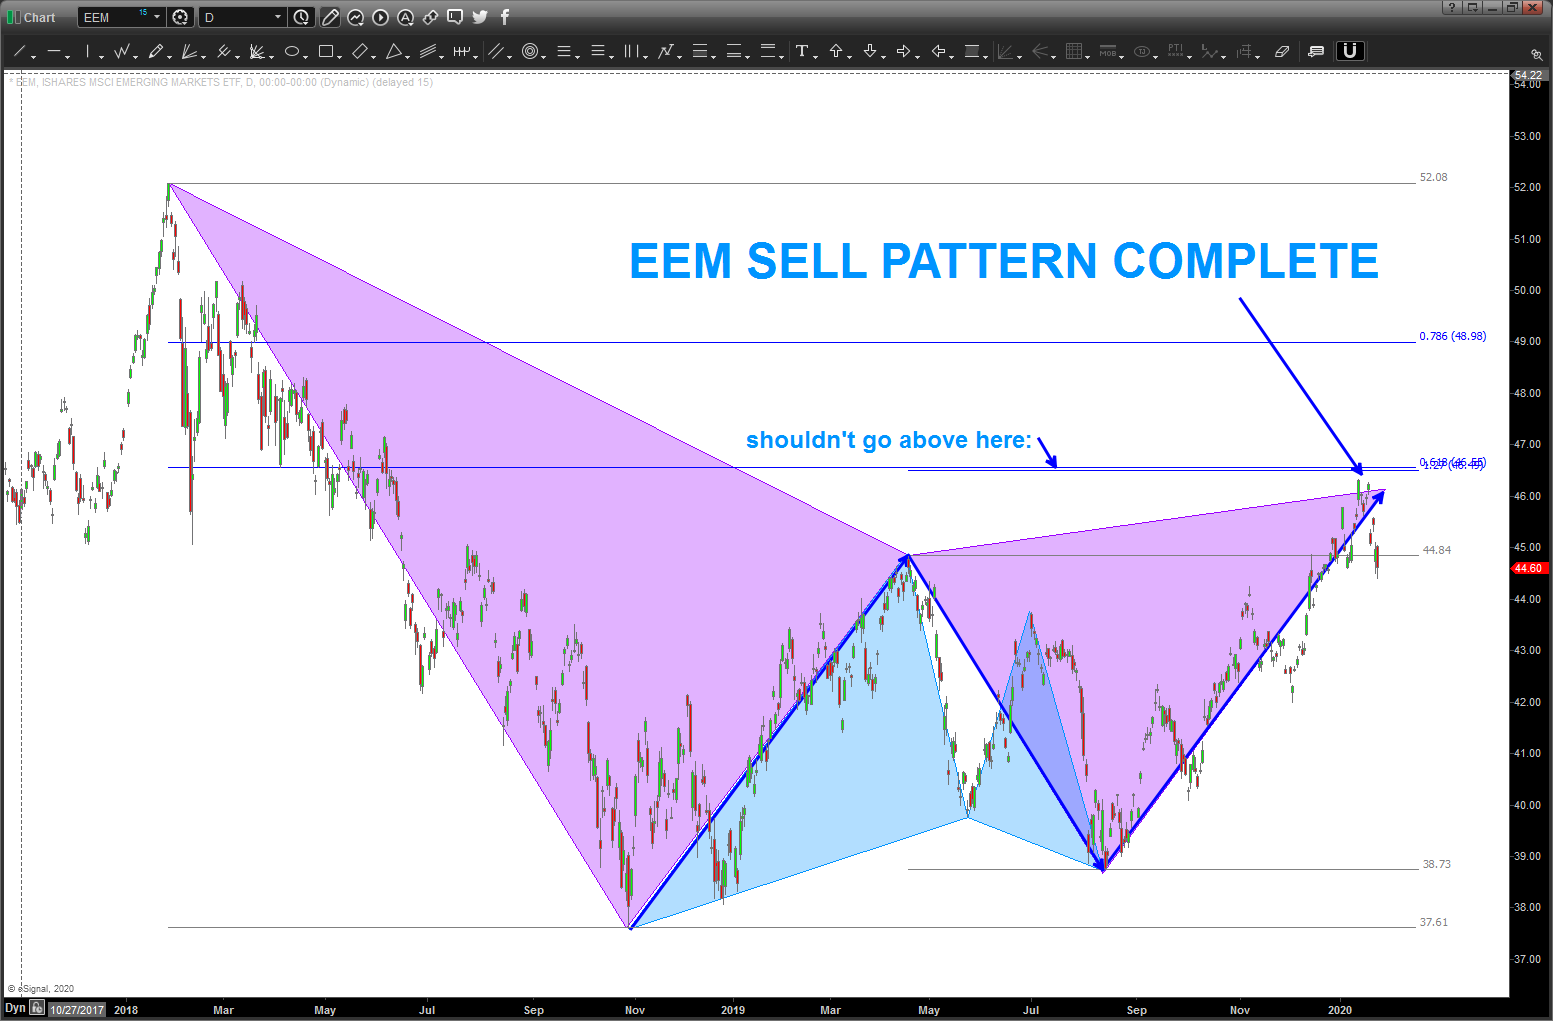
for those interested in PATTERNS I’m using the colors to show how a complete pattern presents itself via connecting the swings. in this case the ‘first’ pattern was a BUY pattern shown by the ‘light blue’ triangles and then the market rallied from that area into the shaded purple sell pattern area …
Targets a plenty ….
Posted on January 25, 2020 Leave a Comment
02/24/2020
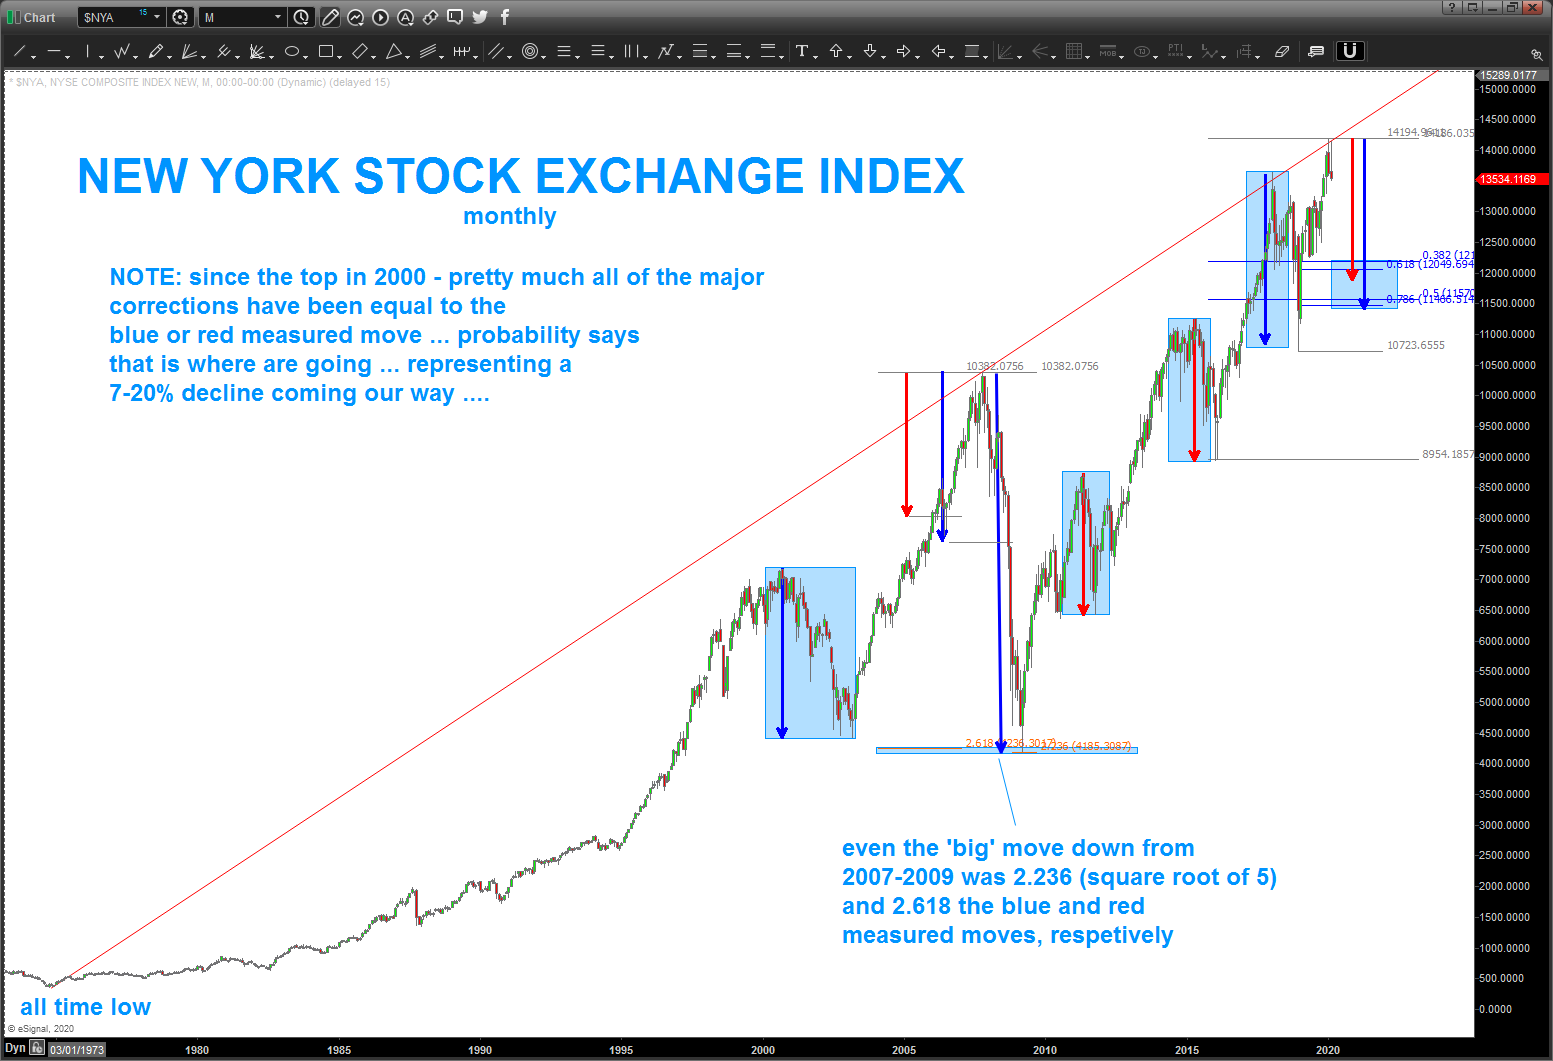
UPDATE: well today was a pretty smashing day as “days” go but in the big picture it’s really nothing. but, he fact that the NYSE Index hit the target – from the all time low – so nicely, we do have to be defensive as explained, roughly a month and a half ago …
updating the NYSE Index for potential targets and you can see 11500-12100 ish as the most likely move … that’s roughly 7-20%. yes, I know that is a big range but all I’m doing, for now, is looking at past corrective measured moves and projecting down. as can see by the below chart, the blue and red arrows have been responsible for pretty much EVERY correction for the past 20 years. so, isn’t it a high probability that this is where the market will go? Seriously, take a few minutes from your ADD Social Media frenzy to study the chart below … folks, it’s EXACT. EVERY CORRECTION HAS BEEN EITHER THE RED AND/OR BLUE ARROWS. also, take a peak at the 2007-2009 thump. that correction was harmonic to the blue and red arrows being 2.236 (square root of 5 and one of our ratios) * blue arrow and 2.618 (Fibonacci) * red arrow. hence, all of the corrections have been harmonic. now that being said, we have finished a LOT of 5 wave sequences sooooo this corrective move might go a little deeper than any of us think BUT a pattern will emerge to give us an opportunity to BUY … so just chill out, turn off the news and, well, hang on.
rounding out everything from the previous post:
if you have been following my blog of late, I’ve slowed down posting because I was ‘waiting’ for some targets to be hit … it looked like a high level broadening triangle was at work – WRONG. 🙂 and w/ the recent breakout to the upside I had to erase pretty much all of the major indices and, well, go LONG TERM and look for ‘other’ patterns / targets to come into play … well, they have and did last week.
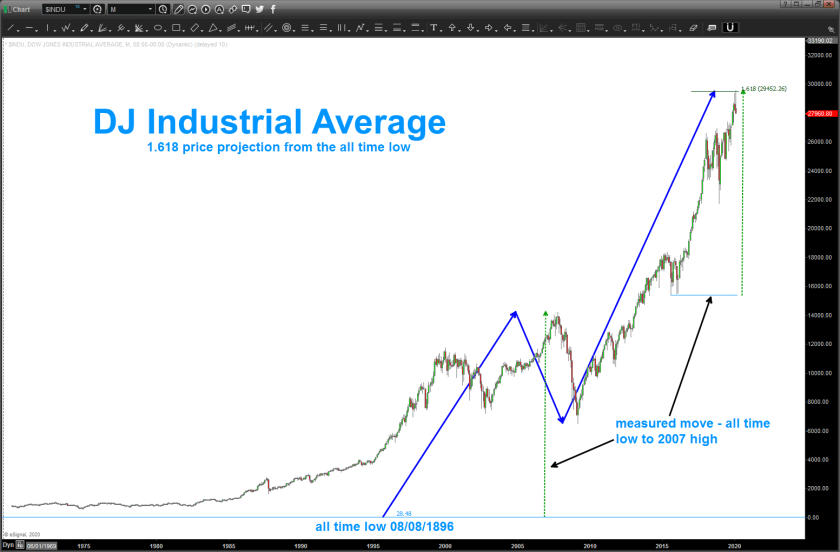
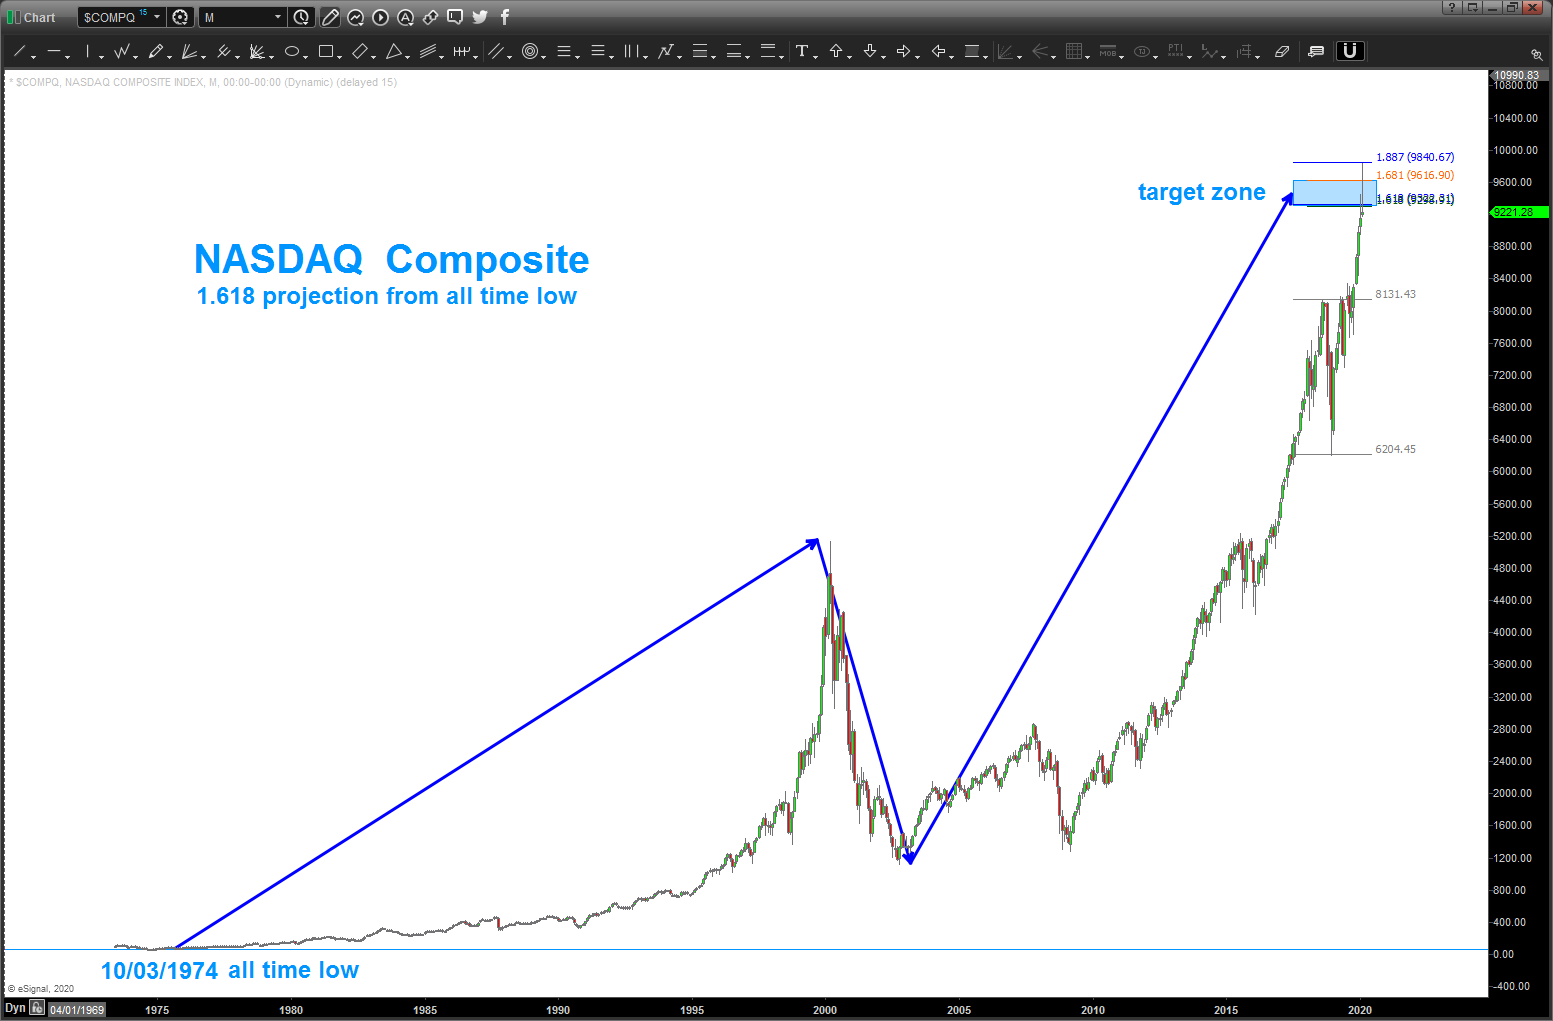
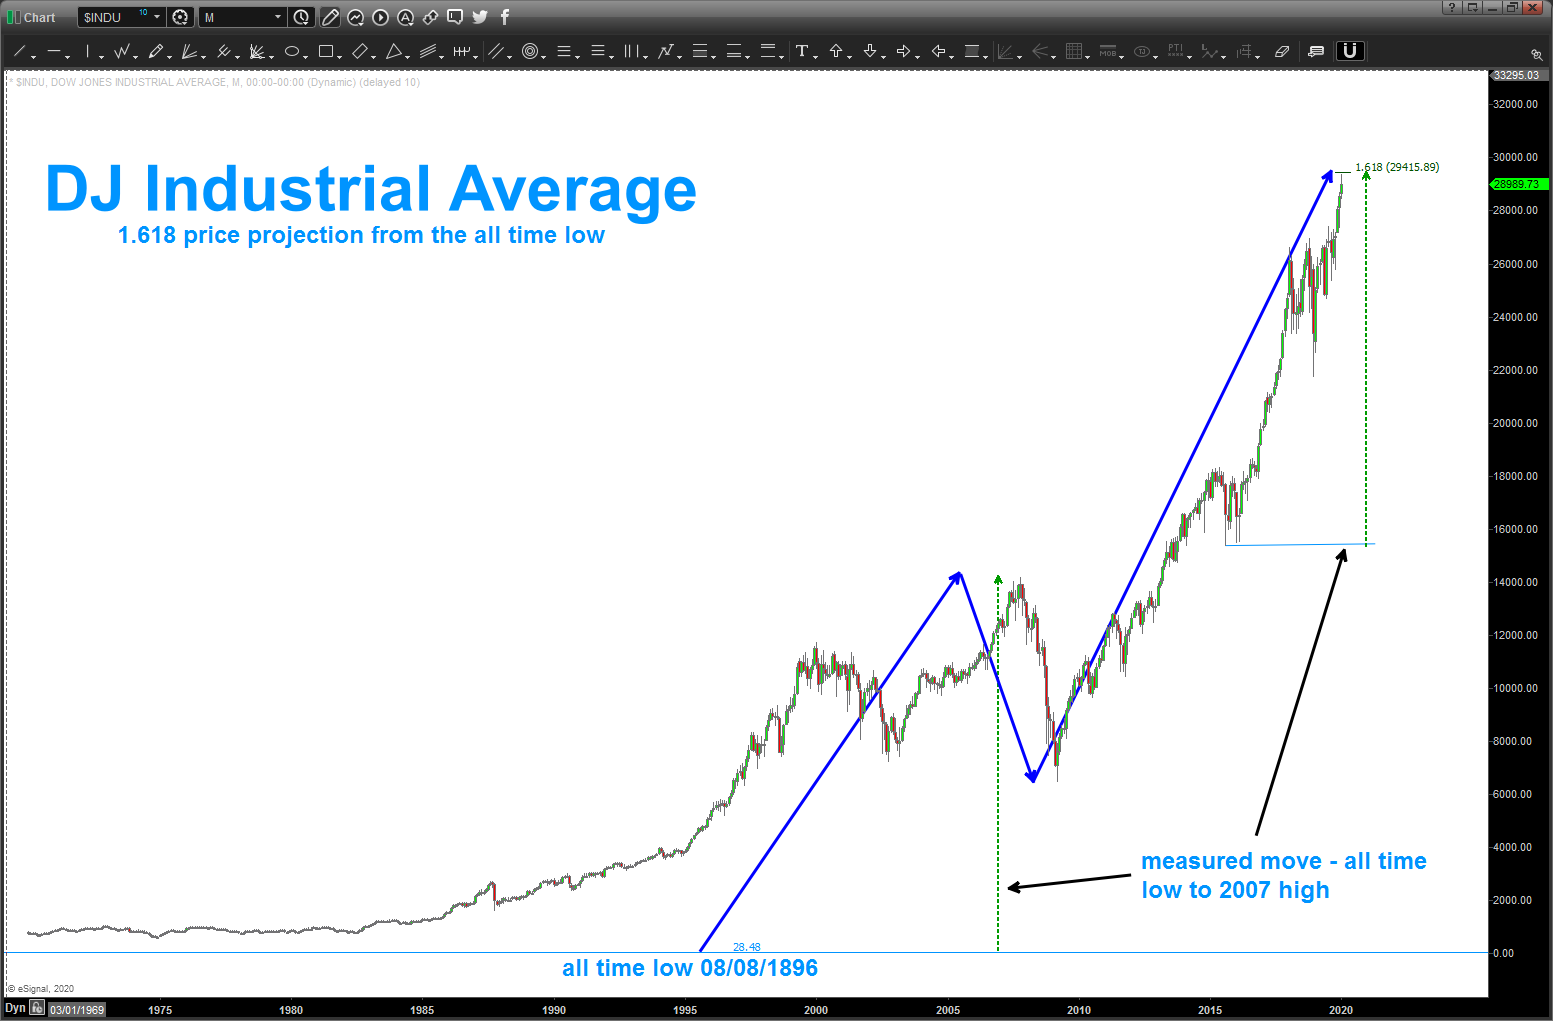
here’s a look at the long term targets that have been hit or are less than 1% away from being hit. if these charts were intraday or daily charts then I would ‘wait’ for 1% but when, in the case of the DJIA, we are looking at a projection a mere 124 years in the making then I’ll take a percent here or there …
in no particular order …
Dow Jones Industrial Average: the all time low on the DJIA was in 1896 at 28.48. Using that low as A we move the line sector AB into the high of 2007. Mulitplying that by 1.618 to get the 1.618 price projection we get 29415. Looks like that was hit on Friday. also, note the dashed green lines going from the all time low up into the 2007 high. same measured move into the 29415 high.
if we put a 14 period RSI on the chart .. yup, we would have bearish divergence present.
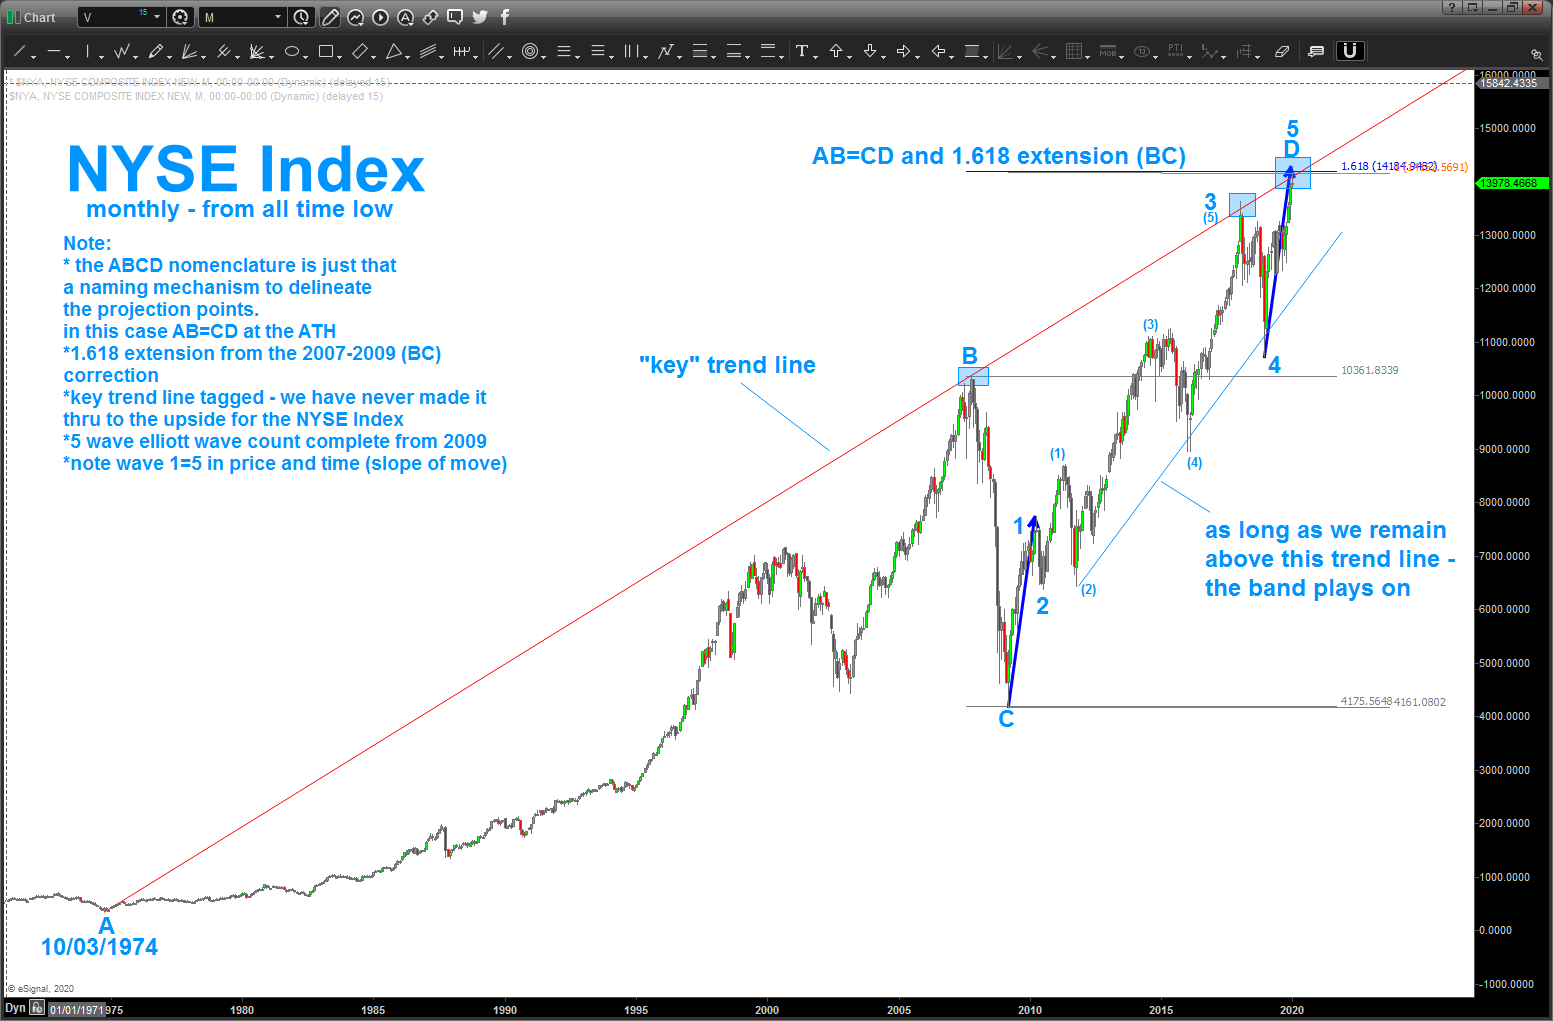
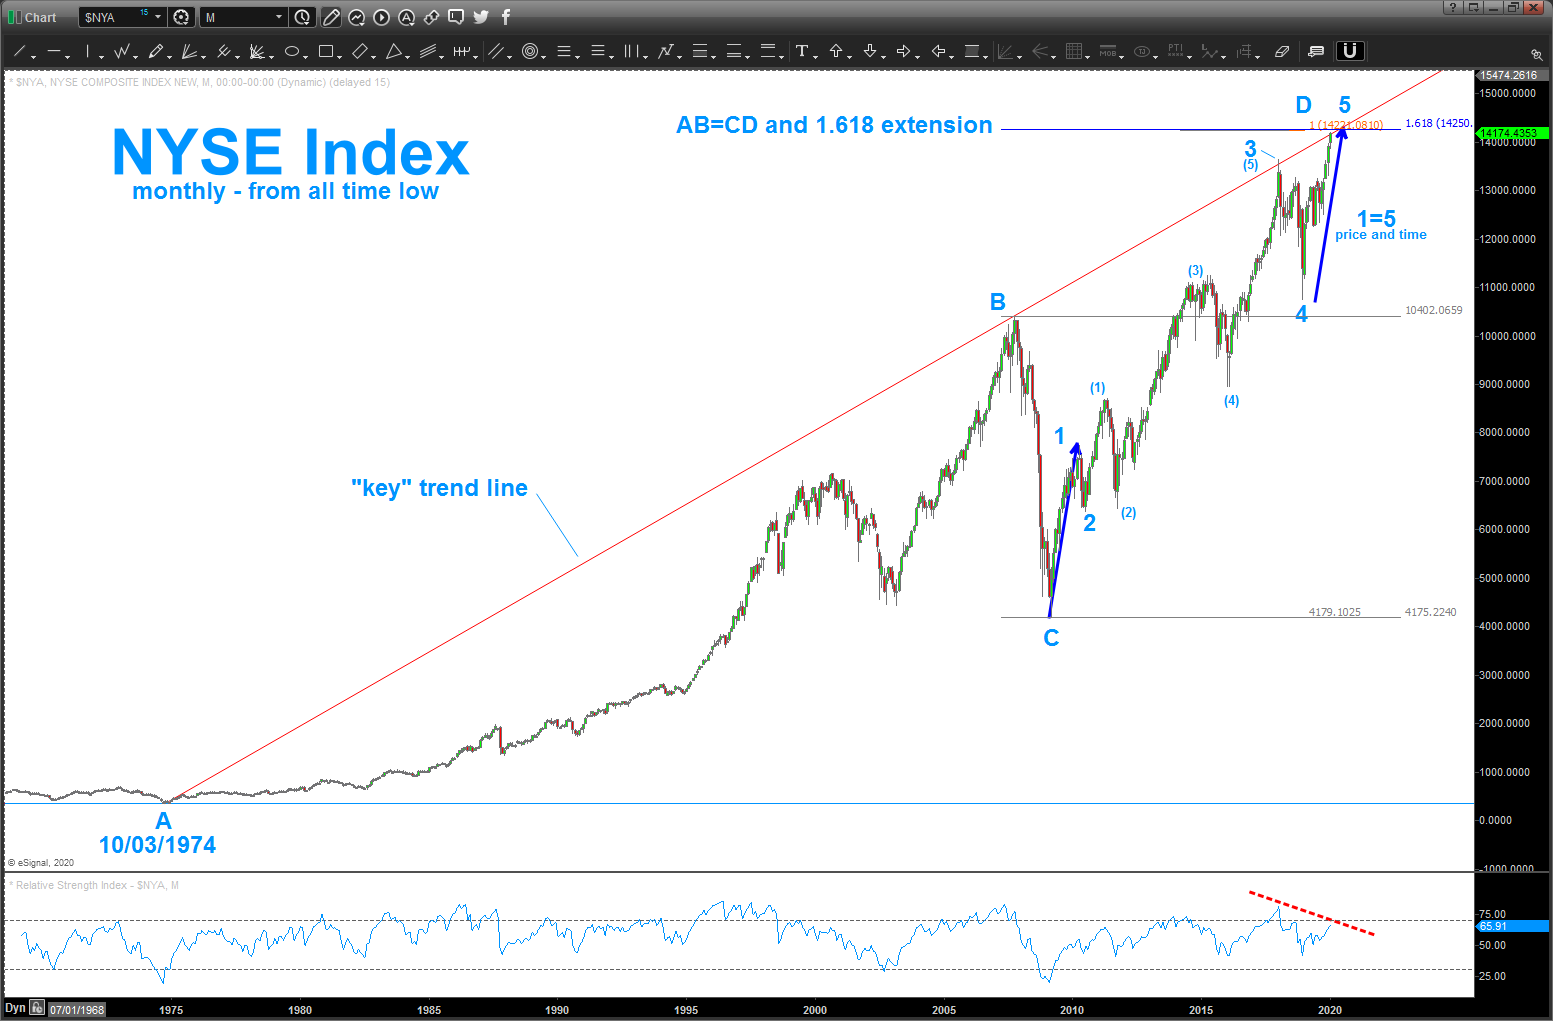
New York Stock Exchange Index: take time to study the notes on the chart. bottom line – multiple confirmations (different techniques) of strong resistance
NASDAQ: 1.618 price projection target hit and closed right on it Friday. Also, note we have an overlapping 1.618 extension target hit …
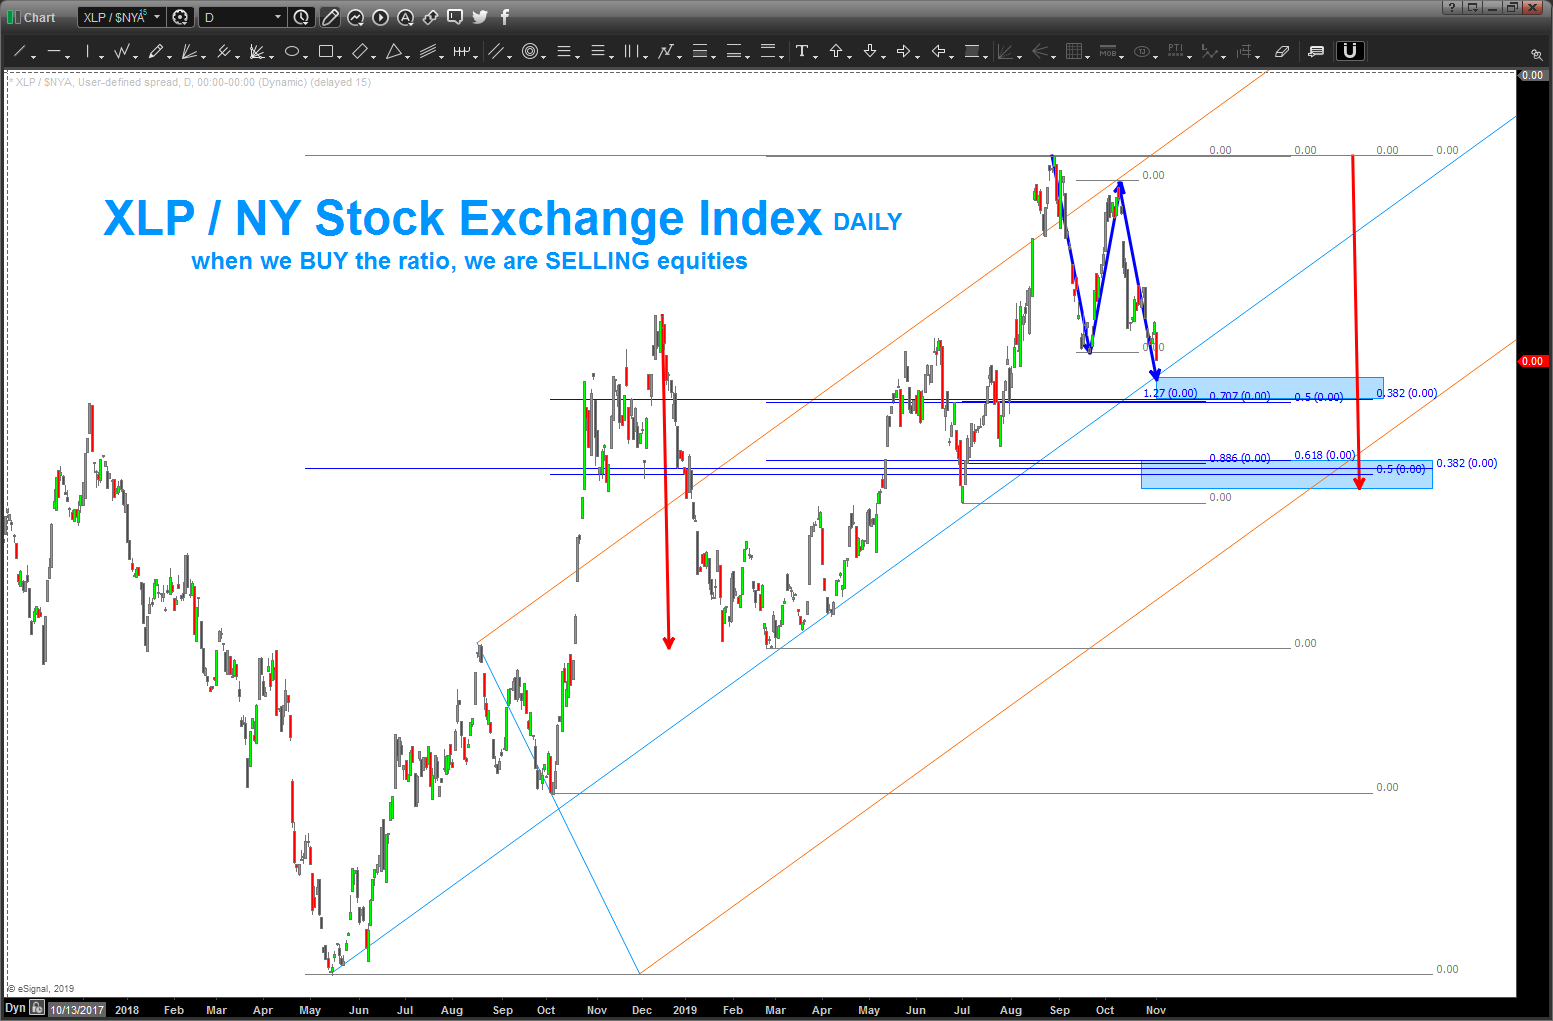
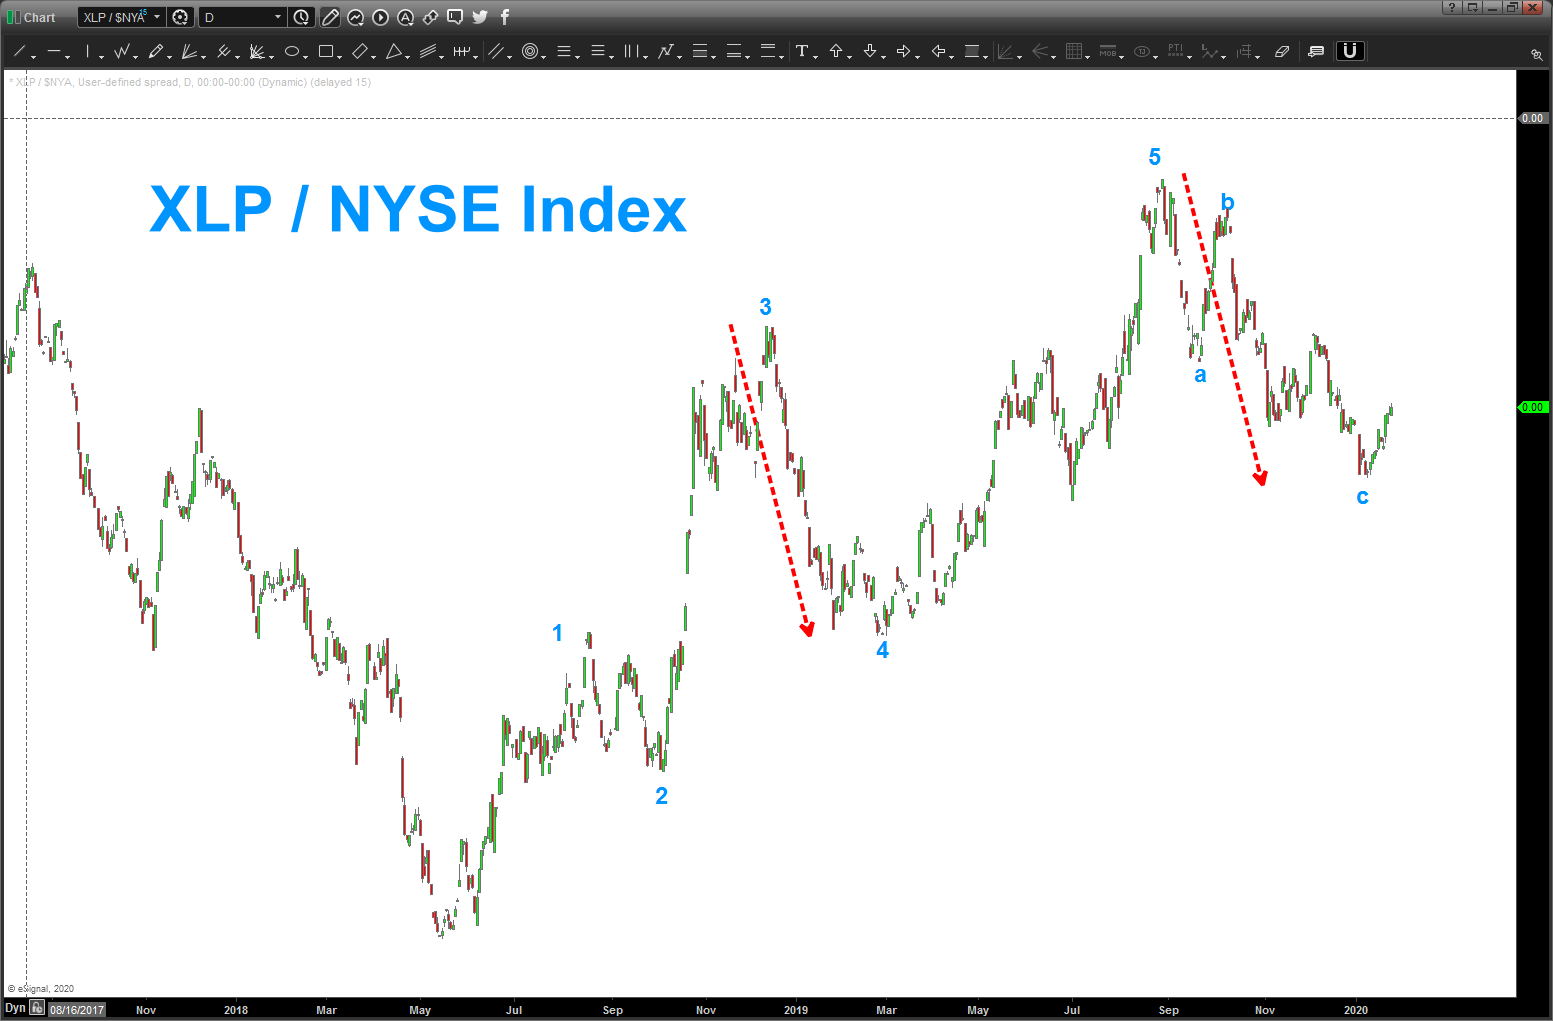
one last, our target zone for the XLP/NYA ratio was hit … continued strength will show the defensive move into staples by the big boys. watch this ratio closely ….
Traders Tip – “Hidden” Levels … or Pattern Polarity
Posted on December 25, 2019 Leave a Comment
the gifts have been unwrapped and food a plenty has been consumed … the rest of the family is watching TV and were about to go walk the beach. rained last night so no surfing .. bacteria blows.
anyway, I’ve received more than a couple emails asking about the different strategies I laid out in my last post around a PATTERN level and how you could work them into your strategies.
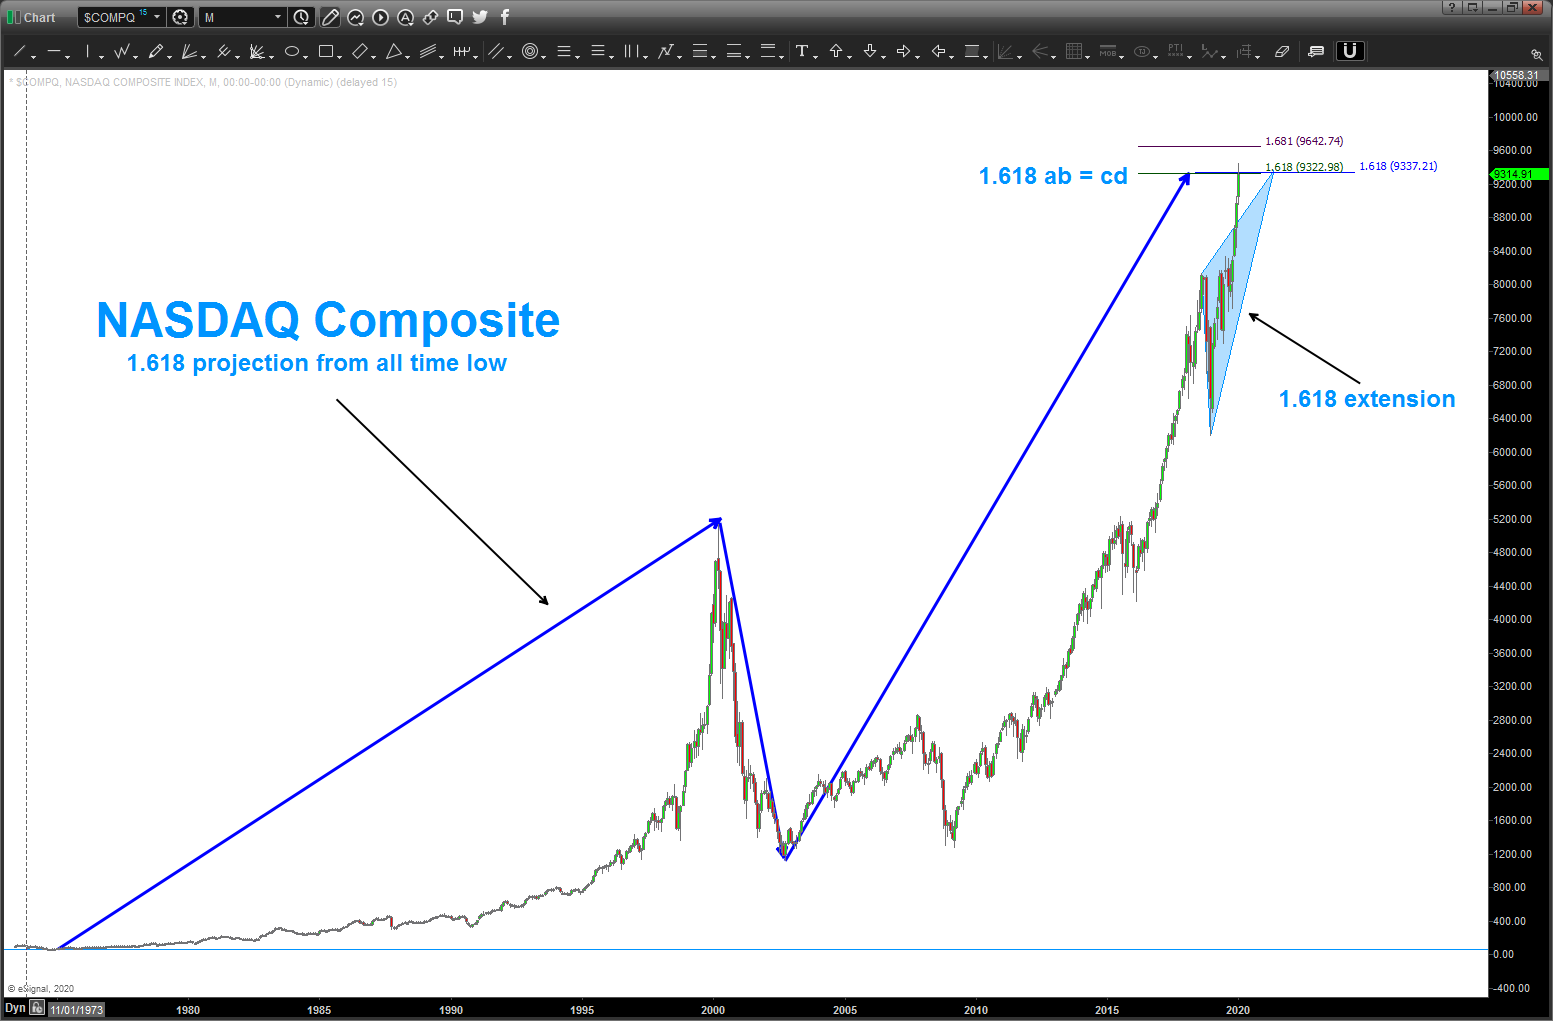
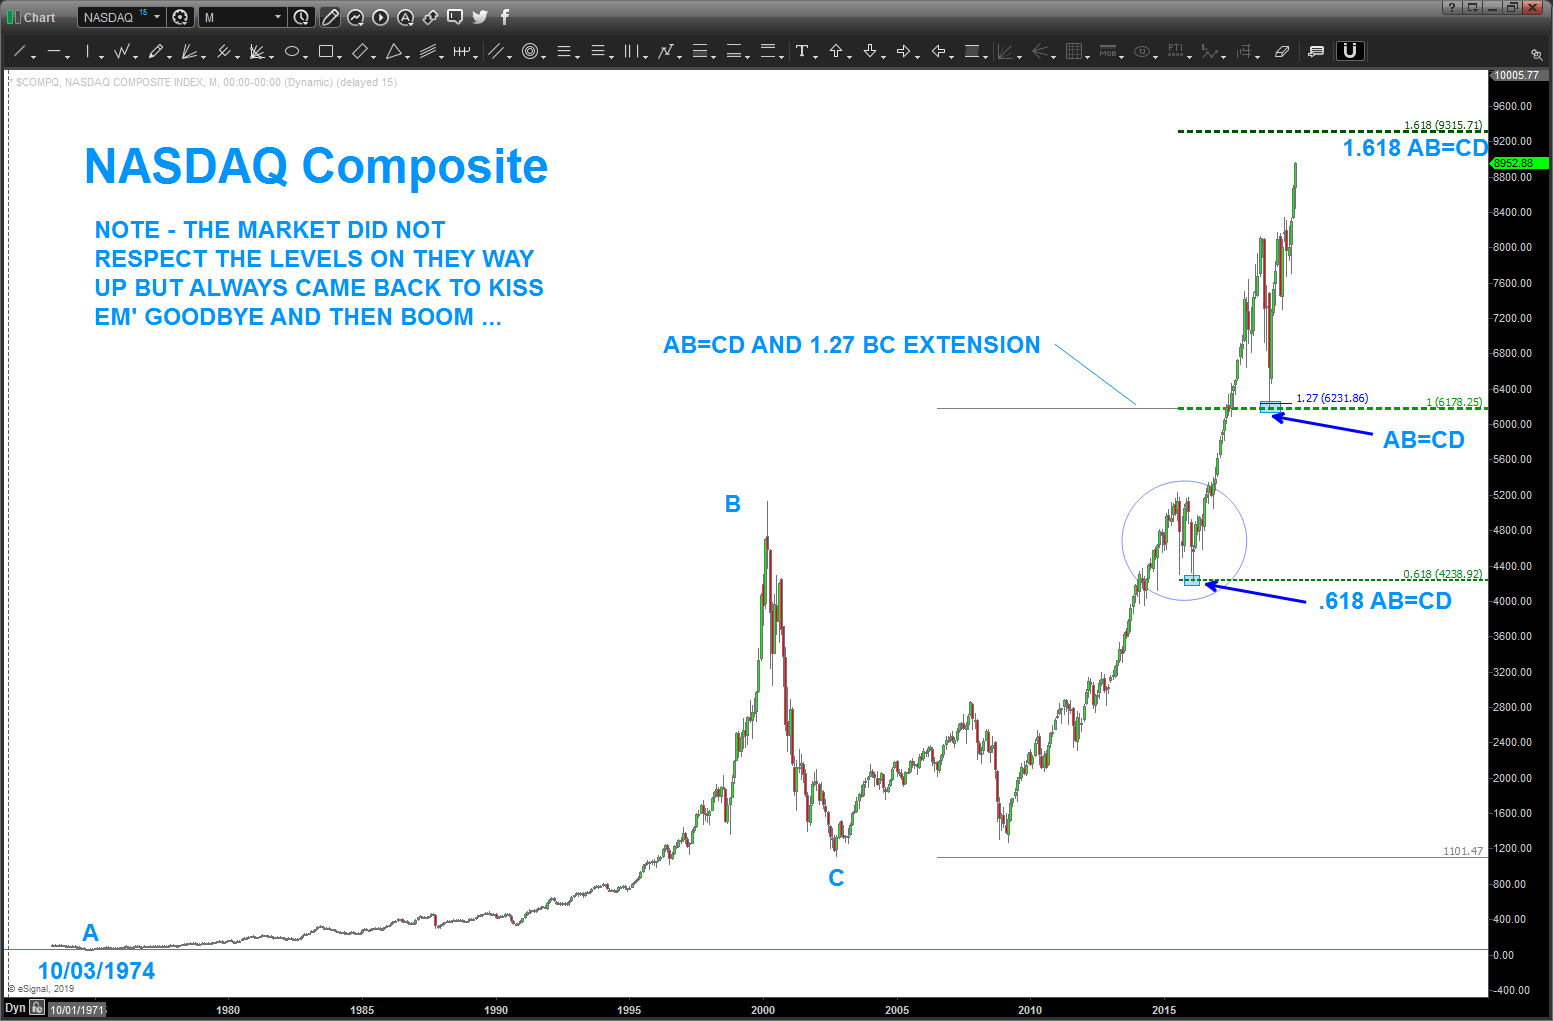
in this case, let’s take a look at the chart below – the NASDAQ composite. I remember, quite vividly, blogging about the 6200 level on the NASDAQ. Why? Well, much like our NYSE Index pattern, you can see that the Nazzie had a very nice pattern from the all time low (AB=CD and 1.27 extension) the market didn’t even pause and blew right thru it …but, notice how it came back and touched it and then exploded higher!
that’s our Traders Tip – this level was ‘hidden’ in that it was a pattern that came from the low in 1974 and also the BC extension from 2000-2002. the market WILL come back to these levels and, the highest probability trade is to trade AT THAT LEVEL and go in the direction of the original break of the pattern. in this case, go long at the level.
notice what happens when we use a .618 projection of the AB leg .. in his case .618 AB at 4238. Just like the AB=CD, the market blew thru it and then came back to kiss it and then off it went … there are examples of this everywhere. the longer the time frame to create the pattern-the more important the level.
one last – notice the 1.618 AB = CD at 9315 … per my last post, around 3% higher, you’ll have a KEY level to trade short, tighten stop if long and wait for a monthly signal reversal candle, or do nothing and wait for a signal reversal candle or wait to see if the market blows thru this level and then patiently wait for the market to return to this level to go long …
I respect and honor all religions … so, Happy Festivus and enjoy family friends over the Holidays.
Bart
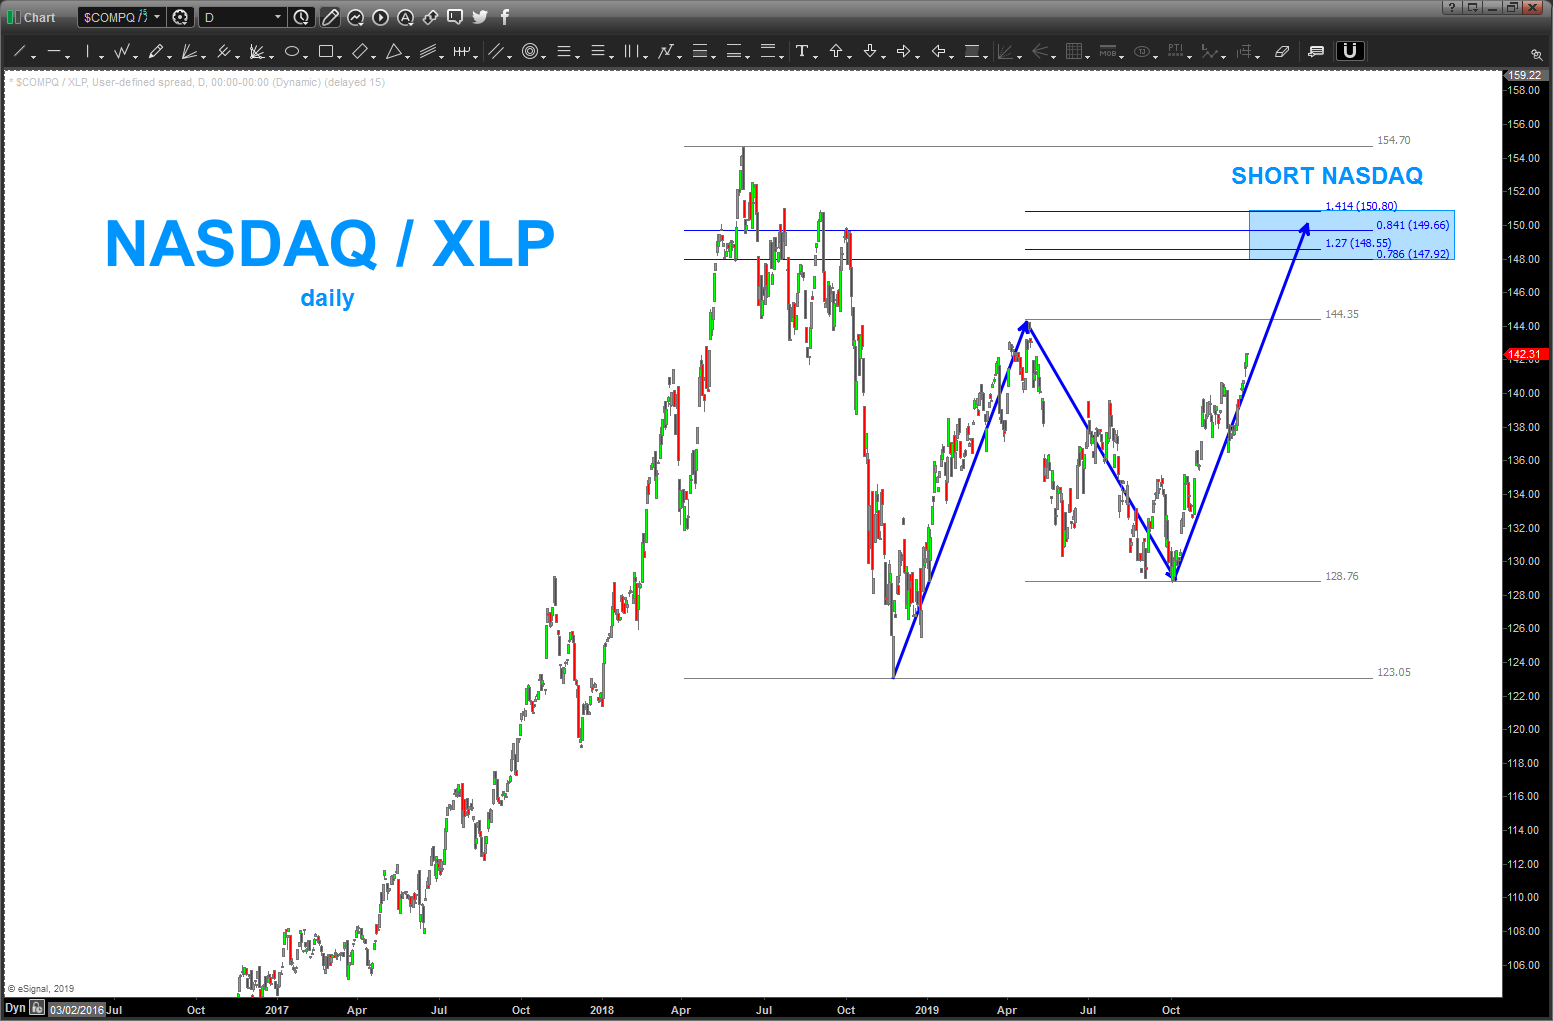
also, look at this clear as day SELL PATTERN on the Nasdaq / XLP ratio. when the blue boxed level gets hit, then SELL the NASDAQ. If, the 1.618 Nasdaq projection AND the Nasdaq/XLP level are being hit at the same time, your probability of an important level to short increases.
NYSE Index – 2 percent’ish higher and we have a BIG PATTERN
Posted on December 22, 2019 Leave a Comment
Folks,
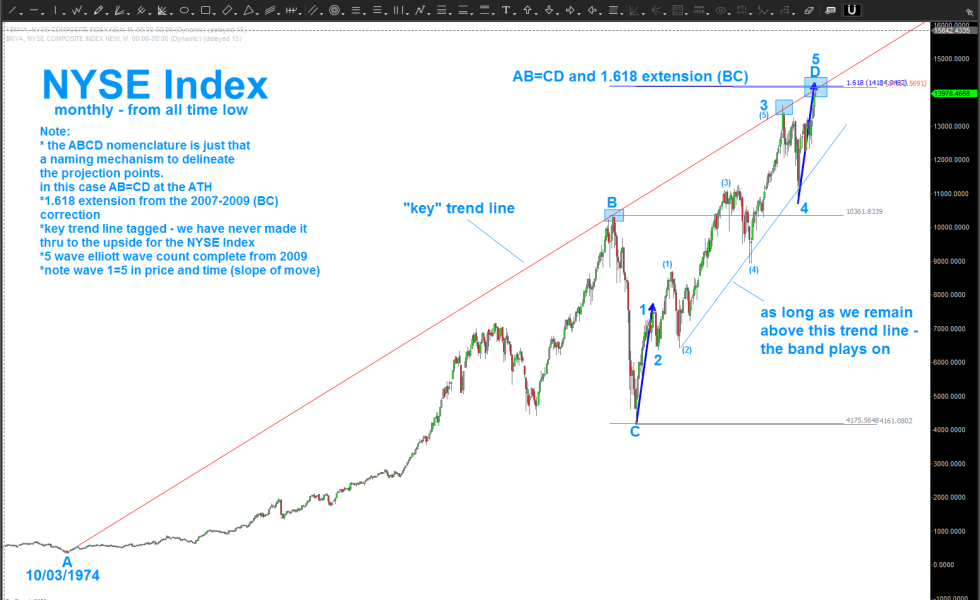
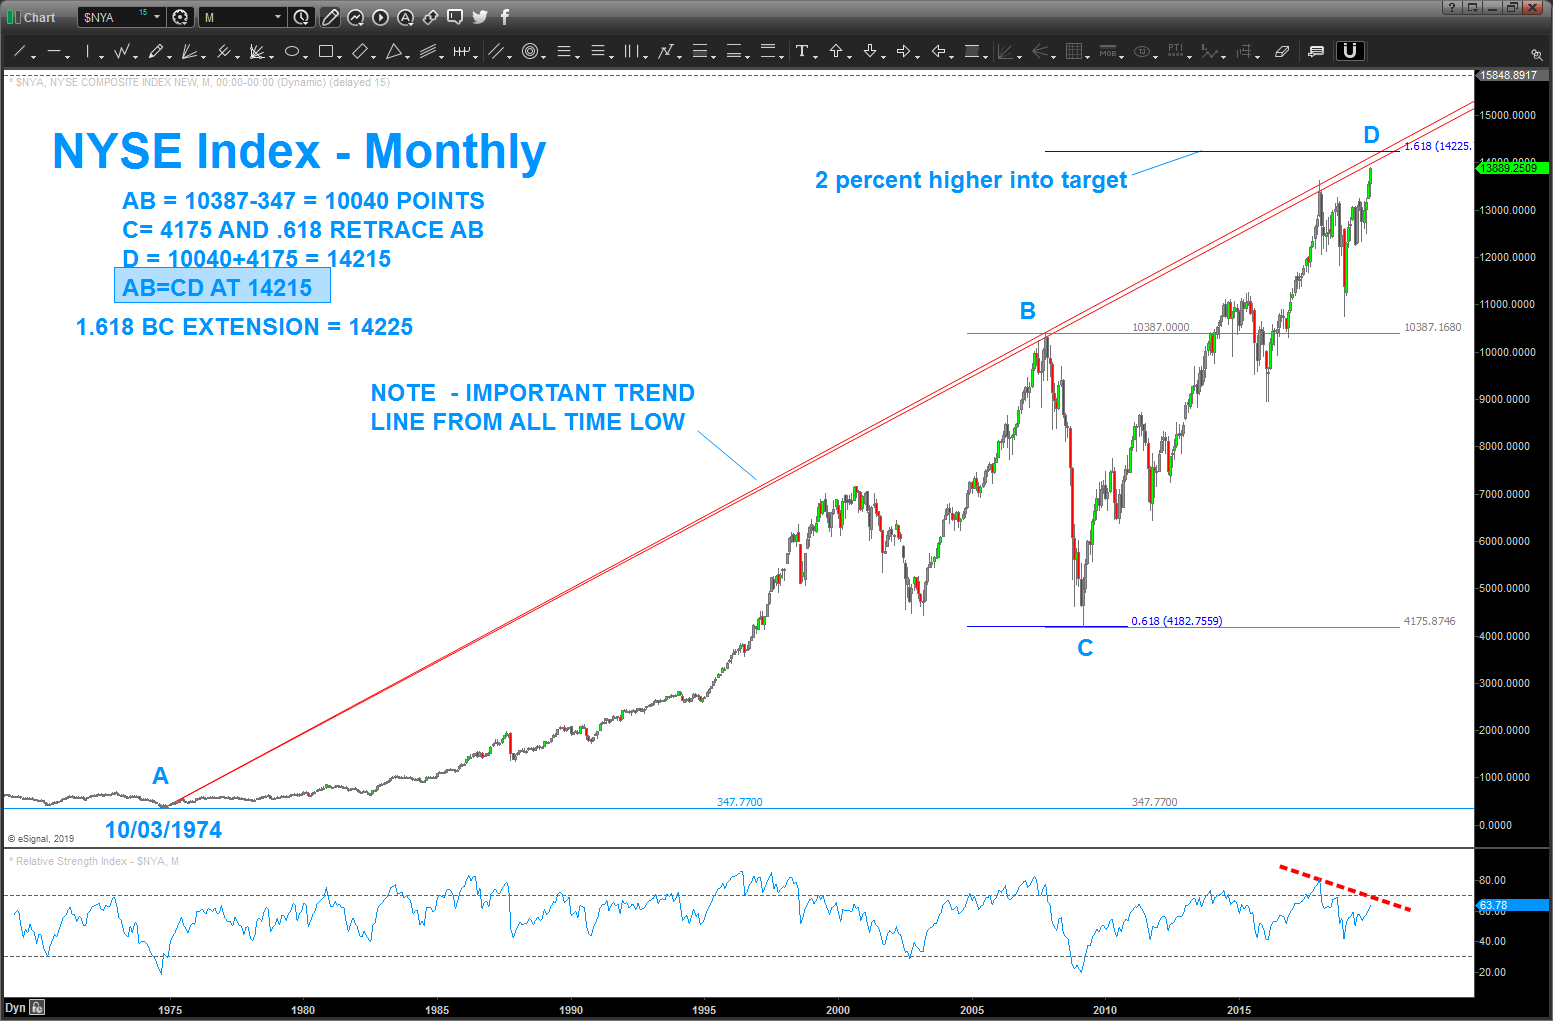
it’s nothing but a pattern .. in this case, from the all time low in 1974 we have AB=CD. You can see the math below …additionally, we have the 1.618 extension w/ in 10 points of this level. The levels are less than 1% away from each other. to add some more fuel to the fire we can easily see the monthly bearish divergence present on the 14 period RSI and then the key trend line that tagged the October of 2007 high and, most recently, the January 2018 high …
now, I want to explain something about PATTERNS. I’m not calling a top or making a call or any of that. folks, it’s simply a pattern. I saw a expanding triangle pattern on the DOW – that failed. when we look at patterns you can play it any number of ways. you can 1/ take profit if long or 2/ tighten your stop and watch for a monthly signal reversal candle or 3/ short at the level w/ a stop according to your risk patterns or wait for a weekly/monthly signal reversal to get short. then again you could 4/ do nothing … or if you want to get long – wait for the level to be breached to the upside and then WAIT and o a pullback it will come back to that old level and then trade against that from the long side …
so you see, it’s just a pattern and, because of the long time frame that has made these patterns (AB=CD and 1.168 extension) it is something we need to pay attention to …
it’s only 2% higher …
have a great Christmas w/ family and friends. if you celebrate something else, celebrate as GREAT as you can.
happy Festivus to the rest of us and be good …
Bart
Home Depot
Posted on November 23, 2019 Leave a Comment
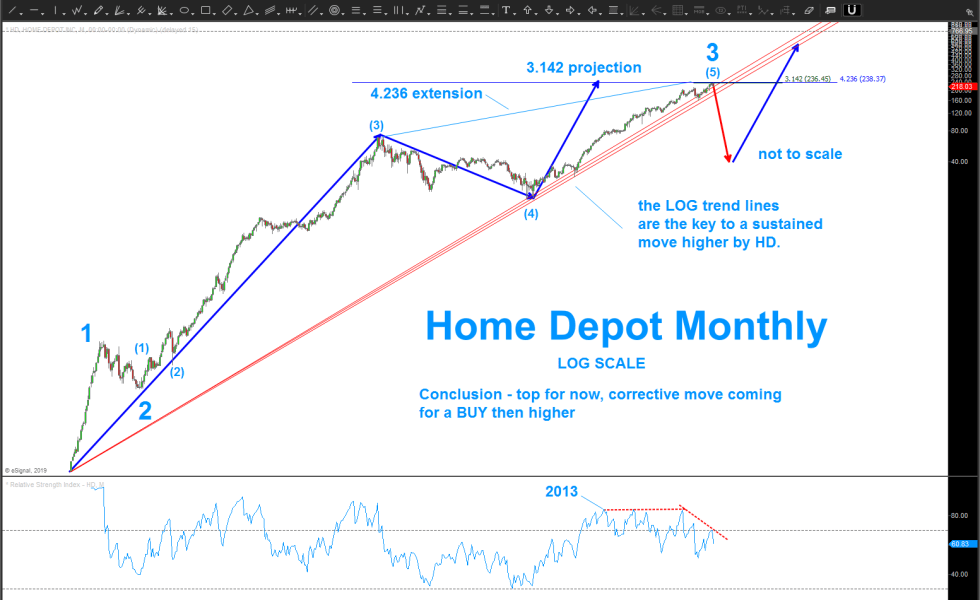
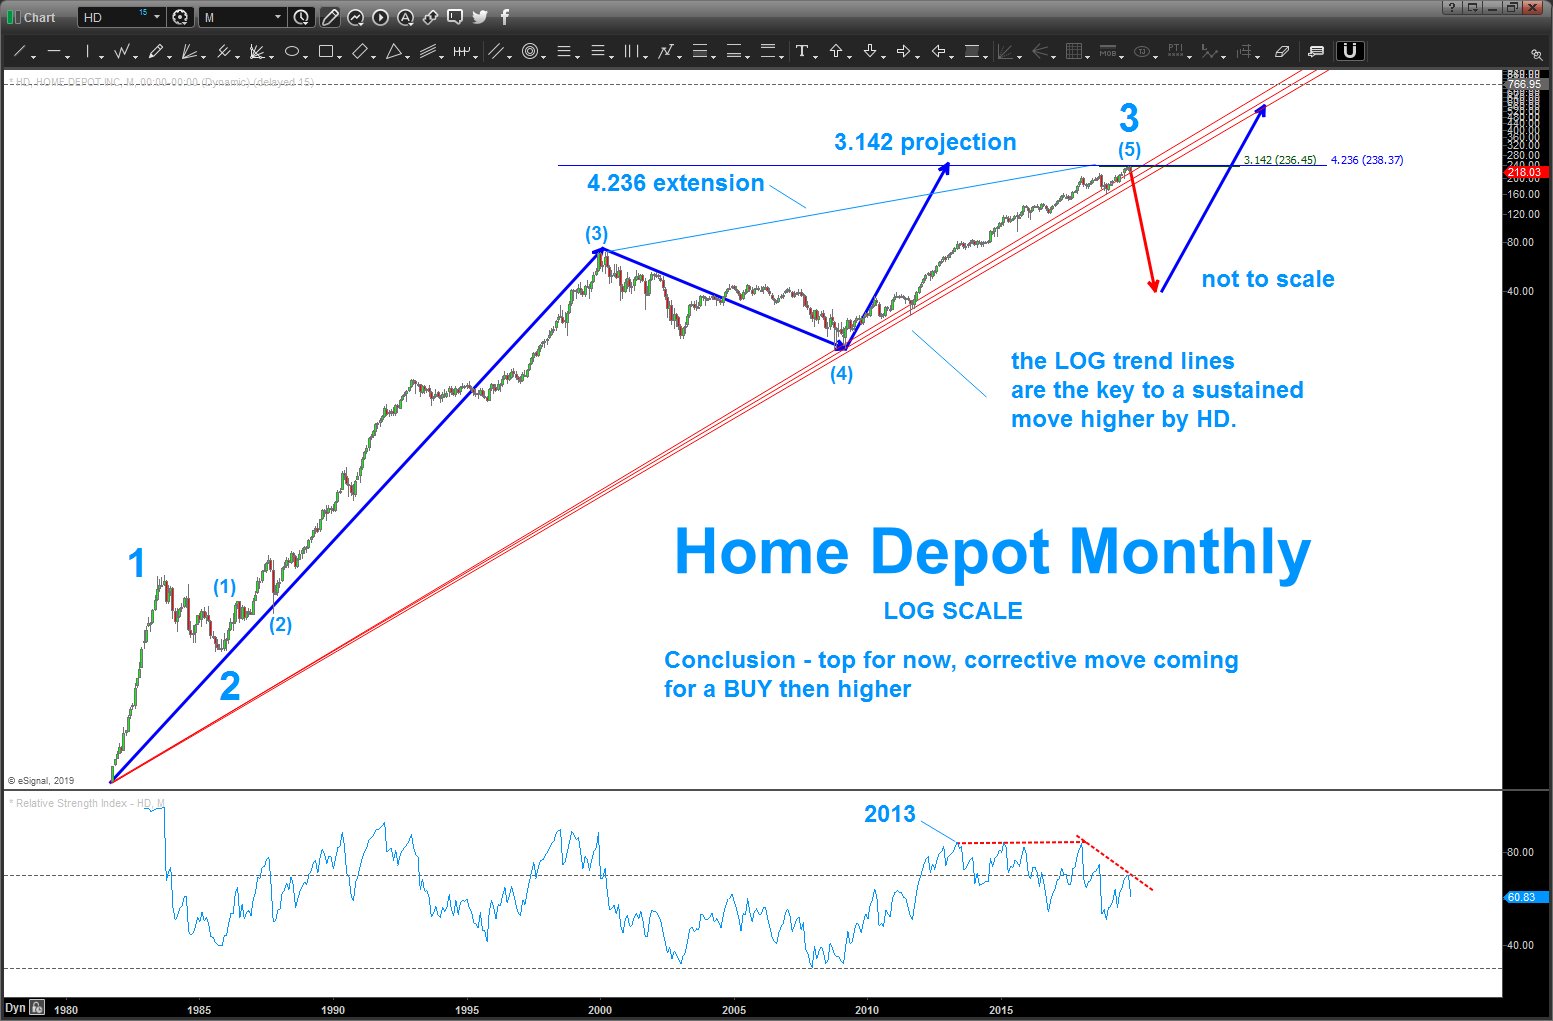
quite the run w/ regard to HD.
here you’ll see some projections and extensions (3.142 and 4.236 respectively) showing the ‘why’ behind the current resistance. would watch a weekly close below the red trend lines as a signal that a deep correction is/had unfolded.
as you can see by my count, I’m seeing this as 3 so after this correction it ‘should’ roll to new highs.
Bart
Utilities
Posted on November 10, 2019 1 Comment
been working out Utilities: https://bartscharts.wordpress.com/2019/06/08/utilities-again-ugh/
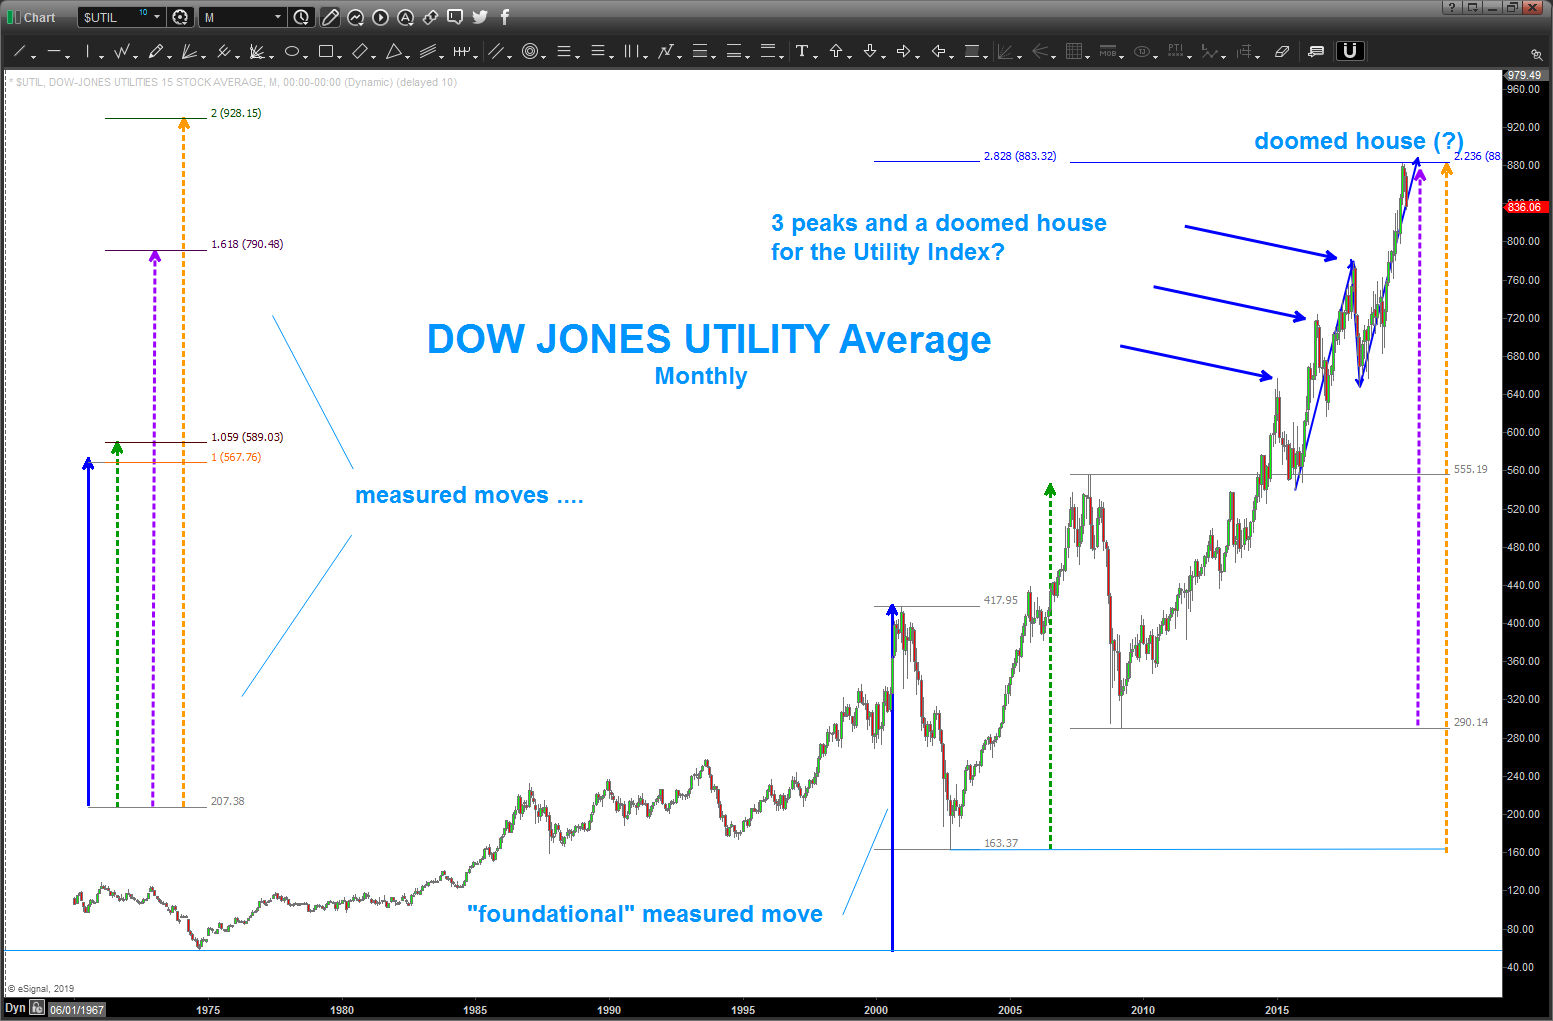
honestly, the strength is palpable and, knowing how much I trust measured moves, was somewhat ‘surprised’ at the lack of respect the Utility sector gave to the ‘math’ and PATTERNS.
so, were at a juncture, again. see the chart below … I did the “how to use what you learned in kindergarten to draw circles and one could make the case that they are not ‘parabolic’ yet.
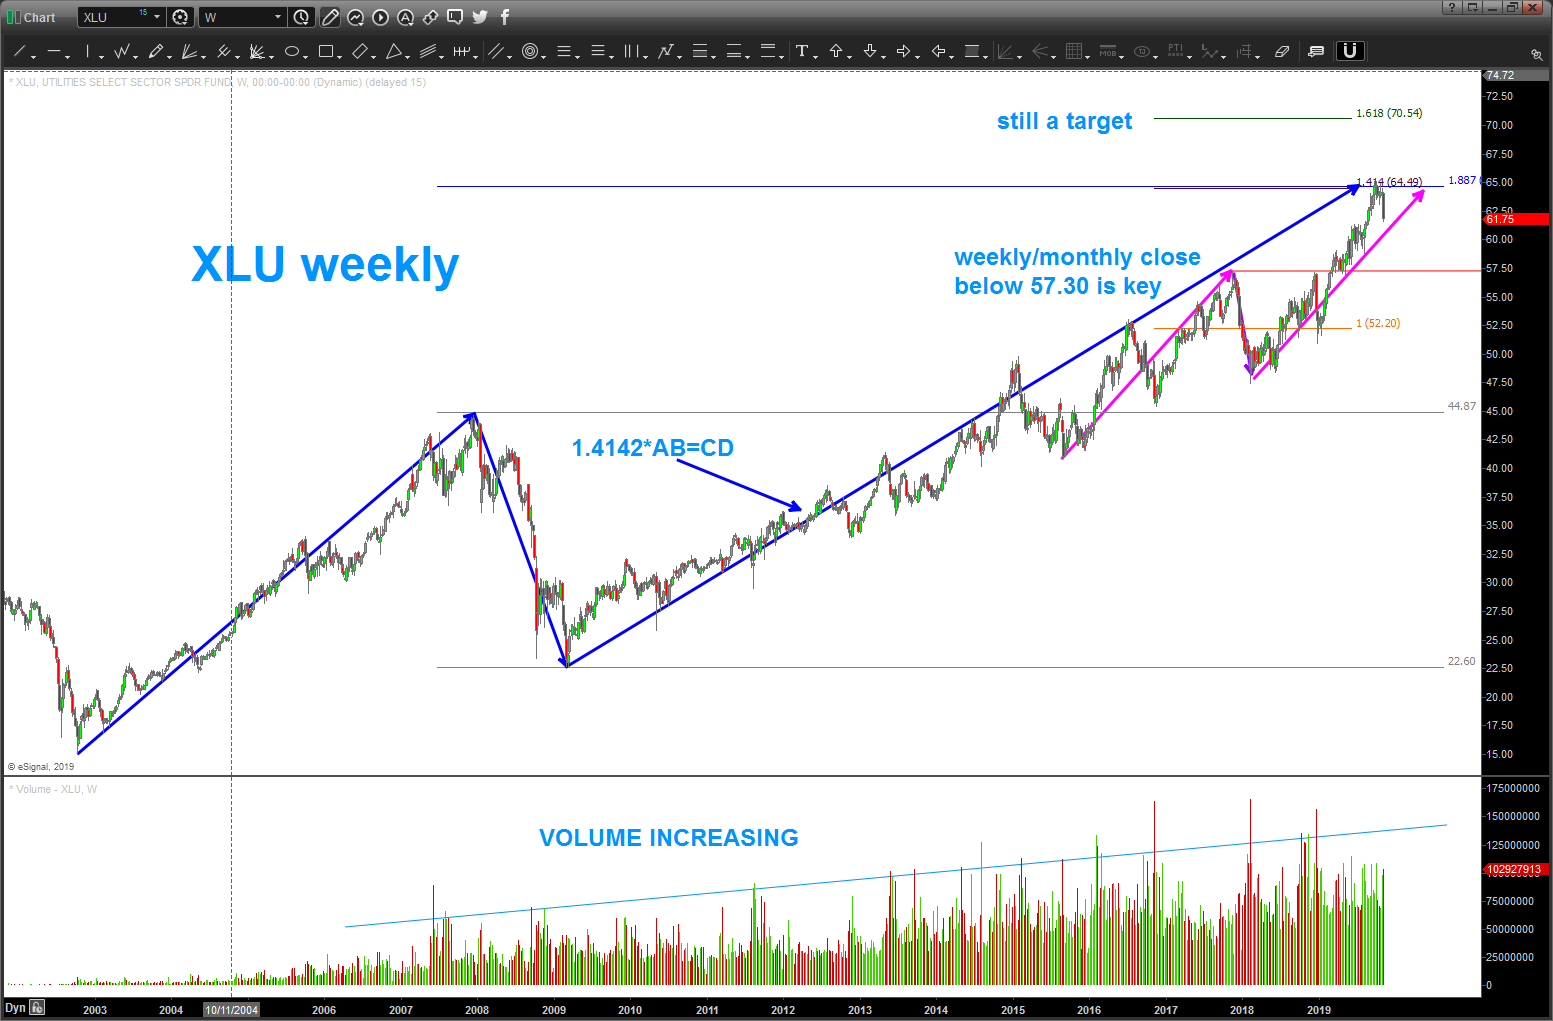
as you can see, the blue arrows show a symmetrical 3 drives to a top w/ both price and time confluence. reacted a little and then blew right thru it .. failed pattern. now we see a 3 drives and a doomed house pattern … also, did some measured move math and we have the square root of 5 and the square root of 8 present at the high. that’s the math for the resistance ….
a weekly close below the 3rd high in/around 778 is key that we have reached an important high for now.
that being said, this is an important sector to watch for now.
here’s a peak at XLU – ETF for utilities.
Ratio … appearing again
Posted on November 3, 2019 Leave a Comment
if you have been following me for a while you know I love the XLP / NYA ratio … well, it’s showing a very nice BUY pattern which ‘should’ (if it works) signify a SELL equities.
here’s the chart …