IWM – update
Posted on March 2, 2019 1 Comment
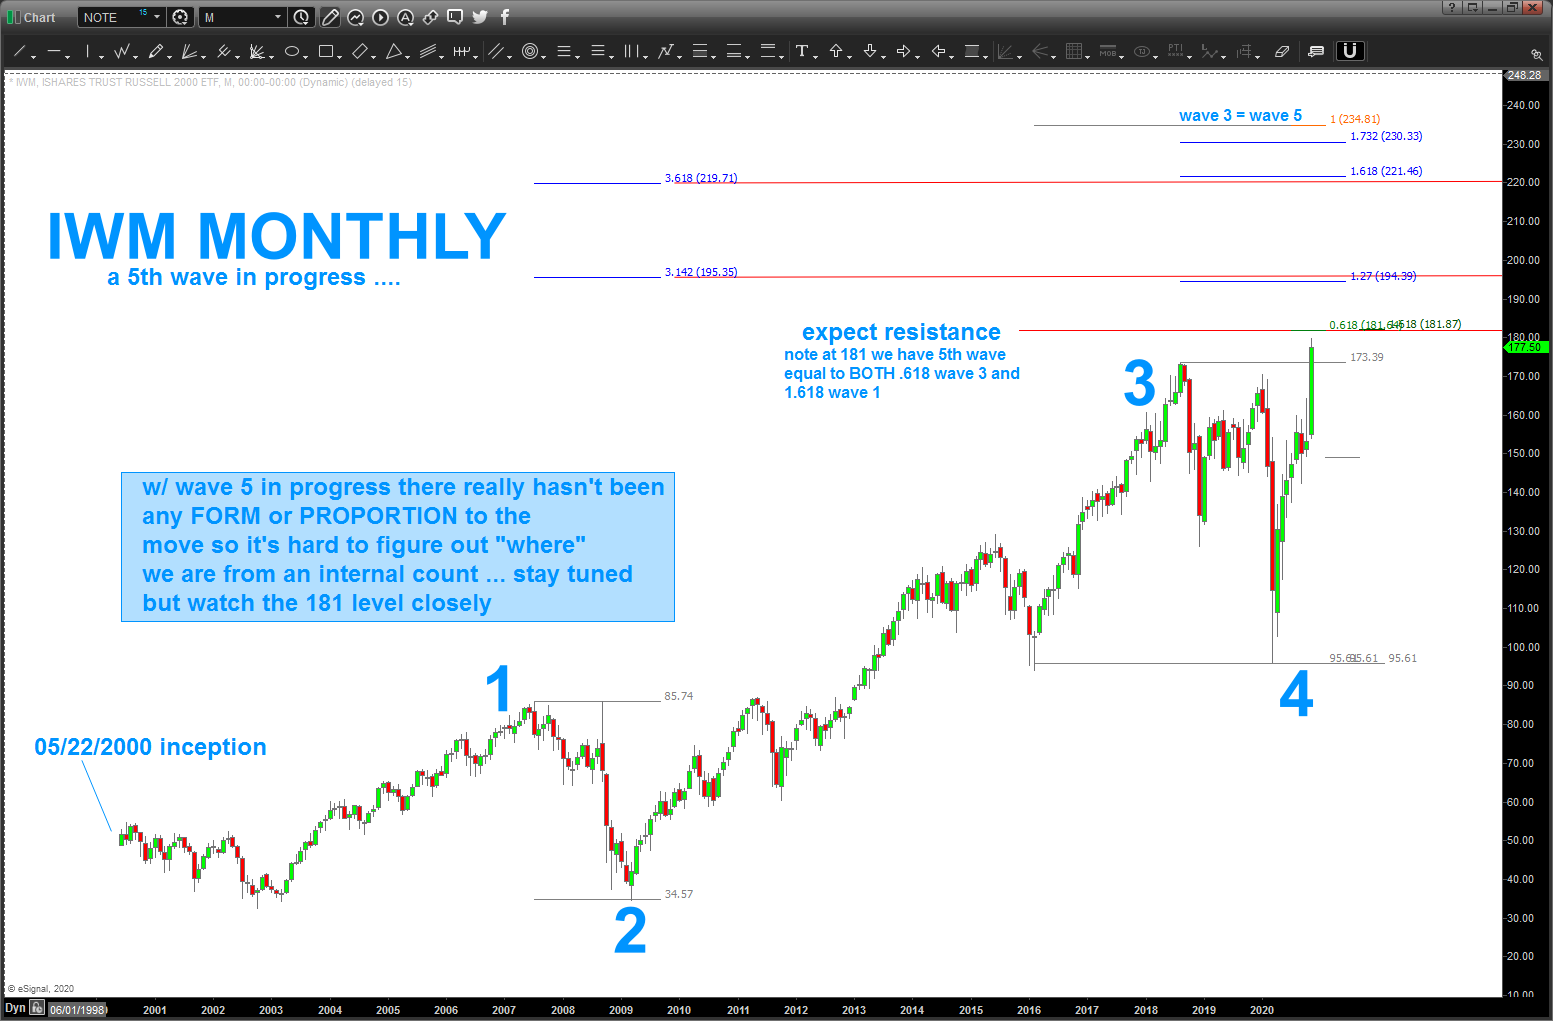
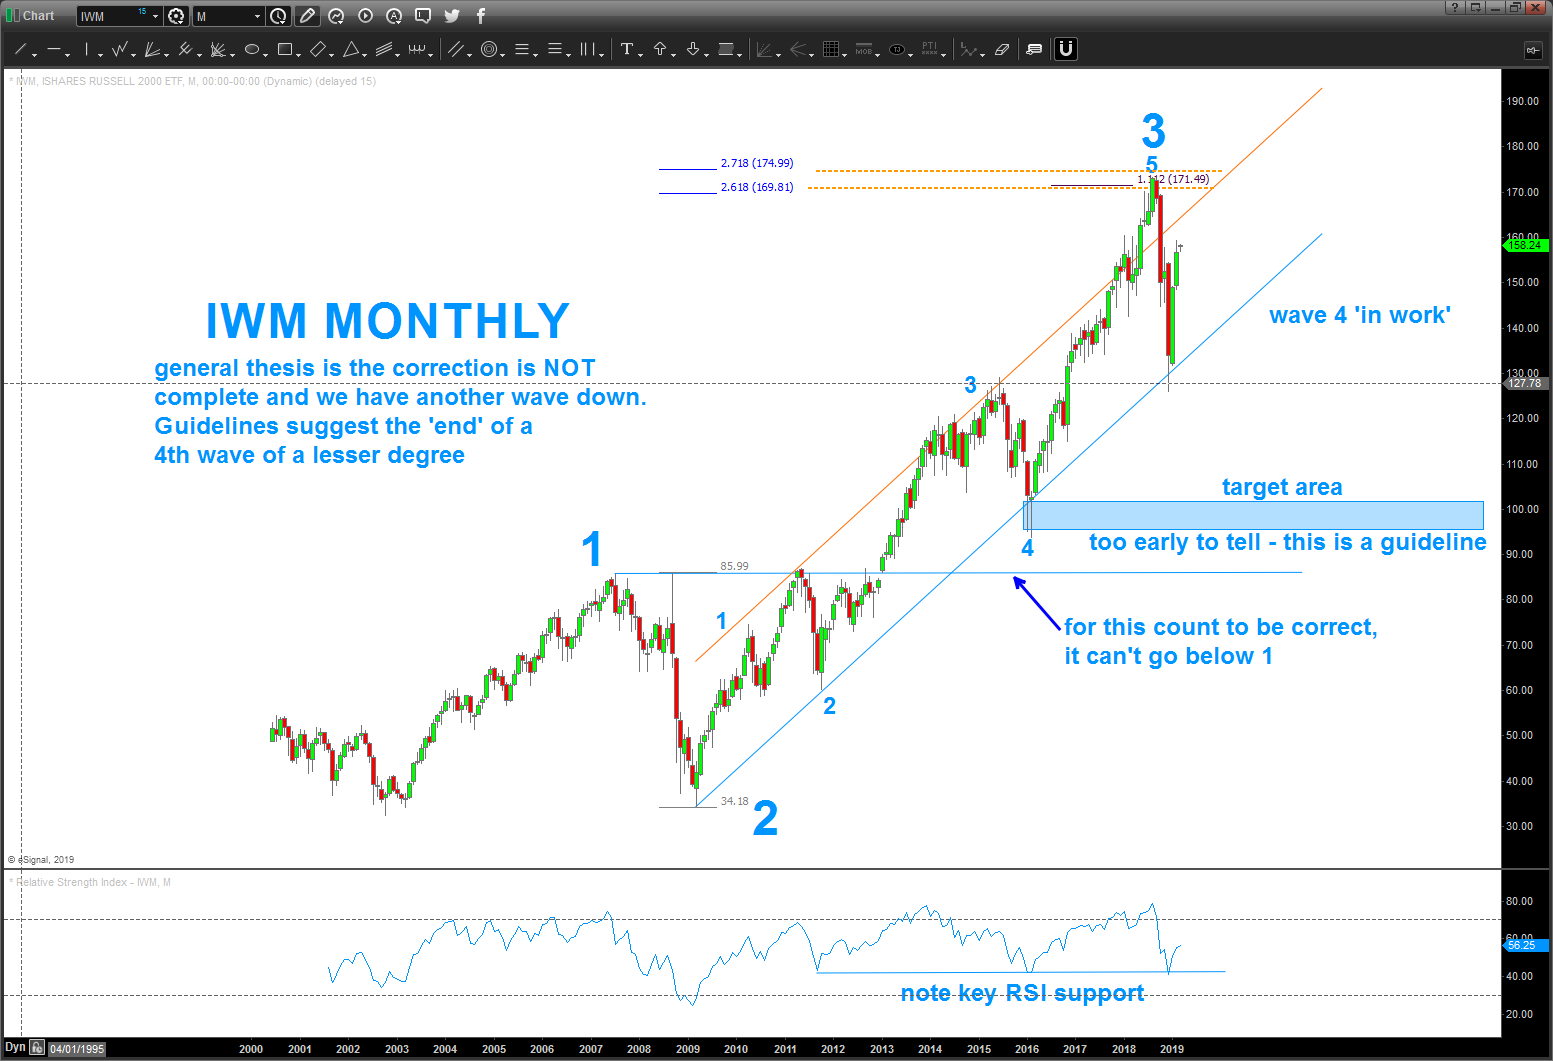
12/1 – quick update to show that the “expect resistance” level has been hit so do just that .. expect some resistance. the form and proportion certainly don’t appear to mean this is the end of a move … I could be wrong, but the thrust and strength certainly suggest higher but not after, perhaps a pause/pullback here in this expected resistance area.
11/22 – nice run from the target area depicted below down in/around 100. You see, we were able to use PATTERNS and some math to figure out a likely “stopping point” or “resistance” for IWM around 173 … we then used a GUIDELINE to pick a nice area where it “could” go. in this case, it did … that solidified a pretty good or solid count of 1,2,3,4 as NO rules were broken and the guideline for the 4th wave worked (this time) so, safe to say, we have a probability that we are in a 5th wave for IWM. as stated on the chart, there isn’t really any form, balance or proportion to make a “good” (in my case that would be very AVERAGE) count …. so, using some “guidelines” I was able to find 181 by using wave relationships and proportionality … in this case 181 represents .618 wave 3 and 1.618 wave 1 projected from the wave 4 low of 95. “expect” some resistance in/around here. but, I just don’t think that it’s it for more upside … stay tuned.
the last time I blogged by IWM was here: https://atomic-temporary-44460632.wpcomstaging.com/2018/05/17/iwm-caveat-emptor-and-check-out-where-price-hovered-today-in-my-p-s-below-cool/
we correctly ID a target zone of resistance and am now looking for another wave down sequence that will, if this count is correct, lead to a great BUY opportunity. I’ve outlined my count in the chart below …
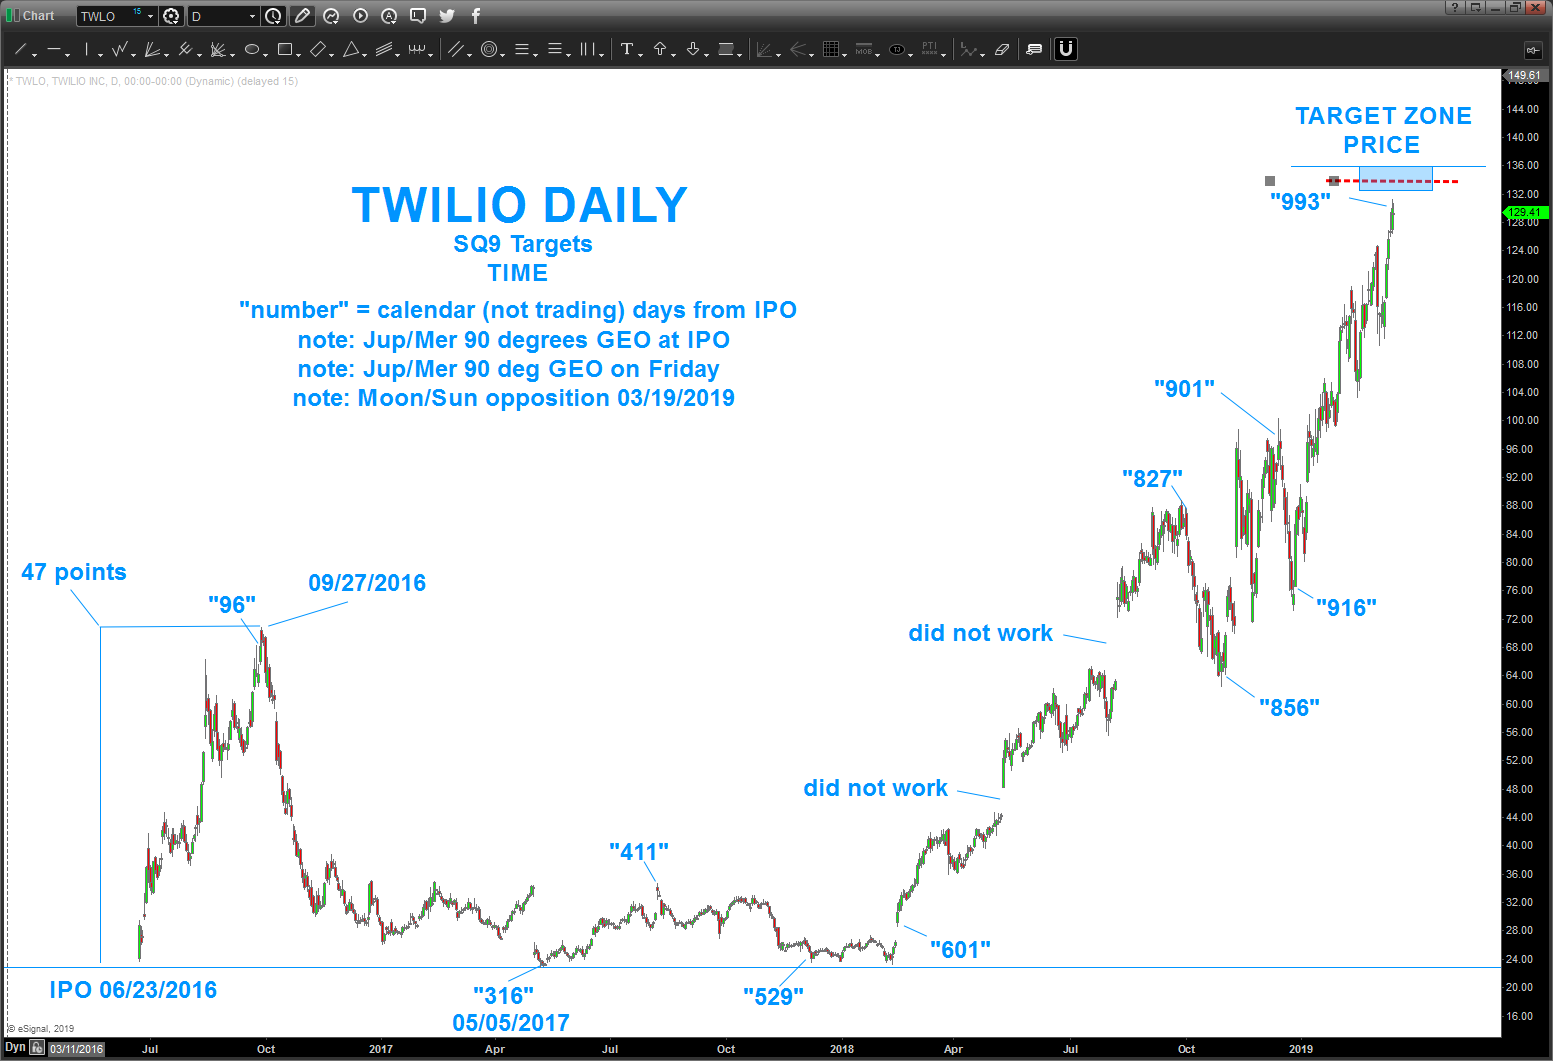
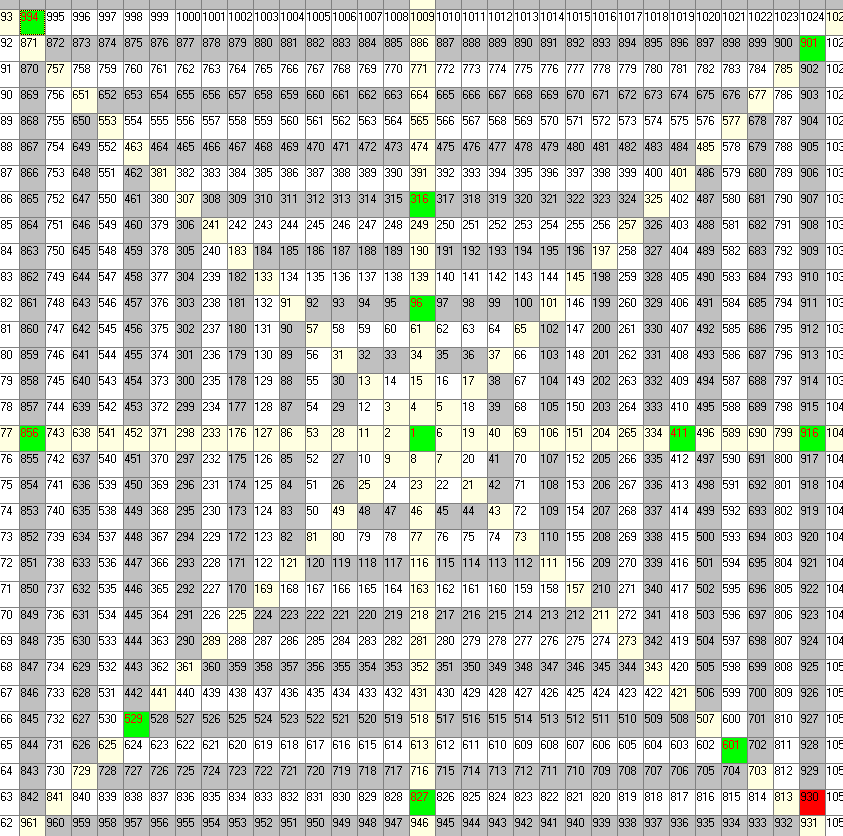
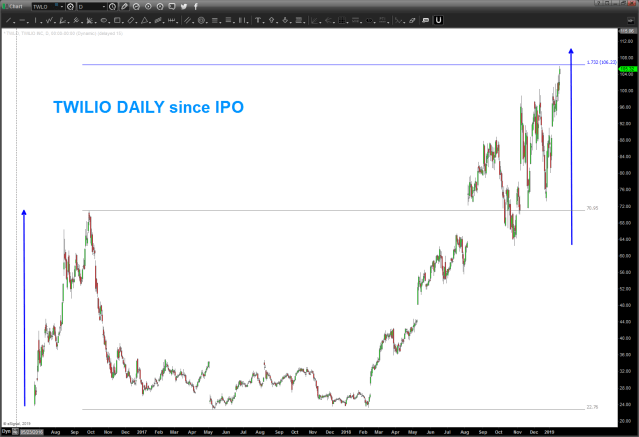
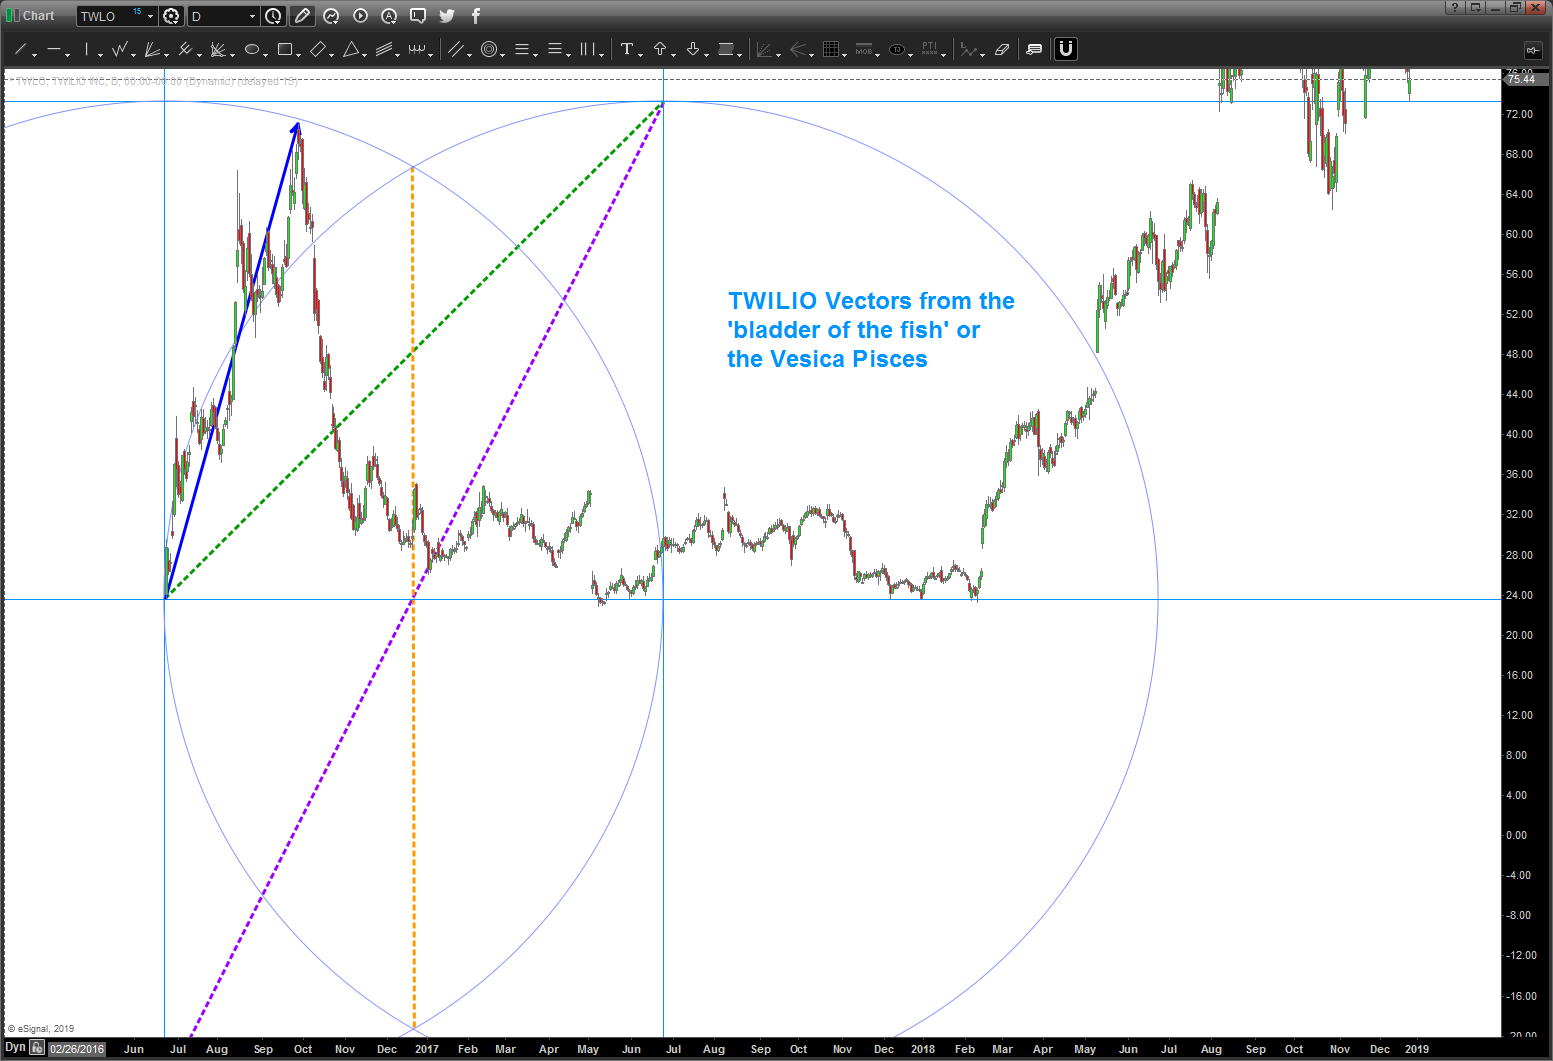
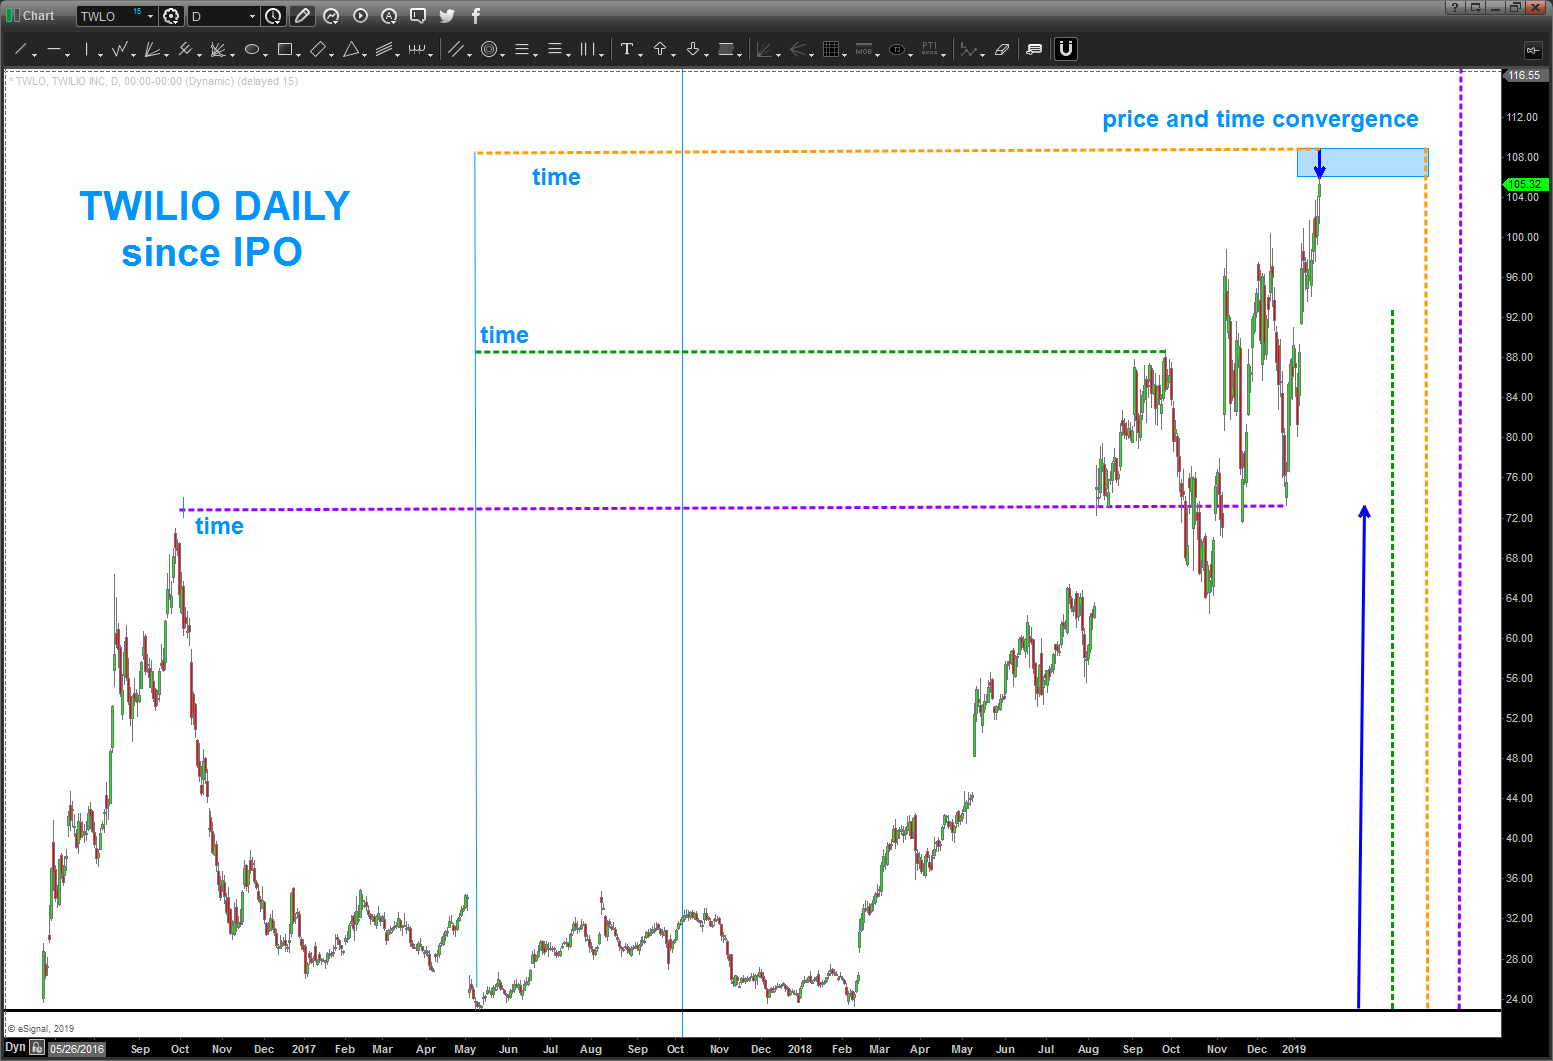
TWILIO (TWLO) and the Vesica Pisces – update 03/17/2018
Posted on January 21, 2019 Leave a Comment
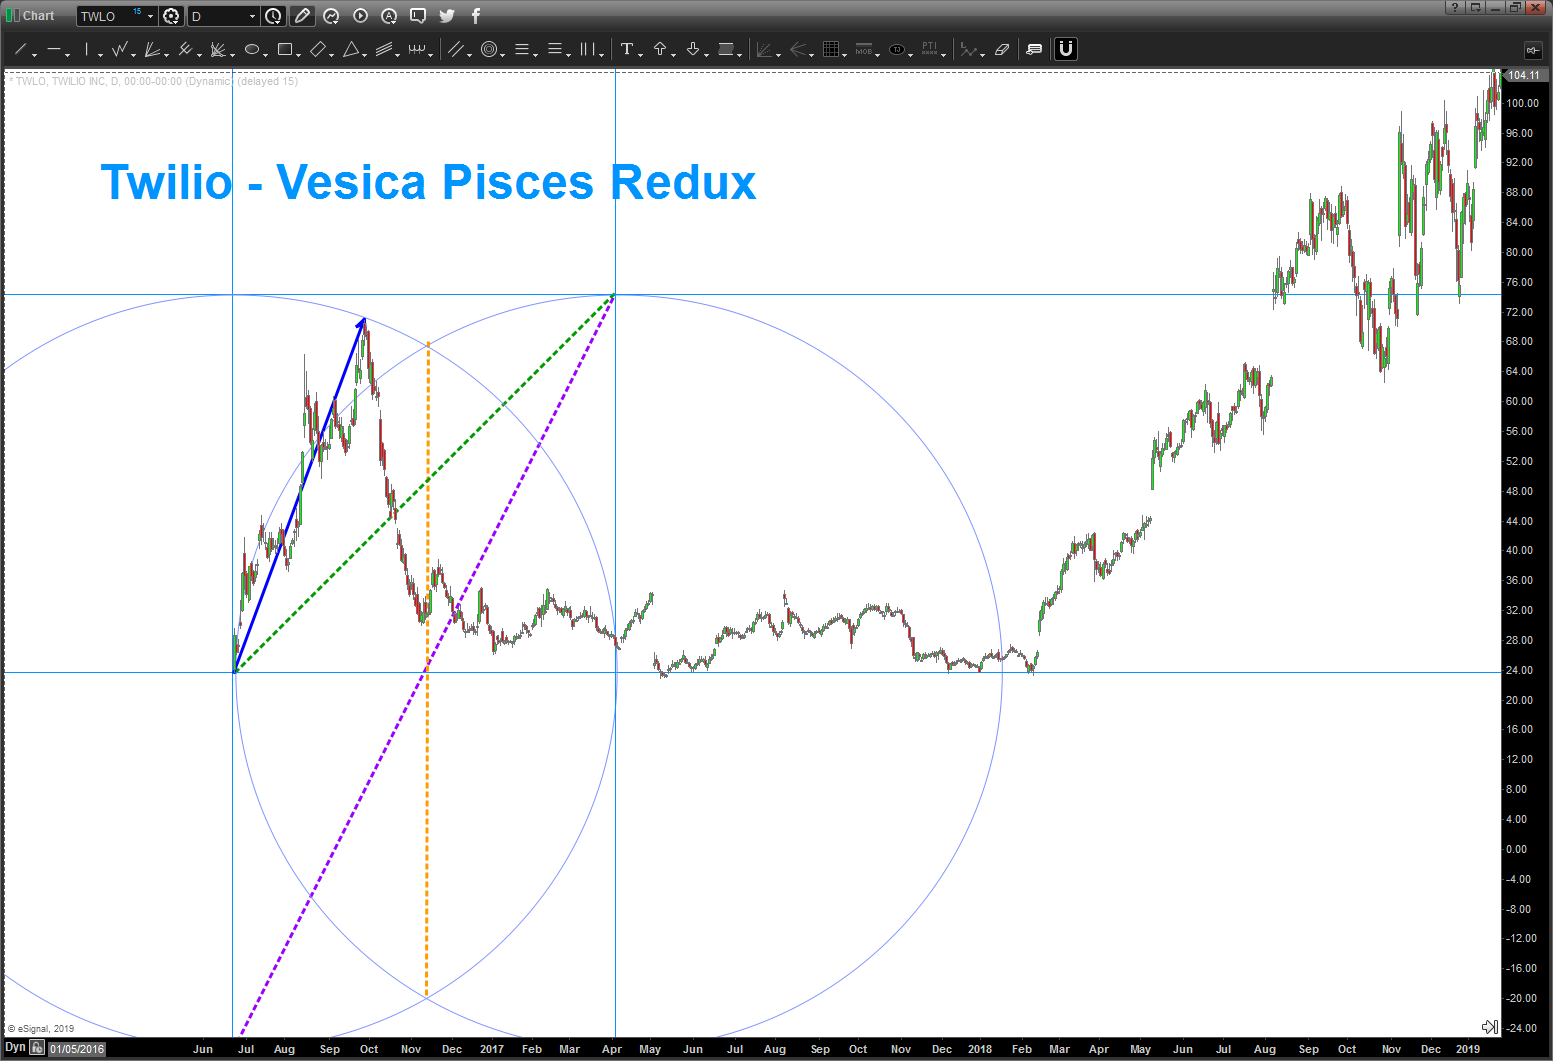
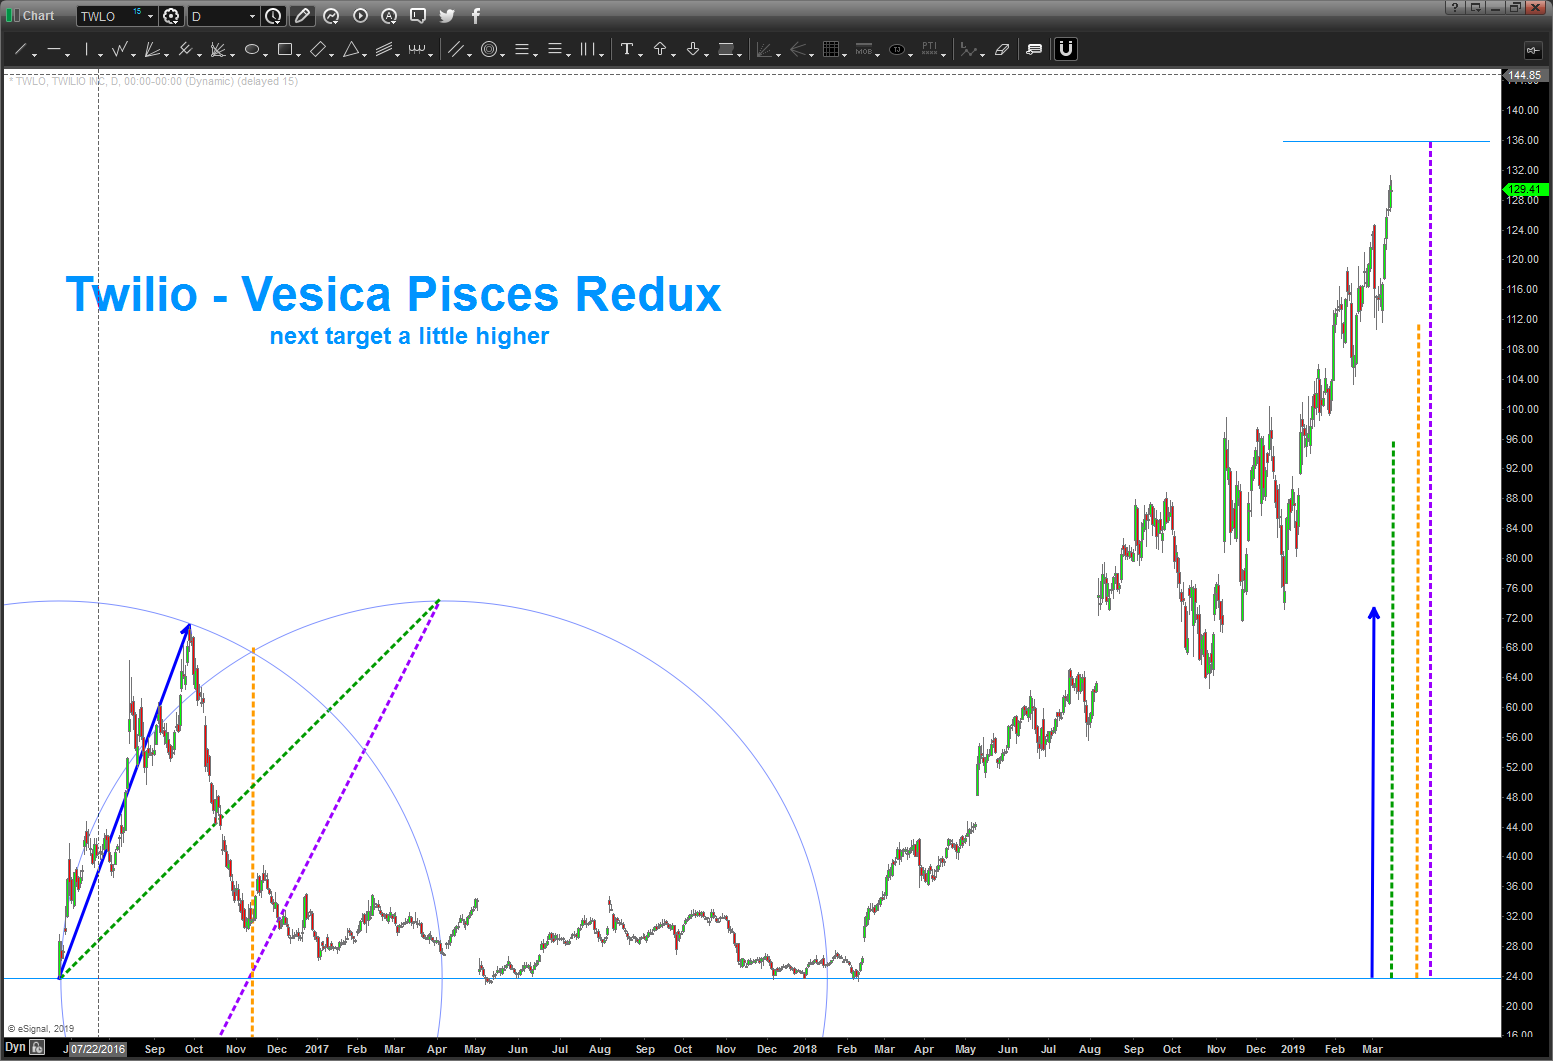
03/17/2018 – I was asked to do an update on $TWLO from a friend and noticed that it has continued to have amazing strength during the sell off a little while ago and during this rally. I also remember doing this intial $TWLO post and thinking, I should show readers/myself the length of the dashed purple price projection .. honestly, I was just too lazy.
Anyway, I went back today and redid the VP and wanted to show the scaling was completely different this time BUT the vectors still came out ‘pretty much’ around the same length …it’s fractal baby. that’s all I can say .. so, I pretty much wanted to show that scaling is ALWAYS an issue but if you do some of the work and the chart shows you it’s respecting’ish the work by support and resistance then go w/ it .. NEVER use the VP as a stand alone technique (I certainly don’t) but use it as affirmation that yes, the market does in fact vibrate and these vectors prove it. at least they do for me …
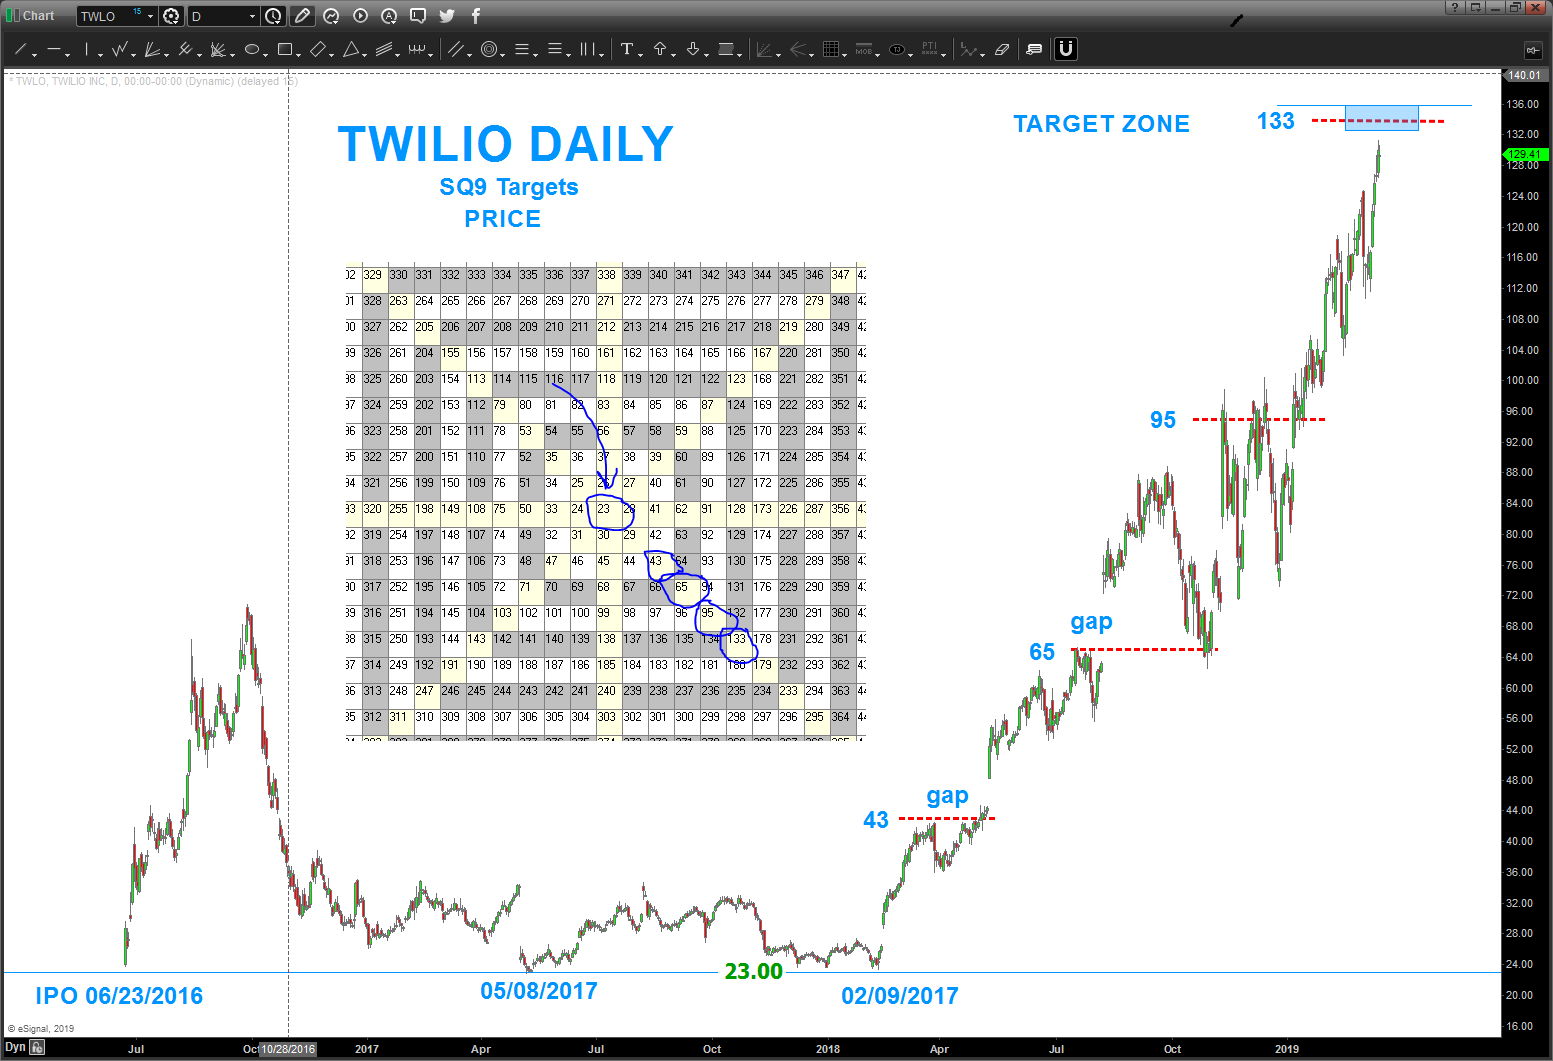
so, anyway, now you can see the purple vector and then I did some square of nine price and time work (just calendar days), did some patterns (3 drive to a top) and then, yes, (shoot me) I threw a little planet stuff in there looking for similarities in the IPO date and last Friday/Monday … find it interesting as we are approaching the Vernal Equinox, new moon/super moon we have a lot of ‘other’ stuff converging on Twilio ($TWLO)
as always, let me know if you have any questions. I would watch for a weekly SRC to potentially protect profits on this one .. mind you, it has, in the past, gapped up over these targets also. all probability.
Bart
____________________________________________________________________________________________________________________________________________________________
My dear friend Larry from http://www.tradingtutor.com.com sent this over so I just fooled around w/ the Bladder of the Fish. The 3 drives looks nice AND the time and price of our vectors sure seems to point at resistance ahead!
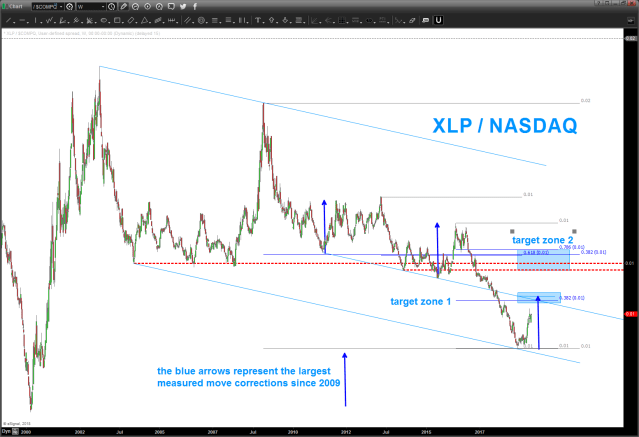
the XLP / NASDAQ ratio complete a BUY pattern …updated 05/19/2019
Posted on January 15, 2019 Leave a Comment
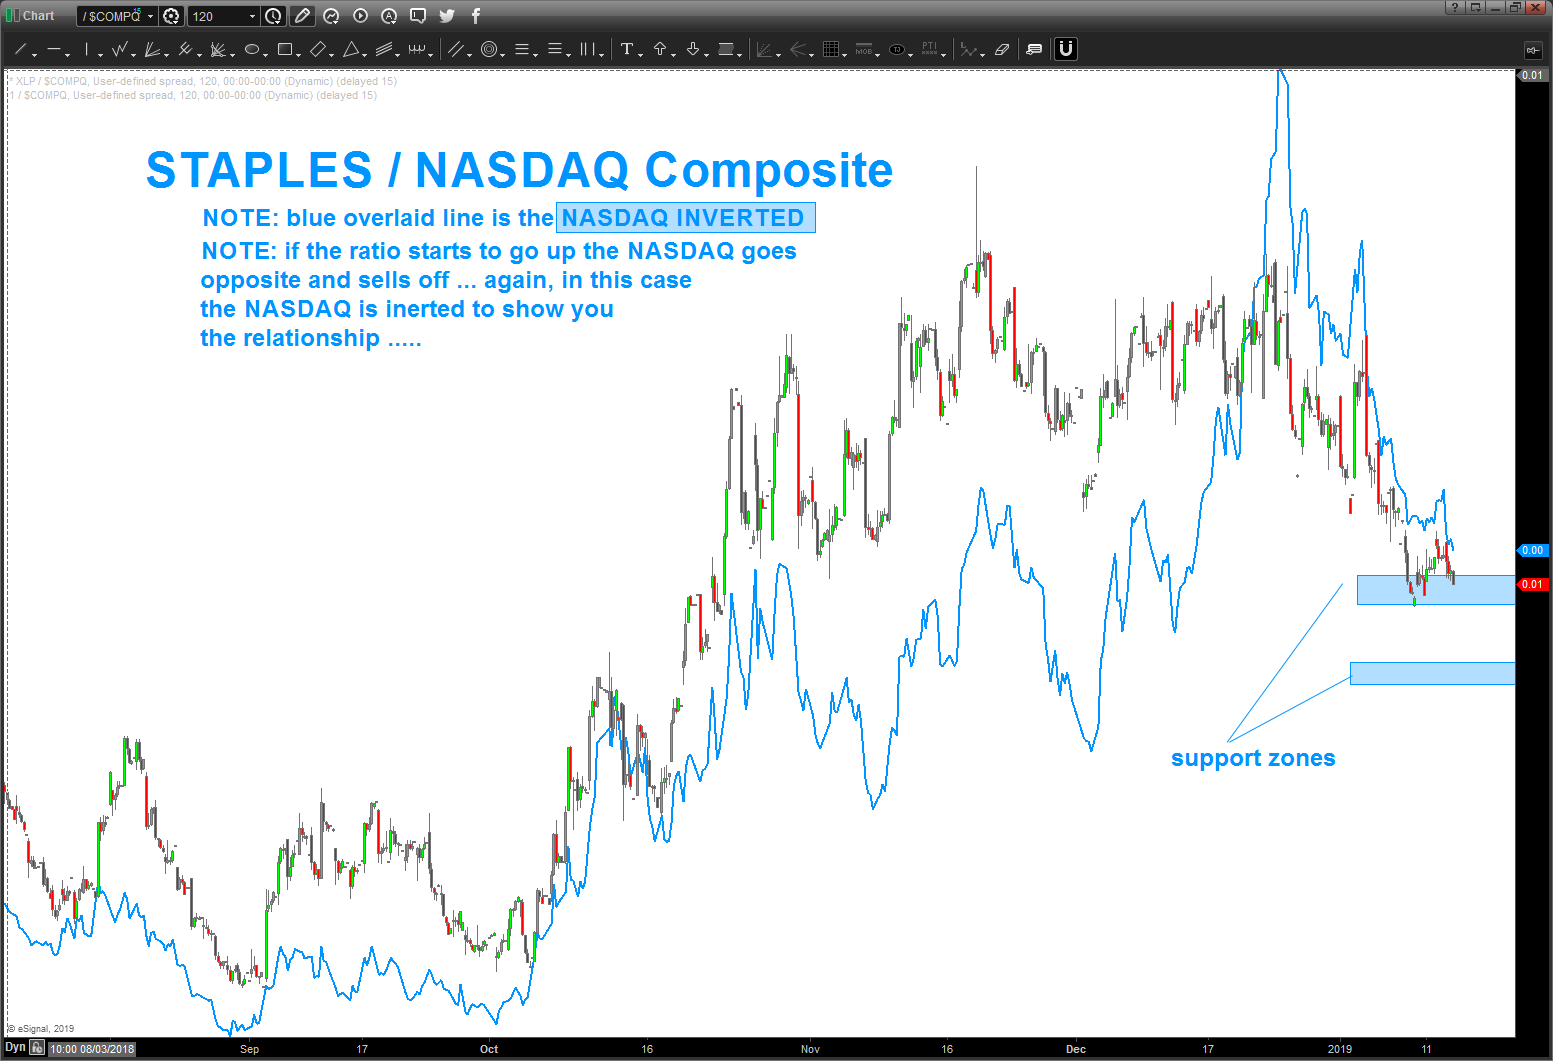
05/19/2019 as you can see below, the buy zone was defeated by just a bit but, ultimately, it proved to be good support and the ratio is going UP which shows a risk off mindset w/ regards to the institutions. keep an eye on this ratio as it’s very important and can give us a heads up w/ regard to the overall health of the market.
I put the MONTHLY chart in there to show the much bigger pattern that completed at the lows.
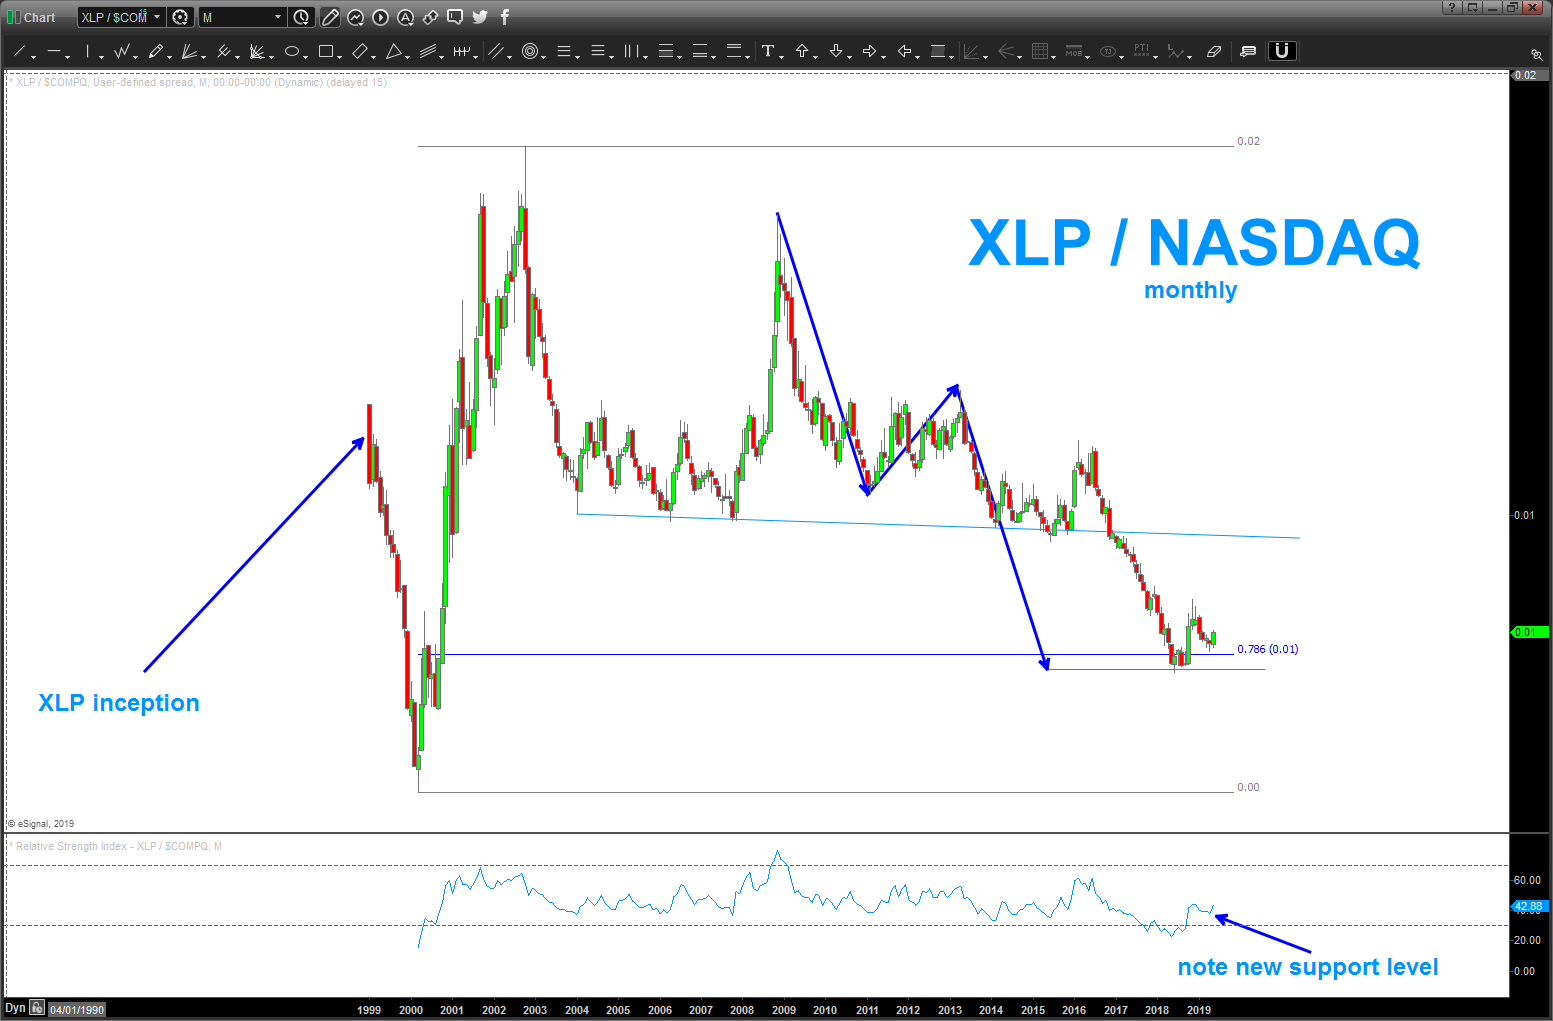
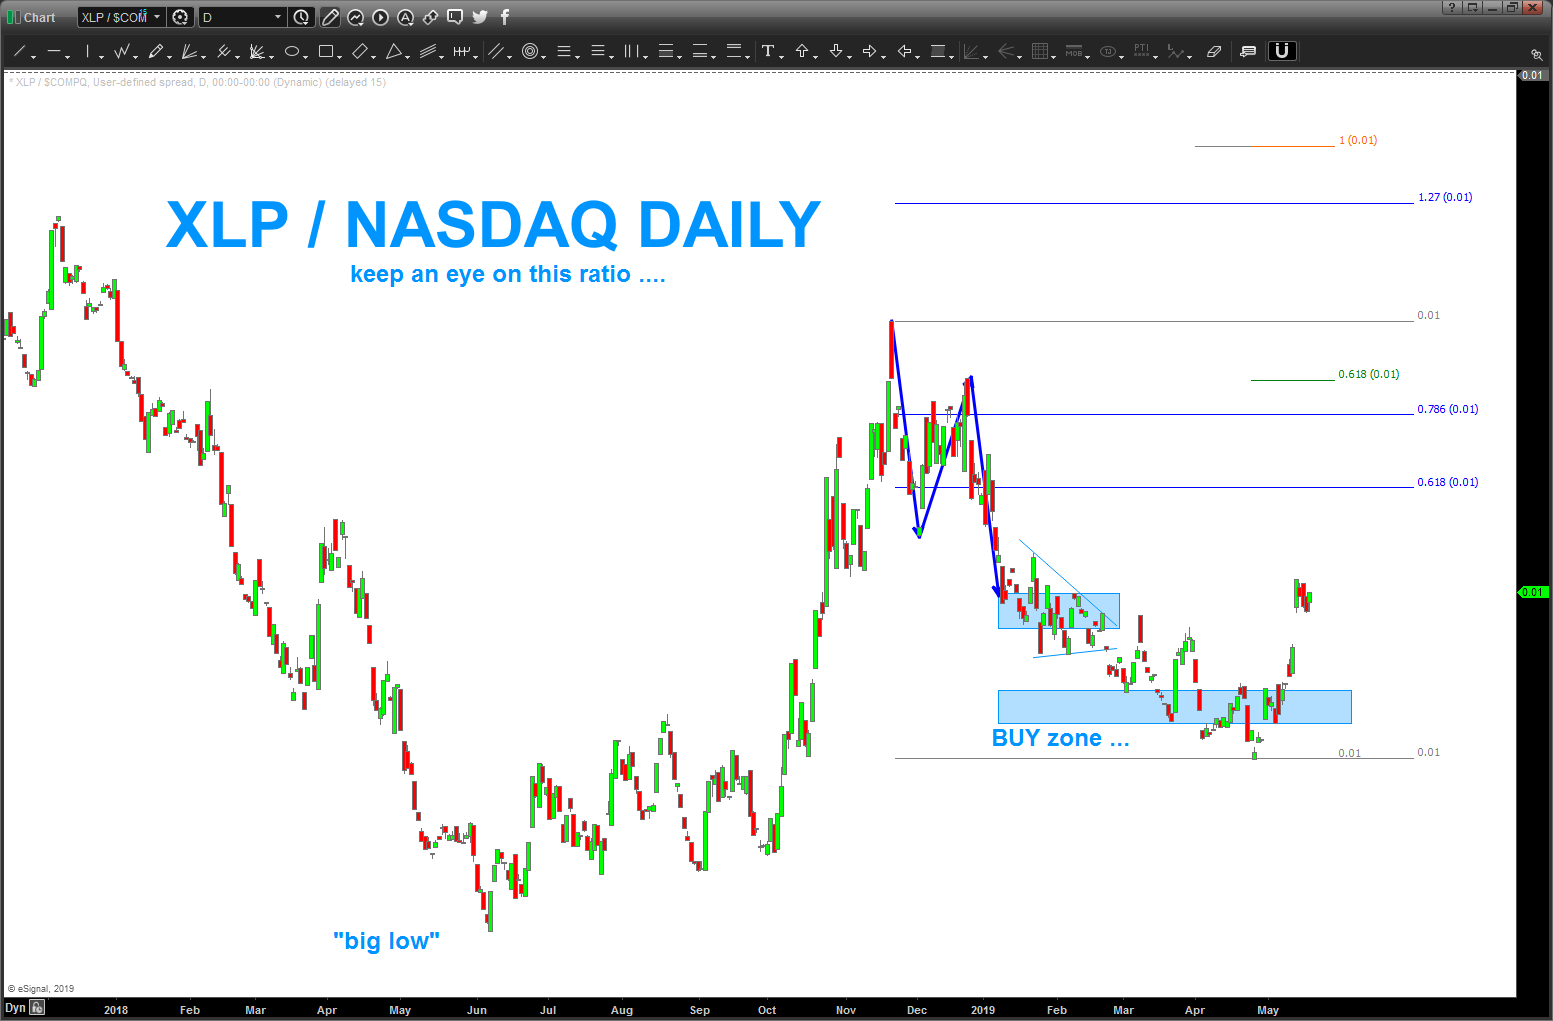
02/28/2019 update: well, the target area shown in the original post was shown and held, somewhat. as the bouncing around started to happen from January 22, 2019 till Feb 21, 2019 it certainly created a nice triangle from the classic EWT. a-b-c-d-e and a resumption of the downtrend. We have rallied a little bit after the breakdown from the triangle (they usually occur in 4th waves – a guideline NOT a rule) so we have either finished or have one more sequence lower to finish – what I believe to be a zig-zag like correction.
if this analysis is correct, then we will bottom NOW or a little lower and the ratio will start to rise.
what does that mean? it USUALLY means stocks will start to sell off.
we are at a key/crucial juncture ..charts below
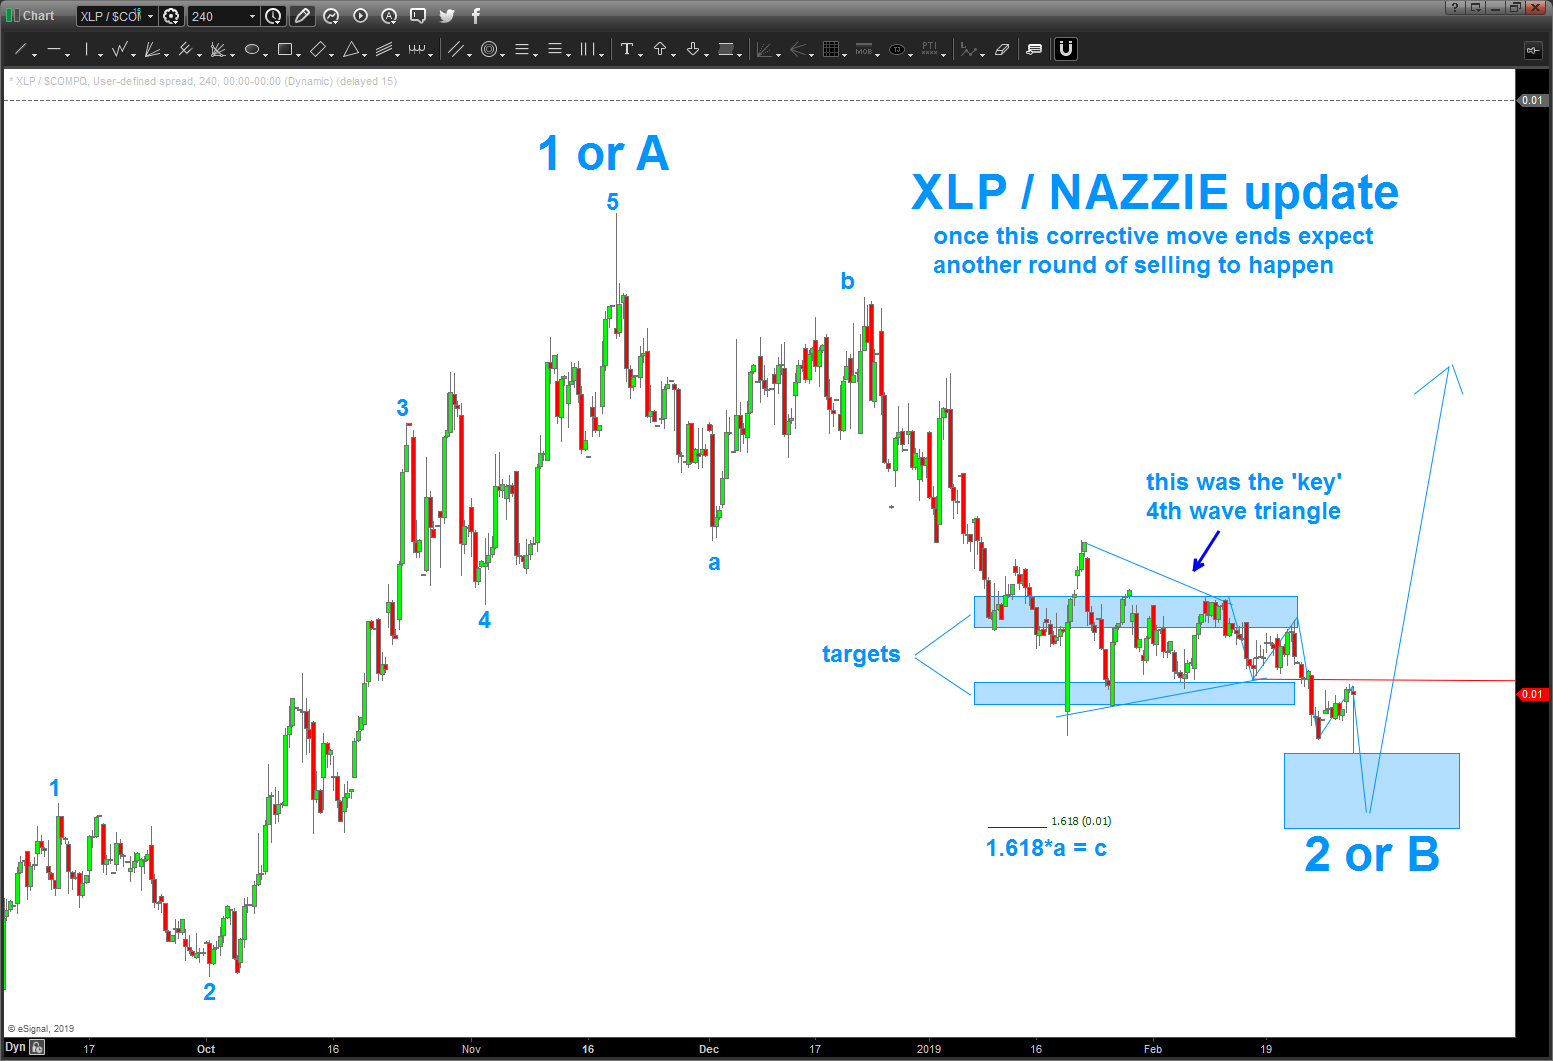
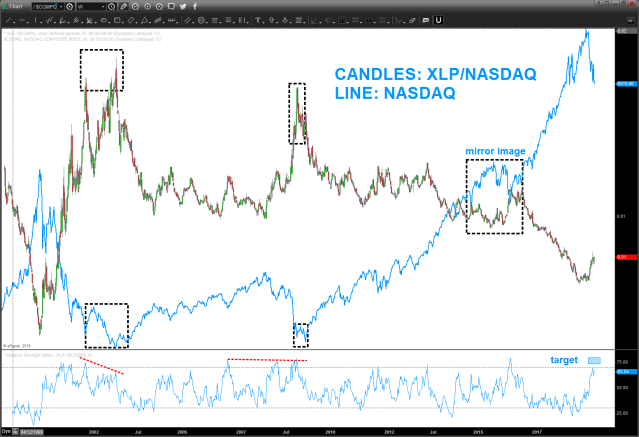
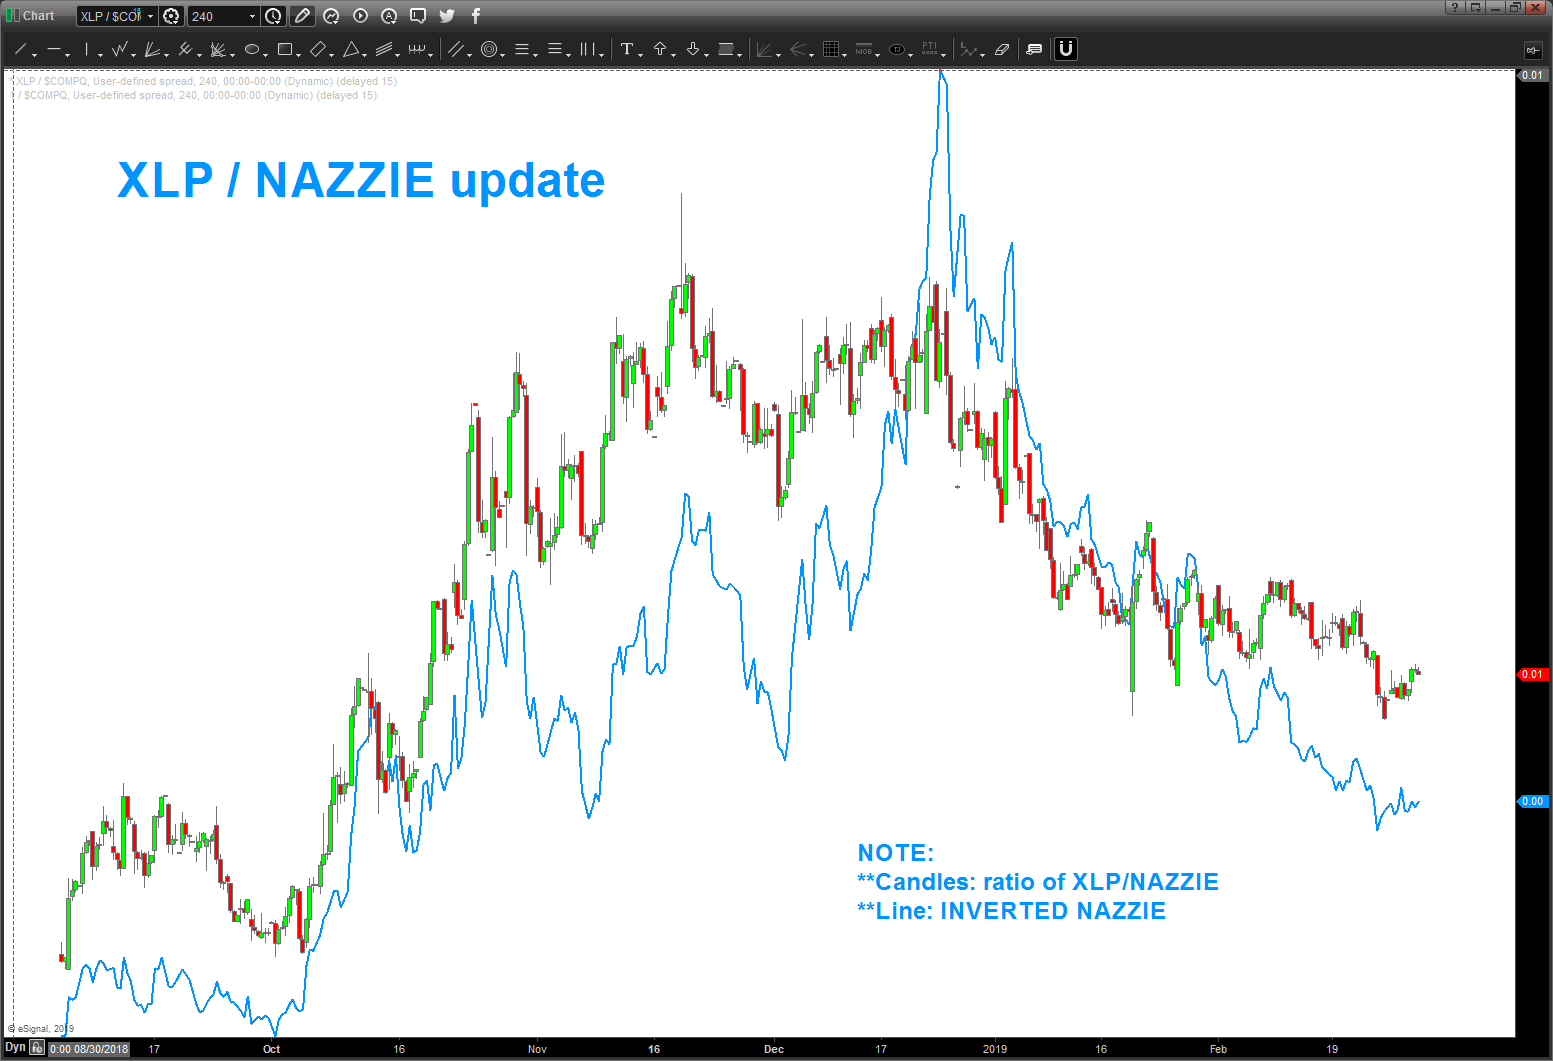
to show you the ‘power’ of this ratio, I’ve updated a 4 hour intraday chart of the xlp/nazzie ratio (candles) and the nazzie INVERTED (blue line) to show the synchronicity and how well they shake and jive together. note: every inflection point is timed almost exactly. THAT IS WHY THIS RATIO IS SO KEY and HELPS WITH RISK CONTROL
____________________________________________________________________________________________________________________________________________________________
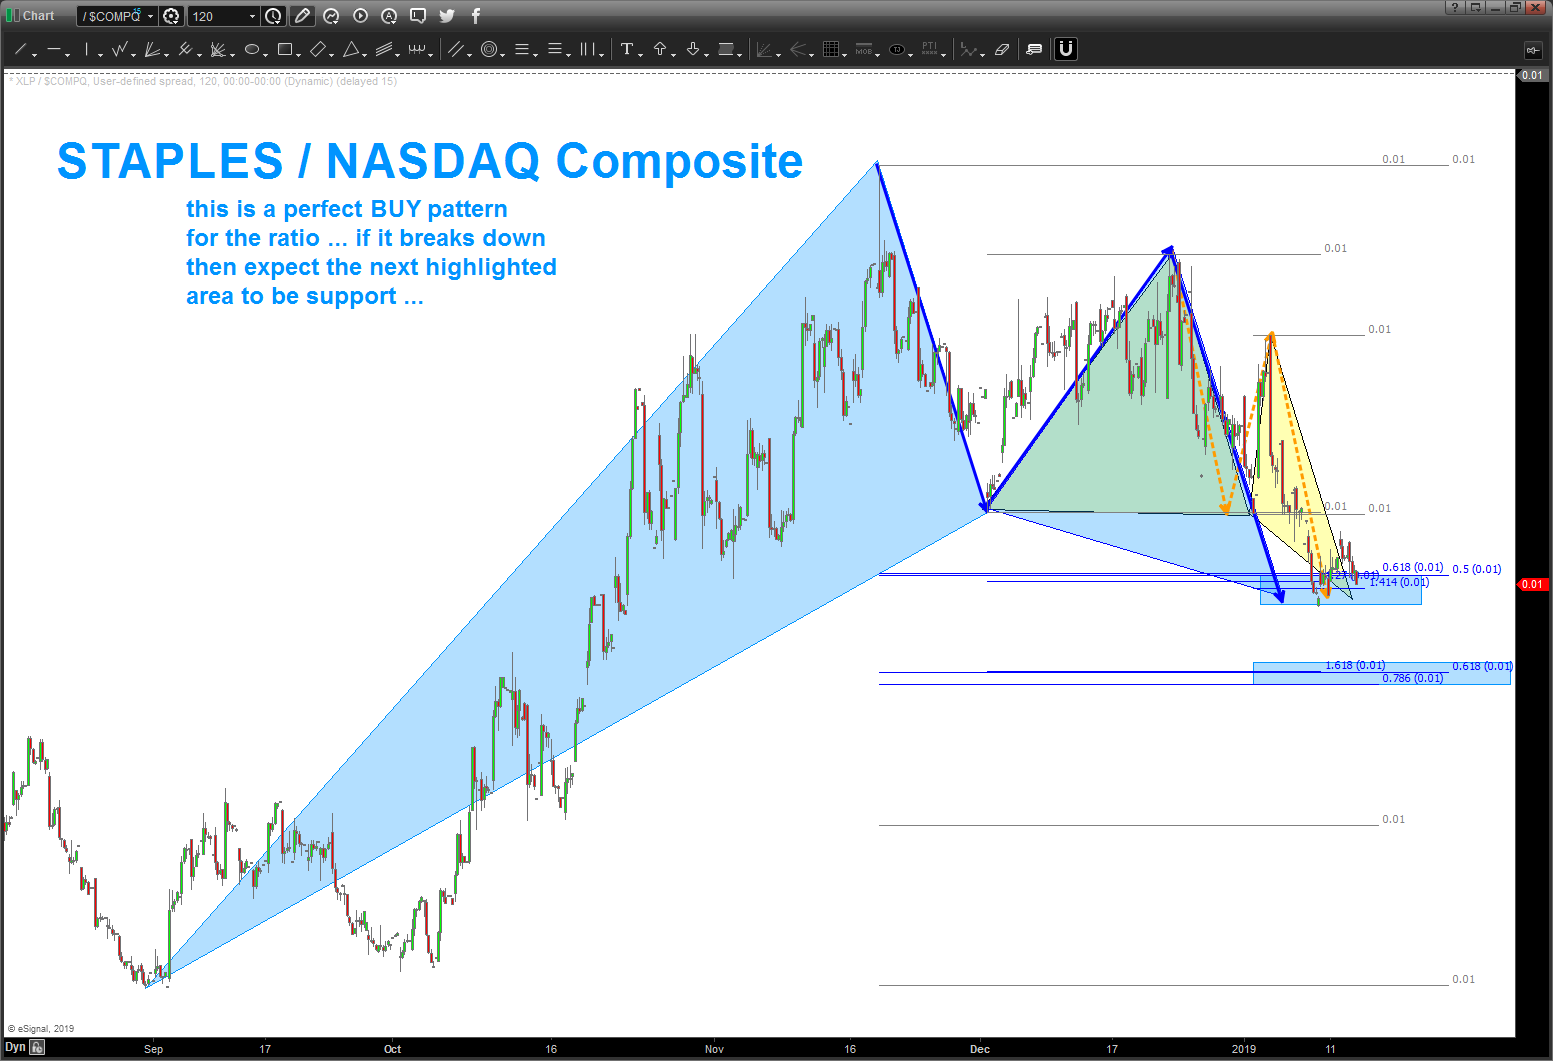
if you have been following me for a while you will know that I really trust PATTERNS and also ratio’s w/ the patterns.
in this case, we have a near PERFECT BUY pattern on our XLP/NASDAQ ratio. Which means, the Staples (a source of risk off for the institutions) ‘should’ start outperforming the NASDAQ from a relative strength basis which ‘should’ cause the NASDAQ to sell off .. IF and ONLY IF the PATTERN works. As you can see below, we have two levels to watch (the one we are at right now) and then one a little bit lower …
my guess (as I NEVER know which pattern will or won’t work) is that the next sell off will occur ‘here’ or the other target a little lower. if we blow thru them w/ power and they fail then it might be game on again .. but let’s not get too hopeful yet. let’s see what our patterns do on the ratio first …
Bart


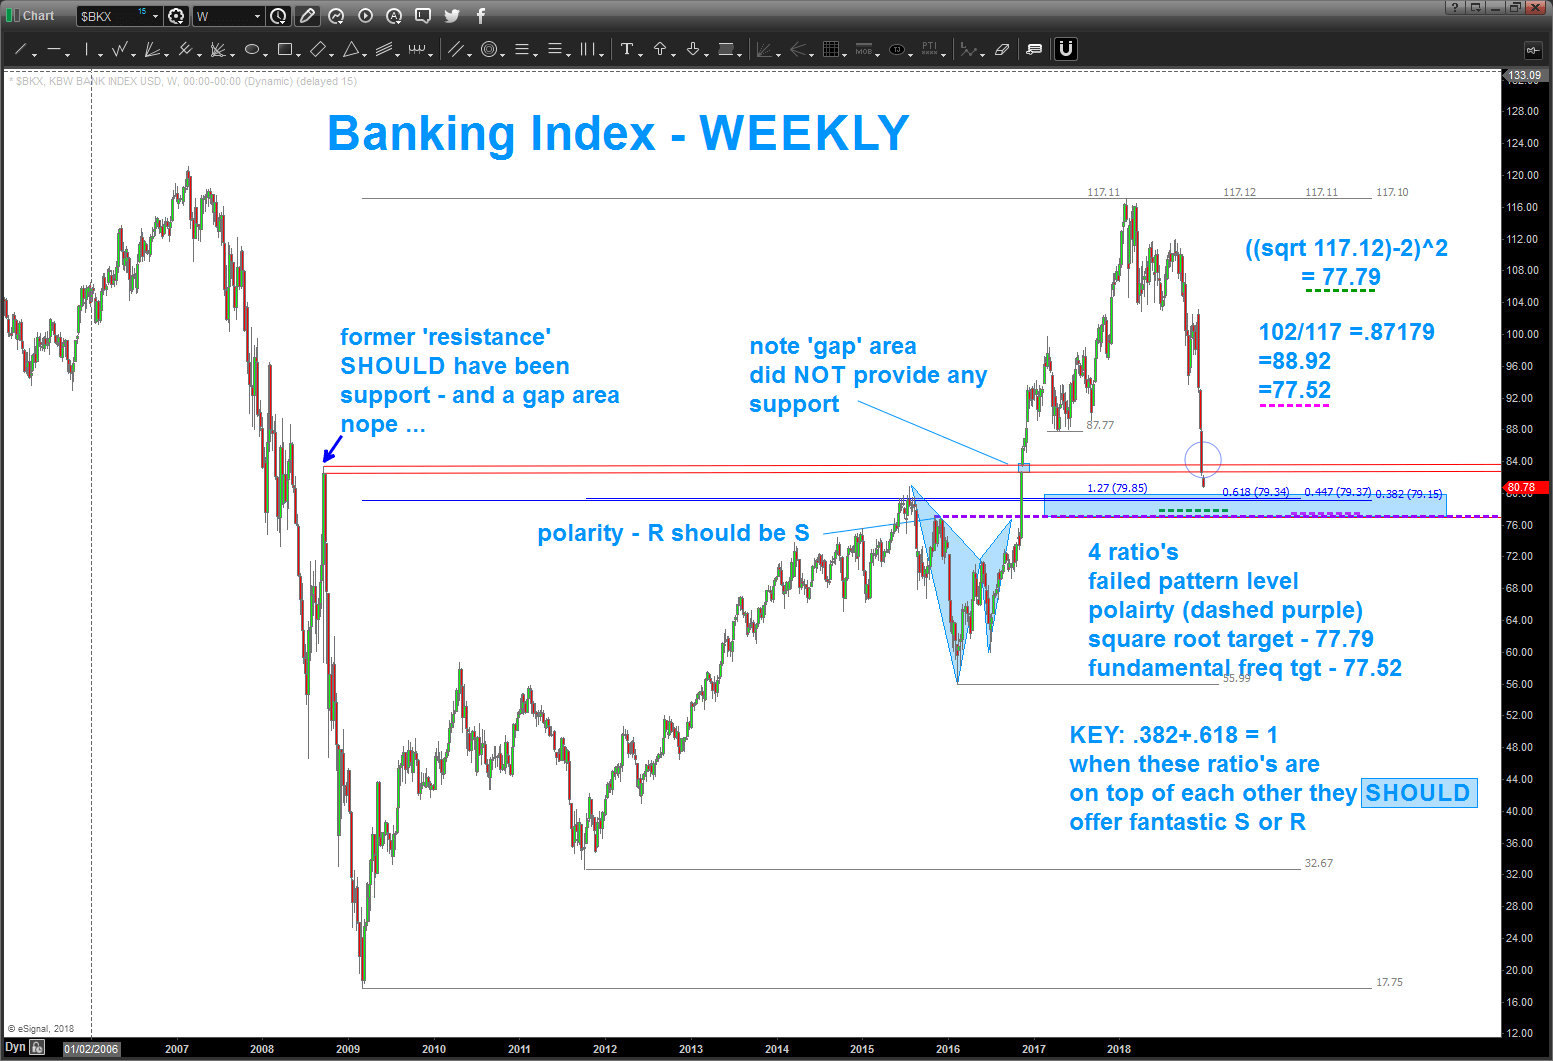
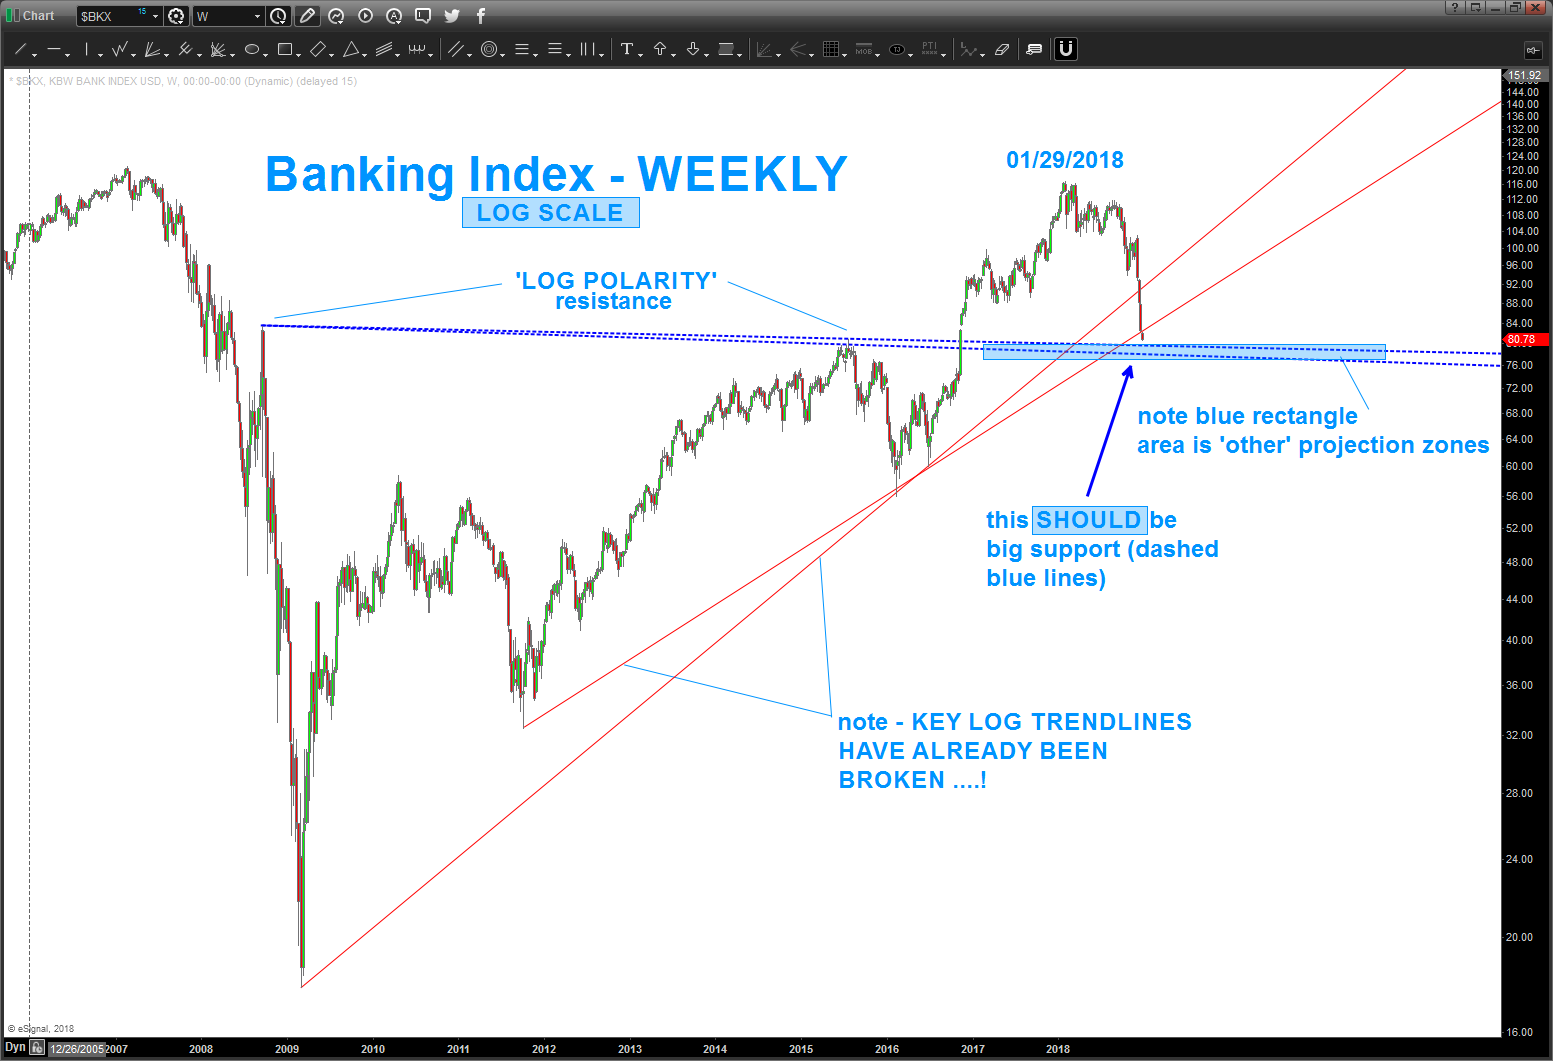
very important level on the Banks!
Posted on December 26, 2018 Leave a Comment
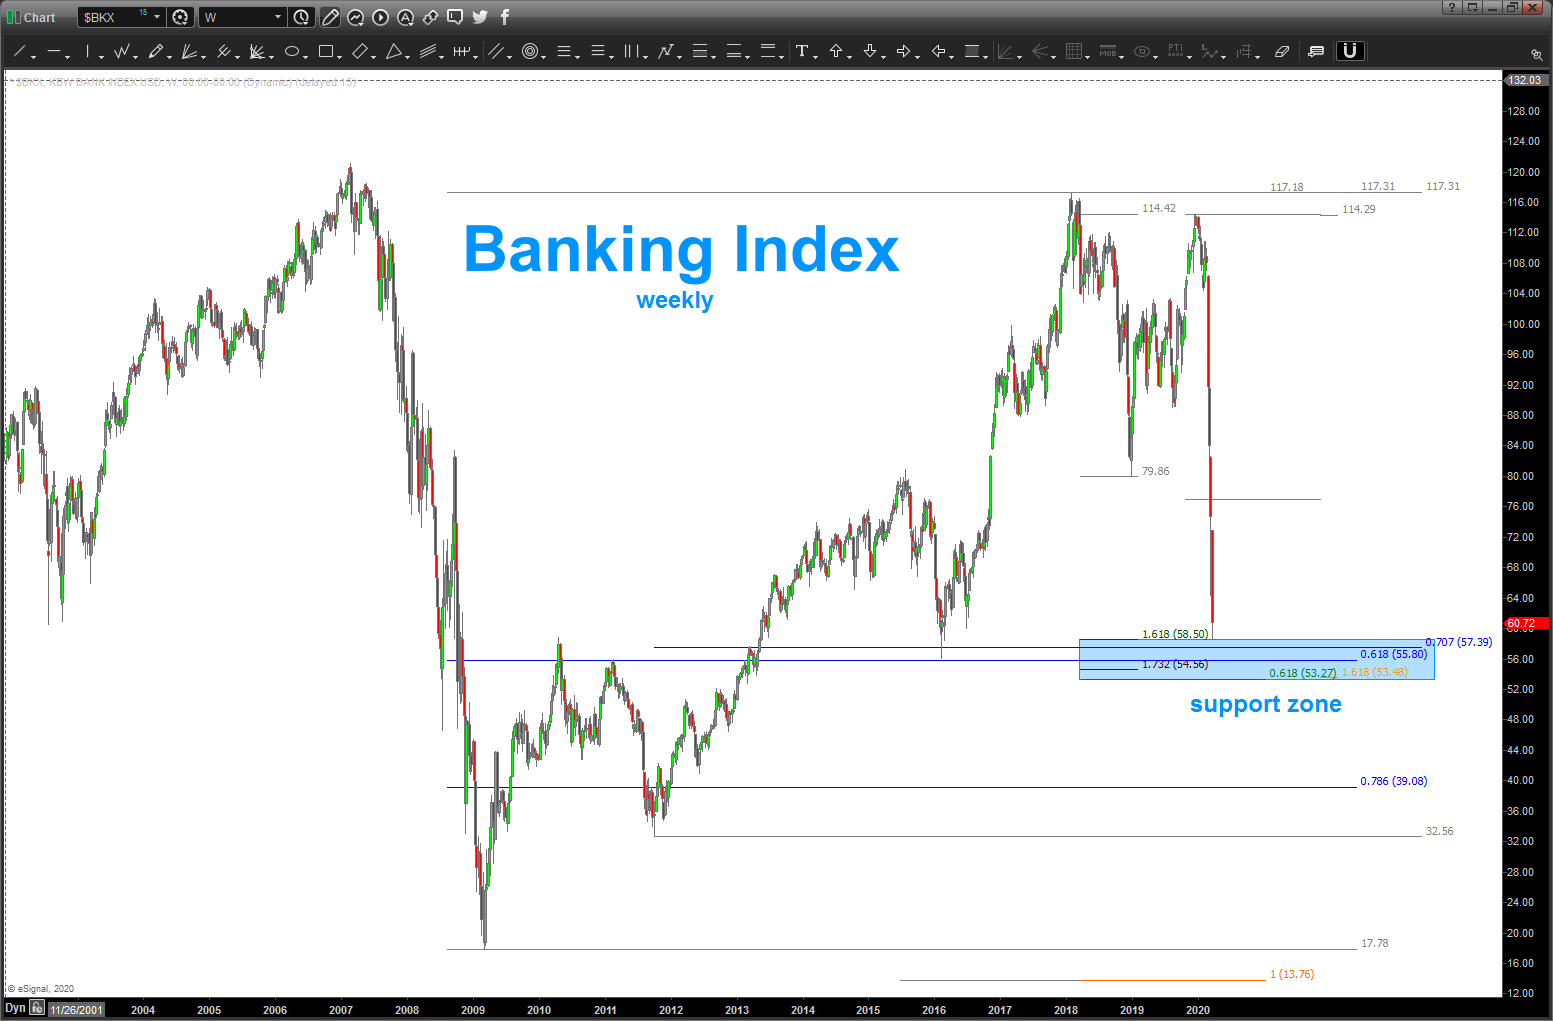
03/18/20 – last time I posed on the banks you can see this level held and then rallied nicely. it never made a new high. now, take a peak below as we can see a nice support zone that has appeared around 53-57. the 1.618 extension is the low of the day today. the ‘low’ might be in …banks lead us up and lead us down. I see this as a ‘bounce’ but one that is needed …
———————————————————
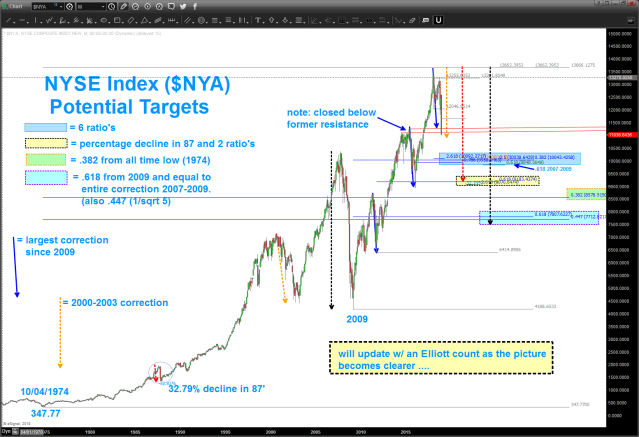
NYSE Index Targets
Posted on December 22, 2018 Leave a Comment
Well, the support level shown in my last post was defeated on Friday. We also closed ‘below’ old resistance so it looks like ‘polarity’ didn’t work here. All I’m trying to do is find the ‘bounce’ area as cycles suggest into end of January/early Feb.
So, here’s some targets on the NYSE Index that I’ll be targeting over the coming weeks ..
let me know if you have any questions.
Bart
PS – got out in the water today. The swells have been PUMPING of late in SoCal. Good clean living folks, good clean living.
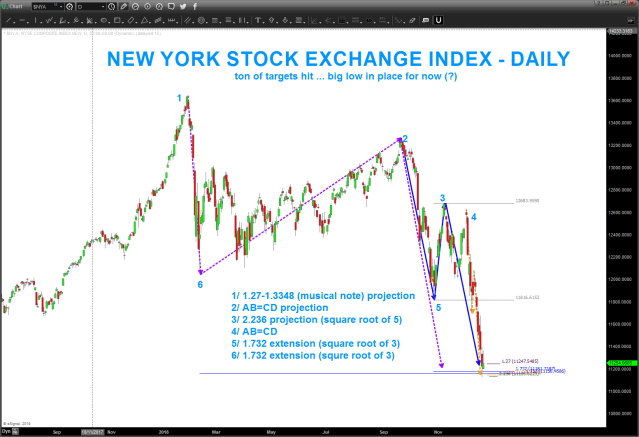
Big Support on NYSE Index
Posted on December 21, 2018 Leave a Comment
‘hope’ – a strategy – it holds for now.
NASDAQ – huge trend line support being attacked
Posted on December 16, 2018 Leave a Comment
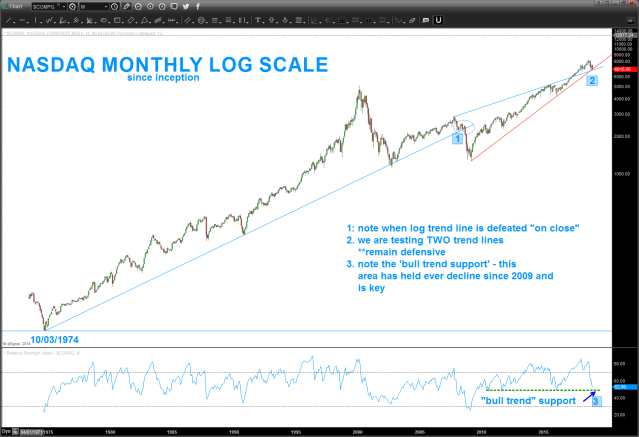
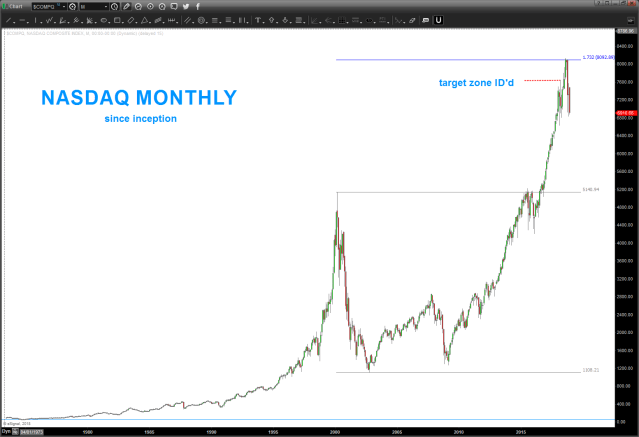
12/16/2018 – take note of the MONTHLY LOG scale on the NASDAQ Composite. I’ve outlined 3 critical areas to monitor on the chart. Also, you’ll see in the second chart that back last March we ID’d the 7600 ish area as the target zone. The market went another, roughly 5% and then ran into another extension ratio. The square root of 3 or 1.732. It did a 173.2 percent extension from 2000-2002. My bust as this fit nicely into an AB=CD projection that was tracking right along w/ the QQQ. And, I know most everyone was unable to hear back in March someone advising caution … no big deal. Anyway, some pretty big support from our LOG trendlines are coming in … it certainly looks ‘heavy’ and as you can see from my previous blog about the XLP/NASDAQ it looks like it has some more room to go … the breaking of these LOG trend lines (on a weekly basis – wait for the end of the week) will signal some heavy selling pressure to come in …
WATCH THE RATIO’s
Posted on December 16, 2018 Leave a Comment
12/16/2018 – as shown before, the ratio of XLP (Staples) / NASDAQ and the PATTERN that completed gave us fair warning of this correction we find ourselves in .. is it the beginning of the ‘next’ bear market. I have no idea. Is it just the ‘buy the dip’ – I have no idea. I guess if you have 50 years you don’t care but if you have 2 weeks you might. It’s all relative folks but we do want to find what the best entry/exit points are as we look to manage risk. that’s all I’m trying to do …
the big institutions have a risk on or a risk off mindset. we hear it all the time. ratio’s allow you to try and get a best guess of where they are … in this case the STAPLES / NASDAQ has helped – a ton.
so, where are we now?
KEY: note the blue arrows. those are the extreme moves up in ‘risk off’ for the institution and then, as shown, the ratio stalls and then the band plays on … believe it or not, we haven’t reached that extreme yet so I simply expect the correction to continue until the ‘target zone 1’ is reached. If your a bull then this seems a logical place to stick your toe int he water else watch and wait for a MONTHLY SIGNAL REVERSAL CANDLE. Else, we could go all the way up to Target Zone 2.