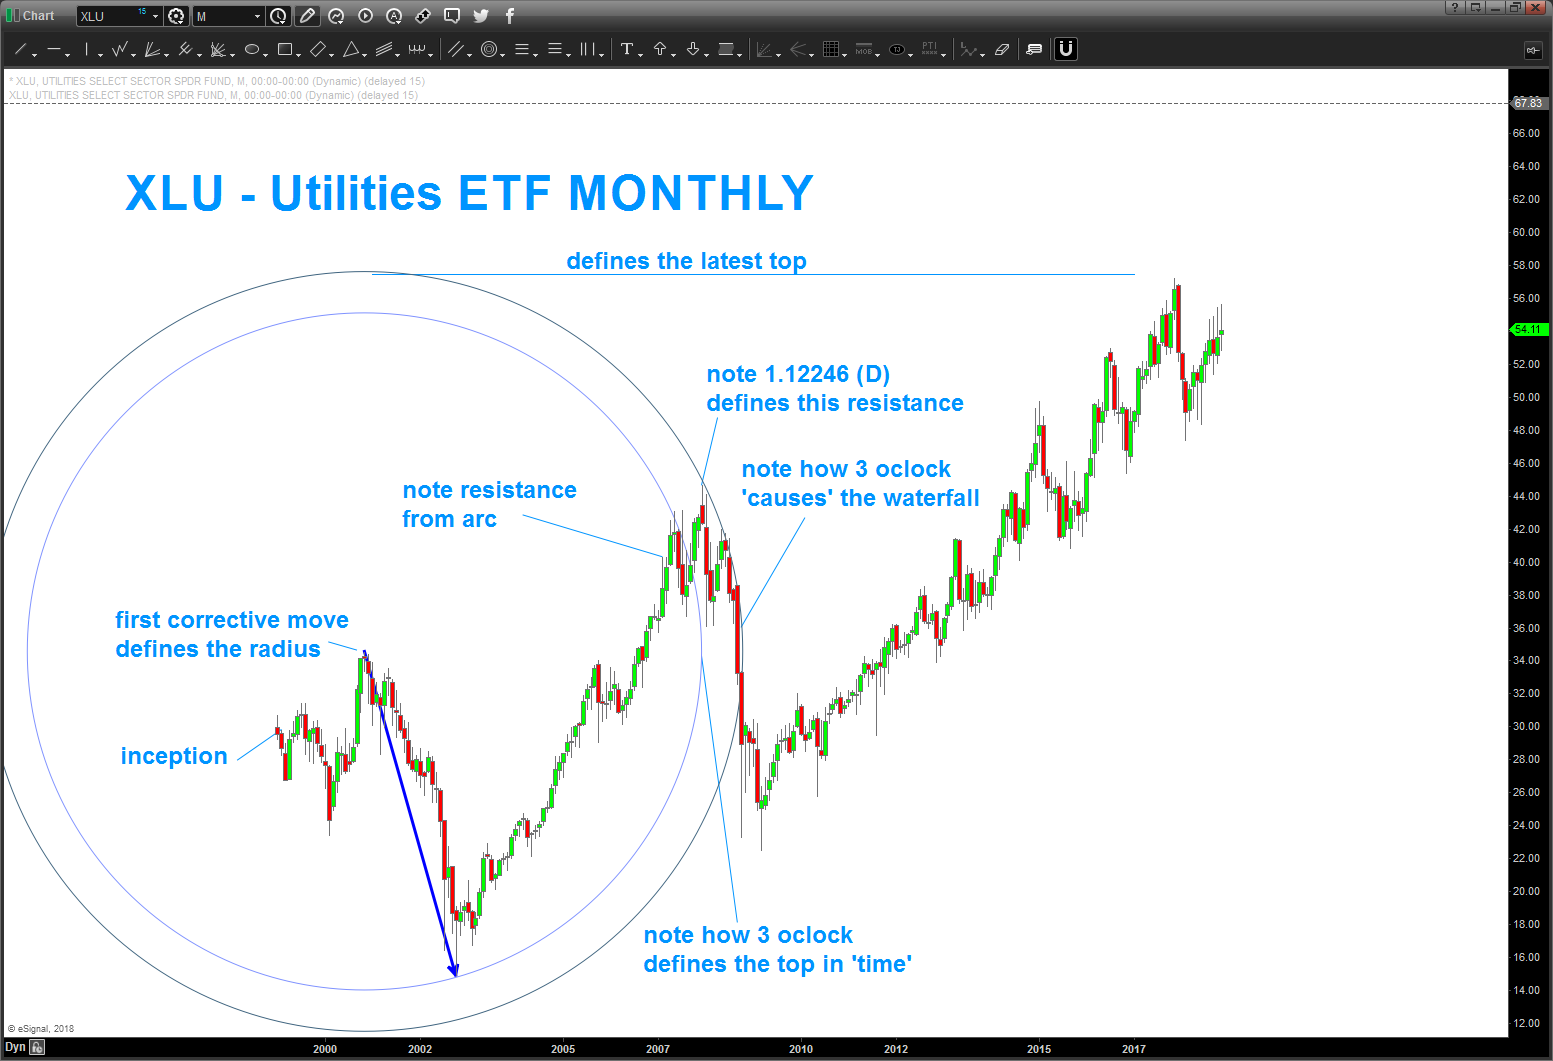
Utilities – holding up pretty nicely
Posted on November 25, 2018 Leave a Comment
11/25/2018 – you can see some of the former work on the Dow Jones Utility Index here: https://atomic-temporary-44460632.wpcomstaging.com/2018/01/02/i-still-think-this-is-a-big-deal-utilities-an-update-and-another-update/
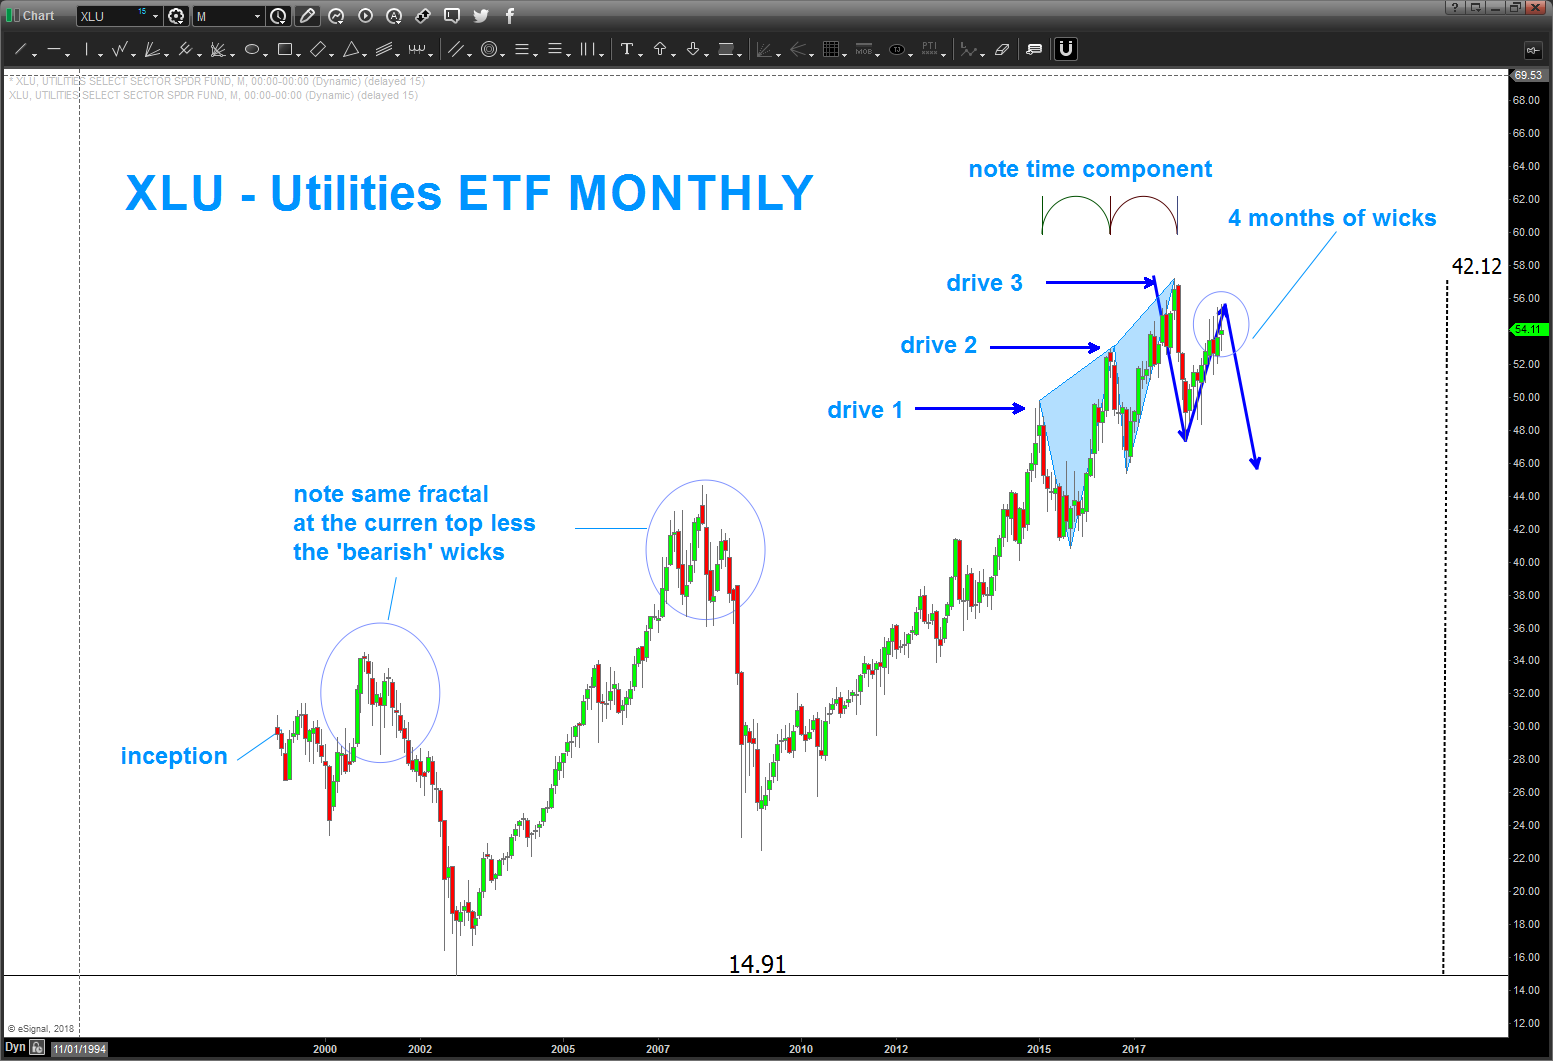
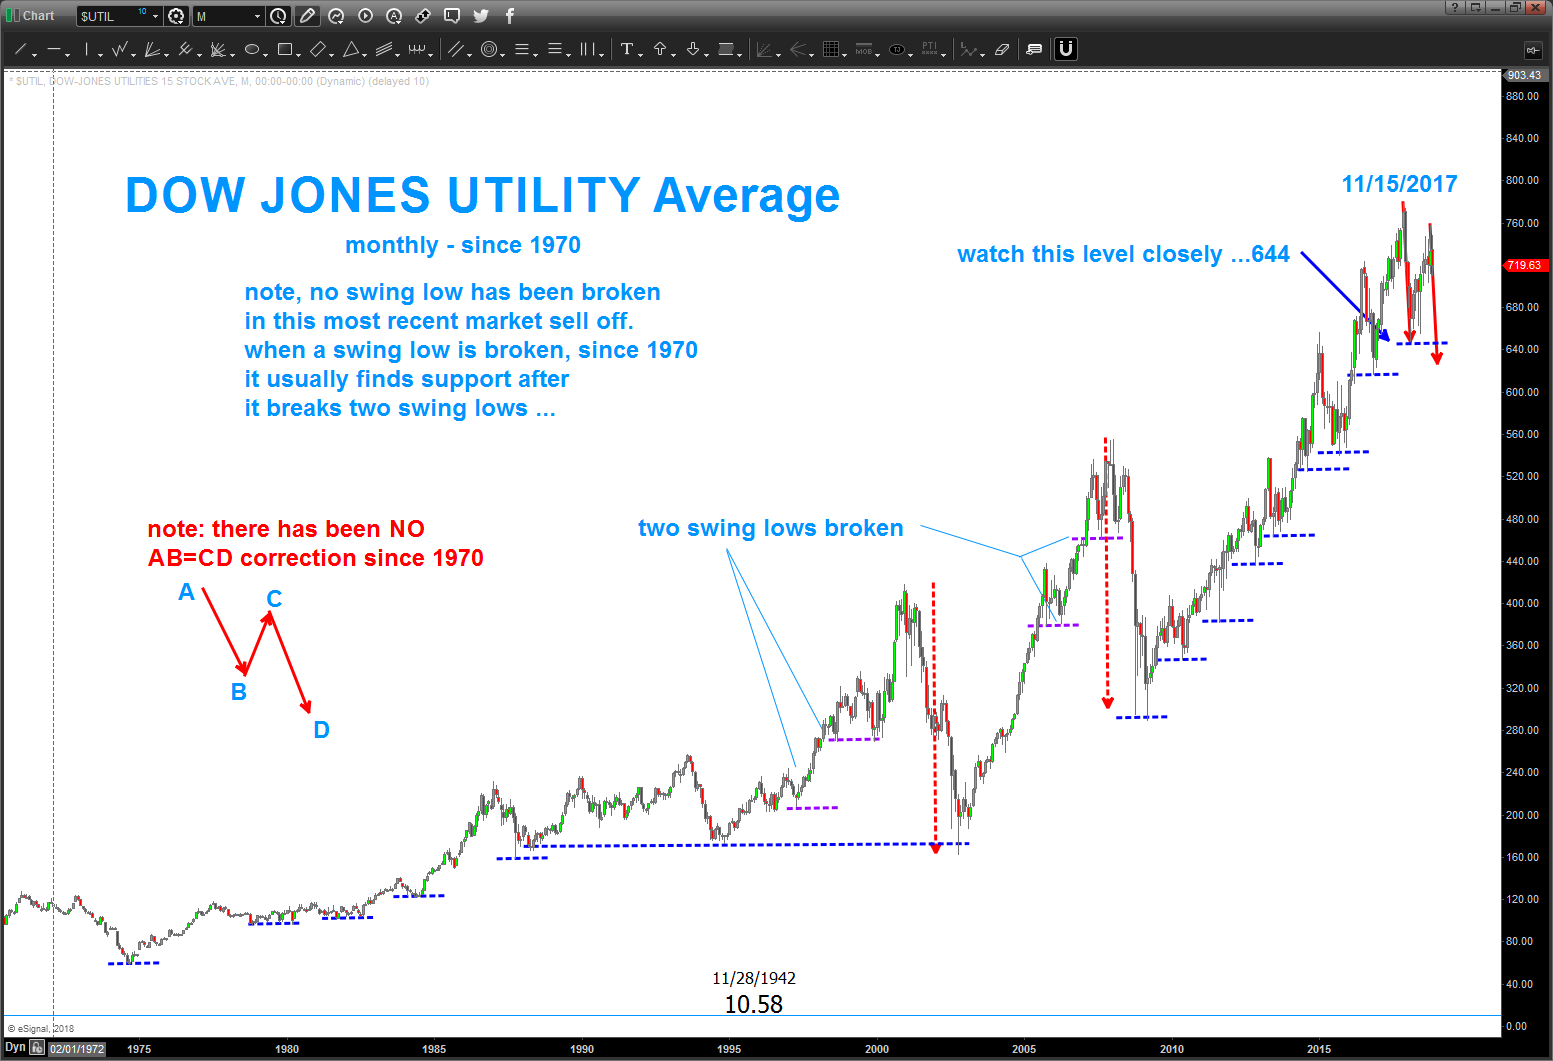
as you can see, the index went right up into the target area and fell pretty nicely. that being said, it has held up rather nicely and just recently went up and tagged a nice retracement level. probability is that it should start back down .. but, there’s the deal, look at the stair steps (higher lows) on the index and as I looked at this monthly chart I noticed – there has never been an AB-CD type corrective move. so, we are setting up for the first one in roughly 40 years. IF, the big if, we get down as shown by the red arrows on the current price chart THEN we’ll have to give it a shot and buy it ..
it will be the first one in 40+ years.
stay tuned. this strength is interesting …
hope all had a wonderful weekend and great time w/ family and friends if celebrating Thanksgiving!
Bart
Update to BITCOIN (NYSE Index Bitcoin Index)
Posted on November 19, 2018 Leave a Comment
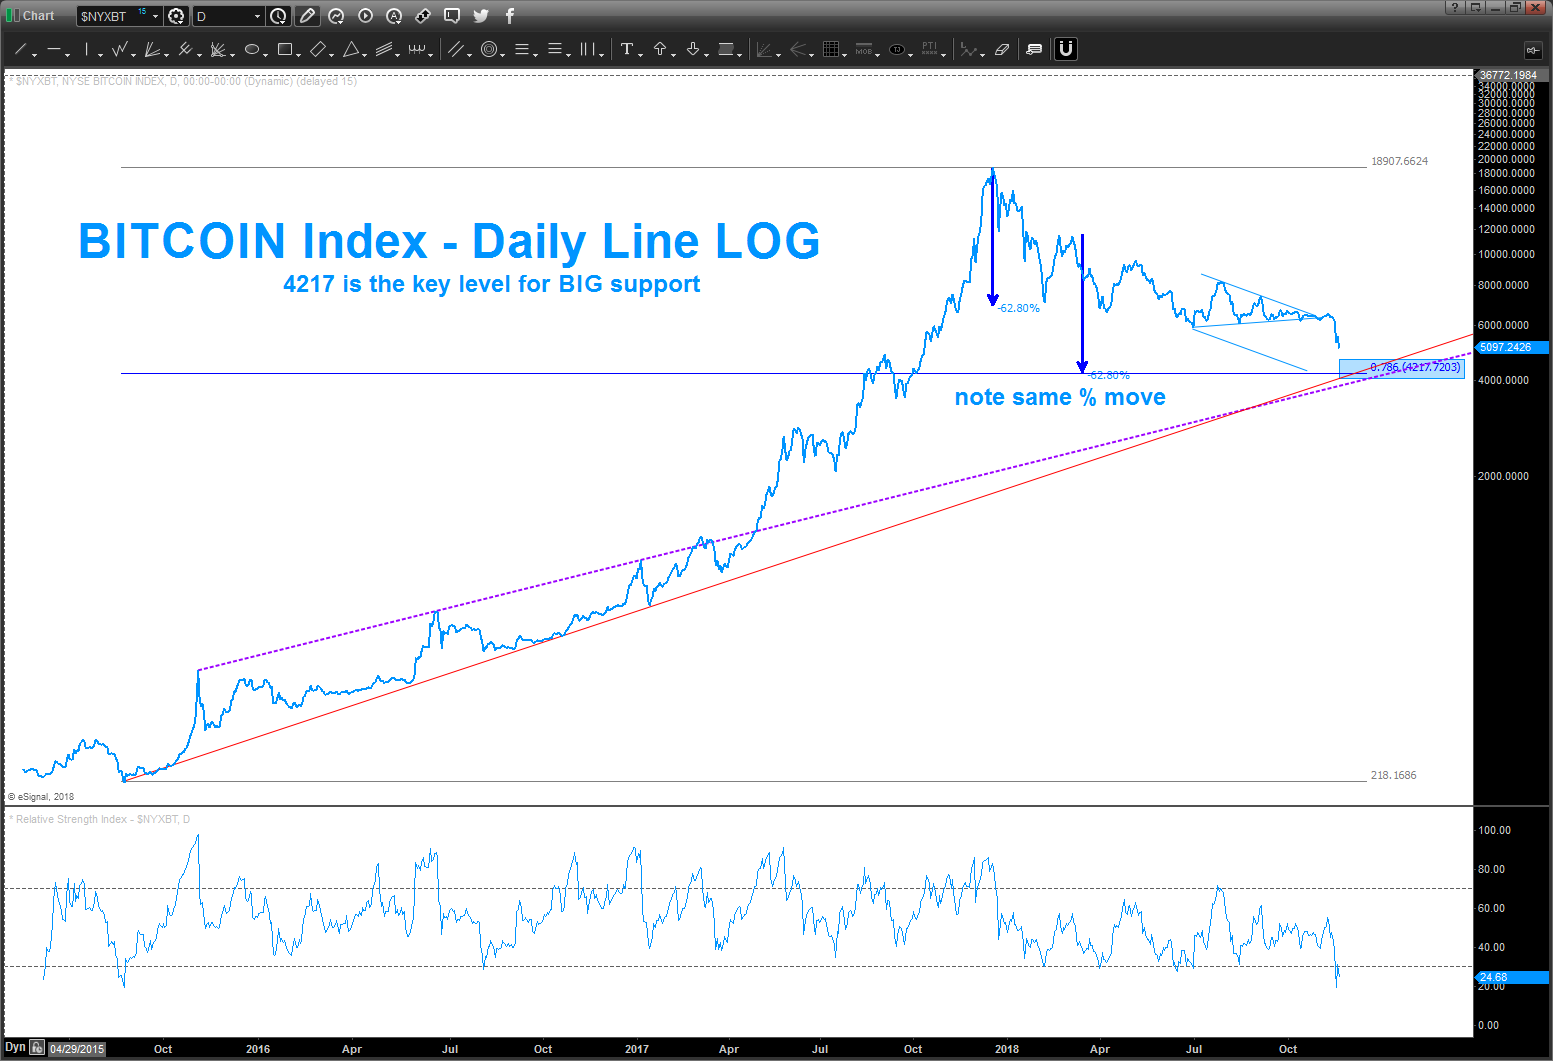
if you do a search you’ll find some interesting charts on the ‘parabolic’ rise of the BITCOIN Index. PARABOLIC RISES ALWAYS END LIKE THIS …period.
what’s important to realize is we are balancing the energy of euphoria (a sell signal) w/ depression/capitulation (a buy signal) … so what’s important now. note the triangle is broke down from (it’s supposed to do that) and now we have some projections via percent change and some trendlines (LOG- which are key) and the vaunted .786 retracement. why not give that BUY shot … I’m going to be looking at that …
B
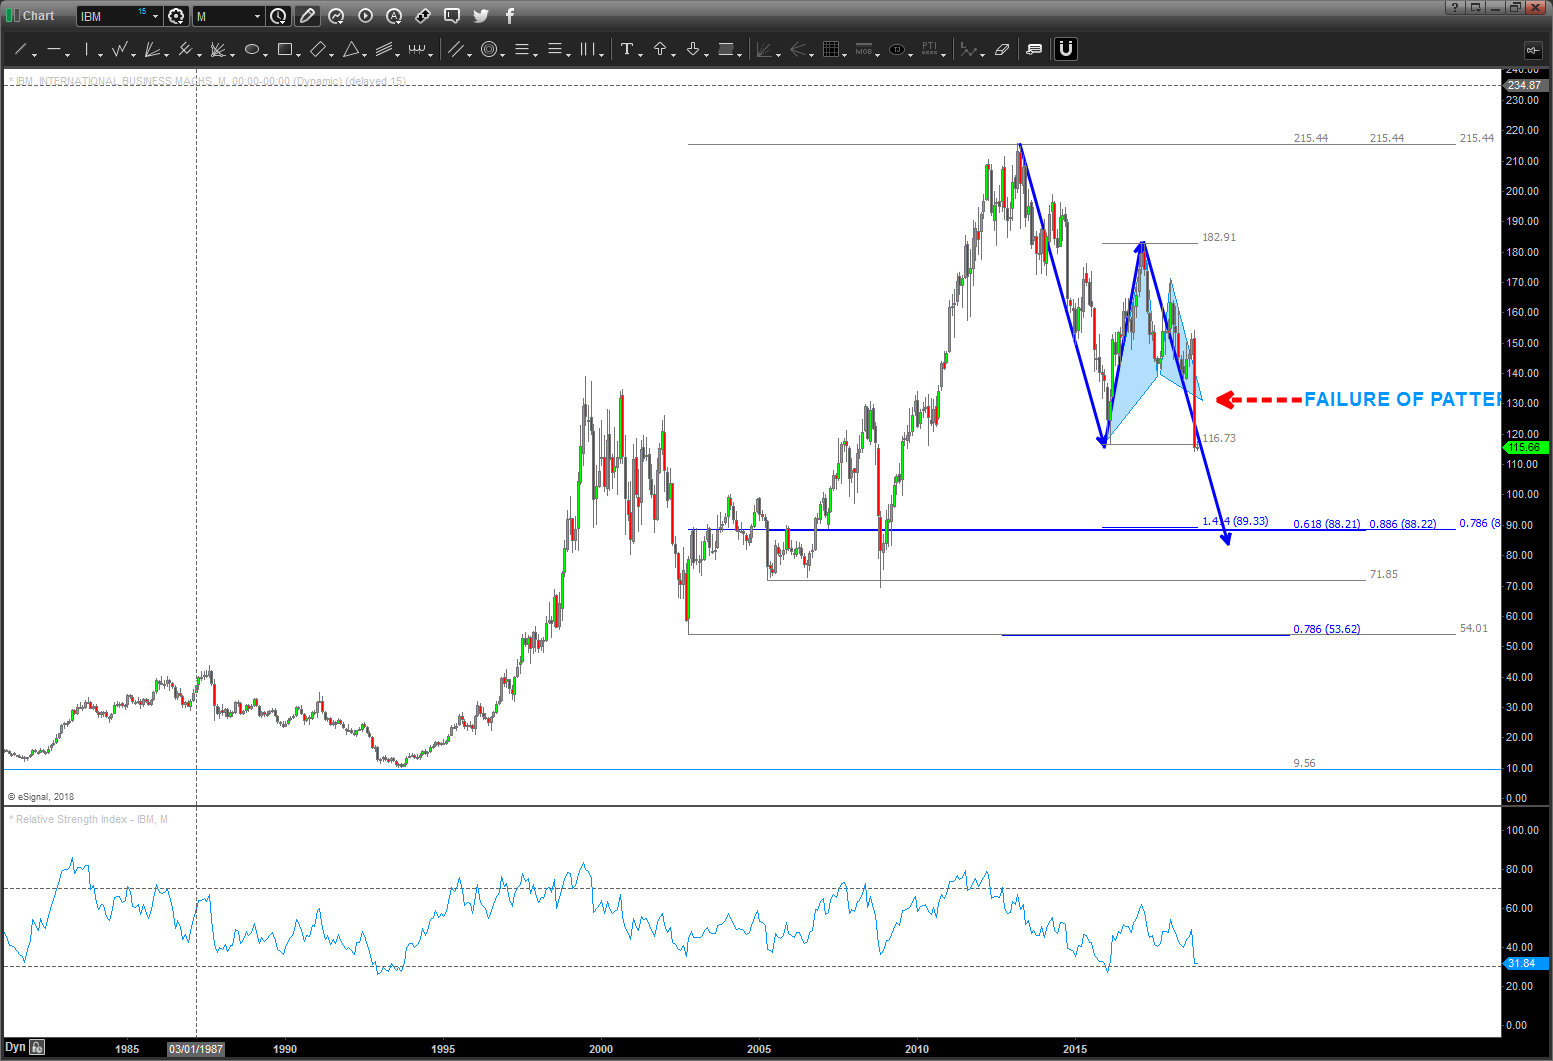
IBM – failure and a new set up
Posted on November 3, 2018 Leave a Comment
11/03/2018 – well our IBM pattern failed and got smoked. As I’ve shown before, the candle on IBM is what a ‘failed pattern’ looks like … so, as you can see below we have another BUY pattern emerging on IBM. It’s got some ‘time’ and ‘price’ to go but I’ll be watching the level shown below as MAJOR support for IBM.
Remember, this is pattern recognition. It’s all probability folks. We NEVER know which one will work or not but we ALWAYS no how much we are wiling to risk and WHERE WE ARE WRONG. In this crazy game, especially in the current volatile market we find ourselves in isn’t that the name of the game …?
Here’s the chart … next.
Bart
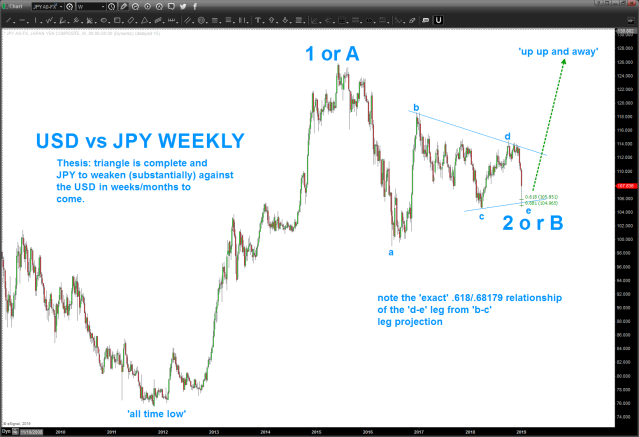
YEN vs USD …certainly smells like a multi year triangle …
Posted on November 1, 2018 Leave a Comment
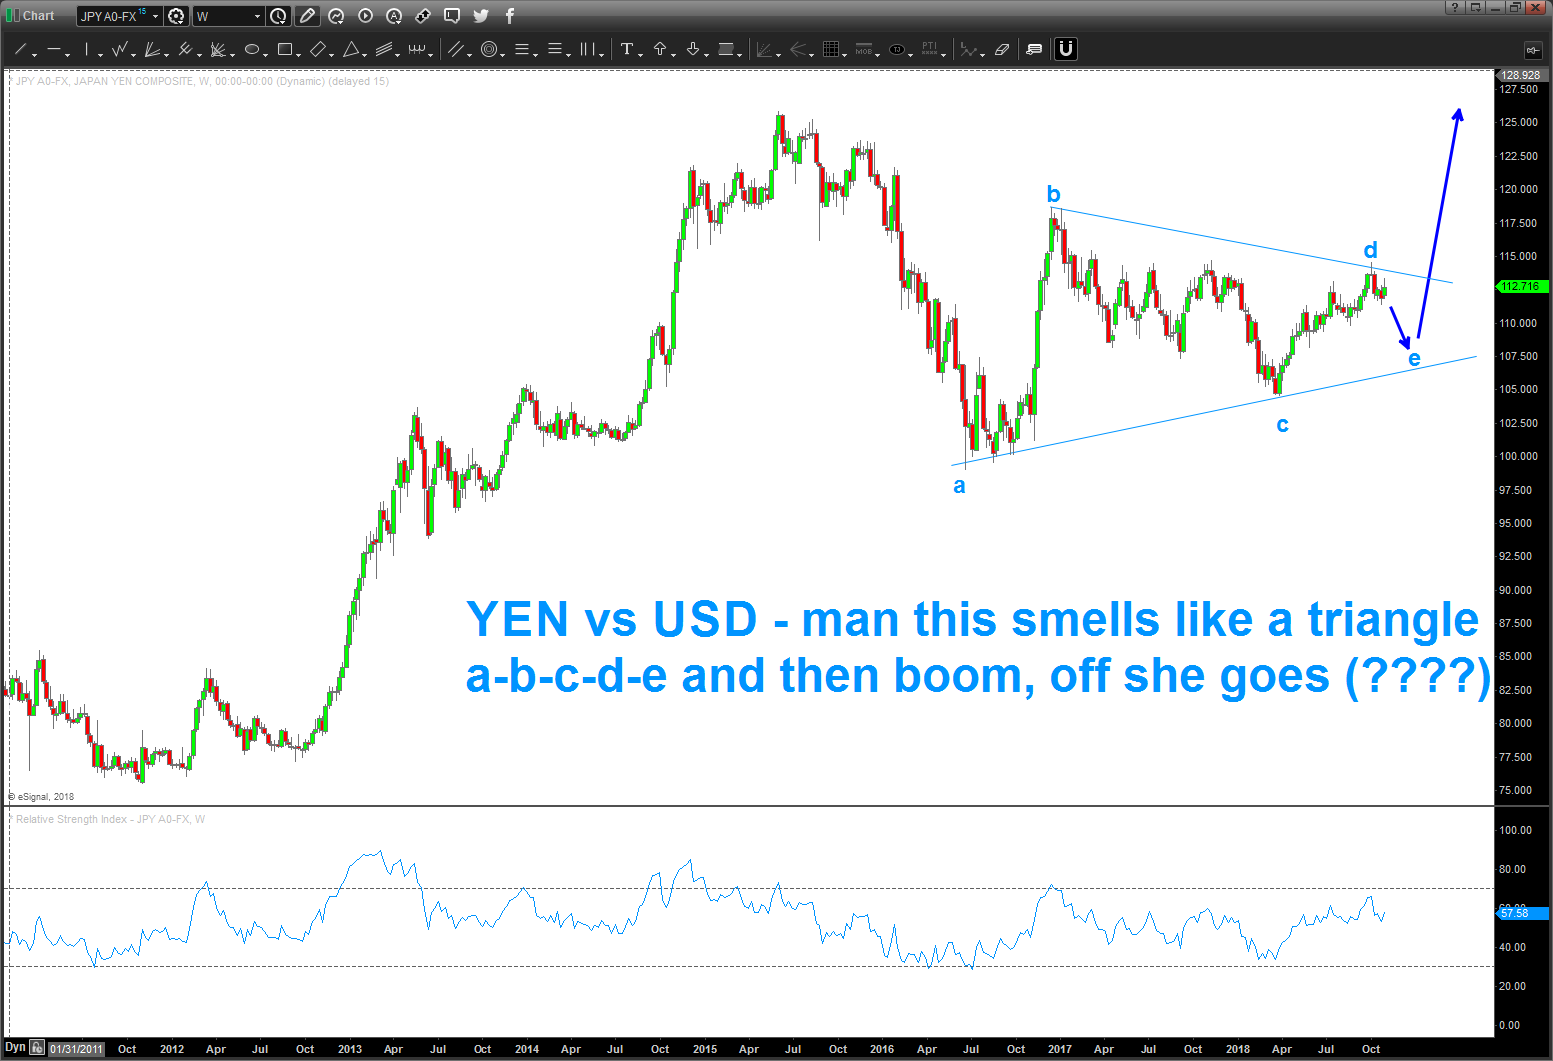
well, when we last posted, we were looking for the YEN to complete a multi year triangle. holy smokes, it certainly dumped today. the key here, as you will see below, is that it did ‘exactly’ what its supposed to do … in a triangle you look for price correlations that are .618 the preceding leg. in this case, we would look for the ‘d-e’ leg to be .618 (or .68179 (musical note)) of ‘b-c’. Guess what – that is EXACTLY what it did today. as you can see, we hit that relationship and the USD exploded against the YEN. So, IF (and this is a big if) our triangle thesis is the correct the YEN is about to get smoked. Now, mind you – the currency markets are HUGE. something around EVERY equity, commodity, futures and bond markets would have to run every day for 90 days to equal ONE day of liquidity in the FX markets. READ THAT AGAIN. The yards (billions and perhaps of trillions) of moves that were occurring was MASSIVE. Yet, the .618 (.68179) relationship held. so, because of that monstrous thrust into the ‘e’ we need to wait for a retest or a BUY pattern to emerge …unreal folks.
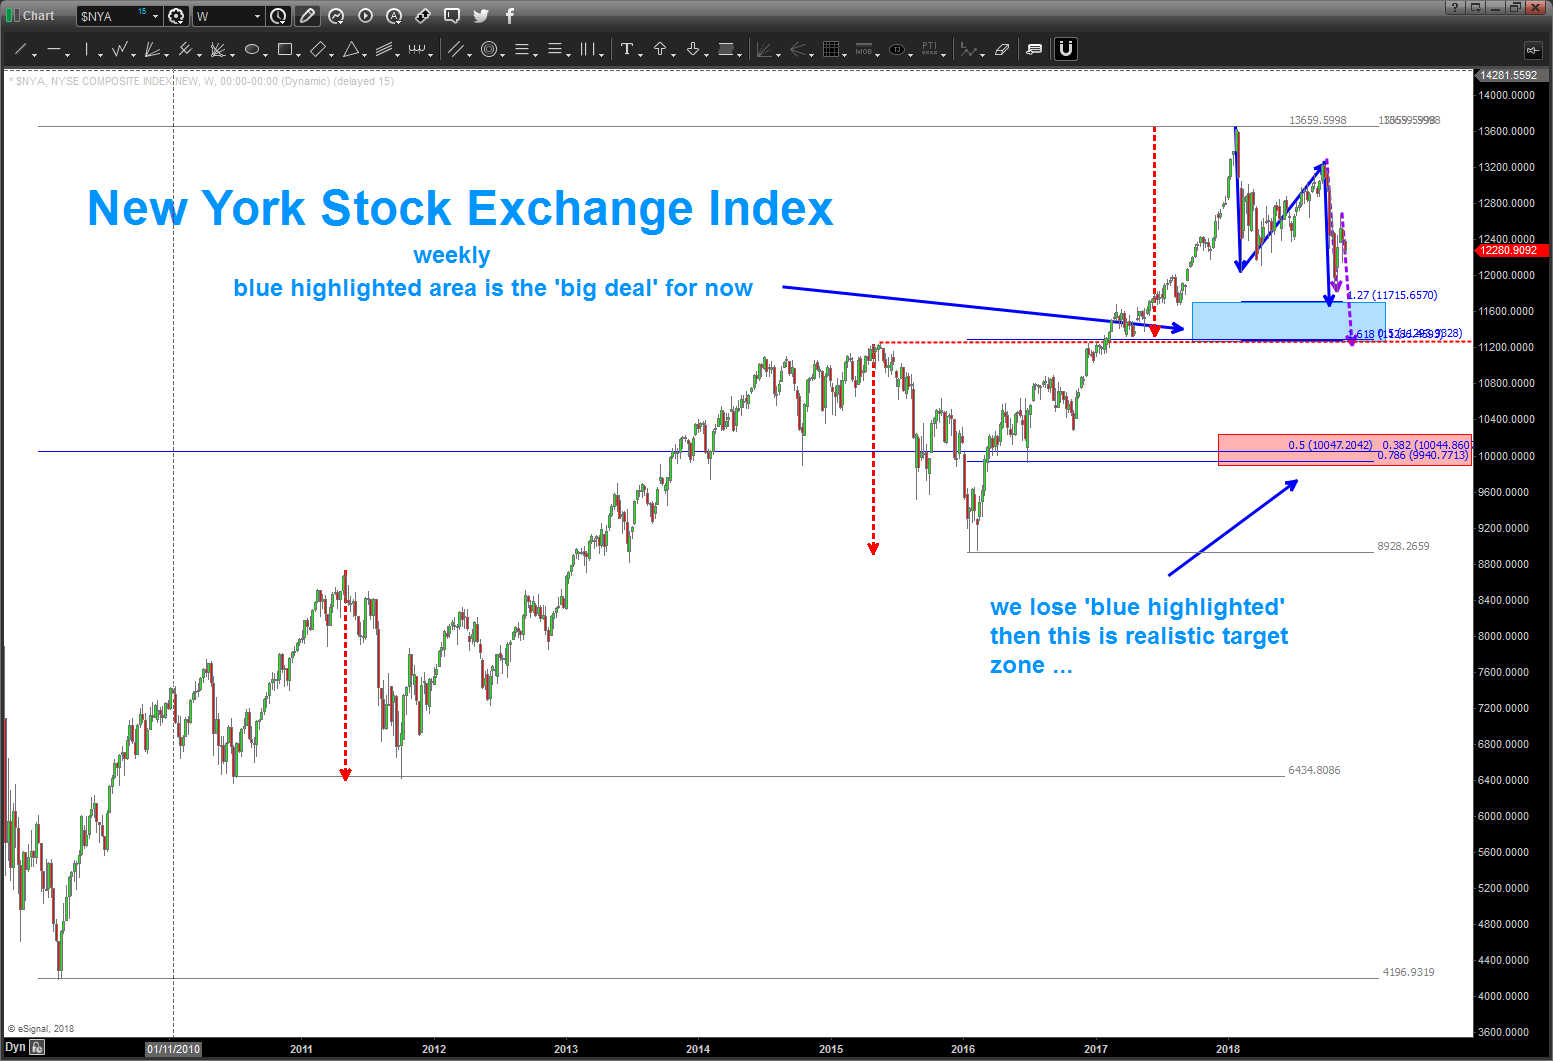
New York Stock Exchange – a BUY pattern emerges UPDATED
Posted on October 28, 2018 Leave a Comment
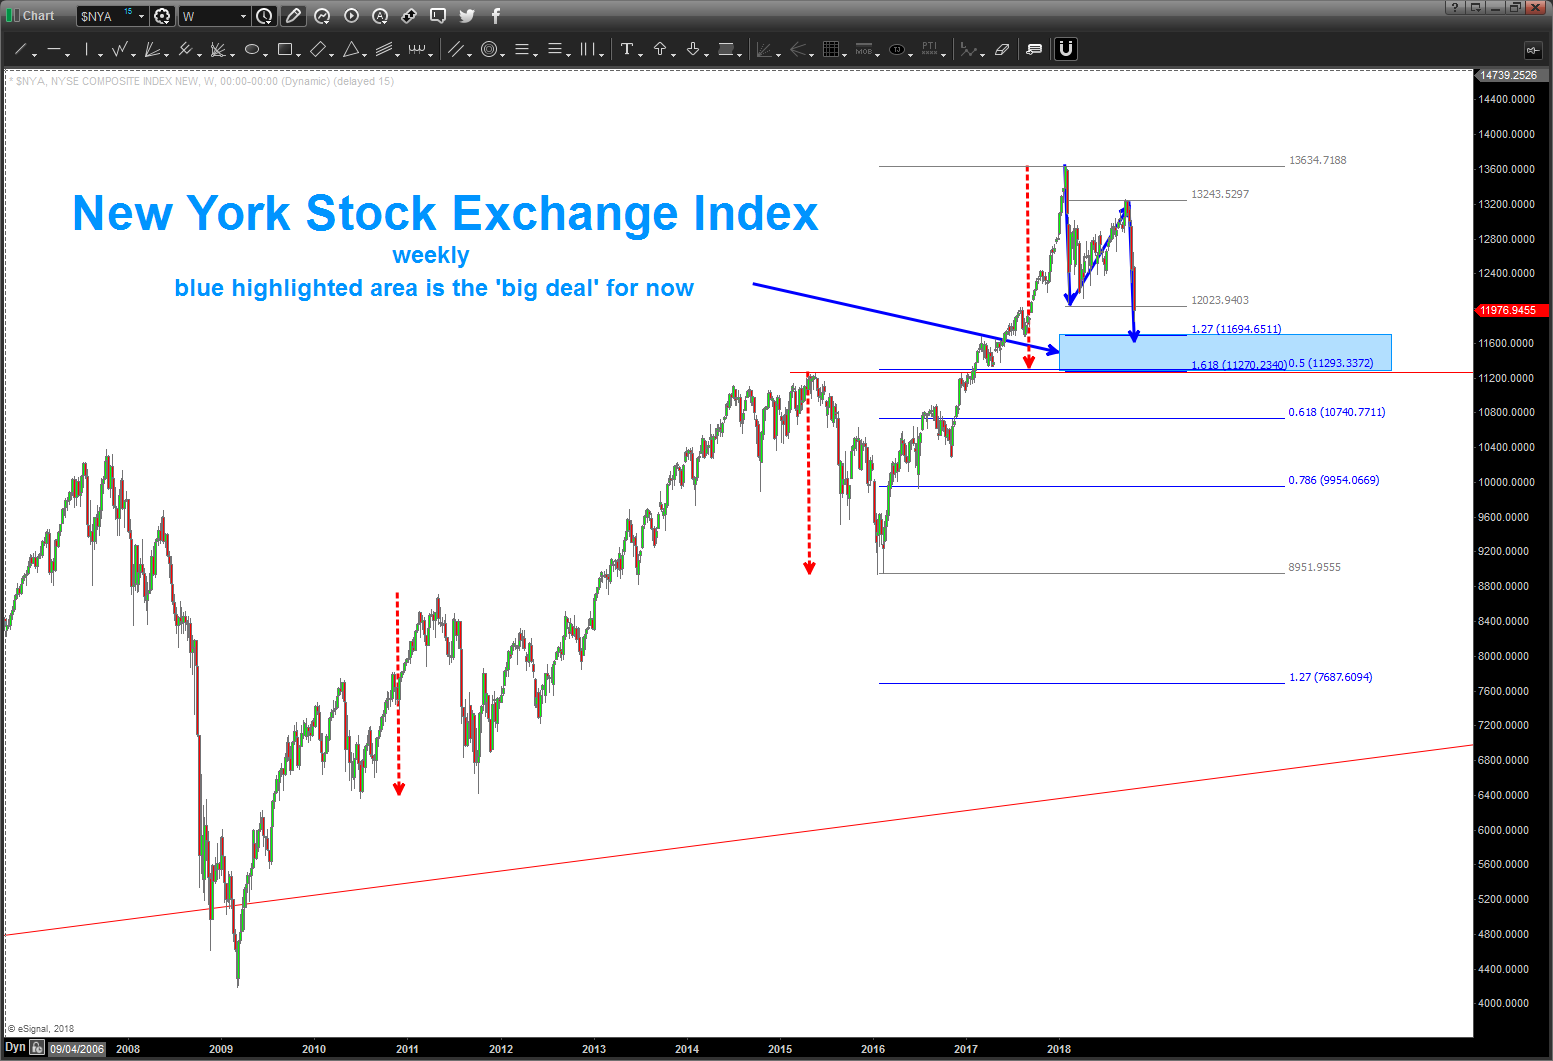
11/19/2018 – revisiting this pattern from the end of October. The levels indicated have NOT been hit so, believe it or not, this is ‘standard’ corrective move in the NYSE Index since 2009. Thus far, every major correction has been the dashed red arrows.
also, we have polarity support area and then we have all kinds of ratio’s coming together – along w/ a BUNCH of projections. so, this area is VERY important. Remember, if we try to filter out the noise and the trend is your friend until the end then WE HAVE TO BUY this level .. perhaps wait for a Signal Reversal Candle but at a minimum believe this is the most crucial support area in 2018.
again, this level hasn’t even been tested yet, so hold on to your hats and everyone just chill … let me know if you have any questions.
note, another lower level has 3 ratio’s coming in (highlighted red) so if we lose the blue, the red is pretty reasonable area for the next target.
Bart
10/18/2018
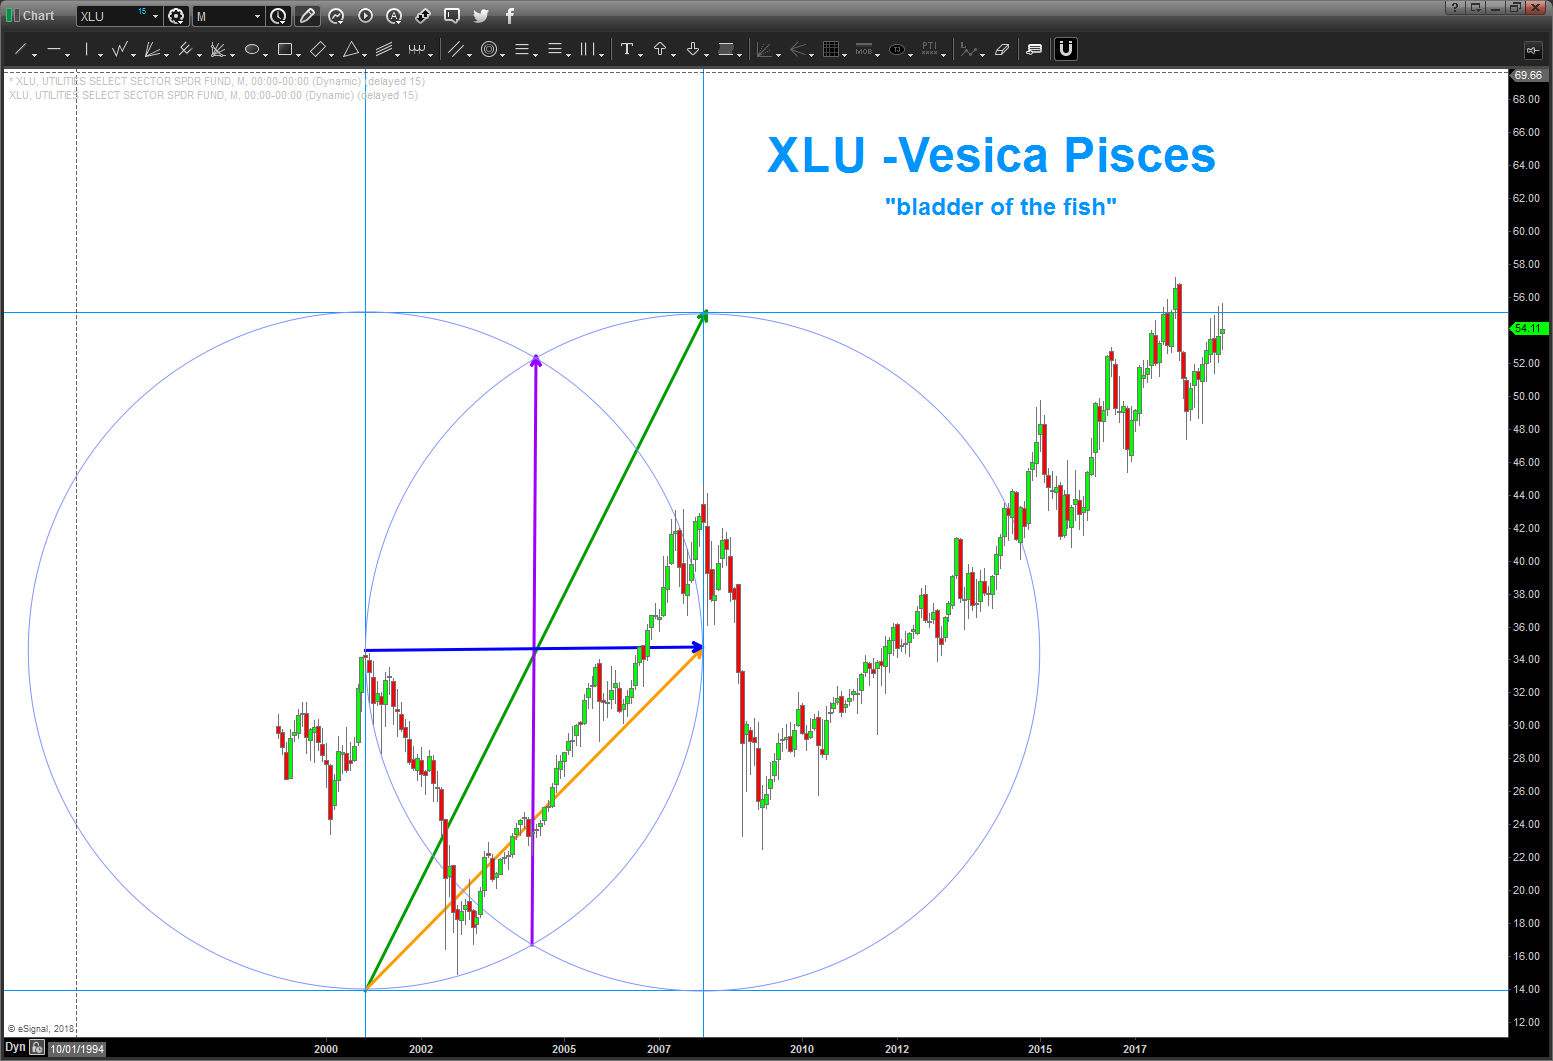
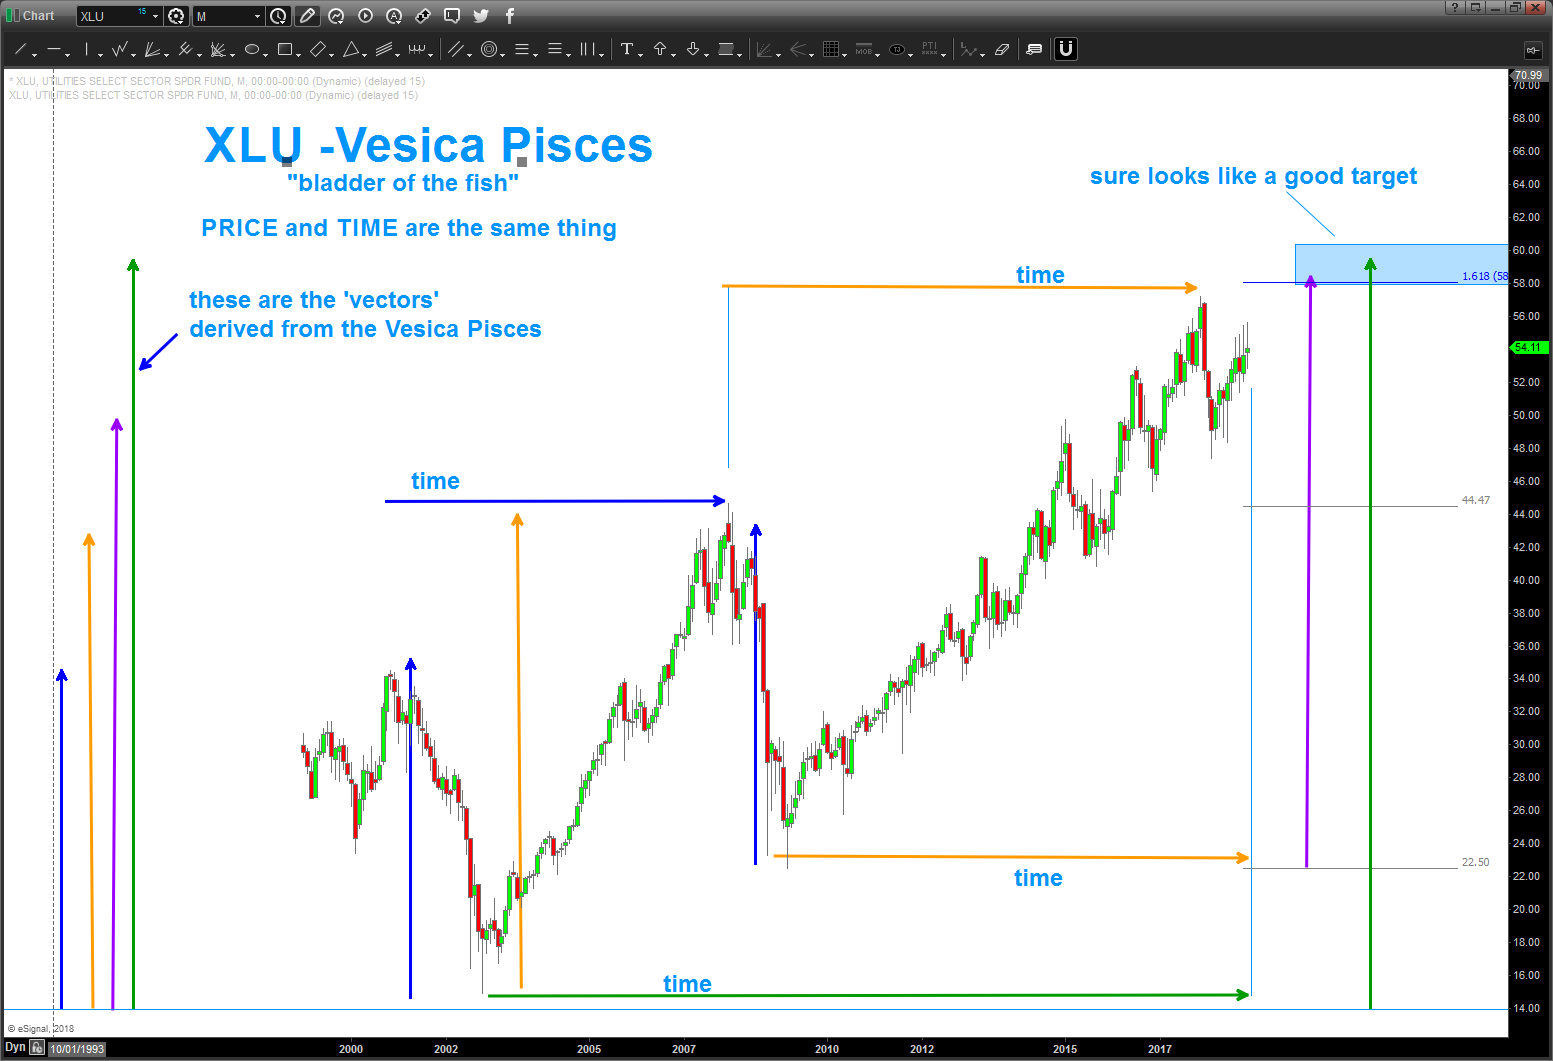
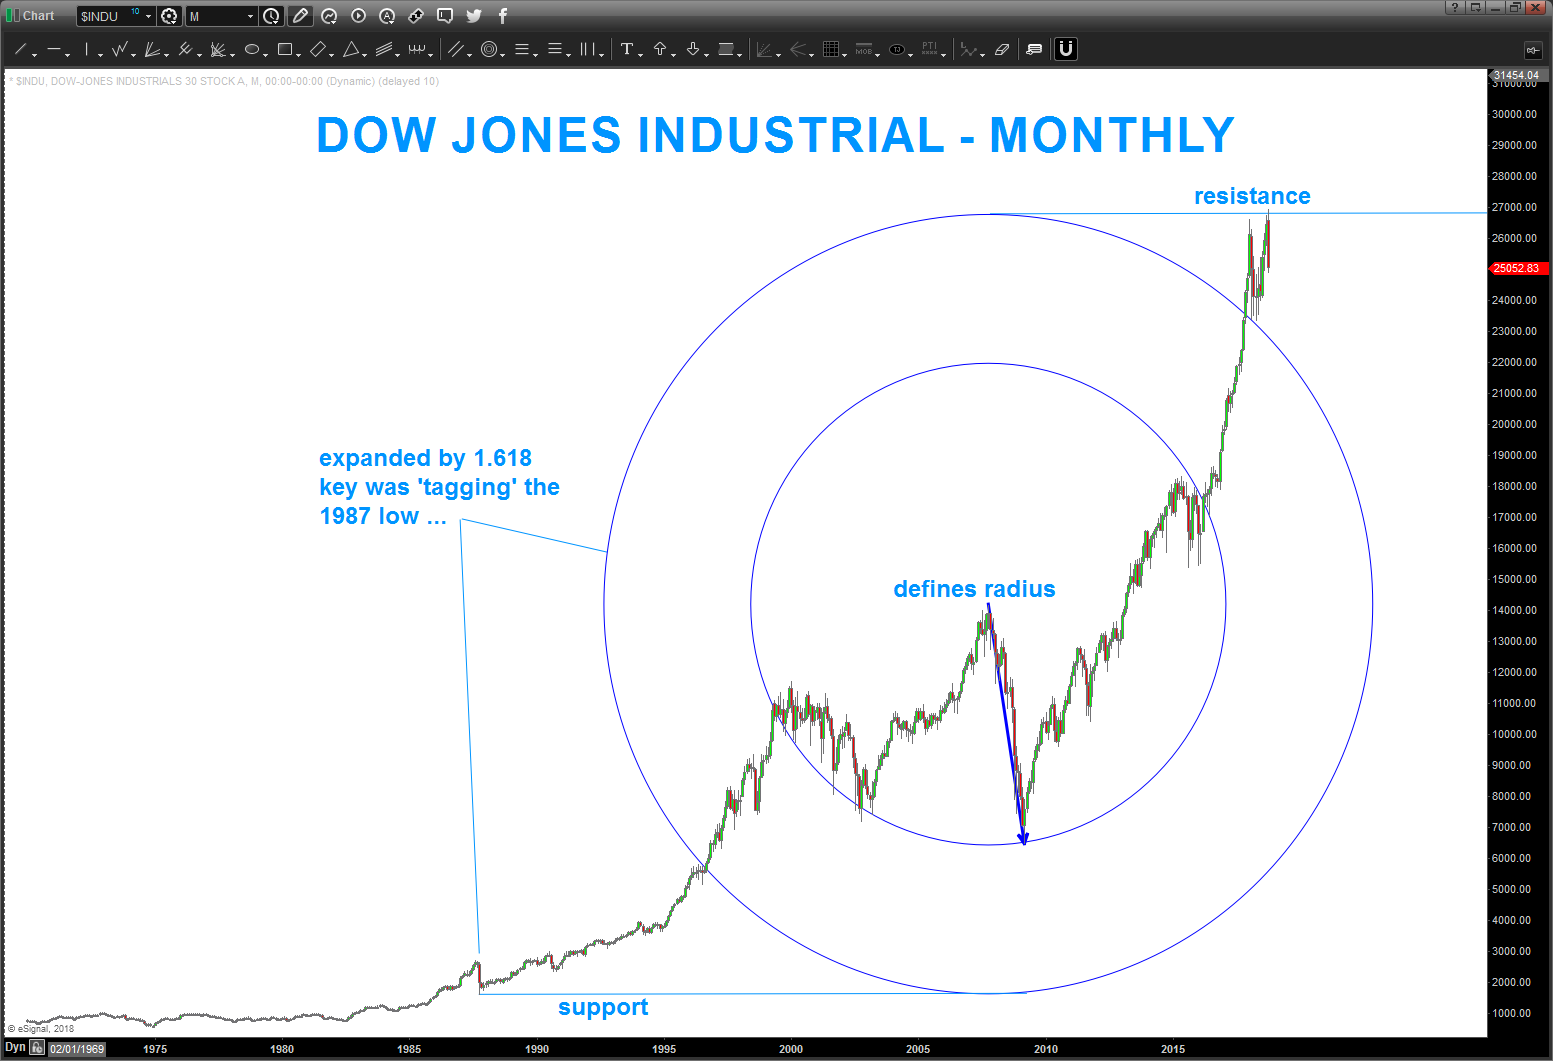
I like to draw circles … just work w/ me. how the 1987 low and recent high are connected by geometry
Posted on October 11, 2018 Leave a Comment
a couple weeks ago I posted this: https://atomic-temporary-44460632.wpcomstaging.com/2018/08/30/jpm-and-tops-of-circles/
it was some geometric work I did on JPM and ‘real time’ the top of a circle. I do have a theory of ‘why’ this technique works in projecting support or resistance but I’ll leave that to me and some of my friends. it really doesn’t matter – does it?
i’ve been silent on the blog world for a bunch of reasons .. the main reason is a loss that occurred in my family and I really haven’t felt like doing much. but, the emails have been coming in about the most recent moves.
if you go back and read you’ll find that I was pretty defensive for the entire summer .. did we/me miss some of the last part of these moves – yes but ultimately, the only buy pattern around was ABX and GE. TBT was also a nice play but the chaos of the euphoria just had me step aside.
so in order to get back into it, I put some Enigma on the Spotify and, specifically, Morphing Thru Time .. pretty ‘trip-in-dicular’ to say the least.
I called up the Dow Jones and could just see the connection between the 1987 low and this most recent high. Tops of circles are cool.
Bart
(F) Ford set up – redux
Posted on September 9, 2018 1 Comment
05/18/2018
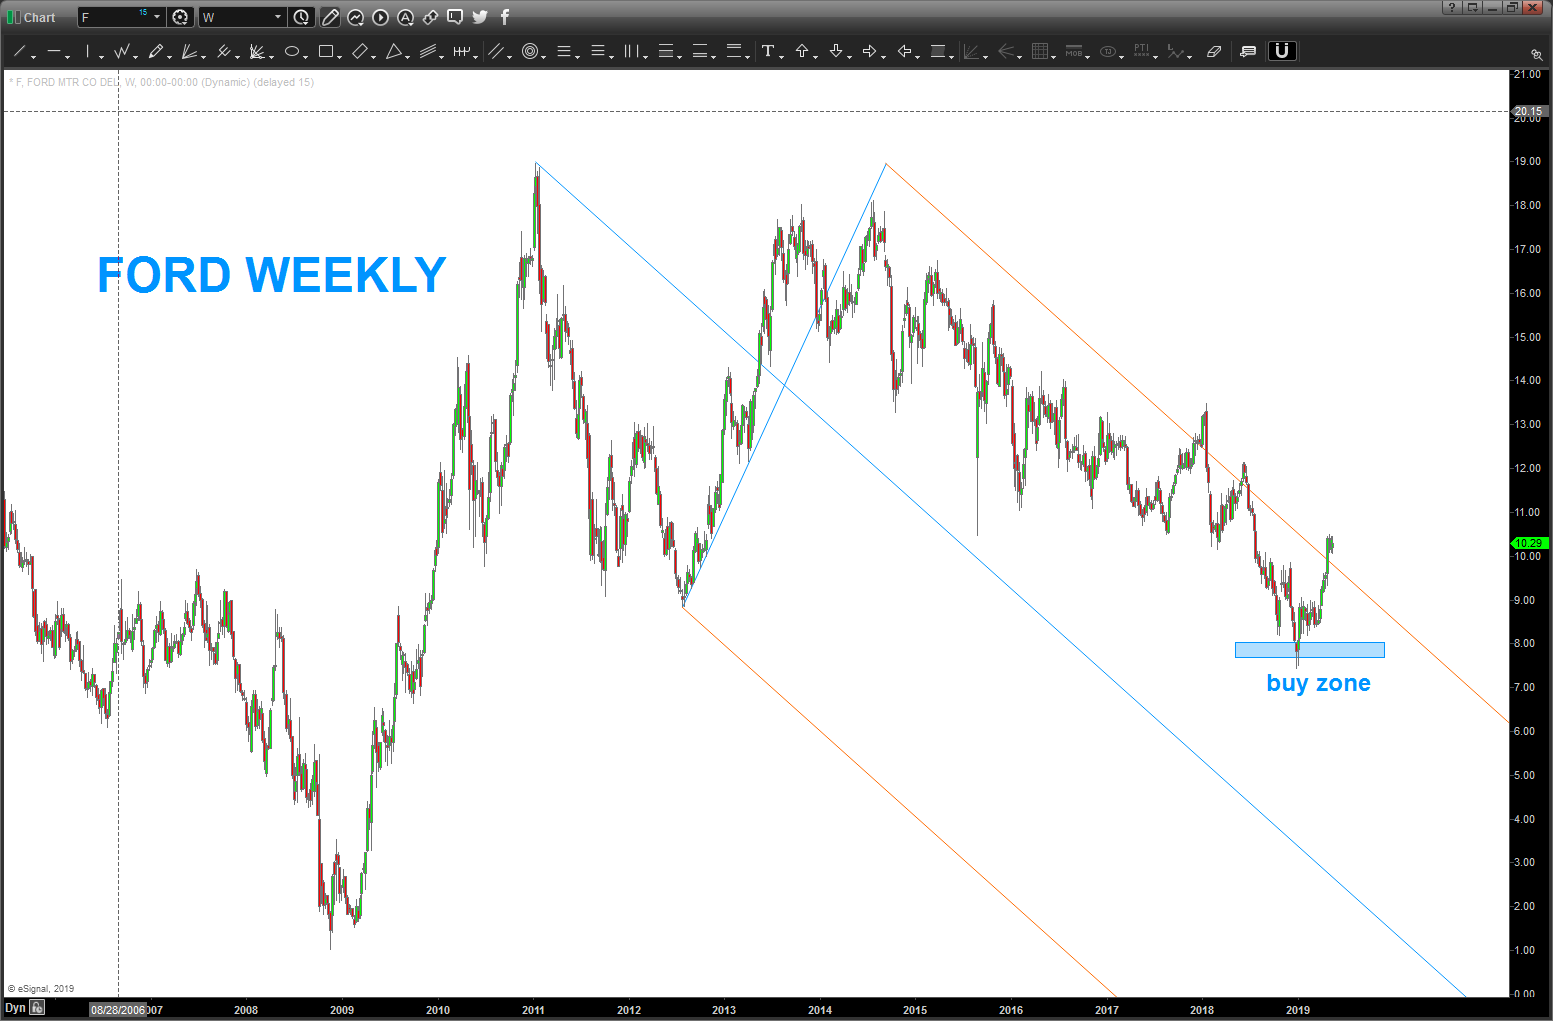
the zone we were looking at below was hit … any sustained pullback should be bought. look for increased volume and rotation moving forward.
10/21/2018
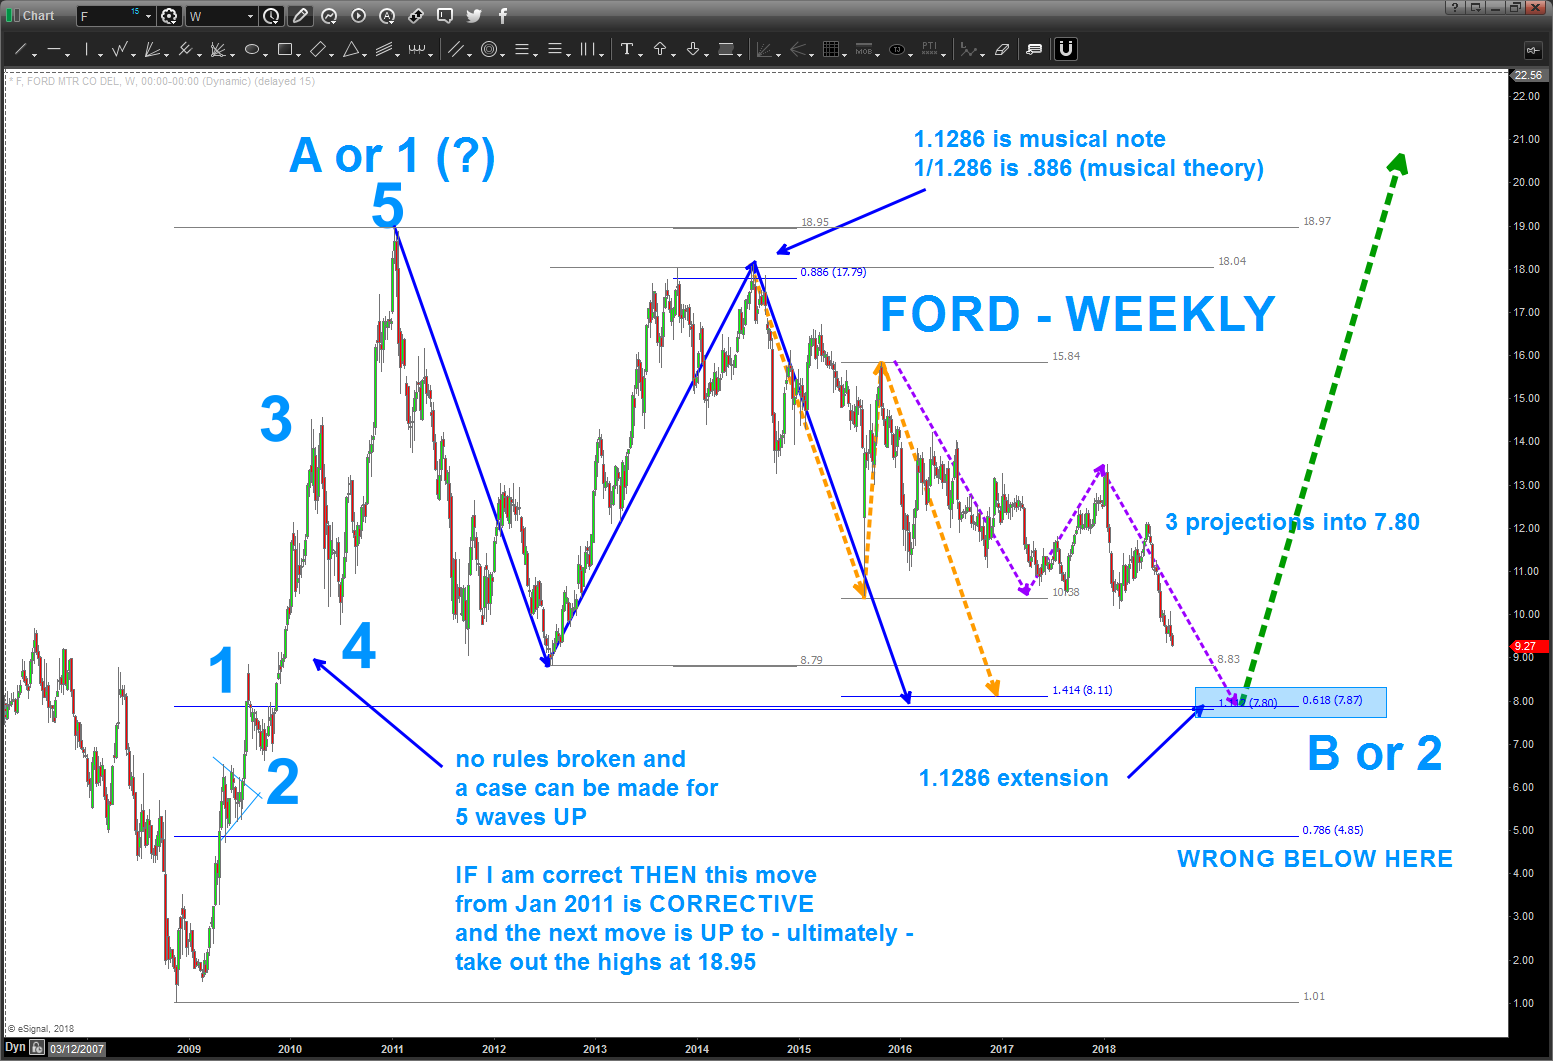
F has hit the zone for the projections sighted a few weeks ago. a weekly ‘doji’ has formed but no real bullish divergence. perhaps continue to wait till 4.86 OR a weekly close above 10. all that being said, this area is a BIG deal for Ford (F) ….
Bart
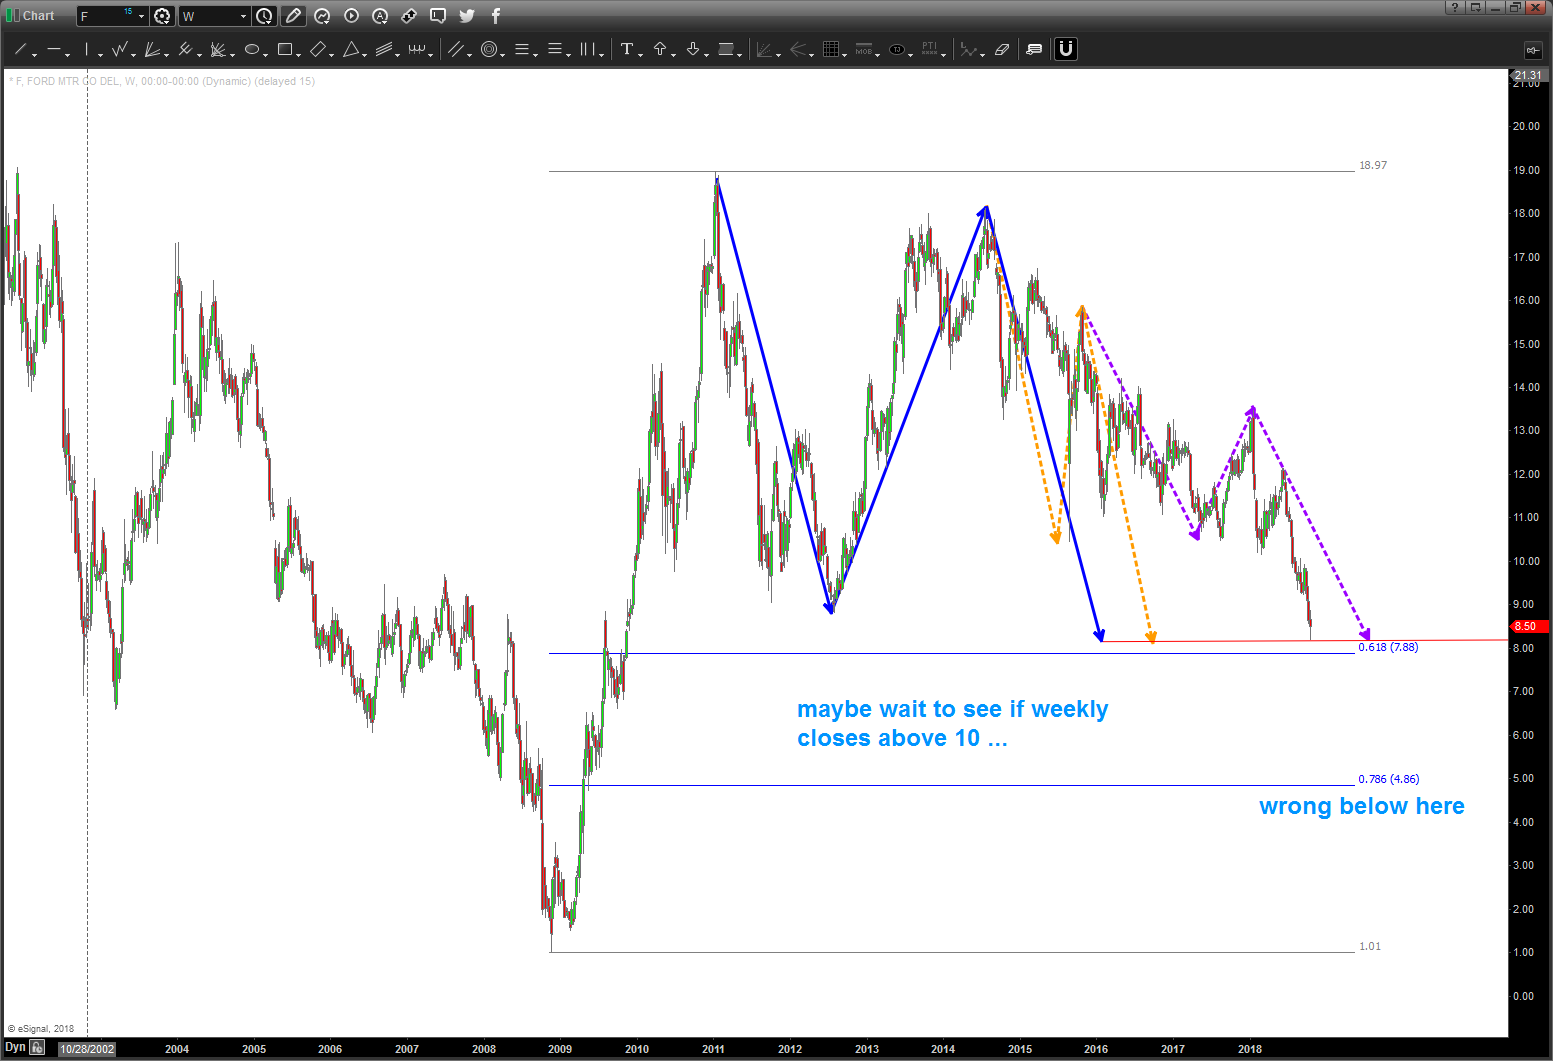
—————————————————————————————————————————————–
3 AB=CD’s
.618 retracement
Extensions of 1.4142 and 1.1286 (musical note)
looks like $8 cold be big support …
Bart
Ford