Technology vs Staples (XLK / XLP) Ratio Analysis
Posted on June 3, 2018 Leave a Comment
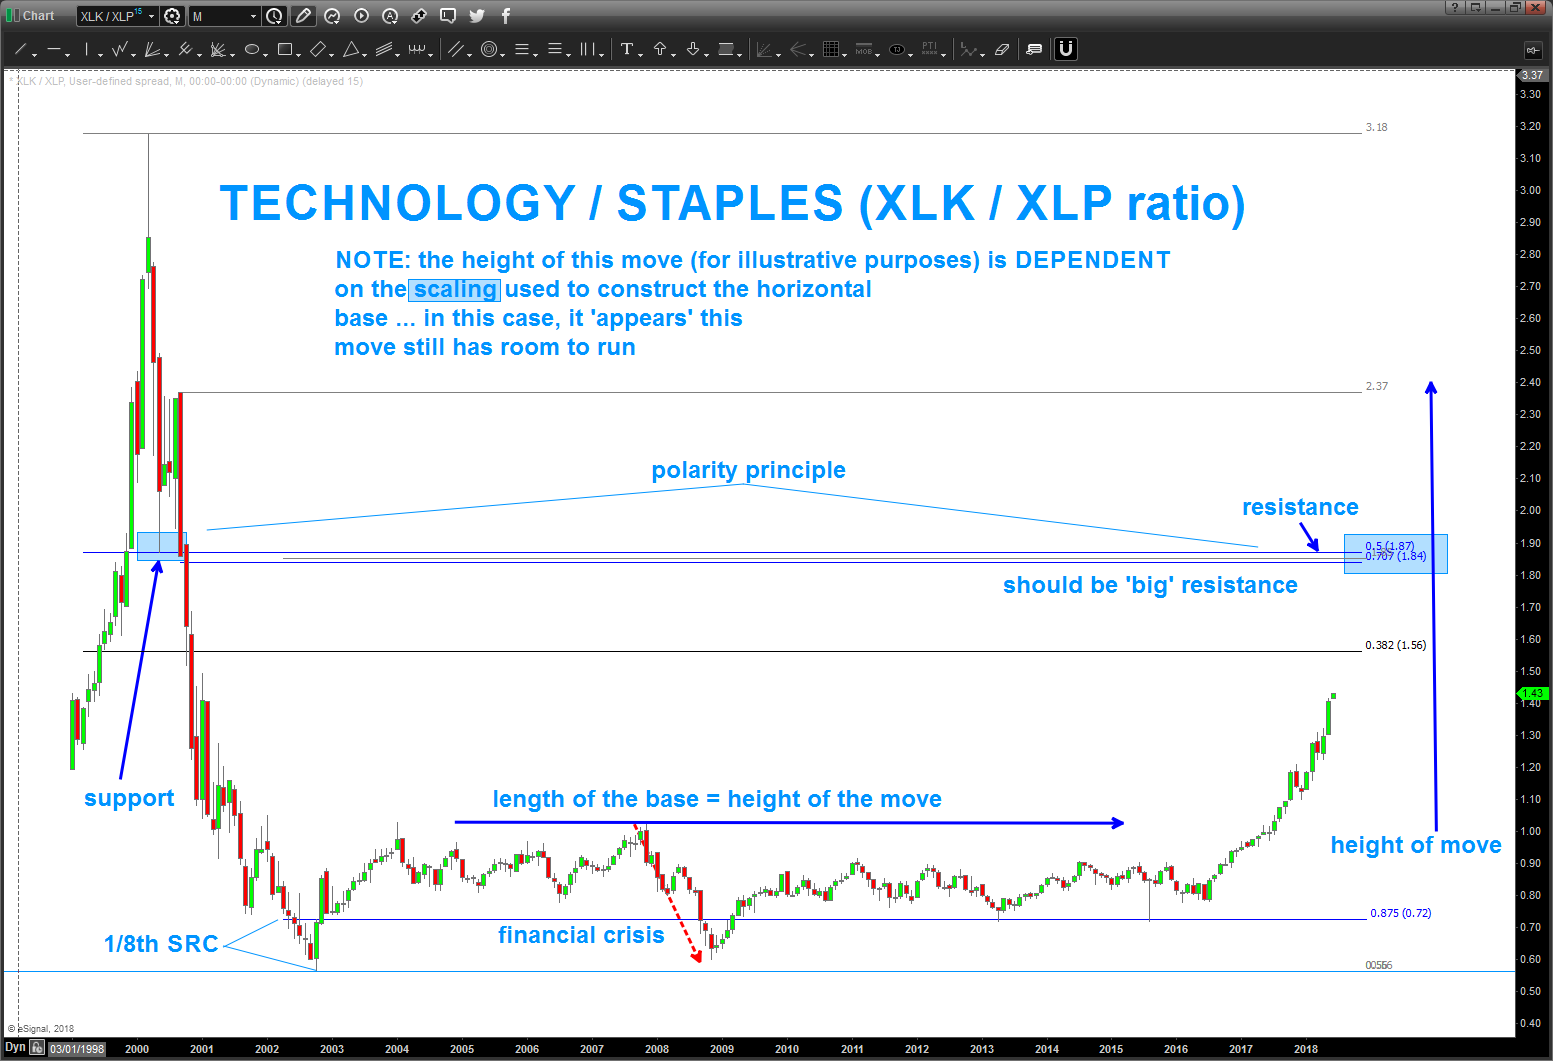
I like Ratio Analysis … I also like to work w/ the patterns on these charts.
If you have been reading my blog for a while, you know that I ‘try’ (the operative word) to not read, watch or listen to any ‘other’ financial news commentary. Yes, there are people that I follow and am very interested in what they see/say (most are the same as me) but I can tell you that NONE of the people I follow or read are fundamental analysts. Not that they don’t do good work (they do) I’m just not smart enough to understand the information they put out. For me – it’s much easier to use crayons, some geometry and PRICE and TIME and PATTERNS to try to manage risk. The ‘why’ and the ‘blah blah’, again to me, is just noise.
so ratio analysis:
X/Y – if the chart goes up then X is stronger.
X/Y – if the chart goes down then Y is stronger.
X = XLK (technology = risk on) the Y = XLP (staples = risk off)
XLK/XLP – going up w/ strength. the big guys (institutions) aren’t showing a ‘risk off’ mindset. the XLK/XLP ratio move up is the LARGEST SINCE THE LOW OF 2002.
So, for me, while we might shuck and jive and perry left, perry right until we have a monthly bearish signal reversal candle I can’t join the camp of the sky is falling and all that jazz.
Bart
DB (Deutsche Bank) House of Cards?
Posted on May 29, 2018 1 Comment
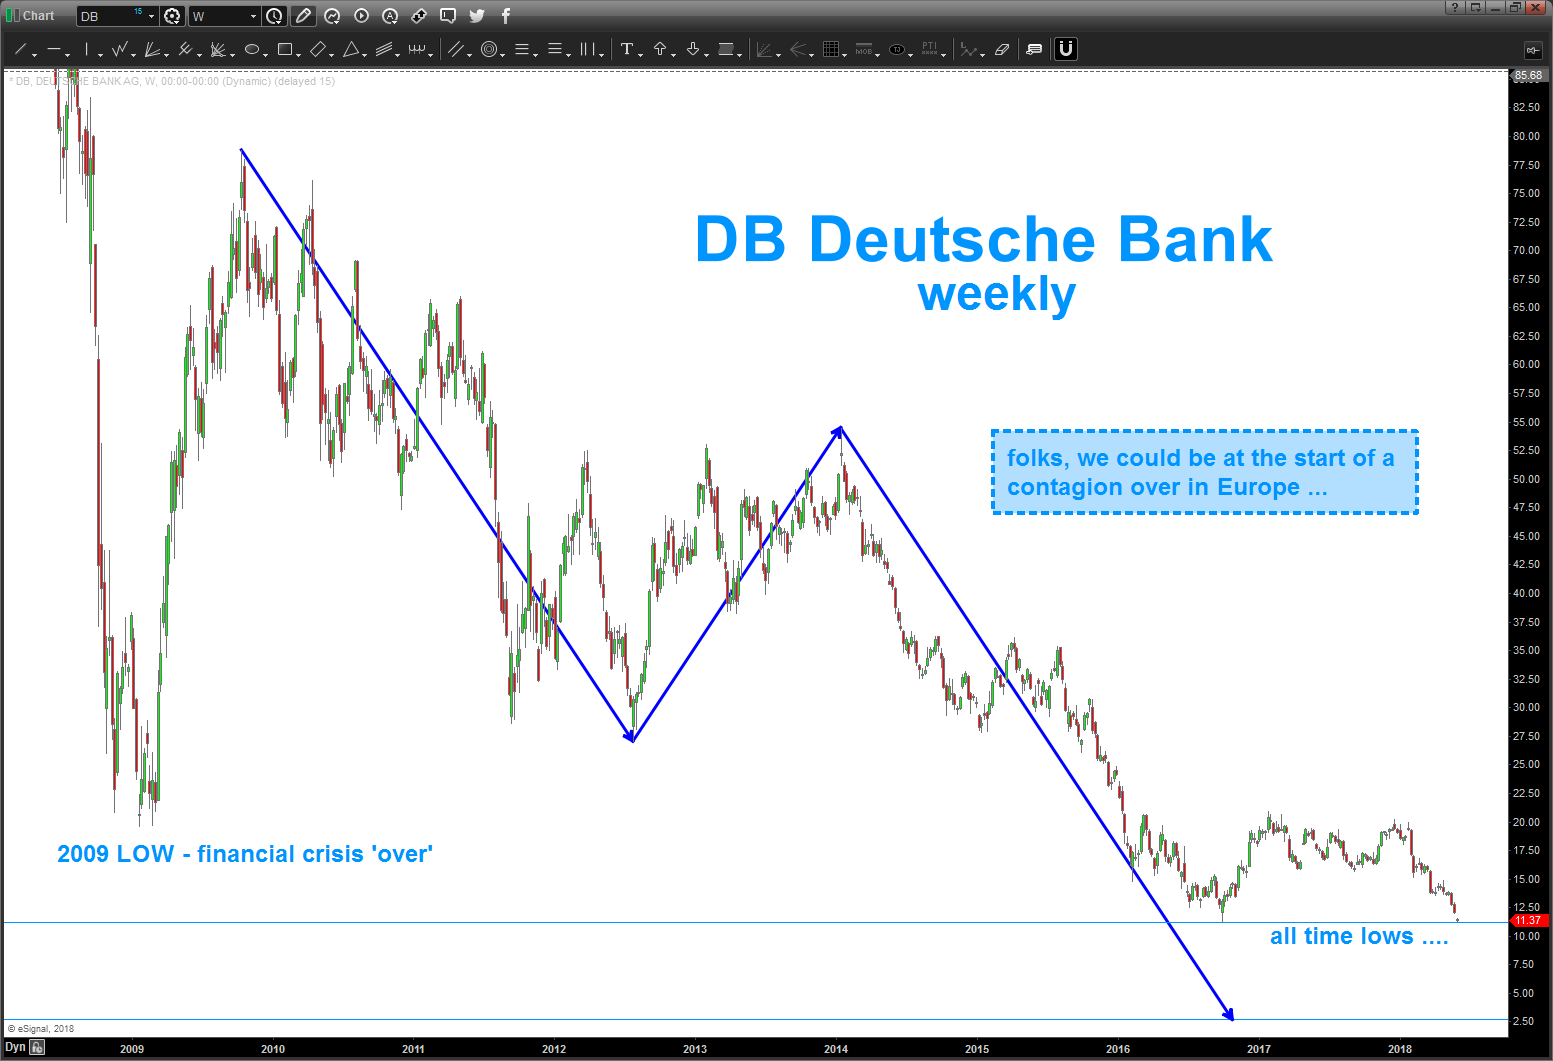
05/29/2018 – if you search ‘DB’ on my site you’ll see I’ve been watching this company for the past couple years. Why? Well, they are the largest holder of derivatives in the world and have so many ‘tangling alliances’ w/ the major global banks that they contain some serious systemic risk.
folks, this is getting really ugly … the probability of a contagion in Europe is growing larger every day.
watch the global flow of funds in the coming days … the ‘big money’ is going to have to go somewhere and, quite frankly, a big old position in the DOW 30 isn’t necessarily a bad thing is it? Yes, were going to get some global equity hits over the coming days weeks but ultimately, watch VOLUME and look for measured moves … but, for now and perhaps the foreseeable future stay out of Europe.
will update as we continue along …sheesh, the Eurozone is a hot mess.
Bart
IBM pattern failure …
Posted on May 21, 2018 2 Comments
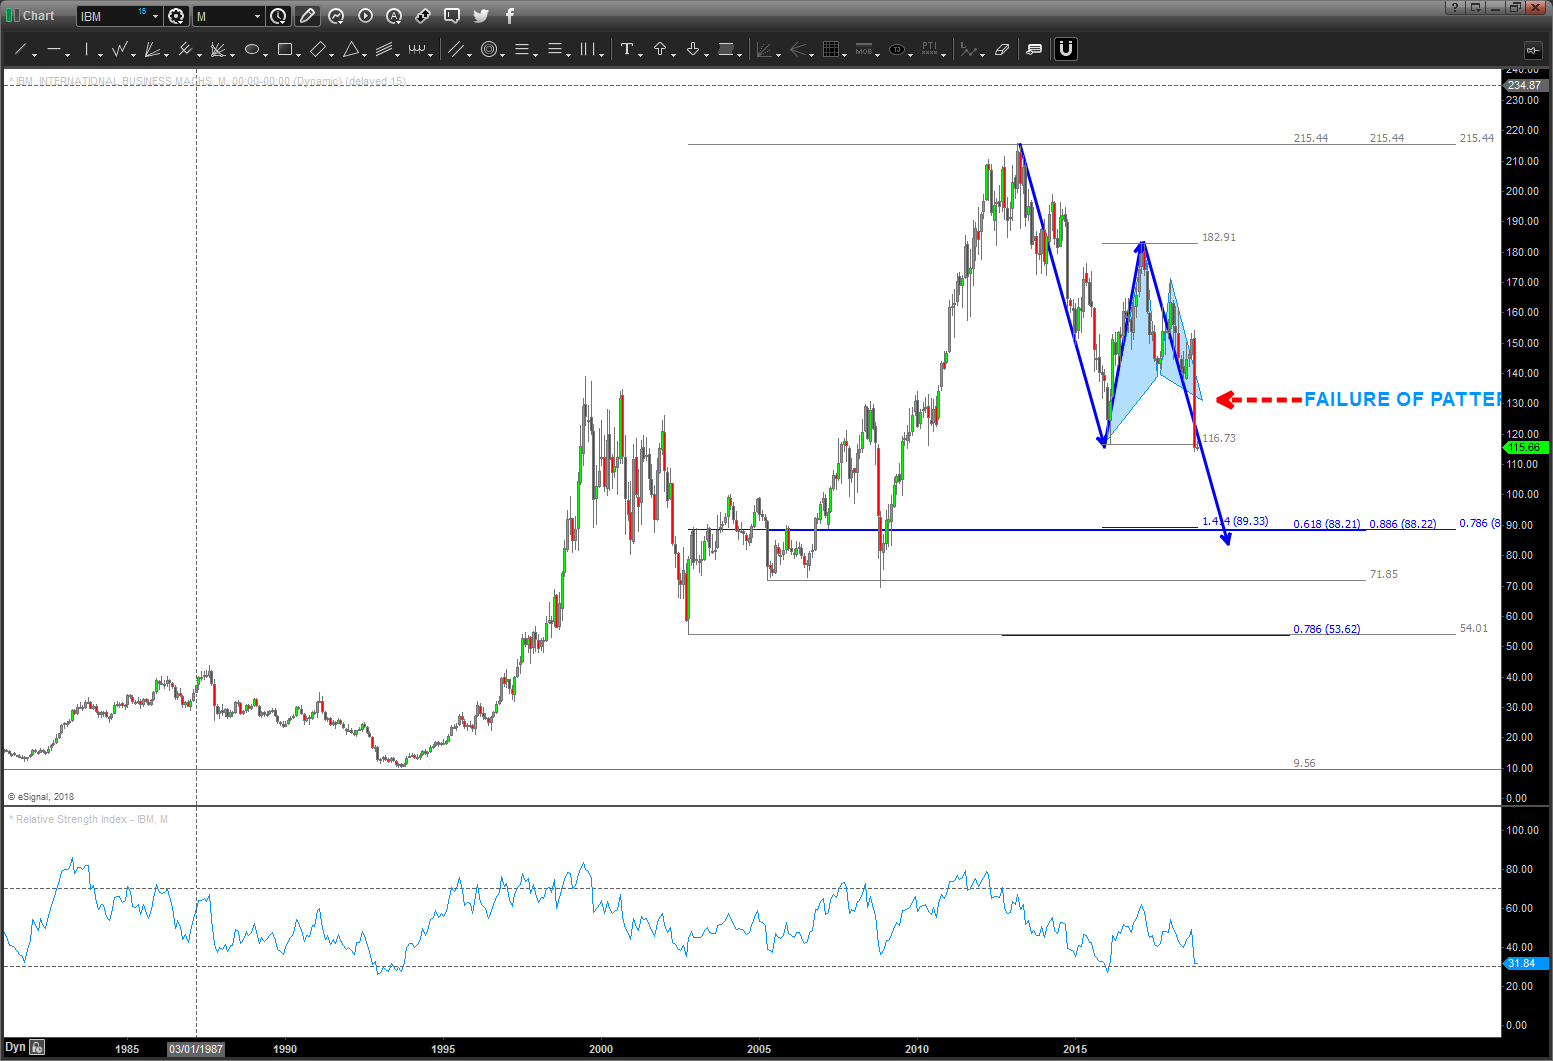
11/2/2018 – ouch.
The area labeled ‘FAILURE OF PATTERN BELOW’ is one of those levels that ‘should’ have acted as extremely nice support for IBM. Guess the operative word is ‘should’ w/ regard to that last sentence. Take a look at that candle … boom. That folks, is what a pattern failure looks like.
so, if you look below, it’s now setting up for a support zone (dare I say BUY zone) in/around 88-89. I’ll do some more work on it over the weekend but the BUY PATTERN mentioned w/ @seeitmarket went the way of the buffalo.
Bart
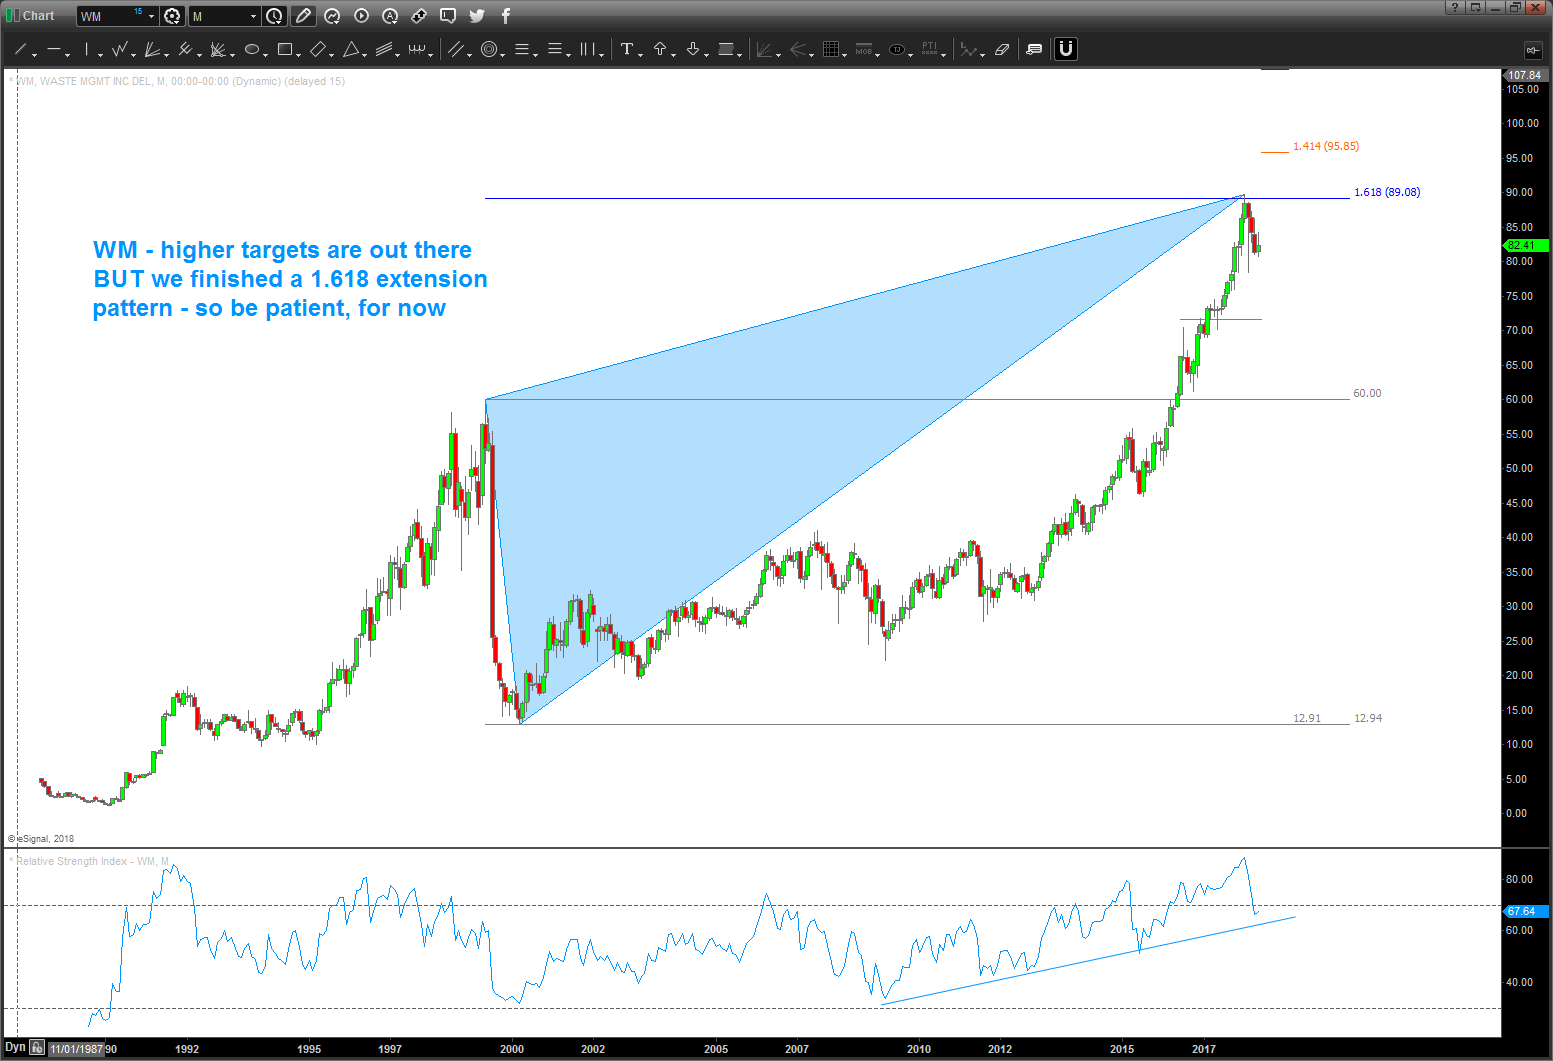
certainly appears to be setting up for a nice one …
Bart
IWM … caveat emptor and check out where price hovered today in my P.S below … cool.
Posted on May 17, 2018 1 Comment
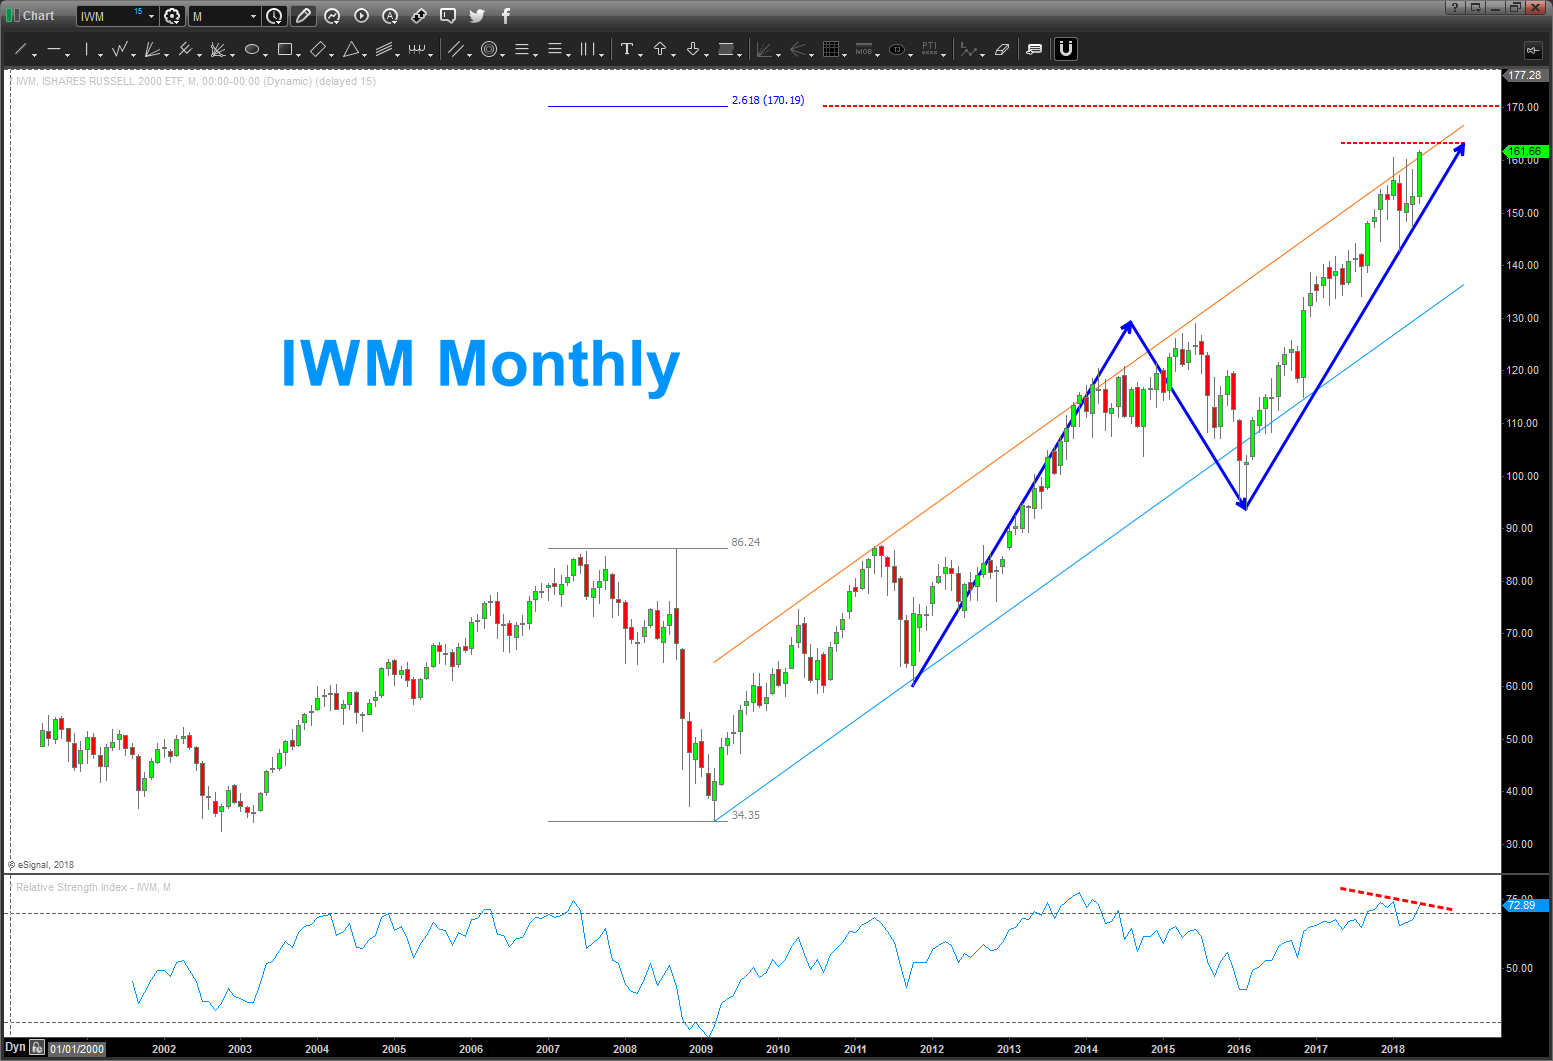
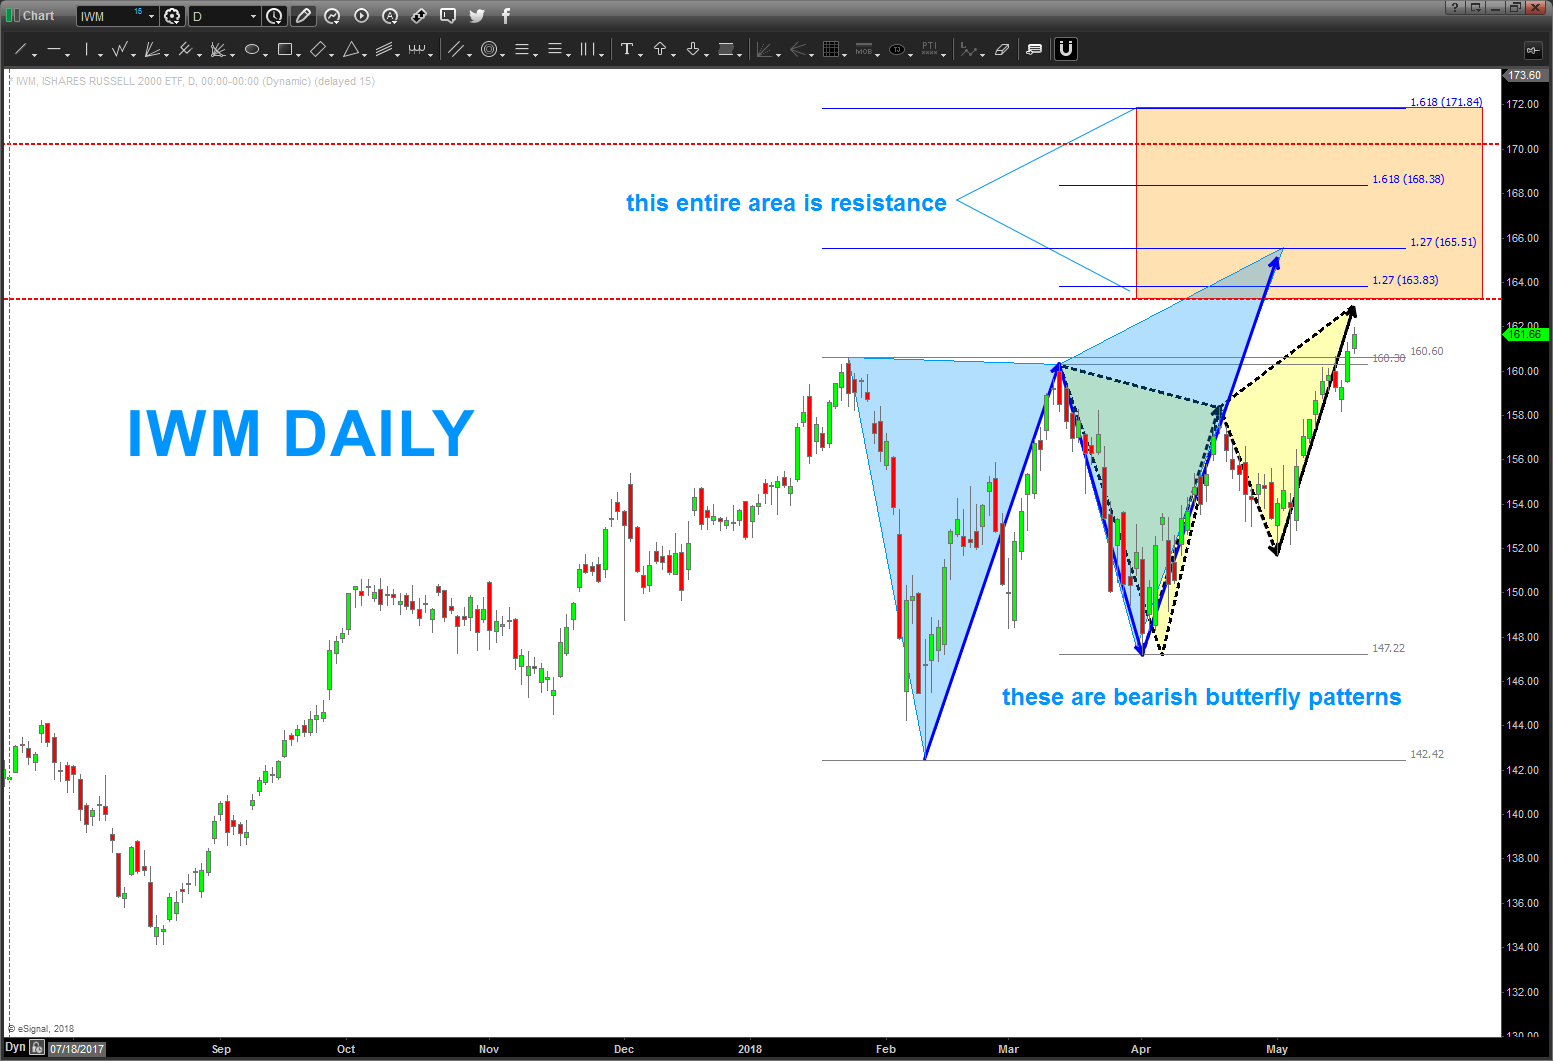
I’ve seen the very strong strength shown by IWM (ETF for Russell 2000) but I also see 5 waves and monthly bearish divergence. I’m not ‘sold’ on the bullish aspect of this ETF, yet. Let’s see how it deals w/ the 2 daily butterfly patterns (bearish) that are present right in the zone of the measured move shown on the monthly …
What I can say is that IF these patterns fail this puppy will, indeed, explode. But that monthly tells me … not so fast and be careful of the ‘no brainer’ trade being long IWM.
Bart
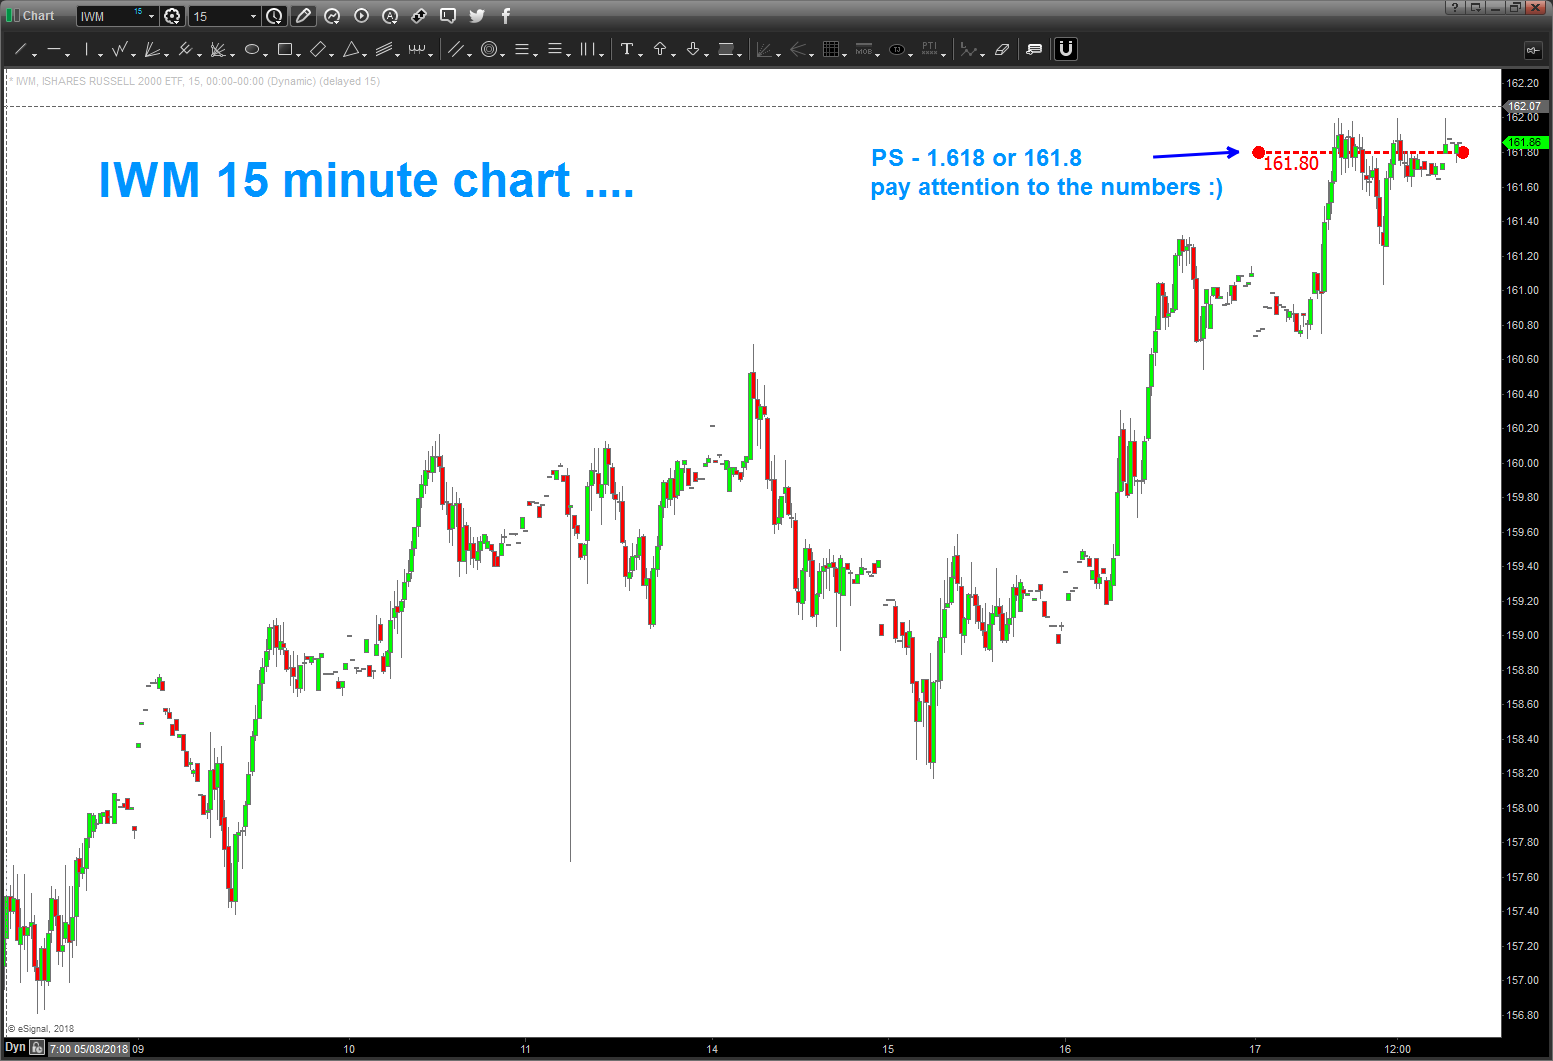
PS – for those of you who are geeks, like me, notice the close hovered around 161.80’s or the golden mean – 1.618. Note – our subconscious mind doesn’t worry about decimals points.
PS – 1.618 or 161.80 🙂
back at it … just got back from a week long Stand Up Surf Camp … where are we now?
Posted on May 13, 2018 Leave a Comment
amazing week in Punta Mita Mexico … after my daughter got married my wife ‘allowed’ me to take some R&R. Worked hard for a week on my SUP skills w/ these guys: https://supnsurfretreat.com/
if you have any interest in Stand Up Paddle Surfing do this … shout out to Chris Sfor ALWAYS being patient w/ me. If I see you out on a wave this summer I promise I’ll at least know what a line up is … can’t promise anything else. Thank you, Chris, for the push.
before that saw 3 straight weeks of travel so I just ‘checked out’ of the markets for almost a month.
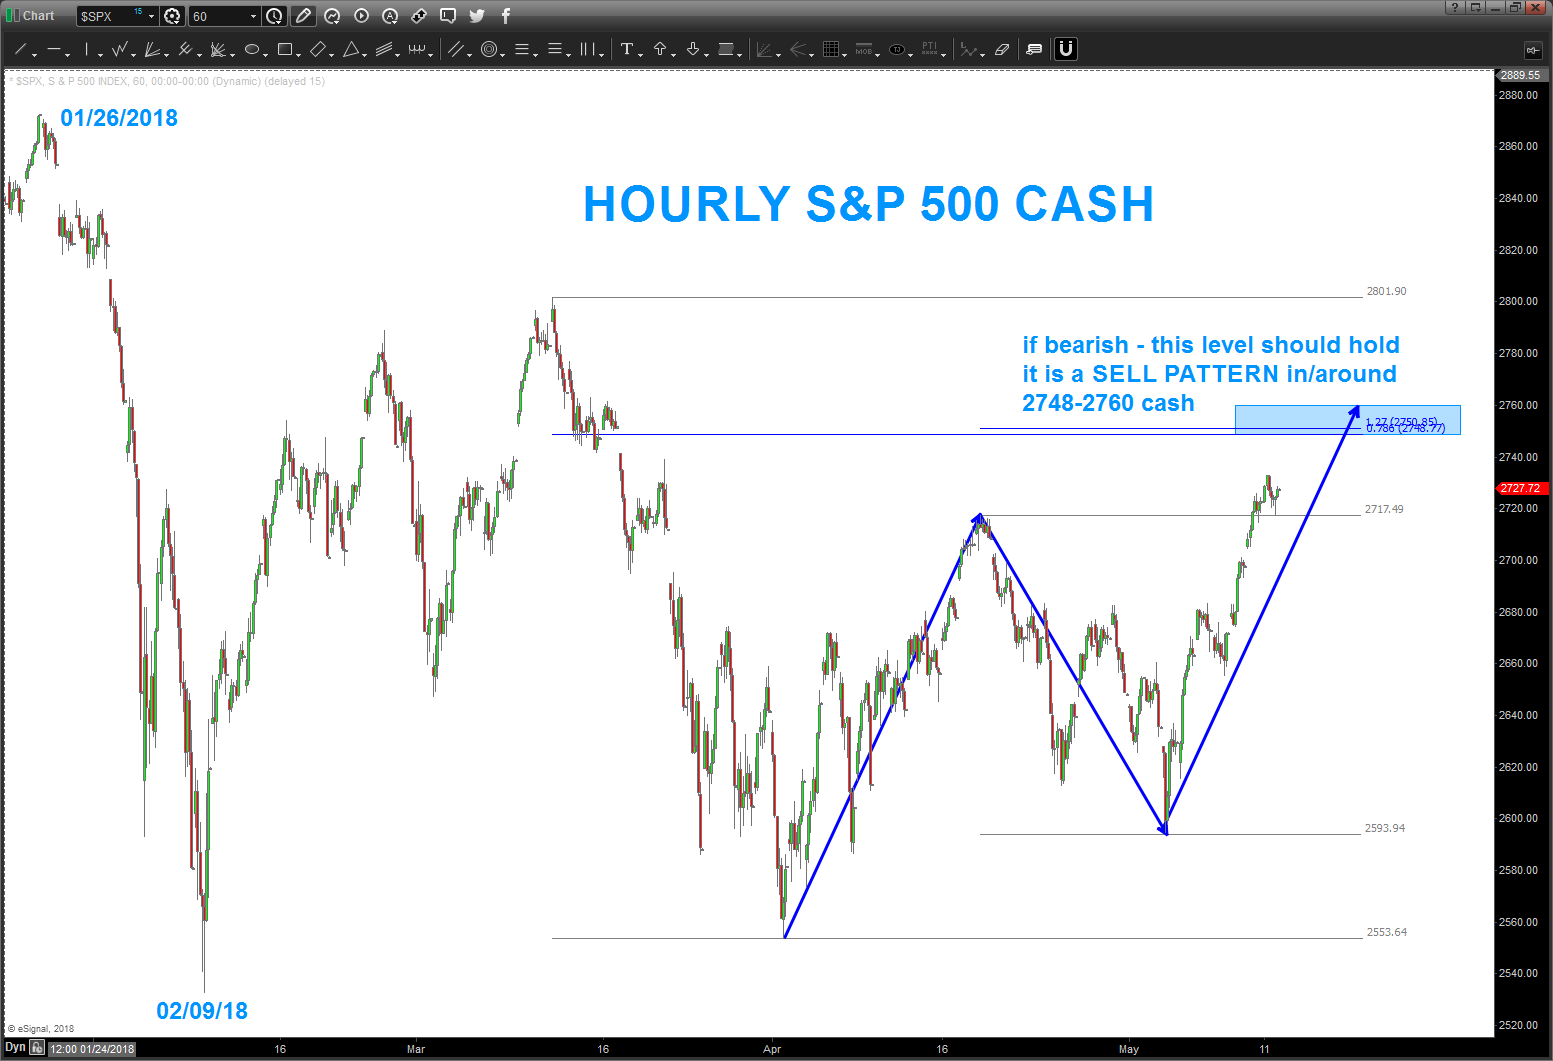
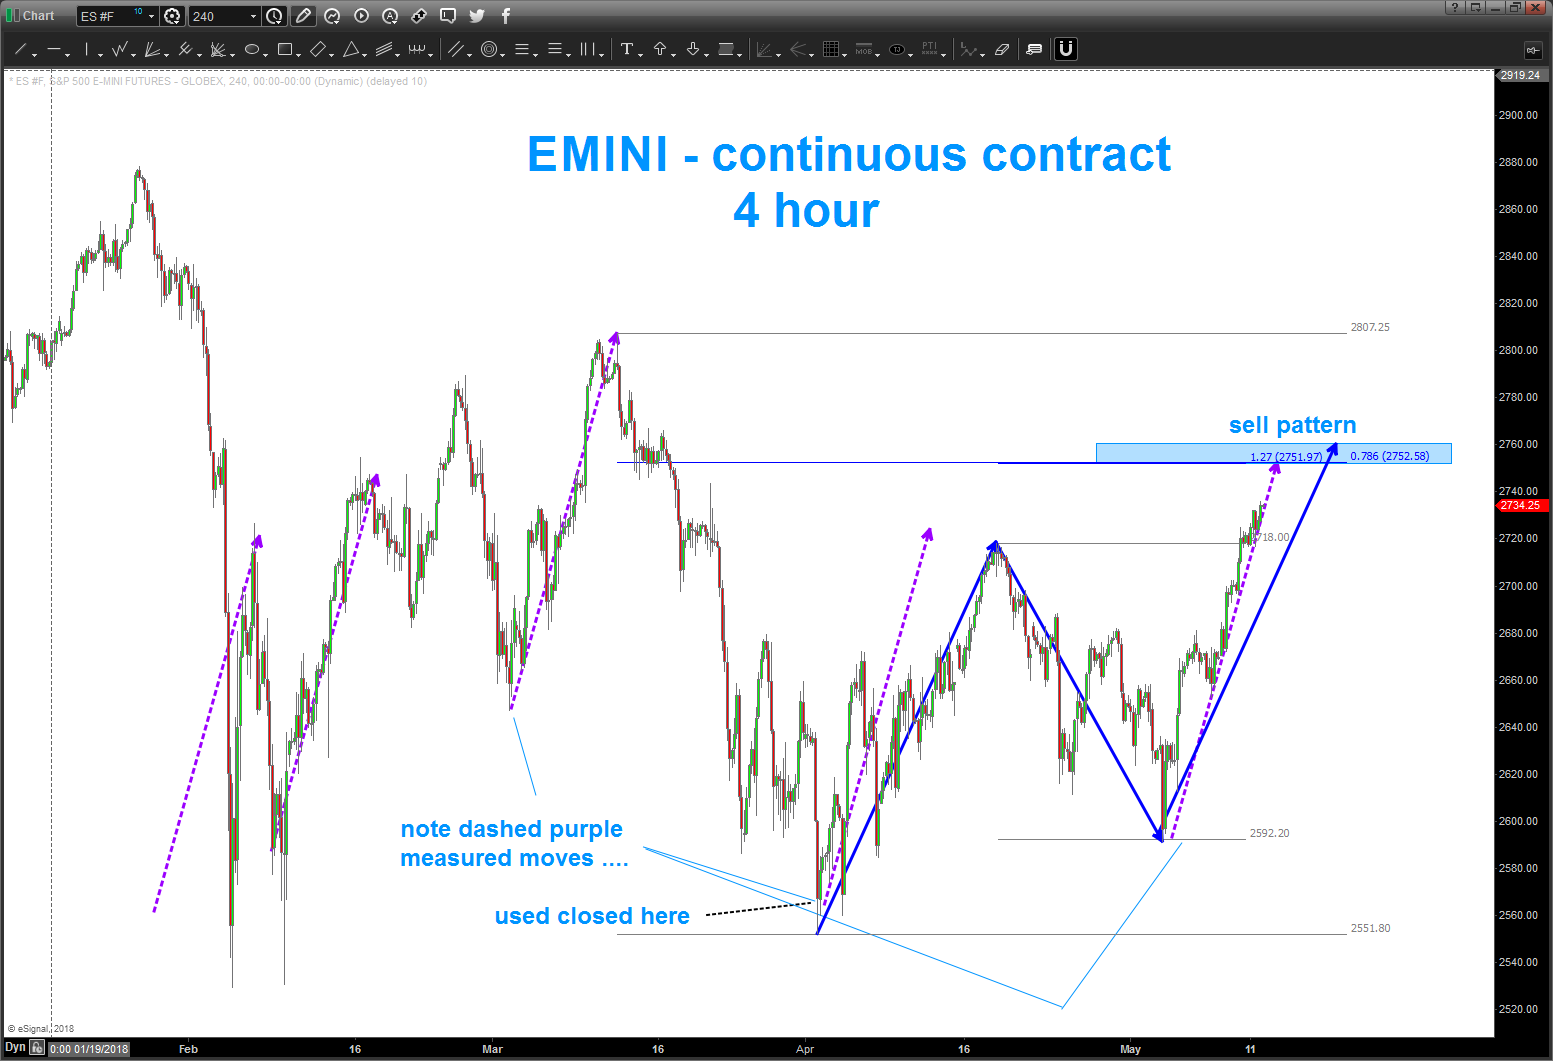
came back to the charts and what do I see … a PERFECT SELL PATTERN on the S&P. if your bearish, this is the level …
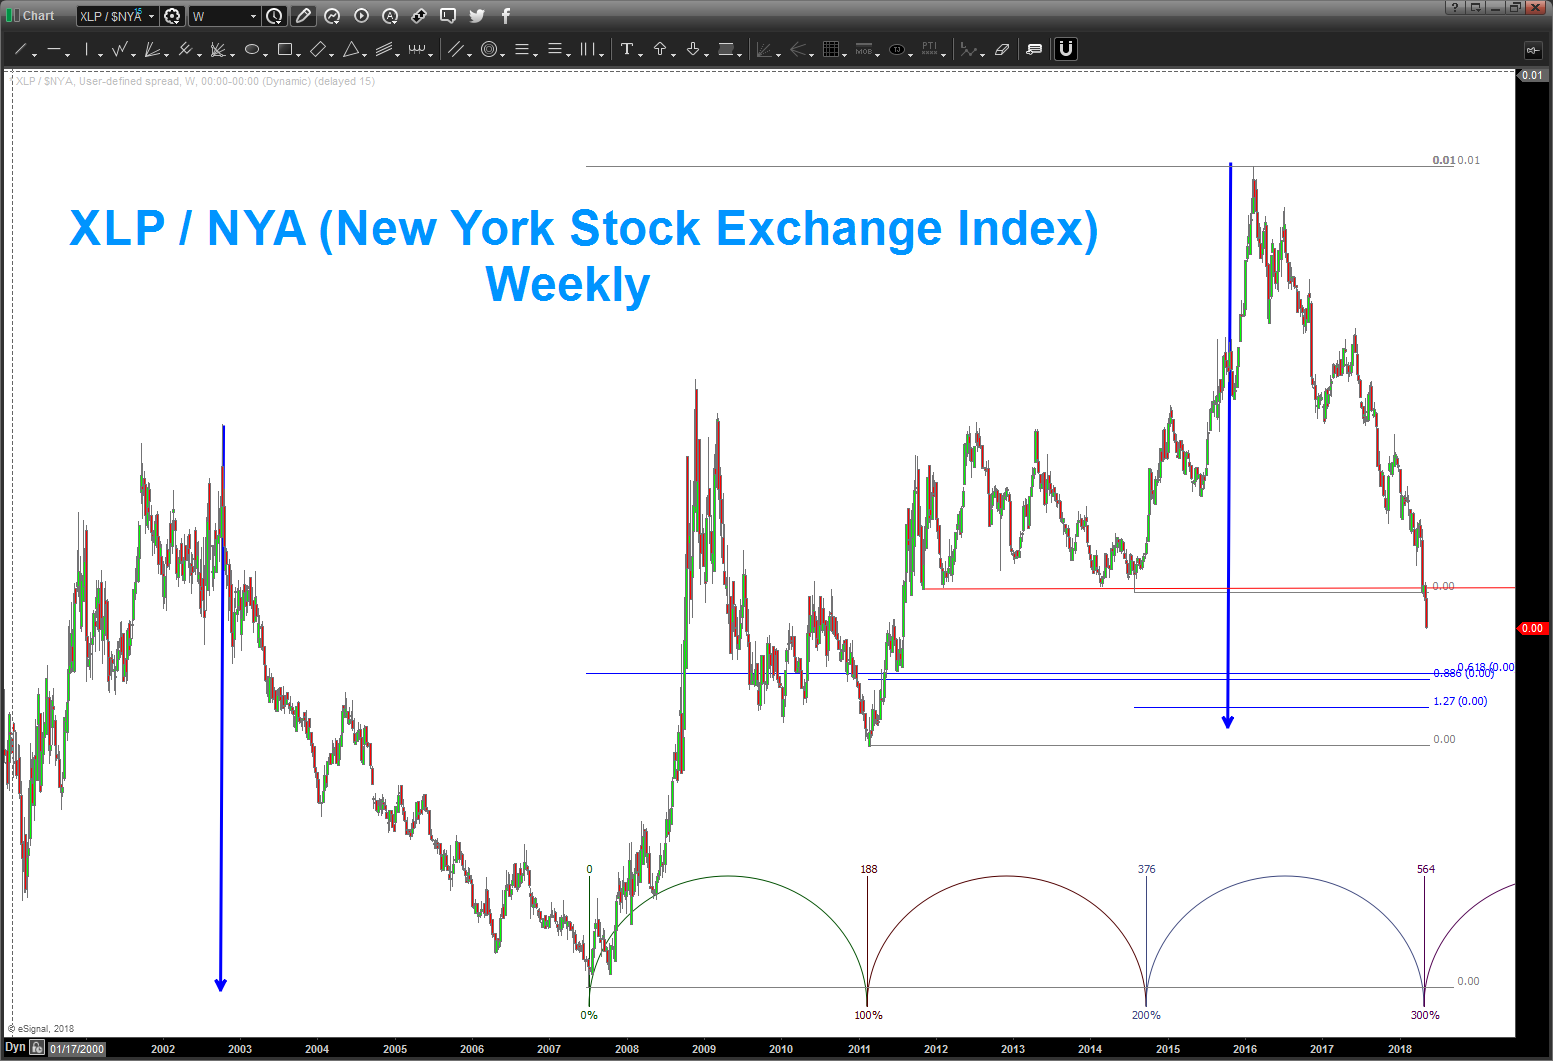
the only thing that is keeping me cautious and in a wait and see mode is the XLP/NYA ratio. Folks, it’s in full grunt liquidation mode. again, this ratio is a great harbinger of understanding institutional big guy mindset. IF they are risk OFF then the ratio should be going up if they are RISK on then the ratio falls – as it is now. note the support levels shown a little lower …until this ratio finds some stability and support I just can’t be overtly bearish….
good to be back – trust all are well.
Bart
RATIO ANALYSIS of XLP/NYSE Index – ain’t bearish folks, yet (UPDATE June 3, 2018)
Posted on April 23, 2018 Leave a Comment
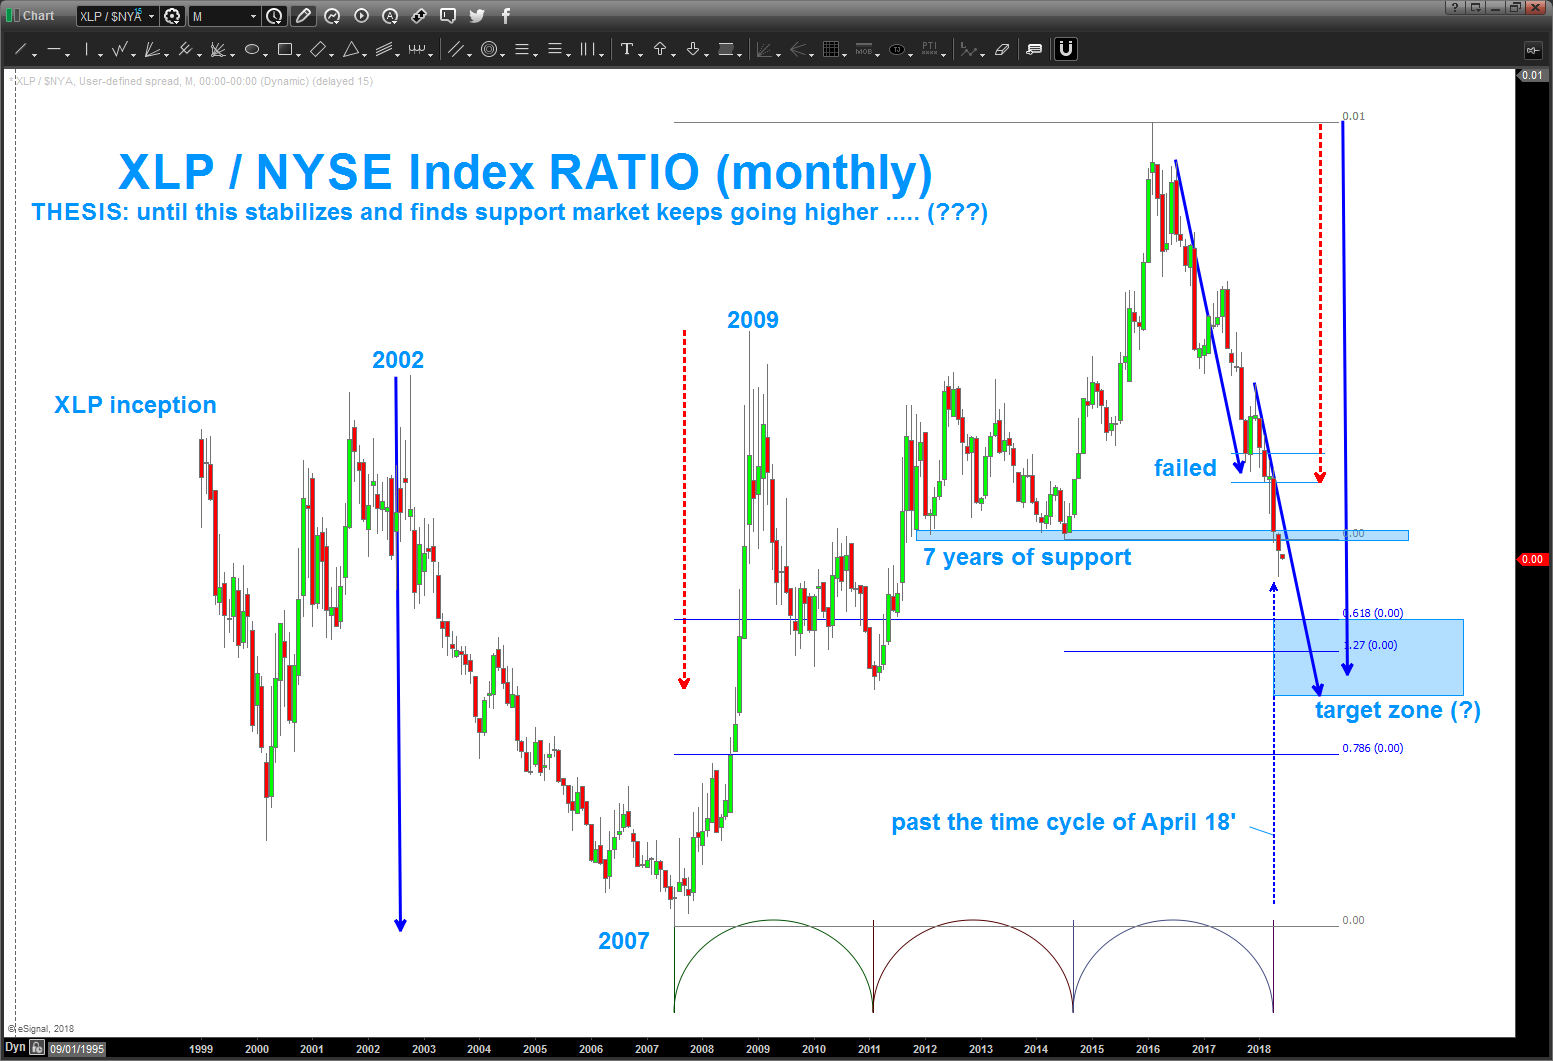
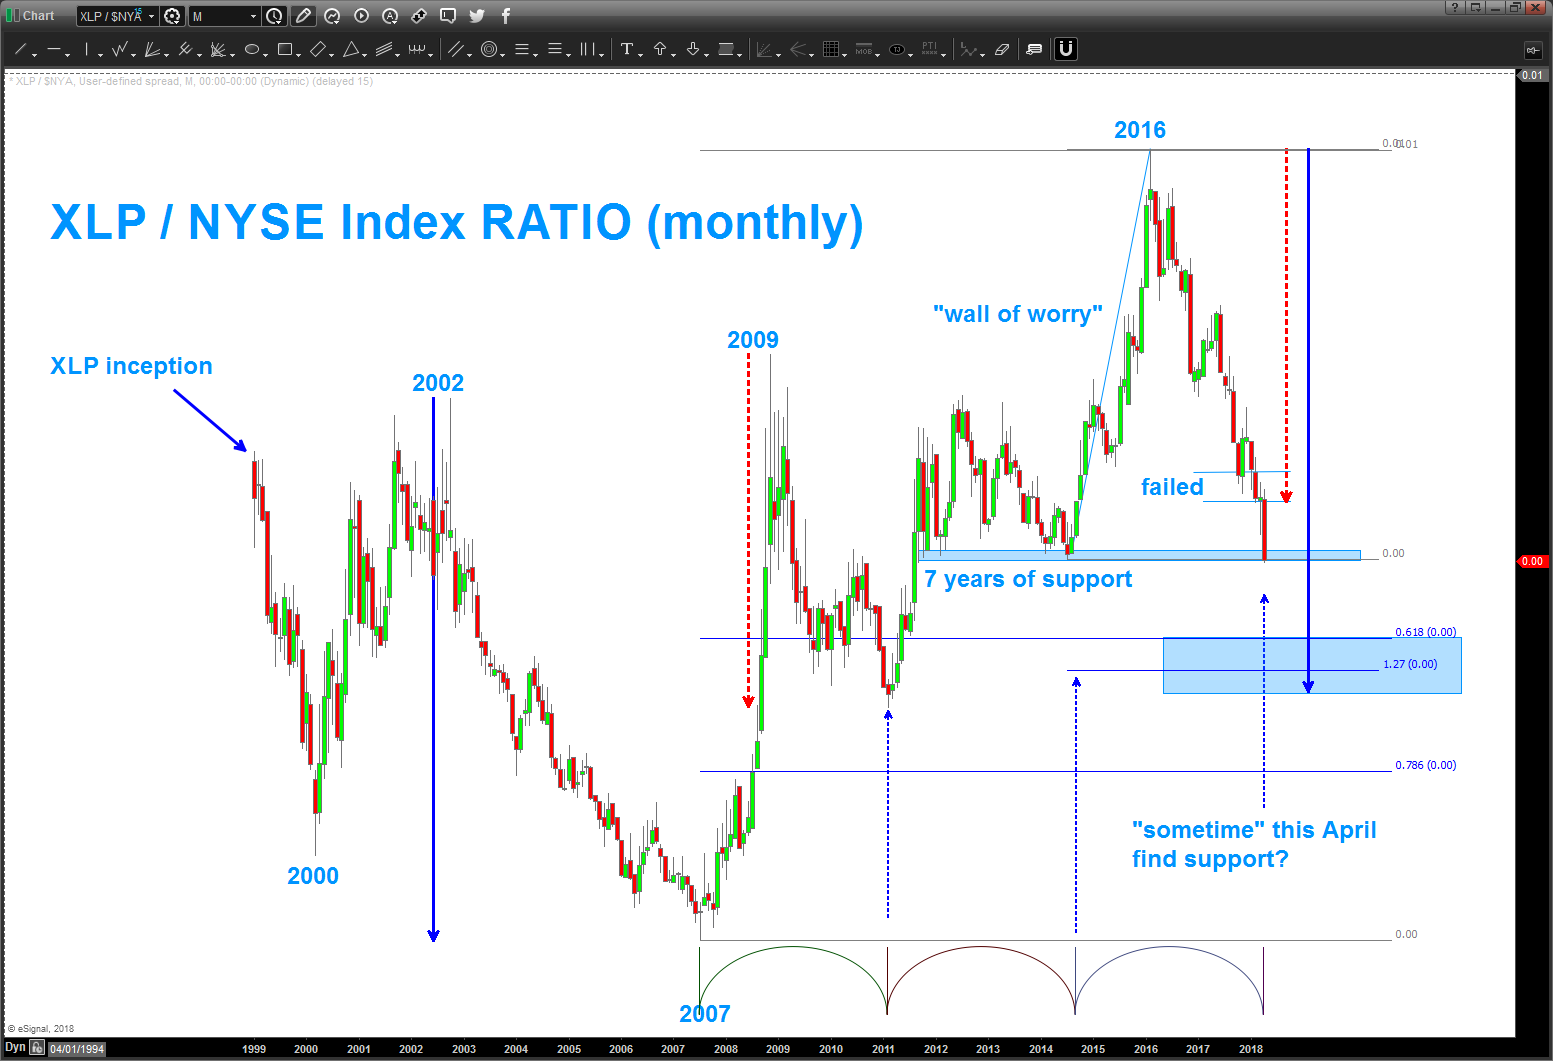
06/03/2018 – quick update to the XLP/NYA ratio. Still waiting for a BULLISH SRC to signal a ‘institutional shift’ to risk off assets in the form of staples and this ratio finding support (XLP / NYA) and starting to rise. While we did get a BULLISH MONTHLY HAMMER CANDLE in May we still have lower targets so need to keep the ‘bullish mindset’ for now. Now, that being said, I added an RSI to the picture to get a feel for where we are …
1/ we are at the lowest levels seen since the 2007 financial crisis. yes, that’s true BUT take a closer look and you’ll find the ratio kept going down for 4 more years.
let’s don’t get complacent but, per my last post w/ the XLK/XLP let’s be aware of BIG TARGETS BEING HIT across the circle of life (bonds, commodities, currencies, GLOBAL equities) to see the pivot.
Eurozone is quite the mess right now … where can they go? Well, the US stock market doesn’t seem like a bad place now does it?
I’ll keep watching, closely, but this XLP / NYA ratio certainly appears to want to seek out the lower targets so that’s not bearish, for now.
Bart
if you’ve been following me for a while, you know I enjoy using advanced pattern recognition to ratio analysis.
for a bunch of XLP/NYSE Index analysis click here: https://atomic-temporary-44460632.wpcomstaging.com//?s=xlp+%2F+%24nya also here for @seeitmarket: https://www.seeitmarket.com/market-update-consumer-staples-xlp-nyse-composite-ratio-17676/
now, this most recent multi- week stock correction was ‘expected’ based on a zone of support coming in for the ratio. (see above link to read)
that being said, we did rally and now, of late, we have really started to sell off.
this means that institutional ‘mindset’ is showing ‘risk off’ or bullish market momentum.
this ratio has picked the ‘exact’ weekly/monthly pivots since it’s inception and the tops/bottoms of 2000, 2002, 2007, 2009, etc.
I trust it … it’s falling out of the sky is telling me that, while some selling pressure might still be present, the BIG BOYS haven’t sought cover … (when the crap is hitting the fan they seek staples) so while this ratio appears to being LIQUIDATED the big boys aren’t ducking and running for cover yet.
THESIS: consolidation/correction to occur or maybe even rally BUT we are going to see the RATIO keep falling, especially if we close below and fly thru the 7 years support zone …
sorry folks, no massive sky is falling or this is it from me … until this ratio finds BIG support and takes off like a rocket I need to remain on the bullish side of the fence … for now. Just calling it like I see it. Honestly, DID NOT expect such a BIG sell off in the ratio. But, guess what, that’s what its doing …
let me know if you have any questions …
Bart
PS – note the CYCLE (basic) time rolls into sometimes this month of April. And, we are in April so stand buy …
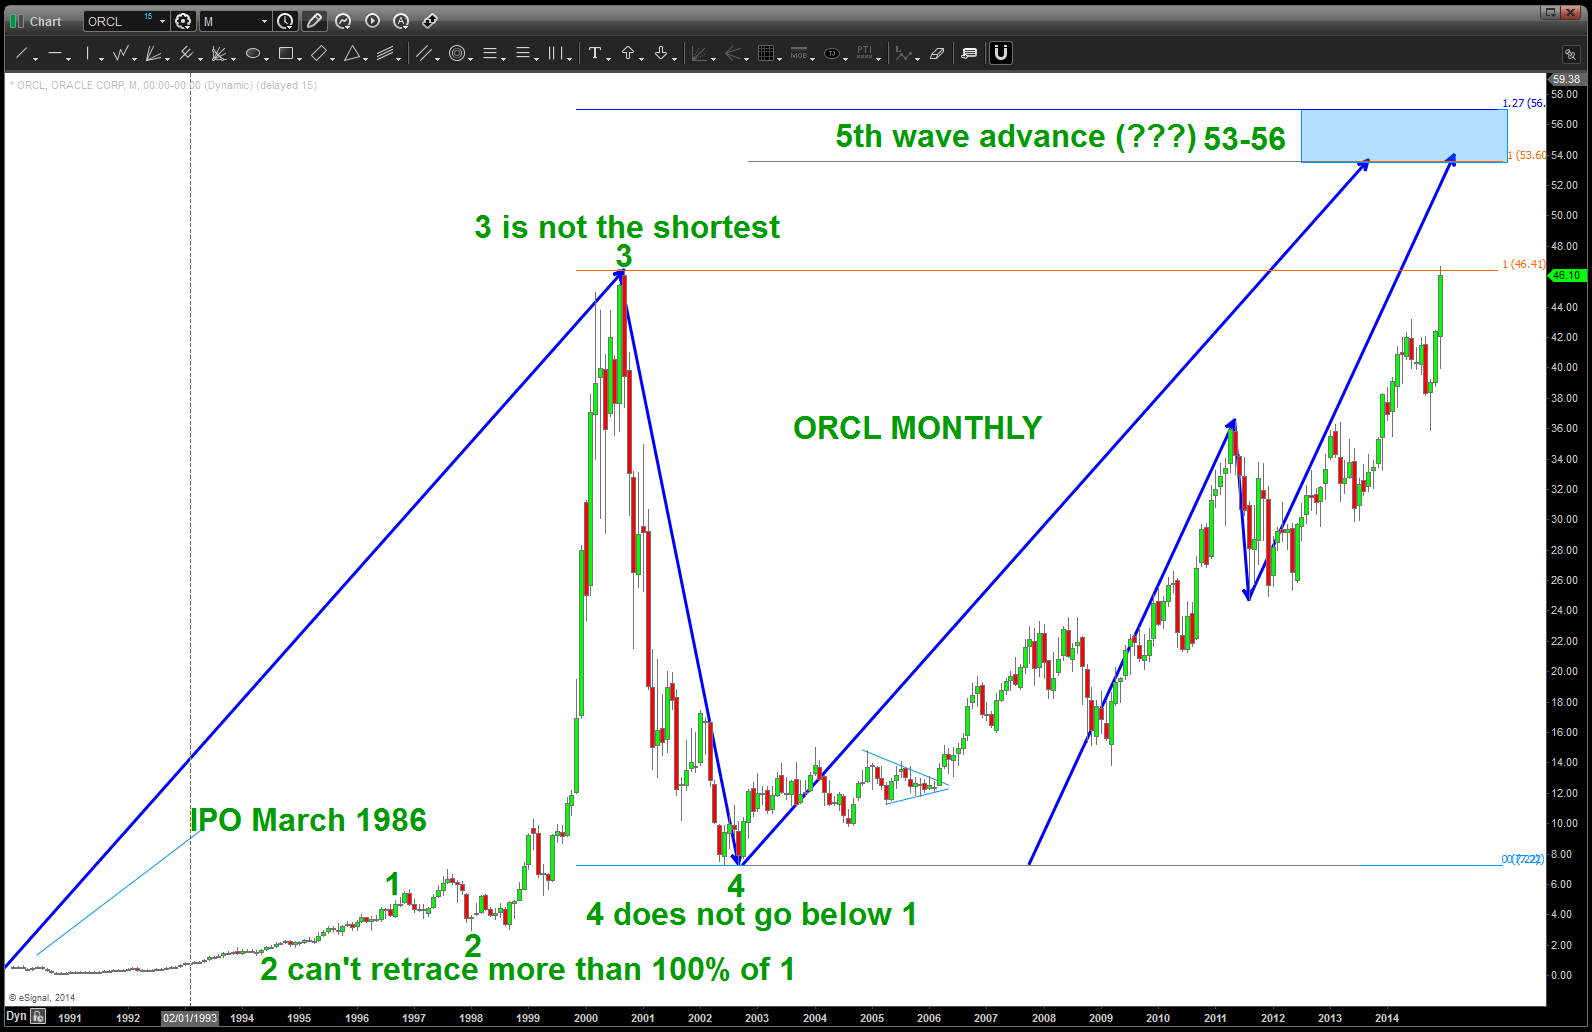
Oracle Sell Pattern in/around 53-56 updated from December 2014 updated 04/01/2018
Posted on April 1, 2018 Leave a Comment
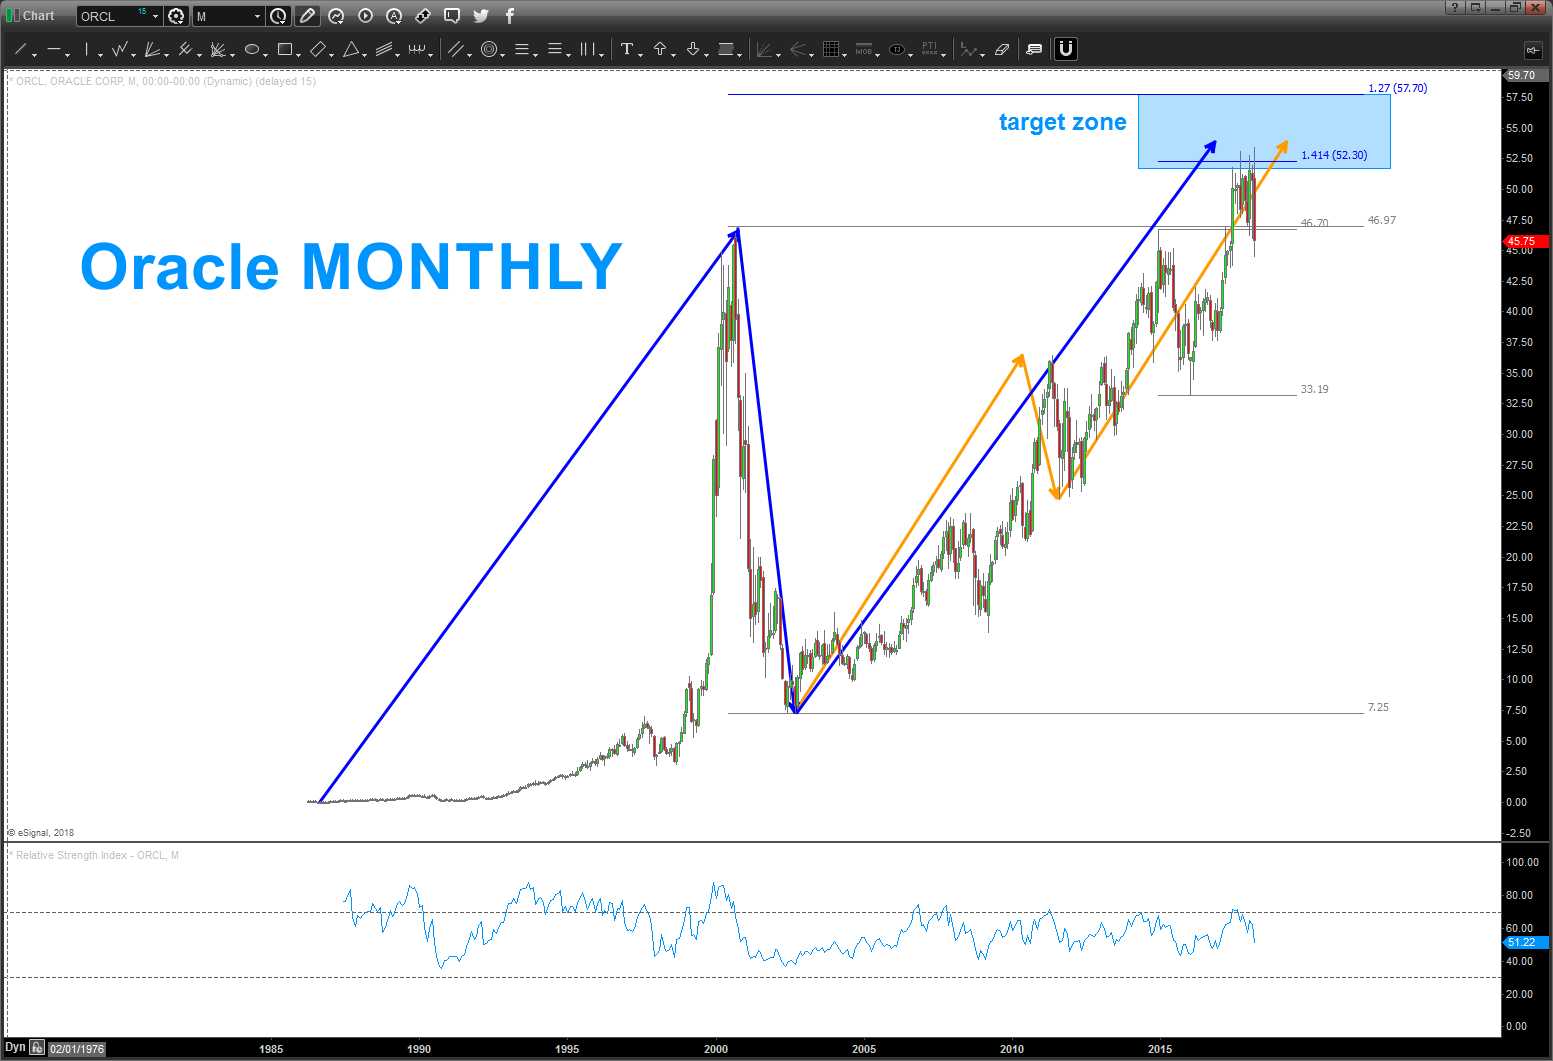
04/01/2018 – update to ORCL chart below. Looks like it wanted to go up and finish the ‘long term’ projection. we have a monthly signal reversal candle as of Thursday so this one could very well be cooked for now. Still have the upper area for targets but risk is to the downside. Now, I have no idea what fundamentally happened to cause such a sell off. What I can say is that almost 4 years ago these NUMBERS and this PATTERN were forecasted to cause a top/resistance. So far, they have.
I have NO IDEA what will happen next .. sometimes they work, sometimes they don’t. (the PATTERNS) Just manage risk and train your mind that it’s all probability.
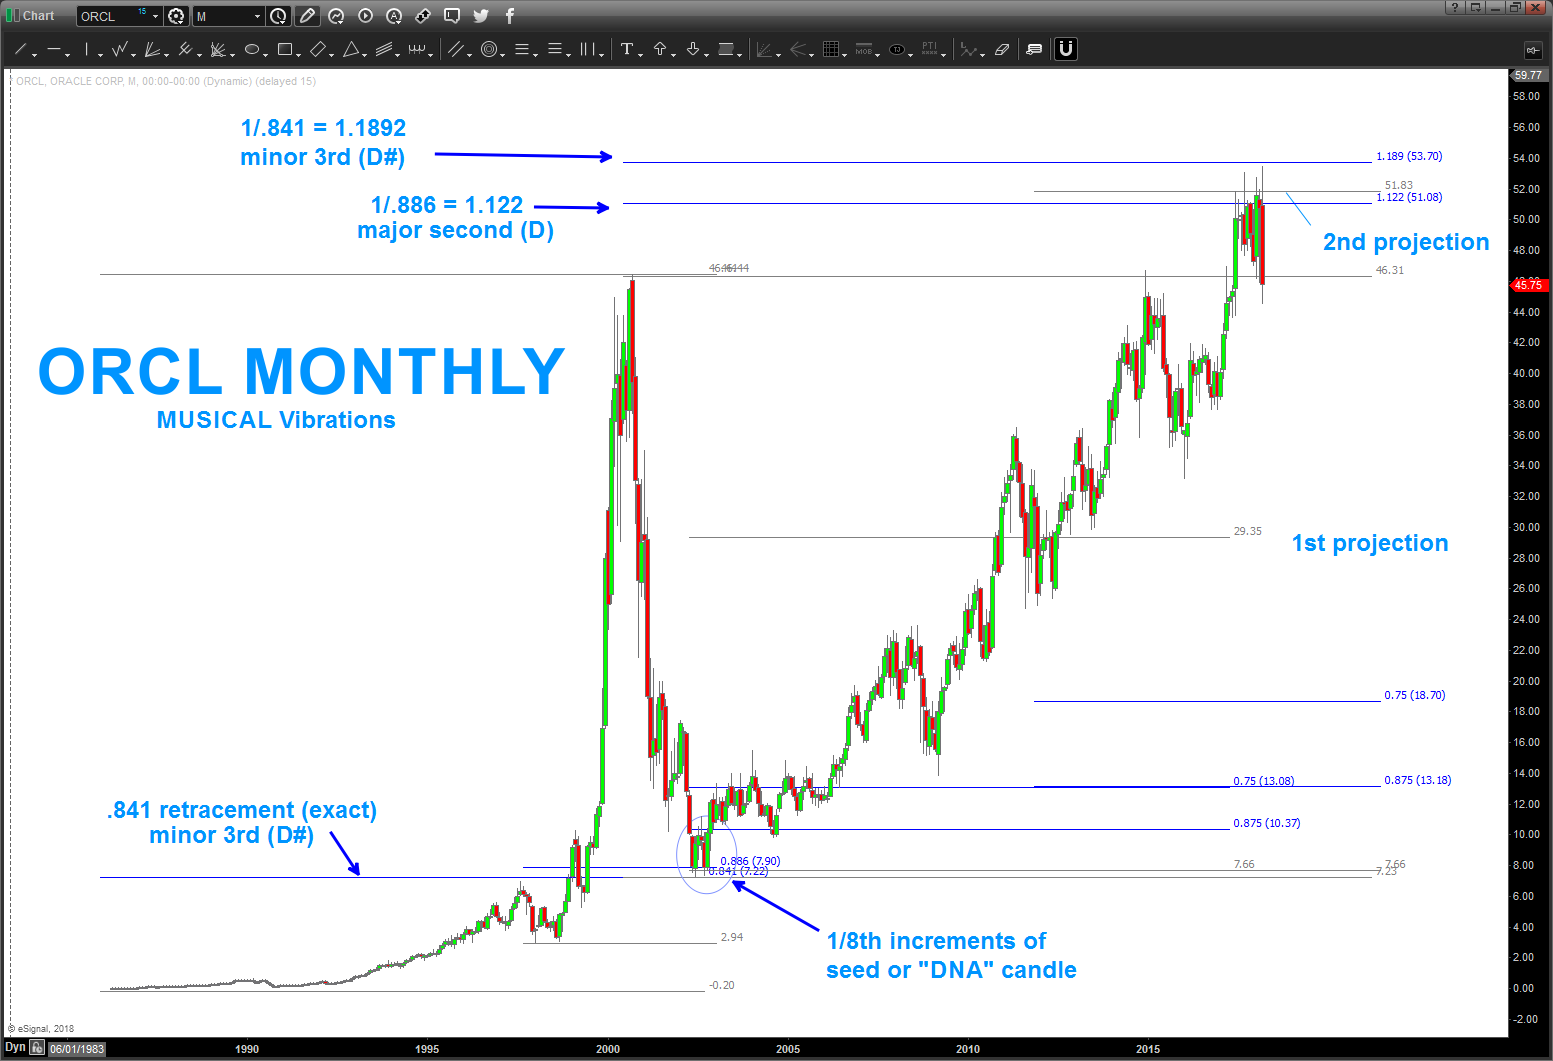
Also, the second chart is using some of the musical properties of this move. As you can see, the .886 and .841 retracement levels nailed the low in 2002. From here, we can use ‘musical math’ and denote 1/X where x= .841 and .886 respectively. Those numbers (1.1892 and 1.122) are the ratio’s of notes from the equal octave scale of music. As you can see, they were present at the completion of the ‘basic’ projections.
Lastly, an extremely powerful technique shown to me by my mentor and friend Michael Jenkins (www.stockcyclesforecast.com) shows subdividing the signal reversal or DNA of the low candles and projecting up. As you can see, the first projection didn’t work but the second one nailed the high very nicely.
Again, no idea what’s going to happen from here BUT certainly can make the case for a nice correction to come in ORCL.
Bart
______________________________________________________________________________________________________________________________________________________________
September 25, 2017 – trust me, back in December 2014 I didn’t have a clue if 53-56 would ever be hit … target area has been hit and I have no earthly idea what the fundamentals are driving this stock or not … watch the MONTHLY close on this one. If we get a MONTHLY SRC, then we could have a pretty big top in ORCL.
Bart
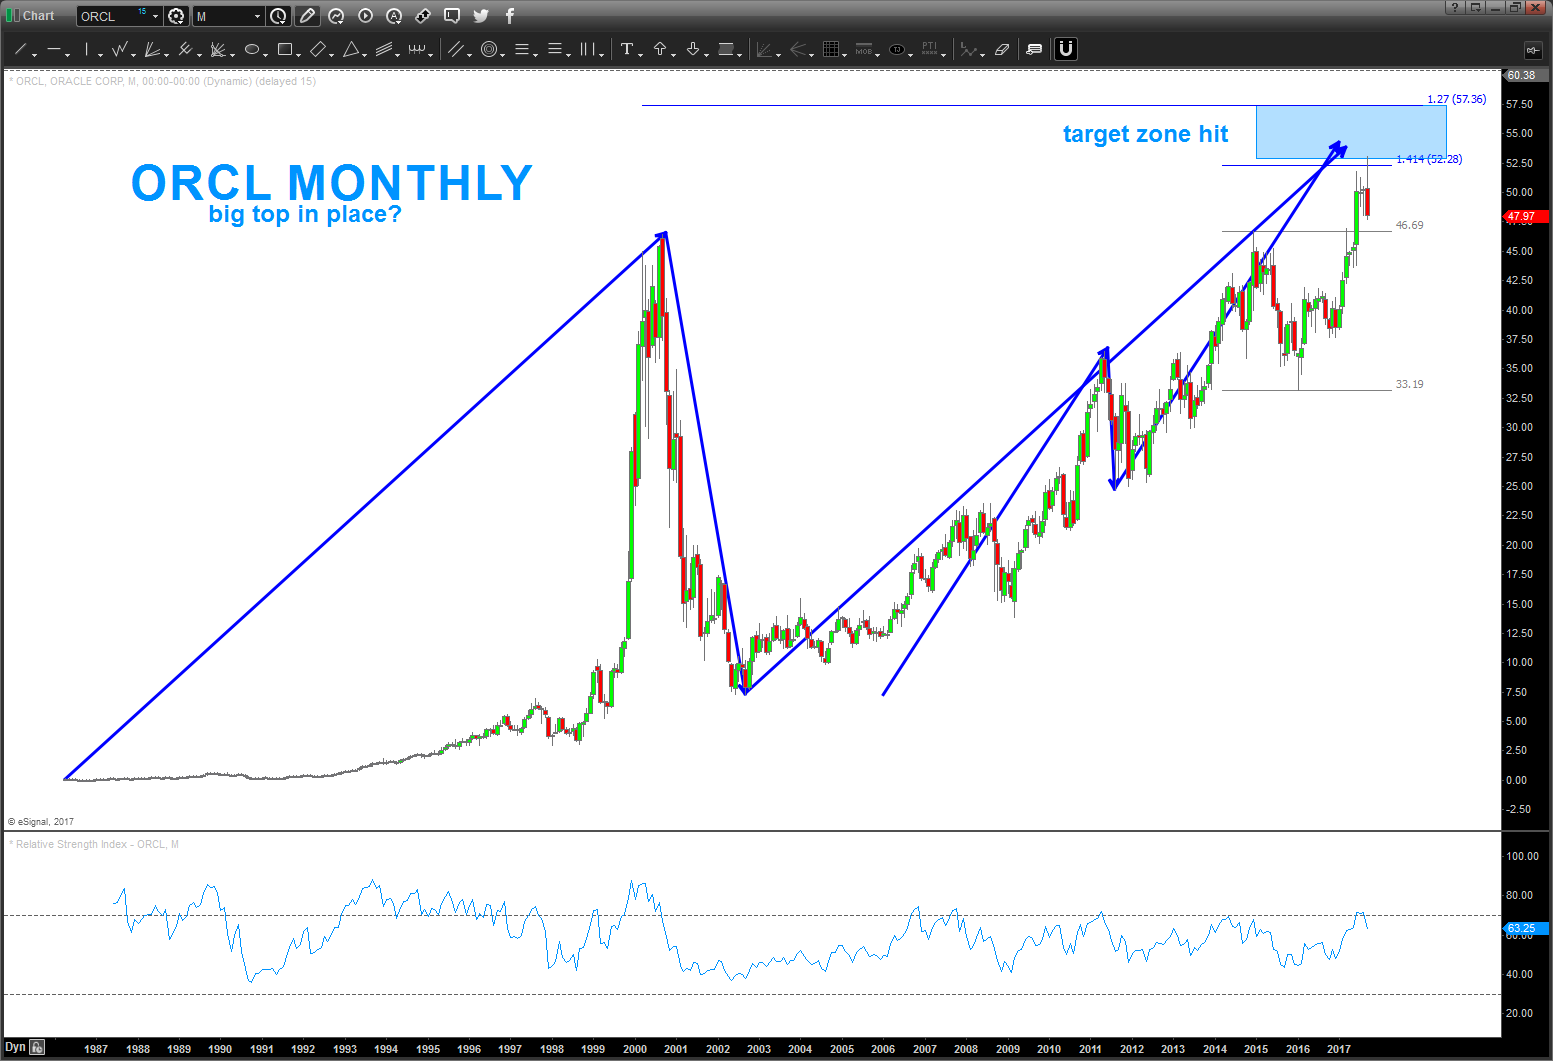
December 2014 – target appearing on ORCL.
ORCL Monthly
